Embed Size (px)
Citation preview


INSTRUCTIONS FOR NAVIGATING IN THE “COMPREHENSIVE ANNUAL FINANCIAL
REPORT” PDF Files
Bookmarks for major sections are provided in the navigation pane on the left.
Click on the bookmark to jump directly to that section.
If a “+” sign is at the left of a bookmark, click on the “+” to bring up subheadings.
All pages are linked to the Table of Contents. To jump to a specific page or
subsection from the Table of Contents, put the pointer finger on the title or page number within and click the mouse.
Click the “Table of Contents” text located in the top right hand corner of any
page or click the Table of Contents bookmark on the left.


Comprehensive Annual
Financial Report Year Ended June 30, 2012
John W. Lewis, Mayor
John Sentz, Vice Mayor Jenn Daniels, Council Member Eddie Cook, Council Member Victor Petersen, Council Member Ben Cooper, Council Member Jordan Ray, Council Member
Patrick Banger, Manager
Prepared by the Finance Department
Cindi Mattheisen, Finance Director i

ii
INTRODUCTORY SECTION Page
Letter of Transmittal vAdvisory Organization Chart xiOrganization Reporting Chart xii
FINANCIAL SECTION
Independent Auditor's Report 1
Management's Discussion and Analysis (required supplementary information) 3
Basic Financial Statements:
Government-wide Financial Statements:Statement of Net Assets 15Statement of Activities 16
Fund Financial Statements:Balance Sheet - Governmental Funds 18Reconciliation of the Balance Sheet to the Statement of Net Assets 21Statement of Revenues, Expenditures, and Changes in
Fund Balances - Governmental Funds 22Reconciliation of the Statement of Revenues, Expenditures, and
Changes in Fund Balances to the Statement of Activities 25Statement of Revenues, Expenditures, and Changes in Fund Balances -
Budget and Actual - General Fund 26Statement of Revenues, Expenditures, and Changes in Fund Balances -
Budget and Actual - Streets Special Revenue Fund 27Statement of Net Assets - Proprietary Funds 28Statement of Revenues, Expenses, and Changes in
Fund Net Assets - Proprietary Funds 30Statement of Cash Flows - Proprietary Funds 32Statement of Fiduciary Net Assets - Fiduciary Funds 34Statement of Changes in Fiduciary Net Assets - Fiduciary Funds 35
Notes to the Financial Statements 37
Combining and Individual Fund Statements and Schedules:Combining Balance Sheet - Nonmajor Governmental Funds 70Combining Statement of Revenues, Expenditures, and Changes in
Fund Balances - Nonmajor Governmental Funds 72Schedules of Revenues, Expenditures, and Changes in Fund Balances -
Budget and Actual:Grants Special Revenue Fund 76Other Special Revenue Funds 77CDBG/HOME Special Revenue Fund 78Street Light Improvement District Special Revenue Fund 79Parkway Maintenance District Special Revenue Fund 80General Debt Obligations Debt Service Fund 81Special Assessments Debt Service Fund 82Streets and Transportation Capital Projects Fund 83Traffic Control Capital Projects Fund 84
TABLE OF CONTENTS
TOWN OF GILBERT, ARIZONAComprehensive Annual Financial Report
For the Year Ended June 30, 2012

iii
Page
Municipal Facilities Capital Projects Fund 85Parks, Open Space and Recreation Capital Projects Fund 86Special Assessments Capital Projects Fund 87Redevelopment Capital Projects Fund 88
Schedules of Revenues, Expenses and Changes in Net Assets - Budget and Actual:
Water Enterprise Fund 89Wastewater Enterprise Fund 90Solid Waste Enterprise Fund 91
Combining Statement of Net Assets - Internal Service Funds 94Combining Statement of Revenues, Expenses and Changes in
Fund Net Assets - Internal Service Funds 95Combining Statement of Cash Flows - Internal Service Funds 96Schedules of Revenues, Expenses and Changes in Net Assets -
Budget and Actual:Equipment Maintenance Internal Service Fund 97Copier Services Internal Service Fund 98Employee Benefit Self-Insurance Internal Service Fund 99
Agency FundsCombining Statement of Changes in Assets and Liabilities 103 103
STATISTICAL SECTION
Financial TrendsNet Assets by Component - Last Ten Fiscal Years 107Changes in Net Assets - Last Ten Fiscal Years 108Program Revenues by Function - Last Ten Fiscal Years 110
Fund Balances of Governmental Funds - Last Ten Fiscal Years 111Changes in Fund Balances of Governmental Funds - Last Ten Fiscal Years 112
Revenue CapacityTaxable Sales by Category - Last Ten Fiscal Years 113Direct and Overlapping Sales Tax Rates - Last Ten Fiscal Years 114
Debt CapacityRatios of Outstanding Debt by Type - Last Ten Fiscal Years 115Ratios of General Bonded Debt Outstanding - Last Ten Fiscal Years 116Direct and Overlapping Governmental Activities Debt - As of June 30, 2012 117Legal Debt Margin Information - Last Ten Fiscal Years 118Pledged-Revenue Coverage - Last Ten Fiscal Years 119
Demographic and Economic InformationDemographic and Economic Statistics - Last Ten Fiscal Years 120Principal Employers - Current Fiscal Year and Nine Years Ago 121
Operating InformationFull-time Equivalent Employees by Function - Last Ten Fiscal Years 122Operating Indicators by Function - Last Ten Fiscal Years 123Capital Asset Statistics by Function - Last Ten Fiscal Years 124
Other informationProperty Value, Construction and Bank Deposits - Last Ten Fiscal Years 125System Development Fees - Fiscal Year 2012 126Property Tax Levies and Collections - Last Ten Fiscal Years 127Principal Property Taxpayers - Fiscal Year 2012 128
TOWN OF GILBERT, ARIZONAComprehensive Annual Financial Report
For the Year Ended June 30, 2012
TABLE OF CONTENTS

iv

Introductory Section ________________________________ Letter of Transmittal
Advisory Organization Chart
Organization Reporting Chart


Advisory Organization Chart
xi
CITIZENS OF GILBERT
ADVISORY BOARDS AND COMMISSIONS
Town Manager
Town Clerk
Municipal Court
Town Attorney
MAYOR AND COUNCIL
Water Resources Municipal Property Corporation
Public Facilities Municipal Property Corporation
Industrial Development Authority
Fire Public Safety Retirement Pension Board
Environmental and Energy Conservation Advisory Board
Design Review Board
Redevelopment Commission
Gilbert Educational Access Governing Board
Utilities Board of the Town of Gilbert
Parks, Recreation, and Library Services Advisory Board
Police Public Safety Retirement Pension Board
Mayor’s Youth Advisory Committee
Planning Commission
Human Relations, Culture & Art Promotion Commission
Health Insurance Trust

Organization Report Chart
xii
TOWN MANAGER
Public Works
Administration
Water
Facilities Maintenance
Technology Services
Business Development
Parks and Open Space
Recreation
Program Support
Prosecutor
Customer Service
Permit and Plan Review
Inspection and Compliance
Planning and Development
Human Resources
Fleet Maintenance
Assistant Town Manager
Assistant Town Manager
Legal
Development Services
Support Services
Police
Fire
Community Services Public Safety
Engineering Services
Finance
Tax Compliance
Budget
Accounting
Streets
Wastewater
Solid Waste
Purchasing
Utility Billing & Customer Service

Financial Section ________________________________ Independent Auditor’s Report
Management’s Discussion and Analysis
Basic Financial Statements
Government-wide Financial Statements
Fund Financial Statements
Notes to the Financial Statements
Combining and Individual Fund Statements and Schedules

INDEPENDENT AUDITORS’ REPORT
Honorable Mayor and Members of the Town Council Town of Gilbert, Arizona We have audited the accompanying financial statements of the governmental activities, the business-type activities, each major fund, and the aggregate discretely presented component unit and remaining fund information of the Town of Gilbert, Arizona (the “Town”) as of and for the year ended June 30, 2012, which collectively comprise the Town’s basic financial statements as listed in the table of contents. These financial statements are the responsibility of the Town’s management. Our responsibility is to express opinions on these financial statements based on our audit. We conducted our audit in accordance with auditing standards generally accepted in the United States of America and the standards applicable to financial audits contained in Government Auditing Standards, issued by the Comptroller General of the United States. Those standards require that we plan and perform the audit to obtain reasonable assurance about whether the financial statements are free of material misstatement. An audit includes examining, on a test basis, evidence supporting the amounts and disclosures in the financial statements. An audit also includes assessing the accounting principles used and significant estimates made by management, as well as evaluating the overall financial statement presentation. We believe that our audit provides a reasonable basis for our opinions. In our opinion, the financial statements referred to above present fairly, in all material respects, the respective financial position of the governmental activities, the business-type activities, each major fund, and the aggregate discretely presented component unit and remaining fund information of the Town of Gilbert, Arizona, as of June 30, 2012, and the respective changes in financial position and cash flows, where applicable, thereof and the respective budgetary comparisons for the General Fund and the Streets Special Revenue Fund for the year then ended in conformity with accounting principles generally accepted in the United States of America. In accordance with Government Auditing Standards, we have also issued our report dated December 11, 2012, on our consideration of the Town’s internal control over financial reporting and on our tests of its compliance with certain provisions of laws, regulations, contracts, and grant agreements and other matters. The purpose of that report is to describe the scope of our testing of internal control over financial reporting and compliance and the results of that testing, and not to provide an opinion on the internal control over financial reporting or on compliance. That report is an integral part of an audit performed in accordance with Government Auditing Standards and should be considered in assessing the results of our audit.
TUCSON • PHOENIX • FLAGSTAFF • ALBUQUERQUEwww.heinfeldmeech.com
10120 N. Oracle RoadTucson, Arizona 85704
Tel (520) 742-2611Fax (520) 742-2718

2
Accounting principles generally accepted in the United States of America require that the management’s discussion and analysis on pages 3 through 13 be presented to supplement the basic financial statements. Such information, although not a part of the basic financial statements, is required by the Governmental Accounting Standards Board, who considers it to be an essential part of financial reporting for placing the basic financial statements in an appropriate operational, economic, or historical context. We have applied certain limited procedures to the required supplementary information in accordance with auditing standards generally accepted in the United States of America, which consisted of inquiries of management about the methods of preparing the information and comparing the information for consistency with management’s responses to our inquiries, the basic financial statements, and other knowledge we obtained during our audit of the basic financial statements. We do not express an opinion or provide any assurance on the information because the limited procedures do not provide us with sufficient evidence to express an opinion or provide any assurance. Our audit was conducted for the purpose of forming opinions on the financial statements that collectively comprise the Town’s financial statements as a whole. The accompanying supplementary information such as the Introductory Section, Combining and Individual Fund Statements and Schedules, and Statistical Section are presented for purposes of additional analysis and are not a required part of the financial statements. The Combining and Individual Fund Statements and Schedules, as listed in the table of contents, are the responsibility of management and were derived from and relate directly to the underlying accounting and other records used to prepare the financial statements. The information has been subjected to the auditing procedures applied in the audit of the financial statements and certain additional procedures, including comparing and reconciling such information directly to the underlying accounting and other records used to prepare the financial statements or to the financial statements themselves, and other additional procedures in accordance with auditing standards generally accepted in the United States of America. In our opinion, the information is fairly stated in all material respects in relation to the financial statements as a whole. The Introductory Section and Statistical Section have not been subjected to the auditing procedures applied in the audit of the basic financial statements and, accordingly, we do not express an opinion or provide any assurance on them. HEINFELD, MEECH & CO., P.C. CPAs and Business Consultants December 11, 2012

3
MANAGEMENT’S DISCUSSION AND ANALYSIS As management of the Town of Gilbert (Gilbert), we offer this narrative overview and analysis of Gilbert’s financial activities for the fiscal year ended June 30, 2012. We encourage readers to consider the information presented here in conjunction with information provided in the transmittal letter. Financial Highlights • Gilbert’s assets exceeded its liabilities at the end of the fiscal year by $1.5 billion. Included in this
amount defined as net assets is $319 million of unrestricted net assets, of which $144 million is invested in joint ventures with the Cities of Mesa and Chandler and the Town of Queen Creek, and $175 million which may be used to fund ongoing operations in future years.
• Net assets includes a $696 million net investment in capital assets such as streets, park land, and municipal buildings and a $316 million net investment in water, wastewater and solid waste infrastructure and equipment.
• The combined fund balance for all governmental funds is $182 million, of which $58 million is unrestricted.
• The General Fund unrestricted fund balance is $55 million, of which $10.8 million has been assigned for capital replacement.
• The remaining General Fund unassigned balance of $44 million is approximately 45% of the total fund expenditures.
• Gilbert’s total bonded debt outstanding at the end of the fiscal year was $485 million, as compared to $544 million at the end of fiscal year 2011.
Overview of the Financial Statements This discussion and analysis are intended to serve as an introduction to Gilbert’s basic financial statements which are comprised of three components: 1) government-wide financial statements, 2) fund financial statements, and 3) notes to the financial statements. This report also contains other supplementary information in addition to the basic financial statements. Government-wide financial statements The government-wide financial statements are designed to provide readers with a broad overview of the finances of Gilbert as a whole, in a manner similar to a private-sector business. The statement of net assets presents information on all of Gilbert’s assets and liabilities, with the difference between the two reported as net assets. Over time, increases or decreases in net assets may serve as a useful indicator of whether Gilbert’s financial position is improving or declining. The statement of activities presents the changes in net assets from the previous year. All changes in net assets are reported as soon as the underlying event giving rise to the change occurs, regardless of the timing of related cash flows. Thus, revenues and expenses are reported in this statement for some items that will only result in cash flows in future fiscal periods (e.g., earned but unused vacation leave). Both of the government-wide financial statements distinguish functions of Gilbert that are principally supported by taxes and intergovernmental revenues (governmental activities) from other functions that are intended to recover a majority or all of their costs through user fees and charges (business-type activities). The governmental activities of Gilbert include general government, public safety, highways and streets, culture and recreation, redevelopment and transportation. The business-type activities include water, wastewater, solid waste, and irrigation operations. The government-wide financial statements also include the Industrial Development Authority as a component unit of Gilbert. The Authority provides financing for eligible private sector entities to acquire and construct facilities deemed to be in the public interest. The financial information for the Authority is presented separately in the statements.

4
The government-wide financial statements can be found on pages 15-17 of this report. Fund financial statements A fund is a grouping of related accounts used to maintain control over resources segregated for specific activities or objectives. Gilbert, like other state and local governments, uses fund accounting to ensure and demonstrate compliance with finance-related legal requirements. All of Gilbert’s funds can be divided into three categories: governmental funds, proprietary funds, and fiduciary funds. Governmental Funds Governmental funds account for essentially the same functions reported as governmental activities in the government-wide financial statements. Unlike the government-wide financial statements, however, governmental fund financial statements focus on near-term inflows and outflows of spendable resources, as well as balances of spendable resources available at fiscal year end. This information may be useful in evaluating a government’s near-term financing ability. Because the focus of governmental funds is narrower than that of the government-wide financial statements, it is useful to compare the information presented for governmental funds with similar information presented for governmental activities in the government-wide financial statements. By doing so, readers may better understand the long-term impact of Gilbert’s near-term financing decisions. To facilitate this comparison, reconciliations are provided with the fund financial statements. The basic governmental fund financial statements can be found on pages 18-27. Proprietary Funds Gilbert maintains two different types of proprietary funds. Enterprise Funds report the same functions presented as business-type activities in the government-wide financial statements, which include water, wastewater, and solid waste. Internal Service Funds accumulate and allocate costs internally among the various functions. Gilbert uses internal service funds to account for maintenance of its fleet of vehicles, copy service operations, and employee health and dental self-insurance. The assets and liabilities of the internal service funds are included in the governmental activities column of the government-wide statement of net assets. Costs of internal service funds are allocated to the various user functions on the government-wide statement of activities. Enterprise funds provide the same information as the government-wide financial statements, only with more detail. Internal service funds are combined into a single column on the proprietary funds statements. Additional detail for the internal service funds can be found on pages 93-99.
The proprietary fund statements can be found on pages 28-33. Fiduciary Funds Fiduciary funds account for resources held for the benefit of parties outside the government. These funds are not included in the government-wide statements as these funds are not available to support Gilbert’s operations. The fiduciary fund statements can be found on pages 34-35. Notes to the financial statements The notes to the financial statements provide additional information that is essential to a full understanding of the data provided in the government-wide and fund financial statements and should be read with the financial statements. The notes to the financial statements can be found on pages 37-67.

5
Government-wide Financial Analysis Net assets serve as a useful indicator of a government’s financial position. The following table reflects the condensed Statement of Net Assets as of June 30, 2012 and 2011.
Town of GilbertCondensed Statement of Net Assets
Governmental Activities Business-type Activities Total2012 2011 2012 2011 2012 2011
Current and other assets 238,239,389$ 252,415,829$ 322,483,617$ 303,763,671$ 560,723,006$ 556,179,500$ Capital assets 971,493,653 982,750,500 448,330,984 451,437,195 1,419,824,637 1,434,187,695 Total assets 1,209,733,042 1,235,166,329 770,814,601 755,200,866 1,980,547,643 1,990,367,195
Long-term liabilities 341,629,298 364,026,397 135,318,490 162,643,002 476,947,788 526,669,399 Other liabilities 36,628,891 49,466,153 11,754,773 11,857,295 48,383,664 61,323,448 Total liabilities 378,258,189 413,492,550 147,073,263 174,500,297 525,331,452 587,992,847
Net assets:Invested in capital assets, net of related debt 695,984,256 705,986,213 316,268,041 294,516,202 1,012,252,297 1,000,502,415 Restricted 52,217,239 38,404,141 71,375,688 76,504,052 123,592,927 114,908,193 Unrestricted 83,273,358 77,283,425 236,097,609 209,680,315 319,370,967 286,963,740 Total net assets 831,474,853$ 821,673,779$ 623,741,338$ 580,700,569$ 1,455,216,191$ 1,402,374,348$
Net assets consist of three components. The largest portion of Gilbert’s net assets (70%) is its investment in capital assets (land, buildings, equipment, infrastructure, etc.), less depreciation and any related debt used to acquire those assets that is still outstanding. Gilbert uses these capital assets to provide services to citizens; consequently, these assets are not available for appropriation. Although Gilbert’s investment in its capital assets is reported net of related debt, it should be noted that the resources needed to repay this debt are provided from other sources, since the capital assets themselves cannot be used to liquidate these liabilities. An additional portion of Gilbert’s net assets (8%) represents resources that are subject to external restrictions on how they may be used. The remaining $319 million of unrestricted net assets (22%) includes $144 million which is invested in joint ventures with the Cities of Mesa and Chandler and the Town of Queen Creek and $175 million which may be used to meet the government’s ongoing obligations to citizens, customers, and creditors. Governmental Activities Governmental activities in fiscal year 2012 increased Gilbert’s net assets by $10 million, accounting for 18.5% of the total growth in net assets. Taxes and program revenues (charges for services and grants and contributions that are clearly identifiable to operating functions) were Gilbert’s most significant revenue sources comprising 95.5% of total revenues for governmental activities. Taxes (local and state-shared) were $114 million, an increase of $4 million (3.5%) from the prior year. Program revenues were $64 million, an increase of $2 million from the prior year which was due to the increase in charges for services. It should be noted that $2 million of the total program revenues represent capital contributions from developers of street related infrastructure; and, therefore, were not cash revenues available to cover operating expenses. The other component of the change in net assets is expenses. The largest expense functions were public safety which represented 37%, and highways and streets which represented 25% of total governmental activities expenses. Total expenses increased $4.8 million (3%) over the prior fiscal year. A portion of this increase was due to a $1.7 million increase in depreciation for the highways and streets function.

6
The following table details the changes in net assets for governmental and business-type activities.
Changes in Net AssetsGovernmental Business-type
Activities Activities Total2012 2011 2012 2011 2012 2011
Revenues Program revenues: Charges for services 17,013,296$ 12,537,148$ 77,355,779$ 74,837,971$ 94,369,075$ 87,375,119$ Operating grants and contributions 21,044,646 21,167,633 - - 21,044,646 21,167,633 Capital grants and contributions 26,060,002 28,002,037 37,221,712 18,324,573 63,281,714 46,326,610 General revenues: Sales taxes 54,513,265 49,248,759 - - 54,513,265 49,248,759 Property taxes 21,502,322 25,796,000 - - 21,502,322 25,796,000 State-shared sales taxes 16,288,580 13,787,266 - - 16,288,580 13,787,266 State-shared income taxes 17,593,587 17,280,849 - - 17,593,587 17,280,849 Other taxes 3,793,777 3,752,492 - - 3,793,777 3,752,492 Grants and contributions not restricted to specific programs 1,349,124 863,570 - - 1,349,124 863,570 Unrestricted investment earnings 1,909,629 2,137,352 1,244,149 1,011,691 3,153,778 3,149,043 Other 4,922,205 355,415 1,803,403 2,380,172 6,725,608 2,735,587 Total revenues 185,990,433 174,928,521 117,625,043 96,554,407 303,615,476 271,482,928 Expenses Management and policy 2,982,636 3,109,759 - - 2,982,636 3,109,759 Support services 8,632,288 8,503,492 - - 8,632,288 8,503,492 Financial services 1,216,418 1,286,659 - - 1,216,418 1,286,659 Legal and court 5,409,709 5,126,039 - - 5,409,709 5,126,039 Development services 8,551,083 8,201,314 - - 8,551,083 8,201,314 Police 40,466,828 38,868,835 - - 40,466,828 38,868,835 Fire 24,906,506 24,473,377 - - 24,906,506 24,473,377 Highways and streets 43,437,623 40,440,136 - - 43,437,623 40,440,136 Community services 19,931,592 19,763,971 - - 19,931,592 19,763,971 Transportation 1,268,998 1,009,897 - - 1,268,998 1,009,897 Non departmental 2,910,114 2,194,132 - - 2,910,114 2,194,132 Interest and fiscal charges on long-term debt 15,785,320 17,674,873 - - 15,785,320 17,674,873 Water - - 37,694,869 36,863,531 37,694,869 36,863,531 Wastewater - - 22,661,900 23,038,634 22,661,900 23,038,634 Solid waste - - 14,917,749 14,254,817 14,917,749 14,254,817 Total expenses 175,499,115 170,652,484 75,274,518 74,156,982 250,773,633 244,809,466 Increase in net assets before transfers 10,491,318 4,276,037 42,350,525 22,397,425 52,841,843 26,673,462 Transfers (690,244) 537,225 690,244 (537,225) - -
Increase in net assets 9,801,074 4,813,262 43,040,769 21,860,200 52,841,843 26,673,462
Net assets, beginning of year 821,673,779 816,860,517 580,700,569 558,840,369 1,402,374,348 1,375,700,886
Net assets, end of year 831,474,853$ 821,673,779$ 623,741,338$ 580,700,569$ 1,455,216,191$ 1,402,374,348$
7
Business-type Activities Development related growth increased Gilbert’s net assets for business-type activities in fiscal year 2012 by $43 million including $33 million in system development fee collections and $4.5 million in water and wastewater infrastructure contributed by developers. The revenues for business-type activities increased $21 million from the prior year mainly due to the increase in capital contributions of $19 million. Expenses increased $1 million (1.5%) from the prior year. Financial Analysis of Gilbert’s Funds As noted earlier, Gilbert maintains fund accounting to demonstrate compliance with budgetary and legal requirements. The following is a brief discussion of financial highlights from the fund financial statements. Governmental Funds The focus of the governmental funds is to provide information on near-term inflows, outflows, and balances of resources available for spending. Such information is useful in assessing Gilbert’s financing requirements. In particular, unrestricted fund balance may serve as a useful measure of a government’s net resources available for spending at the end of the fiscal year. Gilbert operated and separately reported the following major governmental funds:
• General Fund • Streets Special Revenue Fund • General Debt Service Fund • Special Assessments Debt Service Fund • Streets and Transportation Capital Projects Fund • Municipal Facilities Capital Projects Fund • Parks, Open Space and Recreation Capital Projects Fund
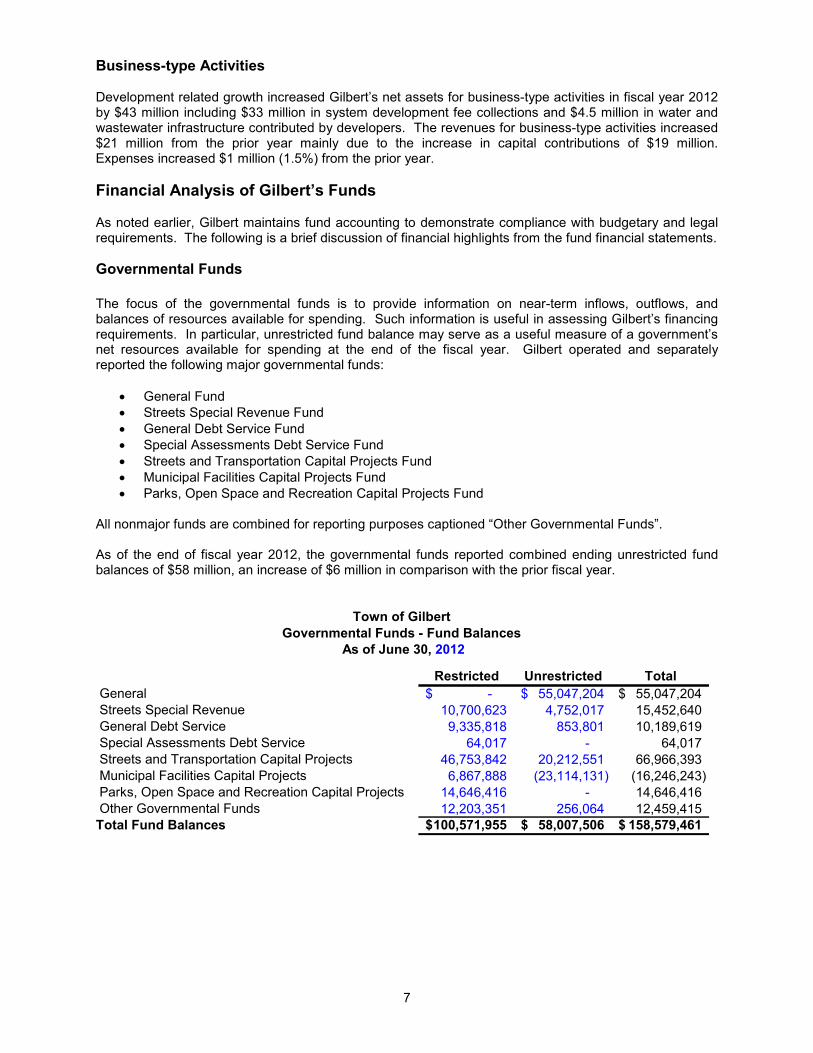
All nonmajor funds are combined for reporting purposes captioned “Other Governmental Funds”. As of the end of fiscal year 2012, the governmental funds reported combined ending unrestricted fund balances of $58 million, an increase of $6 million in comparison with the prior fiscal year.
Town of GilbertGovernmental Funds - Fund Balances
As of June 30, 2012
Restricted Unrestricted Total General -$ 55,047,204$ 55,047,204$ Streets Special Revenue 10,700,623 4,752,017 15,452,640 General Debt Service 9,335,818 853,801 10,189,619 Special Assessments Debt Service 64,017 - 64,017 Streets and Transportation Capital Projects 46,753,842 20,212,551 66,966,393 Municipal Facilities Capital Projects 6,867,888 (23,114,131) (16,246,243) Parks, Open Space and Recreation Capital Projects 14,646,416 - 14,646,416 Other Governmental Funds 12,203,351 256,064 12,459,415 Total Fund Balances 100,571,955$ 58,007,506$ 158,579,461$

8
General Fund The General Fund is the primary operating fund. At the end of fiscal year 2012, the fund balance of the General Fund was $78.3 million, an increase of $11.7 million from the prior year mainly due to the increase in local sales tax and intergovernmental revenue. The unrestricted portion of the fund balance was $55 million, of which $10.8 million has been assigned for capital replacement. As a measure of the General Fund’s liquidity, it may be useful to compare its available fund balance to total fund expenditures. The General Fund’s unassigned fund balance represents 45% of total General Fund expenditures for the current year. Key elements of General Fund sources and uses are as follows:
• Overall, revenues exceeded expenditures in the General Fund by $12.9 million; however, transfers to other funds (net) were $1.2 million resulting in an increase in fund balance of $11.7 million. The transfers out included $5.7 million for general debt obligations.
• Local sales tax and intergovernmental revenues are the largest revenue sources for the General Fund accounting for 83% of the total revenues.
• Local sales tax, which accounts for almost half of total General Fund revenues, increased $5.2 million (10.5%) from the prior fiscal year due to the economic recovery.
• Intergovernmental revenue increased $2.6 million (8%) from the prior fiscal year mainly due to increased state shared income tax revenue.
• Public safety expenditures which comprise over half of the total General Fund expenditures increased $2.4 million (4.5%) over the prior fiscal year mainly due to filling vacant positions.
• Development services, financial services and community services expenditures all slightly increased in total by $1.2 million over the prior fiscal year mostly due to an increase in personnel costs.
Sales Tax47%
Franchise Fees2%
Licenses and Permits4%
Intergovernmental32%
Charges for Services6%
Transfers In4%
All Other5%
General Fund Sources$115.1 Million
Police33%
Legal and Court4%
Development Services
6%FinancialServices
2%
Management and Policy
4%
Fire21%
Support Services9%
Community Services11%
All Other10%
General Fund Uses$103.4 Million

9
Streets Special Revenue Fund The Streets Fund revenues include state shared revenues which are highway user revenues, vehicle license taxes and lottery funds. The gasoline taxes and lottery funds are required by state statute to be used for transportation purposes. The vehicle license tax has been designated by Council to fund the preventive maintenance activities of the Streets Fund. Total revenues decreased $430 thousand (2%) from the prior year. This was primarily due to decreased county intergovernmental revenue of $1.6 million and was offset by increased auto lieu taxes revenue of $834 thousand. Total expenditures increased by $299 thousand (3%) due to increased capital outlay expenditures. In total, revenues exceeded expenditures by $6.5 million; however, there were $3.6 million in transfers to other funds including $3 million to the Debt Service Fund, resulting in a $3 million (23%) increase in fund balance. Other Major Governmental Funds General Debt Service. The fund balance increased by $3.3 million during the year due. This was
primarily due to the current year property tax revenues of $21.6 million and transfers in from other funds of $19.7 million offset by the debt service requirements of $38.5 million. The remaining fund balance of $10.2 million will be used to fund future debt service payments on voter approved general obligation bonds.
Special Assessments Debt Service. The fund balance of $64 thousand is all restricted to pay
future debt service requirements on special assessment bonds.
Streets and Transportation Capital Projects. The fund balance decreased by $20.7 million to $67 million. Current year expenditures exceeded revenues by $20.9 million but this deficit was covered by existing fund balance.
Municipal Facilities Capital Projects. The fund balance decreased by $2.3 million during the year from a deficit of $13.8 million to a deficit of $16.2 million. The deficit will be covered by future collections of system development fees.
Parks, Open Space and Recreation Capital Projects. The fund balance increased by $6.4 million to $14.6 million. Current year revenues of $12.6 million exceeded expenditures of $378 thousand; however, there were $5.9 million in transfers to other funds which included $5.3 million to the General Debt Service Fund.
Nonmajor Governmental Funds All nonmajor governmental funds are combined into one column on the governmental fund statements. The combined fund balance of these funds decreased $1.4 million (10%) to a balance at year end of $12.5 million. Nonmajor funds represent 6.9% of the total governmental fund balance. Proprietary Funds Gilbert’s proprietary funds statements are prepared on the same basis (accrual) as the government-wide financial statements. Gilbert operates and separately reports the following proprietary funds:
• Water Fund • Wastewater Fund • Solid Waste Fund

10
Water Fund The Water Fund is responsible for producing and distributing potable water that meets all county, state and federal drinking water standards. The water system is sized and pressured to provide adequate fire suppression to the entire Town and operates two surface water treatment facilities capable of producing 57 million gallons per day (mgd) and 19 ground water wells capable of producing 43.5 mgd. Net assets increased by $22.3 million to $329.7 million due primarily to capital contributions of $20.2 million, including $17.5 million in system development fees and $2.7 million in distribution lines contributed by developers. Operating income was $7.7 million. Wastewater Fund The Wastewater Fund provides collection, treatment, and recharge services to residents and businesses in Gilbert. The services also include the storage and distribution of effluent (treated wastewater). Net assets increased $17.7 million to $267.7 million due primarily to capital contributions of $17 million, including $15.2 million in system development fees and $1.8 million in collection lines contributed by developers. Operating income was $1 million. Solid Waste Fund Gilbert operates the Solid Waste Fund to provide residential and commercial refuse collection and residential recycling services. Residential services are provided exclusively by Gilbert, while the commercial service competes with the private sector for customers. Net assets increased by $3.4 million to $25.5 million primarily from operating income. The following graph compares the fiscal year revenues to expenses for the Water, Wastewater and Solid Waste Funds.
$-$10 $20 $30 $40 $50
Water Wastewater Solid Waste
Proprietary FundsOperating
Revenues and Expenses
Revenues
Expenses
General Fund Budgetary Highlights Differences between the original adopted budget and the final amended budget were less than 1% reflecting an increase of $516 thousand. The final amended budget projected that expenditures would exceed revenues by $2 million and included $5.2 million in net transfers to other funds resulting in a $7.1 million reduction to fund balance per the budget. During the year actual revenues exceeded the budgeted amount by $11.1 million (11%) mainly due to higher than expected local sales taxes. Actual expenditures were less than budgeted by $3.7 million (4%) mainly due to lower than expected public safety and capital outlay expenditures. This resulted in an excess of revenues over expenditures of $14.9 million more than budgeted, resulting in the actual net change in fund balance being $18.8 million more than budgeted.
Mill
ions

11
Capital Asset and Debt Administration Capital Assets. As of June 30, 2012, Gilbert had invested $1.4 billion in capital assets. Major capital assets completed during the fiscal year included the following: Governmental Activities
• Streets and traffic signal projects totaling $38 million. • New fire station totaling $4 million. • Developer contributions of street related infrastructure valued at $2 million.
Business-type Activities
• Developer contributions of water and wastewater infrastructure valued at $4.5 million. • Completed water system improvements totaling $8.8 million and wastewater system
improvements totaling $376 thousand. The following table presents capital assets balances, net of accumulated depreciation, for the fiscal years ended June 30, 2012 and 2011.
Town of GilbertCapital Assets (net of depreciation)
Governmental Business-typeActivities Activities Total
2012 2011 2012 2011 2012 2011
Land 173,438,077$ 171,914,361$ 50,703,249$ 45,923,688$ 224,141,326$ 217,838,049$ Construction-in-progress 18,101,080 31,286,075 3,044,140 3,513,610 21,145,220 34,799,685 Buildings 157,411,702 161,991,163 - - 157,411,702 161,991,163 Improvements 40,639,819 42,864,775 - - 40,639,819 42,864,775 Plant, Machinery & Equip 15,607,655 18,761,468 84,114,653 89,882,320 99,722,308 108,643,788 Water Rights - - 7,552,162 7,650,454 7,552,162 7,650,454 Infrastructure 566,295,320 555,932,658 302,916,780 304,467,122 869,212,100 860,399,780
Total Capital Assets 971,493,653$ 982,750,500$ 448,330,984$ 451,437,194$ 1,419,824,637$ 1,434,187,694$
Total governmental capital assets decreased $11 million and business-type capital assets decreased $3 million. The majority of the decrease can be attributable to increased depreciation as assets get older, less capital projects being started and the removal of obsolete or auctioned machinery and equipment assets. See Note 6 on pages 50-52 for further information regarding capital assets. Long-term Debt. At June 30, 2012, Gilbert had total bonded debt obligations of $320 million related to governmental activities and $138.2 million in business-type activities; $151.4 million of the outstanding debt is general obligation (GO) bonds backed by the full faith and credit of the Town of Gilbert; $11 million is special assessment bonds secured by a lien against the land of the benefited property owners in Improvement Districts #19 and #20; and all other outstanding debt is secured by pledges of specific revenue sources. The Arizona Constitution and State Statutes limit a municipality’s bonded debt capacity to certain percentages of its secondary assessed valuation and by the type of project to be constructed with GO bonds. For projects involving water, wastewater, artificial lighting, parks, open space, recreational facility improvements, streets, public safety, and fire and emergency facilities, Gilbert can issue GO bonds up to 20% of its secondary assessed valuation. For any other general-purpose improvements, Gilbert may issue bonds up to 6% of its secondary assessed valuation. Gilbert’s available debt margin at June 30, 2012 was $100.5 million in the 6% capacity and $171.7 million in the 20% capacity.

12
See Note 8 on pages 53-59 for additional information on debt. The following schedule shows Gilbert’s outstanding debt as of June 30, 2012 and 2011.
Town of GilbertOutstanding Debt
Governmental Business-typeActivities Activities Total
2012 2011 2012 2011 2012 2011
General Obligation 147,565,000$ 170,385,000$ 3,870,000$ 5,530,000$ 151,435,000$ 175,915,000$ Special Assessment 11,015,000 11,415,000 - - 11,015,000 11,415,000 Street and Highway User 19,470,000 22,875,000 - - 19,470,000 22,875,000 Utility Revenue - - 15,410,000 16,795,000 15,410,000 16,795,000 Municipal Property Corporation 141,990,000 152,015,000 118,895,000 143,270,000 260,885,000 295,285,000
Totals 320,040,000$ 356,690,000$ 138,175,000$ 165,595,000$ 458,215,000$ 522,285,000$
Gilbert’s bonds are rated by leading rating agencies that assess the risk of default based on Gilbert’s financial condition. The following schedule shows Gilbert’s bond ratings as of June 30, 2012.
Moody's Investor Service
Standard and Poors Ratings
Group Fitch
Ratings General Obligation Aa1 AA Not RatedStreet and Highway User Revenue Aa3 AA AAWater and Wastewater Revenue Refunding Aa3 AA+ Not RatedPublic Facilities Municipal Property Corporation* Aa2 AA AAWater Resources Municipal Property Corporation Not Rated AA- AA-Improvement Districts Aa3 A Not Rated
* These bonds are insured Economic Factors and Next Year’s Budget Gilbert’s historic display of responsible financial practices provided a good foundation to weather the great recession of recent years. But the Town is maturing from a small-town, high-growth community to a stable, thriving, and sophisticated one. Demands for service are different than they were only five years ago. Even during the recession, Gilbert’s population increased by over 27,000 people, and the Town began to see its dreams of bio-medical economic development become reality. Technology is different, providing opportunities to work more efficiently and effectively. Infrastructure needs are different now too, as we transition our efforts from those that build and expand to those that will ensure that our existing infrastructure remains sustainable and serviceable to our community.
Because the needs and resources are now different, the process was different this year as well. The approach was collaborative. Staff members throughout the Town inventoried and analyzed costs of providing services and identified service levels. Current year budgets were not rolled forward; instead, each functional area analyzed and projected what specific costs would be needed in FY 2012-13 to meet those service delivery needs. In doing so, some once-relevant budget lines were determined to be no longer necessary; that funding could instead be reallocated to meet more critical needs. Because departments budgeted for “most likely” and not for contingent situations, contingency appropriation has been established at a Town-wide level. This will ensure that the Town is positioned to respond not only to emergent situations, but incredible opportunities as well.

13
The base for the FY 2012-13 budget was built from zero. Staff looked at actual costs then factored in mandatory cost increases, such as those for utility rates and certain contracts, and costs to provide service to new customers. This positioned the Town to leverage a lean, effective budget with recovering revenues to begin deliberately and strategically planning for the future, targeting key components of the Council’s strategic initiatives. The Town’s Executive Leadership Team worked together to recommend a budget that specifically accomplished Council direction. The budget includes recommended increases, not only to restore certain specific reductions, but also to very deliberately accomplish certain key elements of the Council’s Strategic Initiatives.
During the recession, Town revenues were substantially reduced, but the Town reduced its expenses in kind. Some expenses were deferred for a time, such as training or replacement of vehicles, and now will be addressed. In many cases, however, departments found even more efficient ways to deliver necessary public service. Our revenue and expense levels are just now headed back toward 2007 levels, and yet we are able to provide exceptional service to 27,000 new customers.
Even so, we would be remiss if we did not acknowledge that there are still business needs that remain unmet. As the Executive Team reviewed the current service levels and Strategic Initiatives, it became very clear that there are many more needs than available resources, and simply spreading available resources would not set us up to accomplish our goals with excellence. Budget Highlights for Fiscal Year 2013 The recommended budget presents a focused approach to FY 2012-13, emphasizing the following areas:
• Economic Development o Growing us out of the issues we face today
• Personnel o Recruitment and Retention o Developing stellar performers - preparing them for success in service to the community
• Technology o Mitigate current risks o Advance as a technology leader
• Maintain service levels
The budget reflects the Town’s commitment to these areas through the respective allocation of resources. Additional highlights include:
• Total budget of approximately $447.8 million • Restructuring of the organization
o Positions were both added and eliminated to meet the current needs of the community • No change to the local sales or property tax rates • Permit activity, which had dropped below 50 residential permits per month in FY 2011, reached
as high as 295 permits in May 2012 • Reserve amounts in excessive of policy requirements budgeted as contingency
Financial Contact This financial report is designed to provide a general overview of Gilbert’s finances and to demonstrate accountability for the use of public funds. This report is also available on Gilbert’s website at www.gilbertaz.gov. Questions about any of the information provided in this report, or requests for additional financial information should be addressed to: Town of Gilbert Finance Department 50 E Civic Center Drive Gilbert, AZ 85296 (480) 503-6752

14

Component Unit
Governmental
ActivitiesBusiness-type
Activities Total
Industrial Development
AuthorityASSETSPooled cash and investments 188,940,690$ 90,162,399$ 279,103,089$ 4,728$ Receivables, net: Taxes 4,349,322 - 4,349,322 - Special assessments 11,307,172 - 11,307,172 - Accrued interest 468,827 222,496 691,323 - Accounts 15,910,317 5,740,027 21,650,344 -Due from other governments 4,310,694 415,924 4,726,618 -Internal balances (9,241,362) 9,241,362 - -Prepaid items 4,771 - 4,771 -Inventories 469,707 267,488 737,195 -Restricted assets: Cash and investments 19,906,881 70,945,961 90,852,842 - Accrued interest 114 89,992 90,106 -Deferred charges 1,455,913 1,356,345 2,812,258 -Investment in joint venture 356,343 144,041,623 144,397,966 -Capital assets: Non-depreciable 191,539,157 53,747,389 245,286,546 - Depreciable, net 779,954,496 394,583,595 1,174,538,091 -Total assets 1,209,733,042 770,814,601 1,980,547,643 4,728
LIABILITIESAccounts payable 8,313,754 2,366,183 10,679,937 -Accrued liabilities 9,882,809 258,411 10,141,220 -Accrued interest - 1,451,378 1,451,378 -Claims payable 1,244,571 - 1,244,571 -Deposits held for others 161,690 - 161,690 -Utility deposits - 3,272,209 3,272,209 -Bond interest payable 3,603,682 - 3,603,682 -Unearned revenue 15,154 - 15,154 -Noncurrent liabilities: Due within one year: Current portion of compensated absences 3,637,231 706,592 4,343,823 - Current portion of bonds payable 24,195,000 3,700,000 27,895,000 - Due in more than one year: Compensated absences 6,141,647 1,122,070 7,263,717 - Bonds payable 321,062,651 134,196,420 455,259,071 -Total liabilities 378,258,189 147,073,263 525,331,452 -
NET ASSETSInvested in capital assets, net of related debt 695,983,103 316,268,041 1,012,251,144 -Restricted for: Debt service 20,696,791 22,645,139 43,341,930 - Capital projects 15,163,511 36,590,593 51,754,104 - System repair & maintenance - 12,139,956 12,139,956 - Highways and streets 10,289,564 - 10,289,564 - Grant programs 3,697,856 - 3,697,856 - Court/police programs 1,741,941 - 1,741,941 - Special districts 436,729 - 436,729 - Other purposes 192,000 - 192,000 -Unrestricted 83,273,358 236,097,609 319,370,967 4,728Total net assets 831,474,853$ 623,741,338$ 1,455,216,191$ 4,728$
The notes to the financial statements are an integral part of this statement.
15
TOWN OF GILBERT, ARIZONAStatement of Net Assets
June 30, 2012
Primary Government

ExpensesCharges for
Services
Operating Grants and
Contributions
Capital Grants and
ContributionsFunctions/ProgramsPrimary governmentGovernmental activities: General government Management and policy 2,982,636$ 1,145$ 14,617$ -$ Support services 8,632,288 207,508 - 34,219 Financial services 1,216,418 11,173 - - Legal and court 5,409,709 639,895 30,000 - Development services 8,551,083 5,346,632 864,026 680,639 Public safety Police 40,466,828 5,584,595 241,438 1,863,016 Fire 24,906,506 128,955 1,176,705 5,585,947 Highways and streets 43,437,623 1,497,069 18,074,699 6,062,016 Community services 19,931,592 3,594,859 511,063 11,208,232 Transportation 1,268,998 - 11,885 612,220 Non departmental 2,910,114 1,465 120,213 13,713 Interest and fiscal charges on long-term debt 15,785,320 - - -Total governmental activities 175,499,115 17,013,296 21,044,646 26,060,002Business-type activities: Water 37,694,869 36,692,434 - 20,212,017 Wastewater 22,661,900 22,739,462 - 16,995,982 Solid waste 14,917,749 17,923,883 - 13,713Total business-type activities 75,274,518 77,355,779 - 37,221,712Total primary government 250,773,633$ 94,369,075$ 21,044,646$ 63,281,714$ Component unit Industrial development authority 10$ 1,500$ -$ -$
16
TOWN OF GILBERT, ARIZONAStatement of Activities
For the Year Ended June 30, 2012
Program Revenues
Transfers Total general revenues and transfers Change in net assetsNet assets, July 1, 2011Net assets, June 30, 2012
Unrestricted state shared income taxes Grants and contributions not restricted to specific programs
Unrestricted investment earnings Gain on sale of capital assets Miscellaneous
General revenues: Sales taxes Property taxes, levied for debt service In-Lieu property taxes Franchise taxes Unrestricted state shared sales taxes
Component Unit
Governmental Activities
Business-type Activities Total
Industrial Development
Authority
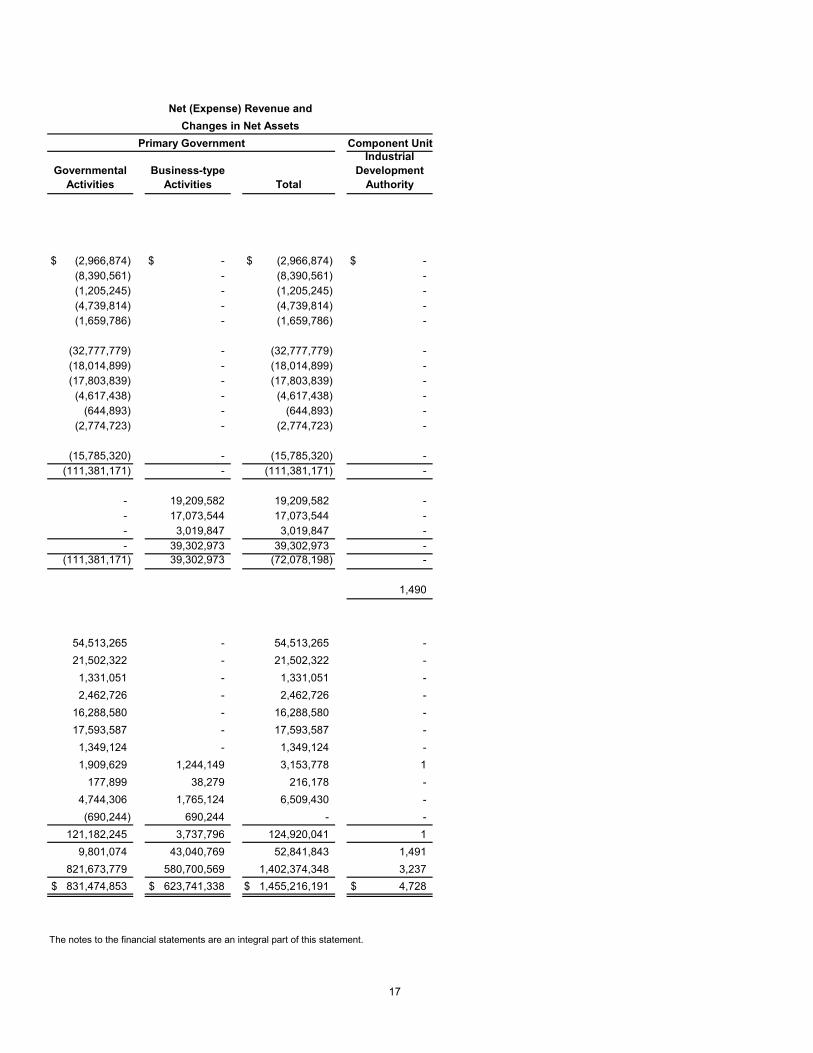
(2,966,874)$ -$ (2,966,874)$ -$ (8,390,561) - (8,390,561) -(1,205,245) - (1,205,245) -(4,739,814) - (4,739,814) -(1,659,786) - (1,659,786) -
(32,777,779) - (32,777,779) -(18,014,899) - (18,014,899) -(17,803,839) - (17,803,839) -
(4,617,438) - (4,617,438) -(644,893) - (644,893) -
(2,774,723) - (2,774,723) -
(15,785,320) - (15,785,320) -(111,381,171) - (111,381,171) -
- 19,209,582 19,209,582 -- 17,073,544 17,073,544 -- 3,019,847 3,019,847 -- 39,302,973 39,302,973 -
(111,381,171) 39,302,973 (72,078,198) -
1,490
54,513,265 - 54,513,265 -21,502,322 - 21,502,322 -
1,331,051 - 1,331,051 -2,462,726 - 2,462,726 -
16,288,580 - 16,288,580 -17,593,587 - 17,593,587 -
1,349,124 - 1,349,124 -1,909,629 1,244,149 3,153,778 1
177,899 38,279 216,178 -4,744,306 1,765,124 6,509,430 -(690,244) 690,244 - -
121,182,245 3,737,796 124,920,041 19,801,074 43,040,769 52,841,843 1,491
821,673,779 580,700,569 1,402,374,348 3,237831,474,853$ 623,741,338$ 1,455,216,191$ 4,728$
17
Net (Expense) Revenue andChanges in Net Assets
Primary Government
The notes to the financial statements are an integral part of this statement.

GeneralStreets Special
RevenueGeneral Debt
Service
Special Assessments Debt Service
ASSETSPooled cash and investments 55,376,673$ 14,548,110$ 9,593,902$ 53,590$ Receivables, net: Taxes 4,121,059 - 202,972 - Special assessments - - - 11,307,172 Accrued interest 144,415 36,690 36,998 211 Accounts 14,273,767 - 355,688 -Due from other governments 271,482 1,264,516 - -Due from other funds 489,782 - - -Prepaid items 4,771 - - -Inventories - - - -Advances to other funds 23,208,408 - - -Restricted assets: Cash and investments - - 12,938,684 - Accrued interest - - 58 - Total assets 97,890,357$ 15,849,316$ 23,128,302$ 11,360,973$
LIABILITIES AND FUND BALANCESLiabilities: Accounts payable 4,382,390$ 340,218$ -$ -$ Accrued liabilities 9,773,934 54,106 - - Deposits held for others 106,750 2,352 - - Due to other funds - - - - Bonds payable - - 9,335,000 - Interest payable - - 3,603,683 - Advances from other funds - - - - Deferred revenue: Special assessments - - - 11,296,956 Other 5,366,901 - - - Total liabilities 19,629,975 396,676 12,938,683 11,296,956
Fund Balances: Nonspendable 23,213,179 - - - Restricted - 10,700,623 9,335,818 64,017 Assigned 10,797,540 4,752,017 853,801 - Unassigned 44,249,663 - - - Total fund balances 78,260,382 15,452,640 10,189,619 64,017Total liabilities and fund balances 97,890,357$ 15,849,316$ 23,128,302$ 11,360,973$
18
TOWN OF GILBERT, ARIZONABalance Sheet
Governmental FundsJune 30, 2012

Streets and Transportation Capital Projects
Municipal Facilities Capital
Projects
Parks, Open Space and Recreation
Capital Projects
Other Governmental
Funds
Total Governmental
Funds
68,799,728$ 569,301$ 14,597,651$ 10,794,055$ 174,333,010$
- - - 25,291 4,349,322- - - - 11,307,172
175,465 4,629 35,154 31,013 464,5751,175,336 702 17,852 52,113 15,875,458
250,000 - - 2,524,696 4,310,694- - - - 489,782- - - - 4,771- - - 1,666 1,666- - - - 23,208,408
- 6,968,197 - - 19,906,881- 56 - - 114
70,400,529$ 7,542,885$ 14,650,657$ 13,428,834$ 254,251,853$
2,201,336$ 580,720$ 4,241$ 437,928$ 7,946,833$ 5,572 - - 25,443 9,859,055
52,588 - - - 161,690- - - 489,782 489,782- - - - 9,335,000- - - - 3,603,683- 23,208,408 - - 23,208,408
- - - - 11,296,9561,174,640 - - 14,600 6,556,1413,434,136 23,789,128 4,241 967,753 72,457,548
- - - 1,666 23,214,84546,753,842 6,867,888 14,646,416 12,203,351 100,571,95520,212,551 - - 341,236 36,957,145
- (23,114,131) - (85,172) 21,050,36066,966,393 (16,246,243) 14,646,416 12,461,081 181,794,30570,400,529$ 7,542,885$ 14,650,657$ 13,428,834$ 254,251,853$
The notes to the financial statement are an integral part of this statement.19

20

Fund balances - total governmental funds 181,794,305$
Amounts reported for governmental activities in the statement of net assets are different because:
Capital assets used in governmental activities are not financial resources and, therefore, are not reported in the governmental funds.
Governmental capital assets 1,460,475,571Accumulated depreciation (489,217,462) 971,258,109
The investment in joint venture is not a financial resource and, therefore, is not reported in the funds 356,343
Because the focus of governmental funds is on short-term financing, some assets will not be available to pay for current-period expenditures. Those assets (for example, receivables) are offset by deferred revenues in the governmental funds and thus are not included in fund balance.
Deferred special assessment revenue 11,296,956Deferred court revenue 4,852,072 Deferred other entities participation revenue 1,174,640 Deferred sales tax revenue 514,275 17,837,943
Internal service funds are used by management to charge the costs of certain activities, such as equipment maintenance, copy services, and self-insurance to the individual funds. The assets and liabilities of the internal service funds are included in the governmental activities in the statement of net assets, but are not included on the governmental fund balance sheet. 4,319,384
Long-term liabilities applicable to the Town's governmental activities are not due and payable in the current period, and accordingly are not reported as fund liabilities in the governmental fund statement.
Bonds payable (331,940,000)Compensated absences (9,624,495) (341,564,495)
Bond issuance costs, discounts and premiums are reported as expenditures, other financing uses and other financing sources, respectively, in the governmental funds when paid, but are deferred and amortized over the life of the bonds in the statement of net assets.
Bond issuance costs/discounts/premiums (2,526,736)
Net assets of governmental activities - statement of net assets 831,474,853$
The notes to the financial statements are an integral part of this statement.21
TOWN OF GILBERT, ARIZONAReconciliation of the Balance Sheet
to the Statement of Net AssetsJune 30, 2012

GeneralStreets Special
RevenueGeneral Debt
Service
Special Assessments Debt Service
Revenues Taxes: Sales 54,502,627$ -$ -$ -$ Property - - 21,502,322 - Franchise 2,462,726 - - - Licenses and permits 3,995,370 - - - Intergovernmental 36,784,416 17,132,260 - - Special assessments - - - 878,981 Charges for services 6,714,370 56,728 - - Other entities' participation 4,297 15,493 - - System development fees - - - - Gifts and donations 19,518 - - - Fines and forfeitures 3,987,115 5,601 - - Investment earnings 708,826 105,748 90,286 1,295 Miscellaneous 1,259,502 307,718 - - Total revenues 110,438,767 17,623,548 21,592,608 880,276
Expenditures Current: General government: Management and policy 3,675,664 - - - Support services 9,159,579 - - - Financial services 1,721,856 - - - Legal and court 4,312,781 - - - Development services 6,582,668 - - - Public safety: Police 34,631,396 - - - Fire 21,293,740 - - - Highways and streets - 8,371,522 - - Community services 11,590,089 - - - Transportation 1,247,091 - - - Non departmental 2,776,188 - - - Debt service: Principal - - 22,655,000 400,000 Interest - - 15,417,091 574,655 Bond issuance costs - - 402,163 - Fiscal and other charges - - 1,534 1,073 Capital outlay 567,666 2,797,035 - - Total expenditures 97,558,718 11,168,557 38,475,788 975,728Excess (deficiency) of revenues over (under) expenditures 12,880,049 6,454,991 (16,883,180) (95,452)
Other financing sources (uses) Transfers in 4,688,928 50,000 19,736,738 305,836 Transfers out (5,876,144) (3,570,110) - (202,978) Refunding bonds issued - - 37,925,000 - Premium on refunding bonds - - 4,110,575 - Payment to refunded bond escrow agent - - (41,626,798) - Total other financing sources and uses (1,187,216) (3,520,110) 20,145,515 102,858
Net change in fund balances 11,692,833 2,934,881 3,262,335 7,406Fund balances at beginning of year 66,567,549 12,517,759 6,927,284 56,611Fund balances at end of year 78,260,382$ 15,452,640$ 10,189,619$ 64,017$
22
TOWN OF GILBERT, ARIZONAStatement of Revenues, Expenditures, and Changes in Fund Balances
Governmental FundsFor the Year Ended June 30, 2012

Streets and Transportation Capital Projects
Municipal Facilities Capital
Projects
Parks, Open Space and Recreation
Capital Projects
Other Governmental
Funds
Total Governmental
Funds
-$ -$ -$ -$ 54,502,627$ - - - 2,542,937 24,045,259- - - - 2,462,726- - - - 3,995,370
634,918 2,856,346 - 4,060,571 61,468,511- - - - 878,981- - - 1,392,593 8,163,691
1,278,413 - - 2,370 1,300,573- 5,677,183 11,010,594 1,269,395 17,957,172- - - 166,253 185,771- - - 449,156 4,441,872
773,594 15,848 95,905 97,366 1,888,8681,779,024 - 1,520,389 80,282 4,946,9154,465,949 8,549,377 12,626,888 10,060,923 186,238,336
- - - 43 3,675,707- - - - 9,159,579- - - - 1,721,856- - - 304,686 4,617,467
1,559 64,078 - 865,498 7,513,803
- 285,690 - 1,466,965 36,384,051- 133,183 - 124,966 21,551,889
20,852 - - 2,422,821 10,815,195- - 49,414 1,048,662 12,688,165- - - 21,907 1,268,998- - - 133,926 2,910,114
- - - - 23,055,000- - - - 15,991,746- - - - 402,163- 6,582 - - 9,189
25,389,756 4,551,246 328,166 866,006 34,499,87525,412,167 5,040,779 377,580 7,255,480 186,264,797
(20,946,218) 3,508,598 12,249,308 2,805,443 (26,461)
286,869 103,177 - 23,730 25,195,278- (6,107,067) (5,862,305) (4,266,918) (25,885,522)- - - - 37,925,000- - - - 4,110,575- - - - (41,626,798)
286,869 (6,003,890) (5,862,305) (4,243,188) (281,467)
(20,659,349) (2,495,292) 6,387,003 (1,437,745) (307,928)87,625,742 (13,750,951) 8,259,413 13,898,826 182,102,23366,966,393$ (16,246,243)$ 14,646,416$ 12,461,081$ 181,794,305$
The notes to the financial statements are an integral part of this statement.23

24

Net change in fund balances - total governmental funds (307,928)$
Amounts reported for governmental activities in the statement of activities are different because: Governmental funds report capital outlays as expenditures. However, in the statement of activities, the cost of those assets is allocated over their estimated useful lives as depreciation expense.
Capital outlay 34,499,875Depreciation expense (47,895,443) (13,395,568)
Issuance of debt, applicable premium and payment to refunded bond escrow agent are reported as a financing source in the governmental funds and thus contribute to the change in fund balance. In the government-wide statements, however, issuing debt increases long-term liabilities in the statement of net assets and does not affect the statement of activities. Bond premium is deferred and amortized in the statement of activities.
Refunding bonds (37,925,000)Premium on refunding bonds (4,110,575)Payment to refunded bond escrow agent 41,626,798 (408,777)
Repayment of bond principal and bond issuance costs are reported as expenditures in governmental funds and thus have the effect of reducing fund balance because current financial resources have been used. For the government-wide statements, however, the principal payments reduce the long-term liabilities in the statement of net assets and do not result in an expense in the statement of activities. Bond issuance costs, charge on refunding
Principal payments 23,055,000Bond issuance costs 402,163Amortization of bond issuance costs (91,725) Amortization of deferred charge on refunding bonds (66,072) Amortization of bond premium 373,412 23,672,778
Internal service funds are used by management to charge the costs of certain activities, such as equipment maintenance and copy services, to the individual funds. The adjustments for internal service funds "close" those funds by charging the additional amounts to participating governmental activities to completely cover the internal services funds' costs for the year.
Operating loss (1,121,166)Investment earnings 20,760Loss on sale of capital assets (24,711) (1,125,117)
Capital assets contributed by developers are not shown on the governmental fund statements, but are included in the assets of the Town. On the statement of activities, these donations are shown as capital contributions.
Capital contributions 2,191,470
Some expenses reported in the statement of activities do not require the use of current financial resources and therefore, are not reported as expenditures in governmental funds.
Compensated absences (772,965)
Certain revenues are deferred in the governmental funds because they do not provide current financial resources due to unavailability but are recognized as revenue in the statement of activities. However, other revenues in the governmental funds that provide current financial resources are not included in the statement of activities because they were recognized in a prior period.
Court revenue 252,031Sales tax 10,638Special assessments (315,488) (52,819)
Change in net assets of governmental activities - statement of activities 9,801,074$
The notes to the financial statements are an integral part of this statement.25
bonds, and bond premium are deferred and amortized over the life of the bonds.
TOWN OF GILBERT, ARIZONAReconciliation of the Statement of Revenues, Expenditures and
Changes in Fund Balances to the Statement of ActivitiesFor the Year Ended June 30, 2012

Variance withFinal Budget -
Original FinalActual
AmountsPositive
(Negative)Revenues Taxes: Sales 49,409,700$ 49,409,700$ 54,502,627$ 5,092,927$ Franchise 2,444,210 2,444,210 2,462,726 18,516 Licenses and permits 2,122,320 2,122,320 3,995,370 1,873,050 Intergovernmental 34,028,800 34,028,800 36,784,416 2,755,616 Charges for services 6,694,180 6,694,180 6,714,370 20,190 Other entities' participation - - 4,297 4,297 Gifts and donations 31,000 31,000 19,518 (11,482) Fines and forfeitures 4,056,100 4,056,100 3,987,115 (68,985) Investment earnings 317,000 317,000 708,826 391,826 Miscellaneous 203,150 203,150 1,259,502 1,056,352 Total revenues 99,306,460 99,306,460 110,438,767 11,132,307
Expenditures Current: General government: Management and policy 3,523,080 3,662,290 3,675,664 (13,374) Support services 9,437,720 9,586,166 9,159,579 426,587 Financial services 1,818,090 1,818,090 1,721,856 96,234 Legal and court 4,275,920 4,285,640 4,312,781 (27,141) Development services 6,508,600 6,541,590 6,582,668 (41,078) Public safety: Police 36,344,550 35,885,350 34,631,396 1,253,954 Fire 20,891,490 21,184,970 21,293,740 (108,770) Community services 11,618,570 11,618,570 11,590,089 28,481 Transportation 1,194,100 1,194,100 1,247,091 (52,991) Non departmental 1,737,290 1,737,290 2,776,188 (1,038,898) Capital outlay 3,430,180 3,781,930 567,666 3,214,264 Total expenditures 100,779,590 101,295,986 97,558,718 3,737,268
Excess (deficiency) of revenues over (under) expenditures (1,473,130) (1,989,526) 12,880,049 14,869,575
Other financing sources (uses) Transfers in 3,541,260 3,416,260 4,688,928 1,272,668 Transfers out (8,574,060) (8,574,060) (5,876,144) 2,697,916 Total other financing sources and uses (5,032,800) (5,157,800) (1,187,216) 3,970,584
Net change in fund balances (6,505,930)$ (7,147,326)$ 11,692,833 18,840,159$
Fund balance at beginning of year 66,567,549Fund balance at end of year 78,260,382$
The notes to the financial statements are an integral part of this statement.26
TOWN OF GILBERT, ARIZONAGeneral Fund
Statement of Revenues, Expenditures, and Changesin Fund Balances - Budget and Actual - Budgetary Basis
For the Year Ended June 30, 2012
Budgeted Amounts

Variance withFinal Budget -
Original FinalActual
AmountsPositive
(Negative)Revenues Intergovernmental 16,664,710$ 16,664,710$ 17,132,260$ 467,550$ Charges for services - - 56,728 56,728 Other entities' participation - - 15,493 15,493 Fines and forfeitures - - 5,601 5,601 Investment earnings 15,400 15,400 105,748 90,348 Miscellaneous 45,000 45,000 307,718 262,718 Total revenues 16,725,110 16,725,110 17,623,548 898,438
Expenditures Current: Highways and streets 8,985,110 8,985,110 8,371,522 613,588 Capital outlay 3,607,360 3,607,360 2,797,035 810,325 Contingency 367,000 367,000 - 367,000 Total expenditures 12,959,470 12,959,470 11,168,557 1,790,913
Excess of revenues over expenditures 3,765,640 3,765,640 6,454,991 2,689,351
Other financing sources (uses) Transfers in 50,000 50,000 50,000 - Transfers out (4,083,440) (4,083,440) (3,570,110) 513,330 Total other financing sources and uses (4,033,440) (4,033,440) (3,520,110) 513,330
Net change in fund balances (267,800)$ (267,800)$ 2,934,881 3,202,681$
Fund balance at beginning of year 12,517,759Fund balance at end of year 15,452,640$
The notes to the financial statements are an integral part of this statement.27
TOWN OF GILBERT, ARIZONAStreets Special Revenue Fund
Statement of Revenues, Expenditures, and Changesin Fund Balances - Budget and Actual - Budgetary Basis
For the Year Ended June 30, 2012
Budgeted Amounts

Water Wastewater Solid Waste TotalASSETSCurrent assets: Pooled cash and investments 61,368,187$ 17,069,606$ 20,104,894$ 98,542,687$ Receivables (net): Accrued interest 142,699 32,139 47,658 222,496 Accounts 3,151,164 1,633,674 955,189 5,740,027 Due from other governments 132,719 283,205 - 415,924 Inventories 267,488 - - 267,488 Total current assets 65,062,257 19,018,624 21,107,741 105,188,622
Noncurrent assets: Restricted assets: Cash and investments 64,568,274 6,377,687 - 70,945,961 Accrued interest 83,381 6,611 - 89,992 Deferred charges 1,126,285 230,060 - 1,356,345 Investment in joint venture 74,783,441 69,258,182 - 144,041,623 Capital assets: Non-depreciable 42,023,384 11,724,005 - 53,747,389 Depreciable, net 223,062,244 166,176,252 5,345,099 394,583,595 Total noncurrent assets 405,647,009 253,772,797 5,345,099 664,764,905 Total assets 470,709,266 272,791,421 26,452,840 769,953,527
LIABILITIESCurrent liabilities: Accounts payable 1,112,151 903,317 350,715 2,366,183 Accrued liabilities 126,244 50,470 81,697 258,411 Current portion of accrued compensated absences 349,673 153,897 203,022 706,592 Claims payable - - - - Accrued interest 1,451,378 - - 1,451,378 Bonds payable 3,700,000 - - 3,700,000 Utility deposits 3,245,564 - 26,645 3,272,209 Total current liabilities 9,985,010 1,107,684 662,079 11,754,773
Noncurrent liabilities: General obligation bonds payable 3,877,755 - - 3,877,755 Utility revenue bonds payable 126,618,244 3,700,421 - 130,318,665 Accrued compensated absences 550,802 287,674 283,594 1,122,070 Total noncurrent liabilities 131,046,801 3,988,095 283,594 135,318,490 Total liabilities 141,031,811 5,095,779 945,673 147,073,263
NET ASSETSInvested in capital assets, net of related debt 136,723,106 174,199,836 5,345,099 316,268,041Restricted for debt service 21,947,133 698,006 - 22,645,139Restricted for capital projects 36,590,593 - - 36,590,593Restricted for system repair & maintenance 7,211,212 4,928,744 - 12,139,956Unrestricted 127,205,411 87,869,056 20,162,068 235,236,535Total net assets 329,677,455$ 267,695,642$ 25,507,167$ 622,880,264$
861,074623,741,338$
28
TOWN OF GILBERT, ARIZONAStatement of Net Assets
Proprietary FundsJune 30, 2012
Business-type Activities - Enterprise Funds
Net assets of business-type activitiesAdjustment to reflect the consolidation of internal service fund activities related to enterprise funds

GovernmentalActivities -
Internal Service Funds
6,227,392$
4,25234,859
-468,041
6,734,544
----
-235,544235,544
6,970,088
366,92123,75564,110
1,244,571---
1,699,357
--
90,27390,273
1,789,630
235,544---
4,944,9145,180,458$
The notes to the financial statements are an integral part of this statement.29

Water Wastewater Solid Waste TotalOperating revenues Charges for services 36,692,434$ 22,739,462$ 17,923,883$ 77,355,779$ Other 1,646,827 8,467 109,830 1,765,124 Total operating revenues 38,339,261 22,747,929 18,033,713 79,120,903
Operating expenses General and administrative 1,073,874 810,667 927,851 2,812,392 Personal services 6,911,462 3,623,629 5,408,602 15,943,693 Operation and maintenance 12,042,823 8,245,112 6,243,114 26,531,049 Claims Incurred - - - - Depreciation 9,490,239 8,381,788 1,674,985 19,547,012 Allocation of indirect expenses 1,149,154 648,797 584,653 2,382,604 Total operating expenses 30,667,552 21,709,993 14,839,205 67,216,750
Operating income (loss) 7,671,709 1,037,936 3,194,508 11,904,153
Nonoperating revenues (expenses) Interest expense (6,764,676) (376,895) - (7,141,571) Investment earnings 895,168 211,306 137,675 1,244,149 Amortization of bond issuance costs (111,369) (521,345) - (632,714) Gain (loss) on sale of capital assets 4,168 2,652 31,459 38,279 Total nonoperating revenues (expenses) (5,976,709) (684,282) 169,134 (6,491,857)
Income (loss) before capital contributions and transfers 1,695,000 353,654 3,363,642 5,412,296
Capital contributions 20,212,017 16,995,982 13,713 37,221,712Transfers in 1,050,840 492,290 - 1,543,130Transfers out (669,513) (183,373) - (852,886)
Change in net assets 22,288,344 17,658,553 3,377,355 43,324,252
Total net assets, beginning of year 307,389,111 250,037,089 22,129,812
Total net assets, end of year 329,677,455$ 267,695,642$ 25,507,167$
(283,483)43,040,769$
30
Change in net assets of business-type activitiesAdjustment to reflect the consolidation of internal service fund activities related to enterprise funds
TOWN OF GILBERT, ARIZONAStatement of Revenues, Expenses, and Changes in Fund Net Assets
Proprietary FundsFor the Year Ended June 30, 2012
Business-type Activities - Enterprise Funds

Governmental
Activities -Internal Service
Funds
20,204,159$ 52,080
20,256,239
938,3781,414,0355,760,982
13,506,65140,842
-21,660,888
(1,404,649)
-20,760
-(24,711)(3,951)
(1,408,600)
---
(1,408,600)
6,589,058
5,180,458$
The notes to the financial statements are an integral part of this statement.31

Water Wastewater Solid Waste TotalCash flows from operating activities: Cash receipts from customers 36,679,843$ 22,669,485$ 17,658,776$ 77,008,104$ Other operating cash receipts 1,646,827 8,467 109,830 1,765,124 Cash receipts from other funds for services - - - - Cash receipts from deposits 741,288 - 1,875 743,163 Cash payments to suppliers for goods and services (13,728,949) (9,284,953) (7,293,721) (30,307,623) Cash payments to employees for services (6,683,108) (3,524,224) (5,368,907) (15,576,239) Cash payments to other funds for services (1,149,154) (648,797) (584,653) (2,382,604) Net cash provided by (used in) operating activities 17,506,747 9,219,978 4,523,200 31,249,925
Cash flows from noncapital financing activities: Changes in advances from other funds - (1,139,854) - (1,139,854)Changes in advances to other funds 1,139,854 - - 1,139,854 Transfers from other funds 1,050,840 492,290 - 1,543,130 Transfers to other funds (669,513) (183,373) - (852,886) Net cash provided by (used in) noncapital financing activities 1,521,181 (830,937) - 690,244
Cash flows from capital and related financing activities: Acquisition and construction of capital assets (8,579,652) (154,538) (149,158) (8,883,348) Proceeds from development fees 17,509,478 15,154,154 - 32,663,632 Cash paid for interest and fiscal charges (6,864,204) (568,240) - (7,432,444) Principal payments on bonds (11,326,341) (16,093,659) - (27,420,000) Disposal of capital assets 4,168 2,652 31,459 38,279 Net cash used in capital and related financing activities (9,256,551) (1,659,631) (117,699) (11,033,881)
Cash flows from investing activities: Interest received on investments 779,220 178,138 107,533 1,064,891 Net cash provided by investing activities 779,220 178,138 107,533 1,064,891
Net increase (decrease) in cash and cash equivalents 10,550,597 6,907,548 4,513,034 21,971,179Cash and cash equivalents at beginning of year 115,385,864 16,539,745 15,591,860 147,517,469Cash and cash equivalents at end of year 125,936,461$ 23,447,293$ 20,104,894$ 169,488,648$
Cash and cash equivalents at end of year includes: Equity in pooled cash and investments 61,368,187$ 17,069,606$ 20,104,894$ 98,542,687$ Restricted cash and investments 64,568,274 6,377,687 - 70,945,961 Total cash and cash equivalents 125,936,461$ 23,447,293$ 20,104,894$ 169,488,648$
Reconciliation of operating income (loss) to net cash provided by (used in) operations: Operating income (loss) 7,671,709$ 1,037,936$ 3,194,508$ 11,904,153$ Adjustments to reconcile operating income (loss) to net cash provided by (used in) operating activities: Depreciation 9,490,239 8,381,788 1,674,985 19,547,012 Provision for uncollectible accounts (395,339) (307,526) (277,734) (980,599) Changes in assets and liabilities: Decrease in accounts receivable 382,748 237,548 12,626 632,922 Decrease in prepaid items - - - - Increase in inventories (89,440) - - (89,440) Increase (decrease) in accounts payable (522,812) (229,174) (122,755) (874,741) Increase in claims payable - - - - Increase in deposits 741,288 - 1,875 743,163 Increase in accrued expenses 228,354 99,406 39,695 367,455 Total adjustments 9,835,038 8,182,042 1,328,692 19,345,772
Net cash provided by (used in) operating activities 17,506,747$ 9,219,978$ 4,523,200$ 31,249,925$
Supplemental disclosures of noncash financing activities: Additions to property and equipment: Contributions from developers 2,702,539$ 1,841,828$ -$ 4,544,367$ Total additions to property and equipment 2,702,539$ 1,841,828$ -$ 4,544,367$
32
TOWN OF GILBERT, ARIZONAStatement of Cash Flows
Proprietary FundsFor the Year Ended June 30, 2012
Business-type Activities - Enterprise Funds

Governmental
Activities -Internal Service
Funds
-$ 52,669
20,245,502-
(19,968,246)(1,367,150)
-(1,037,225)
-----
(159,336)----
(159,336)
20,15320,153
(1,176,408)7,403,8006,227,392$
6,227,392$ -
6,227,392$
(1,404,649)$
40,842-
41,9327,266
(37,614)103,983164,130
-46,885
367,424
(1,037,225)$
-$ -$
The notes to the financial statements are an integral part of this statement.33

Firemen's
Pension Trust Agency FundsASSETS
Restricted cash and investments 99,625$ 159,856$ Restricted accrued interest - 306
Total assets 99,625 160,162$
LIABILITIES
Guaranty and other deposits - 137,206$ Medical benefits payable - 9,092Dependent care benefits payable - 13,864
Total liabilities - 160,162$
NET ASSETS
Held in trust for pension benefits 99,625$
The notes to the financial statements are an integral part of this statement.
TOWN OF GILBERT, ARIZONAStatement of Fiduciary Net Assets
Fiduciary FundsJune 30, 2012
34

Firemen's
Pension TrustAdditions
Interest on investments 74$
Total additions 74
Deductions
Benefits 2,400Administration 100
Total deductions 2,500
Change in net assets (2,426)
Net assets - beginning of the year 102,051
Net assets - end of the year 99,625$
The notes to the financial statements are an integral part of this statement.
TOWN OF GILBERT, ARIZONAStatement of Changes in Fiduciary Net Assets
Fiduciary FundFor the Year Ended June 30, 2012
35

36

TOWN OF GILBERT, ARIZONA NOTES TO THE FINANCIAL STATEMENTS
June 30, 2012
37
The Town of Gilbert, Arizona (Gilbert) was incorporated on July 6, 1920, under the provisions of Article 13, Section 1 of the Constitution of the State of Arizona. Gilbert operates as a general law community, under the provisions of Title 9, Chapter 2, Article 3 (Common Council provision). Gilbert operates under the Council-Manager form of government, as empowered in Chapter 2, Article 2-51 of the Code of the Town of Gilbert, Arizona. There are seven members of the Council, elected to staggered four-year terms. The voters select the Mayor and the Council membership annually elects the Vice Mayor.
Note 1 - Summary of Significant Accounting Policies
Gilbert’s accounting policies conform to accounting principles generally accepted in the United States of America (GAAP) as applicable to governmental units. The Governmental Accounting Standards Board (GASB) is the accepted standard-setting body for establishing governmental accounting and financial reporting principles. A. Reporting Entity Gilbert’s operations include public safety (police, fire, and animal control), community services (parks, recreation, library, culture and arts, and social services), development services (planning, code enforcement, and engineering), and general administration in support of operations. Gilbert also operates three enterprise funds to provide water, wastewater, and solid waste, and three internal service funds that provide equipment and fleet maintenance, copy services, and employee self-insurance for medical and dental claims. The accompanying financial statements present the activities of Gilbert (the primary government) and its component units. Component units are legally separate entities for which Gilbert is considered to be financially accountable. Blended component units, although legally separate entities, are in substance part of Gilbert’s operations. Therefore, data from these units is combined with data of the primary government. Discretely presented component units, on the other hand, are reported in a separate column in the combined financial statements to emphasize they are legally separate from the Town of Gilbert. Each blended and discretely presented component unit discussed below has a June 30 year-end. Blended Component Units - The Water Resources Municipal Property Corporation (Water MPC) is a legally separate, non-profit corporation which exists solely for the purpose of financing the construction or acquisition of water and wastewater capital improvement projects. The Public Facilities Municipal Property Corporation (Public Facilities MPC) is a legally separate, non-profit corporation which exists solely for the purpose of financing construction of municipal facilities. Each is considered a blended component unit because the Council appoints the five-member board of directors of the MPC, the Council must approve any amendments to the articles of incorporation of the MPC, the Council must approve any debt issues of the MPC, and the MPC provides services solely to the Town of Gilbert. At June 30, 2012, the Water MPC bonded debt is reported within the water fund and the Public Facilities MPC bonded debt is reported within the debt service fund (current portion only) and within the governmental activities in the government-wide statement of net assets. Discretely Presented Component Unit - The Industrial Development Authority (IDA) issues industrial revenue bonds to provide financial assistance to private sector entities for the acquisition and construction of eligible industrial and commercial facilities deemed to be in the public interest. The IDA is considered a component unit because the Council appoints the board of directors of the IDA, the Council must approve any amendments to the articles of incorporation of the IDA, and the Council must approve any debt issues of the IDA. The IDA is discretely presented in these combined financial statements because the IDA does not provide services solely to Gilbert. Separate financial statements for the IDA have not been prepared.

TOWN OF GILBERT, ARIZONA NOTES TO THE FINANCIAL STATEMENTS
June 30, 2012
38
B. Jointly Governed Organizations Williams Gateway Airport Authority (WGAA) is a non-profit corporation established and funded by the Towns of Gilbert and Queen Creek, the Cities of Mesa and Phoenix, and the Gila River Indian Community. The purpose of the entity is the redevelopment of Williams Air Force Base, which was closed in September 1993 and became Phoenix/Mesa Gateway Airport (formerly known as Williams Gateway Airport). The airport has three runways, a newly remodeled passenger terminal and is positioned to be a reliever airport to Phoenix’s Sky Harbor International Airport. The Board of Directors consists of the mayors of the respective communities and the governor of the tribal community. Gilbert contributed $350,000 in fiscal year 2012 (life to date $6,824,250) to the WGAA operating and capital budget. Regional Public Transportation Authority (RPTA) is a voluntary association of local governments, including Maricopa County, Mesa, Tempe, Scottsdale, Glendale, Phoenix, and Gilbert. Its purpose is to create a regional public transportation plan for Maricopa County. The Board of Directors consists of the mayors of those municipalities and a member of the County Board of Supervisors.
C. Government-wide and Fund Financial Statements
The government-wide financial statements (Statement of Net Assets and Statement of Activities) report on Gilbert and its component units as a whole, excluding fiduciary activities. Governmental activities, which normally are supported by taxes and intergovernmental revenues, are reported separately from business-type activities, which rely to a significant extent on fees and charges for support.
The government-wide Statement of Net Assets reports all financial and capital resources of the government (excluding fiduciary funds). It is displayed in a format of assets less liabilities equals net assets, with the assets and liabilities shown in order of their relative liquidity. Net assets are required to be displayed in three components: 1) invested in capital assets, net of related debt, 2) restricted and 3) unrestricted. Invested in capital assets, net of related debt is capital assets net of accumulated depreciation and reduced by outstanding balances of any bonds, mortgages, notes or other borrowings that are attributable to the acquisition, construction, or improvement of those assets. Restricted net assets are those with constraints placed on their use by either: 1) externally imposed by creditors (such as through debt covenants), grantors, contributors, or laws or regulations of other governments, or 2) imposed by law through constitutional provisions or enabling legislation. All net assets not otherwise classified as restricted, are shown as unrestricted. The government-wide Statement of Activities demonstrates the degree to which the direct expenses of the various functions or departments are offset by program revenues. Direct expenses are those that are clearly identifiable with a specific function or department. Interest and fiscal charges on long-term debt are not allocated to the various functions. Program revenues include charges for services, fines and forfeitures, licenses and permit fees, special assessment fees, certain system development fees, intergovernmental grants and other entities participation. Taxes, investment earnings and other revenues not identifiable with a particular function or department are included as general revenues. The general revenues support the net costs of the functions and departments not covered by program revenues.
For the most part, the effect of internal activity has been removed from the government-wide financial statements. Net internal activity and balances between governmental activities and business-type activities are shown in the government-wide financial statements. Certain charges between the enterprise funds’ utility systems and the various functional activities are not eliminated as this would distort the direct costs and program revenues reported for the various functions concerned.

TOWN OF GILBERT, ARIZONA NOTES TO THE FINANCIAL STATEMENTS
June 30, 2012
39
Separate financial statements are provided for the governmental funds, proprietary funds and fiduciary funds. The focus of the fund financial statements is on major funds. Major individual governmental funds and proprietary funds are reported as separate columns in the fund financial statements. Other nonmajor governmental funds, as well as the internal service funds, are summarized into a single column on the fund financial statements and are detailed in the combining statements included as supplementary information. As stated above, the fiduciary funds are presented in the fund financial statements and not included in the government-wide statements. By definition these assets are being held for the benefit of a third party and cannot be used to address Gilbert’s activities or obligations. The internal service funds, which provide services to the other funds of the government, are presented in a single combined column in the proprietary fund financial statements. Because the principal users of the internal service funds are the governmental activities, the assets and liabilities of the internal service funds are consolidated into the governmental activities column of the government-wide Statement of Net Assets. The costs of the internal service fund services are spread to the appropriate function or department on the government-wide Statement of Activities and the revenues and expenses within the internal service funds are eliminated from the government-wide financial statements to avoid any doubling up effect from these revenues and expenses. D. Measurement Focus and Basis of Accounting The government-wide financial statements are reported using the economic resources measurement focus and the accrual basis of accounting, as are the proprietary fund and fiduciary fund financial statements. Agency fund financial statements have no measurement focus. Revenues are recorded when earned and expenses are recorded when a liability is incurred, regardless of the timing of related cash flows. Property taxes are recognized as revenue in the year for which they are levied. Grants and similar items are recognized as revenue as soon as all eligibility requirements imposed by the grantor or provider have been met. The governmental fund financial statements are reported using the current financial resources measurement focus and the modified accrual basis of accounting. Revenues are recognized as soon as they are both measurable and available. Revenues are considered to be available when they are collectible within the current period or soon enough thereafter to pay liabilities of the current period. For this purpose, revenues are considered available if they are collected within 60 days of the end of the current fiscal period. Principal revenue sources considered to be susceptible to accrual are property taxes, sales taxes, franchise taxes, licenses and permits, intergovernmental revenue and investment earnings associated with the current fiscal period. Charges for services, fines and forfeitures, and miscellaneous revenues are recorded as revenue when received as cash because they are generally not measurable until actually received. Expenditures generally are recorded when a liability is incurred, as under accrual accounting.
Since the governmental fund financial statements are presented on a different measurement focus and basis of accounting than the government-wide statements’ governmental activities column, a reconciliation is presented on the page following each fund statement. These reconciliations briefly explain the adjustments necessary to transform the fund financial statements into the governmental activities column of the government-wide presentation.

TOWN OF GILBERT, ARIZONA NOTES TO THE FINANCIAL STATEMENTS
June 30, 2012
40
The proprietary funds and the pension trust fund are reported using the economic resources measurement focus and the accrual basis of accounting (same basis as the government-wide financial statements). Gilbert’s business-type activities and enterprise funds follow Financial Accounting Standards Board (FASB) Statements and Interpretations issued on or before November 30, 1989; Accounting Principles Board Opinions; and Accounting Research Bulletins, unless those pronouncements conflict with GASB pronouncements. Gilbert has elected not to implement FASB Statements and Interpretations issued after November 30, 1989. Proprietary funds distinguish operating revenues and expenses from nonoperating items. Operating revenues and expenses generally result from providing services and producing and delivering goods in connection with a proprietary fund’s principal ongoing operations. The principal operating revenue of Gilbert’s internal service funds are charges to user departments for services provided. The principal operating revenue of Gilbert’s enterprise funds are user fees and charges to customers for water, wastewater, and solid waste services. Operating expenses for these funds include the cost of sales and services, administrative and payroll expenses, and depreciation. All revenues and expenses not meeting this definition are reported as nonoperating revenues and expenses. E. Fund Accounting Gilbert uses funds to report its financial position and the results of its operations. Fund accounting segregates funds according to their intended purpose and is designed to demonstrate legal compliance and to aid financial management by segregating transactions related to certain governmental functions or activities. A fund is a separate accounting entity with a self-balancing set of accounts, which includes assets, liabilities, fund equity, revenues and expenditures/expenses. Gilbert uses the following fund categories, further divided by fund type: Governmental Funds Governmental funds are those through which most of the governmental functions are financed. The measurement focus is based upon determination of changes in financial position rather than upon net income determination. Gilbert reports the following major governmental funds:
General Fund - The general fund is the primary operating fund and is used to account for all financial resources except those required to be accounted for in another fund. The general fund will always be considered a major fund in the basic financial statements. Streets Special Revenue Fund – The streets fund accounts for Gilbert’s portion of the Arizona Highway User Revenue Tax, Local Transportation Assistance Funds, and Vehicle License Taxes. The revenue is used exclusively for the maintenance and improvement of highways and streets. General Debt Service Fund – The general debt service fund accounts for the principal and interest requirements of general obligation, highway user revenue and municipal property corporation revenue bonds not recorded in proprietary funds. Financing is provided from the levy of secondary property taxes and revenue-supported transfers.
Special Assessments Debt Service Fund – The special assessments fund accounts for the principal and interest requirements of special assessment bonds not recorded in proprietary funds. Financing is provided by special assessment levies against benefited property owners.

TOWN OF GILBERT, ARIZONA NOTES TO THE FINANCIAL STATEMENTS
June 30, 2012
41
Streets and Transportation Capital Projects Fund – The streets and transportation fund accounts for the construction of roadway improvements. Municipal Facilities Capital Projects Fund – The municipal facilities fund accounts for the acquisition and construction of municipal facilities such as municipal buildings, libraries and fire stations. Parks, Open Space and Recreation Capital Projects Fund – The parks, open space and recreation fund accounts for the acquisition and construction of parks and recreation facilities.
Proprietary Funds Proprietary funds are used to account for Gilbert's ongoing activities which are similar to those found in the private sector and where cost recovery and the determination of net income is useful or necessary for sound fiscal management. The measurement focus is based upon determination of net income, changes in net assets, financial position and cash flows.
Gilbert reports the following major proprietary funds:
Water Fund – The water fund accounts for the revenues and expenses from the operation and maintenance of the domestic water system. Wastewater Fund – The wastewater fund accounts for the revenues and expenses from the operation of the sanitary wastewater collection and treatment and reclaimed water distribution system. Solid Waste Fund – The solid waste fund accounts for the revenues and expenses of operating the solid waste collection system.
Additionally, Gilbert reports the following fund types:
Internal Service Funds – The internal service funds account for operations that provide services to other departments on a cost-reimbursement basis. These services include maintenance of Gilbert’s motorized equipment, operation of centrally located copiers and self-insurance for employee benefit programs. Pension Trust Fund - The pension trust fund accounts for assets held by the government in a trustee capacity. The fund includes the assets and pension payments to retired volunteer firefighters and survivors. Agency Funds – The agency funds are used to account for assets held by the government as an agent for individuals, private organizations, other governments and/or other funds. Gilbert currently maintains an agency fund to account for monies collected from employees to pay medical and dependent care claims and monies collected from sworn fire employees for providing a monthly stipend for retirees to apply to the cost of their medical and/or dental insurance, medical and dental co-pays, and prescriptions and other benefits.

TOWN OF GILBERT, ARIZONA NOTES TO THE FINANCIAL STATEMENTS
June 30, 2012
42
F. Budgetary Data In January of each year, the Budget Division prepares a revenue estimate based upon local and state-shared revenue forecasts, historic trends, economic indicators, anticipated growth, and year-to-date revenue performance to develop guidelines for departments to follow in preparing budget requests. The Council is briefed on this information and asked to approve boundaries and priorities for consideration in the preparation of departmental requests. Simultaneously, departments develop operating budget requests and submit them to the Budget Division. Departments work with the Capital Improvement Program (CIP) Division to finalize project estimates for the CIP, and submit them to the Budget Division for funding. Estimates for trust and agency, debt service, maintenance improvement districts, and internal service funds are prepared by the Budget Division and submitted for review. In March, the Council is presented with a working budget request for preliminary review and discussion, and approves a schedule of hearings and dates for approval of the budget. A public hearing is held in May, in anticipation of the adoption of the final budget.
Prior to June 30 of each year, the Council adopts a preliminary budget as the maximum legal expenditure limit for the upcoming year. Council establishes dates for the final public hearing, the final adoption of the budget, and the setting of tax levies. The Council adopts the final tax levy and reports the levy amounts to Maricopa County for collection not later than the third Monday in August. The Council adopts the budget at the fund level as a total amount of expenditures. Financial control is administered by fund, with budgetary control for operating performance regulated at the departmental level within each fund. Grants and restricted appropriations are administered on a line item basis by department. By policy, the Manager is authorized to administer a budget adjustment process within a fund. Council action is required to approve any interfund adjustments and any contingency transactions. There were no supplemental appropriations during fiscal year 2012. All annual appropriations lapse at year-end and are considered for inclusion in the subsequent year’s budget. For fiscal year 2012, the Town adopted annual budgets for all governmental funds, except for the flood control and storm water capital projects fund. Gilbert prepares its budget on a basis generally consistent with GAAP, with certain exceptions as explained in Note 2. In addition, the financial statements present the budget and actual information for the departments at a summary level by function. G. Pooled Cash and Investments
Gilbert maintains pooled cash and investment accounts for funds that are not legally required to be maintained separately. Each fund's equity in pooled cash and investments represents that fund's position in the consolidated accounts and determines that fund's allocation of interest earned in the pool. The Arizona Revised Statutes regulate the investment of surplus cash. Gilbert limits its investments to the Local Government Investment Pool (managed by the Arizona State Treasurer), U.S. government securities, certificates of deposit, bonds, and money market accounts. Investments are stated at fair value based on quoted market prices and cash equivalents are stated at amortized cost.

TOWN OF GILBERT, ARIZONA NOTES TO THE FINANCIAL STATEMENTS
June 30, 2012
43
H. Inventories
Inventories are recorded in the parkway maintenance district fund, the equipment maintenance internal service fund, and the water enterprise fund. Inventories are recorded as assets when purchased and expensed when consumed. These inventories are stated at cost using the weighted average method. I. Restricted Assets
Certain bond proceeds, as well as certain resources set aside for their repayment, are classified as restricted on the balance sheet, or statement of net assets, because they are maintained in trust accounts and their use is limited by applicable debt covenants.
J. Capital Assets Capital assets, including public domain infrastructure (e.g., roads, bridges, sidewalks and similar assets), are defined as assets with an initial, individual cost of more than $10,000 and an estimated useful life greater than one year. All infrastructure, including infrastructure acquired prior to June 30, 1980, is reported. Capital assets are recorded at cost or estimated historical cost if purchased or constructed. Donated capital assets (including streets, water and wastewater lines installed by developers) are recorded at the estimated fair market value at the date of donation. Gain or loss is recognized when assets are retired from service or otherwise disposed.
The cost of normal maintenance and repairs that do not add to the value of the asset or materially extend its life are not capitalized. Major improvements are capitalized and depreciated over the remaining useful lives of the related capital assets. Major outlays for capital assets and improvements are capitalized as projects are constructed. Interest incurred during the construction phase of capital assets of business-type activities is included as part of the capitalized value of the assets constructed, if material. Capital assets are depreciated using the straight-line method based on the following estimated useful lives (land and construction-in-progress are not depreciated): Buildings 25 to 50 years Improvements 25 to 50 years Machinery and equipment 3 to 10 years Infrastructure 15 to 50 years Water rights 100 years K. Compensated Absences Annual leave is based on a graduated scale of years of employment and is credited to each employee as it accrues. Maximum annual leave hours varies according to years of employment and job class, and is either taken as time off from work or paid to employees upon separation or retirement. Sick leave accumulated in excess of 520 hours (728 hours for fire personnel) is convertible annually to a partial cash benefit. Sick leave is convertible to a cash benefit upon retirement or death of the employee (at 100%) or upon resignation (at 50%) when the employee has ten or more years of service (calculated at a 5 year average hourly rate).

TOWN OF GILBERT, ARIZONA NOTES TO THE FINANCIAL STATEMENTS
June 30, 2012
44
For the governmental funds, a liability for compensated absences is reported only if they have matured, for example, as a result of employee resignations and retirements. For the government-wide financial statements, as well as the proprietary fund financial statements, all of the outstanding compensated absences are recorded as a liability. L. Long-Term Obligations In the government-wide financial statements, and proprietary fund types in the fund financial statements, long-term debt and other long-term obligations are reported as liabilities in the applicable governmental activities, business-type activities, or proprietary fund type statement of net assets. Bond premiums and discounts, as well as issuance costs, are deferred and amortized over the life of the bonds using the effective interest method. Bonds payable are reported net of the applicable bond premium or discount. Bond issuance costs are reported as deferred charges and amortized over the term of the related debt. In the fund financial statements, governmental fund types recognize bond premiums and discounts, as well as bond issuance costs, during the current period. The face amount of debt issued is reported as an other financing source. Premiums received on debt issuances are reported as other financing sources while discounts on debt issuances are reported as other financing uses. Issuance costs, whether or not withheld from the actual debt proceeds received, are reported as debt service expenditures. The debt service funds are specifically established to account for and service the long-term obligations for the governmental funds and special assessment debt. Each enterprise fund individually accounts for and services the applicable bonds that benefit these funds. Long-term obligations are recognized as a liability of a governmental fund when due, or when resources have been accumulated for payment early in the following year. For other long-term obligations, only that portion expected to be financed from expendable available financial resources is reported as a fund liability of a governmental fund. M. Transactions Between Funds Transactions that would be recorded as revenues and expenditures/expenses if they involved entities external to the governmental unit are recorded as revenues and expenditures/expenses in the respective funds. Transactions constituting a reimbursement of a fund for expenditures/expenses originally recorded in that fund, but properly applicable to another fund, are recorded as expenditures/expenses in the reimbursing fund, and as reductions of the expenditures/expenses in the fund which is reimbursed, excluding indirect administrative costs which are recorded as revenues and expenditures/expenses in the related funds. Indirect administrative expenses represent overhead costs which have been allocated to the enterprise funds based upon a formula approved with the budget. All other interfund transactions are reported as transfers. Activity between funds that are representative of lending/borrowing arrangements outstanding at the end of the fiscal year are referred to as either “due to/from other funds” (i.e., the current portion of interfund loans) or “advances to/from other funds” (i.e., the non-current portion of interfund loans). Any residual balances outstanding between the governmental activities and business-type activities are reported in the government-wide financial statements as “internal balances”. Advances between funds, as reported in the fund financial statements, are offset by a fund balance reserve account in the applicable governmental funds to indicate that they are not available for appropriation and are not expendable available financial resources. See Note 5 for further discussion of the interfund receivables/payables at June 30.

TOWN OF GILBERT, ARIZONA NOTES TO THE FINANCIAL STATEMENTS
June 30, 2012
45
N. Property Tax Gilbert's property tax is adopted by the Council each year on or before the third Monday of August, based on the previous year's full cash value as of the lien date (January 1). Maricopa County, at no charge, levies and collects all property taxes. Levies are due and payable in two installments on September 1 and March 1 and become delinquent on November 1 and May 1, respectively. Public auctions of properties that have delinquent real estate taxes are held in February following the May 1 delinquency of the second installment. The purchaser is given a certificate of purchase, issued by the County Treasurer. Five years from the date of sale, the holder of a certificate of purchase, which has not been redeemed, may demand of the County Treasurer, a County Treasurer's Deed.
Gilbert does not levy property taxes for general operations (primary tax). Secondary property taxes are levied solely for the purpose of retiring the principal, interest, and servicing fees on voter approved general obligation bonded indebtedness. Gilbert may levy the amount deemed necessary to meet its bonded debt service requirements. By Council policy, Gilbert will not issue debt that would require a tax rate of more than $1.15 per $100 of assessed valuation.
O. Fund Balance Classifications GASB Statement No. 54, Fund Balance Reporting and Governmental Fund Type Definitions, was implemented during fiscal year 2011. This statement established new fund balance classifications for governmental funds. It changed the previous terminology of Reserved and Unreserved to five new classifications, which are Nonspendable, Restricted, Committed, Assigned, and Unassigned. These new classifications comprise a hierarchy based primarily on the extent to which Gilbert is bound to observe constraints imposed upon the use of the resources reported in the governmental funds. Nonspendable and Restricted fund balances represent the restricted classifications and Committed, Assigned and Unassigned represent the unrestricted classifications. Nonspendable fund balance includes amounts that cannot be spent because they are either (a) not in spendable form such as inventory or (b) legally or contractually required to be maintained intact. Restricted fund balance includes amounts that can only be used for specific purposes pursuant to constraints imposed externally by creditors, grantors, contributors, or laws or regulations of other governments; or imposed by law through constitutional provisions or enabling legislation. Committed fund balance includes amounts that can only be used for specific purposes pursuant to constraints imposed internally by formal action of the Council. Formal action by Council through resolution is required to establish, modify or rescind committed fund balance. Assigned fund balance includes amounts that are limited to specific purposes by management. Council authorized the Finance Director to assign fund balance amounts to a specific purpose. Unassigned fund balance represents the residual net resources in excess of the other classifications. The general fund is the only fund that can report a positive unassigned fund balance and any other governmental fund can report a negative unassigned fund balance. When an expenditure is incurred for purposes for which both restricted and unrestricted fund balance is available, as a general rule, restricted resources are considered spent before unrestricted. Within unrestricted, committed amounts would be reduced first, followed by assigned amounts (if available) and then unassigned amounts.

TOWN OF GILBERT, ARIZONA NOTES TO THE FINANCIAL STATEMENTS
June 30, 2012
46
As of June 30, 2012, the fund balance details by classification are listed below:
Major Major Streets
Special Revenue
Debt Service Funds Capital Projects Funds
Fund balances:
General Fund General
Special Assmnts Streets
Municipal Facilities Parks
Other Gov’t
Total Nonspendable:
Advances $23,208,408 - - - - - - - $23,208,408
Inventory - - - - - - - $1,666 1,666
Prepaid items 4,771 - - - - - - - 4,771
Restricted for:
Capital projects - - - - $46,753,842 $6,867,888 $14,646,416 6,132,825 74,400,971
Court/public safety programs - - - - - - - 1,812,303 1,812,303
Debt service - - $9,335,818 $64,017 - - - - 9,399,835
Grants - - - - - - - 3,701,522 3,701,522
Highways and streets - $10,700,623 - - - - - - 10,700,623
Special districts - - - - - - - 435,063 435,063
Other purposes - - - - - - - 121,638 121,638
Assigned to:
Capital replacement 10,031,620 4,752,017 - - - - - - 14,783,637
Capital projects - - - - - - - 127,916 127,916
Debt service - - 853,801 - - - - - 853,801
Highways and streets - - - - 20,212,551 - - - 20,212,551
Other purposes 765,920 - - - - - - 213,320 979,240
Unassigned: 44,249,663 - - - - (23,114,131) - (85,172) 21,050,360
Total fund balances $78,260,382 $15,452,640 $10,189,619 $64,017 $66,966,393 ($16,246,243) $14,646,416 $12,461,081 $181,794,305
P. Statement of Cash Flows
A statement of cash flows classifies cash receipts and payments according to whether they stem from operating, noncapital financing, capital and related financing, or investing activities. For purposes of the statement of cash flows, all highly liquid investments (including restricted assets) with an original maturity of three months or less when purchased are considered cash equivalents. Q. Use of Estimates The preparation of financial statements in conformity with GAAP requires management to make a number of estimates and assumptions that affect the reported amount of assets and liabilities and disclosure of contingent assets and liabilities at the date of the statement of net assets/balance sheet and the reported amounts of revenues and expenditures/expenses during the reporting period. Actual results could differ from those estimates.

TOWN OF GILBERT, ARIZONA NOTES TO THE FINANCIAL STATEMENTS
June 30, 2012
47
Note 2 - Budgetary Basis of Accounting
Budgetary comparison statements for the general fund and major special revenue funds are presented in the basic financial statements. These statements display original budget, amended budget and actual results. Budgetary comparison schedules are also included as supplementary schedules for the other governmental funds. The budgets for the proprietary funds are adopted on a basis other than GAAP. For these funds, the budgetary schedules include a reconciliation of the adjustments required to convert budgetary revenues and expenses to GAAP revenues and expenses. The primary differences between the GAAP and budget basis statements for the proprietary funds are: 1. Obligations for compensated absences and rebatable arbitrage are accrued on the GAAP basis but are
not recognized on the budget basis. 2. Capital outlays are not recognized as GAAP expenses but are recognized as expenses on the budget
basis. 3. Debt service principal payments are not recorded as expenses on the GAAP basis but are recognized
as expenses on the budget basis. 4. Depreciation and amortization of bond issuance costs are expensed on the GAAP basis but are not
recognized on the budget basis. 5. Capital assets contributed by developers are recognized as revenue on the GAAP basis but are not
recognized on the budget basis.
Note 3 - Deposits and Investments
The investment of public monies is regulated by Title 35 of the Arizona Revised Statutes. Gilbert limits its investments to the Local Government Investment Pool (managed by the Arizona State Treasurer), U.S. government securities, certificates of deposit, bonds, commercial paper, and money market accounts. Approximately one-third of Gilbert’s investments were in the State Treasurer’s Investment Pool. The State Board of Deposit provides oversight for the State Treasurer’s pools. The fair value of a participant’s position in the pool approximates the value of that participant’s pool shares. At June 30, 2012, Gilbert’s investments were as follows: Investment Maturities (in Years) Investment Type Fair Value Less than 1 1-4 U.S. Government Treasuries $ 54,884,340 $ - $ 54,884,340 U.S. Government Agencies 93,980,373 13,212,805 80,767,568 Commercial Paper 3,328,671 3,328,671 - Municipal Bonds 2,018,601 - 2,018,601 Corporate Notes
15,243,532 - 15,243,532
State Treasurer’s Investment Pool 90,078,129 27,751,842 62,326,287 Money Market – U.S. Treasuries: Wells Fargo 15,554,503 15,554,503 - Bank of NY Mellon 31,051,549 31,051,549 - Total $306,139,698 $90,899,370 $215,240,328

TOWN OF GILBERT, ARIZONA NOTES TO THE FINANCIAL STATEMENTS
June 30, 2012
48
Interest rate risk – Interest rate risk is the risk that changes in market interest rates will adversely affect the fair value of an investment. Generally, the longer the maturity of an investment, the greater the sensitivity of its fair value to changes in market interest rates. As a means of limiting its exposure to fair value losses arising from rising interest rates, Gilbert’s investment policy limits its investment portfolio to maturities of five years or less. Credit risk – Generally, credit risk is the risk that an issuer of an investment will not fulfill its obligation to the holder of the investment. Gilbert addresses credit risk through its investment policy by restricting the allowable investment instruments. As of June 30, 2012, the investments in the U.S. Government Agencies were rated AA+, the investment in Commercial Paper was rated A-1+, the investment in Municipal Bonds was rated AA, the investments in Corporate Notes ranged from A ratings to AA+ ratings, and the investment in Goldman Sachs Group Inc was rated AAAm. Gilbert’s investment in the State Treasurer’s Investment Pool did not receive a credit quality rating from a national rating agency. Custodial credit risk - deposits – Custodial credit risk is the risk that in the event of a bank failure, the Town’s deposits may not be returned to it. As of June 30, 2012, Gilbert’s bank balance was $66,267,277 of which $11,795,040 was with JP Morgan and $54,472,237 was with Alliance Bank of Arizona. $11,545,040 of JP Morgan’s bank balance was exposed to custodial credit risk because it was uninsured but collateralized with securities held by the pledging financial institution’s trustee. These securities are not in Gilbert’s name, but cannot be released without Gilbert’s authorization. At the end of each day, Gilbert’s bank account balance is transferred to a sweep account. This account is invested in U.S. Treasuries only. All of the Alliance Bank of Arizona bank balance was FDIC-insured through the Transaction Account Guarantee Program. Custodial credit risk - investments – The custodial credit risk for investments is the risk that, in the event of the failures of the counterparty (e.g. broker-dealer) to a transaction, Gilbert will not be able to recover the value of its investment or collateral securities that are in the possession of another party. Gilbert’s investment policy limits its exposure to custodial credit risk by requiring that all security transactions entered into by Gilbert be conducted on a delivery-versus-payment basis. Securities are to be held by a third party custodian. Gilbert’s investment in the State Treasurer’s Investment Pool represents a proportionate interest in the Pool’s portfolio; however, Gilbert’s portion is not identified with specific investments and is not subject to custodial credit risk. Concentration of credit risk - Gilbert’s investment policy contains no limitations on the amount that can be invested in any one issuer. As of June 30, 2012, of Gilbert’s investments, 31% are in U.S. Government Agencies, 29% are in the State Treasurer’s Investment Pool and 33% are in U.S. Government Treasuries. Reconciliation of pooled cash and investments as reported on the statement of net assets:
Primary government: Carrying amount of cash/deposits $ 64,075,714 Carrying amount of investments 306,139,698 Total cash and investments $370,215,412 Pooled cash and investments $279,103,089 Restricted cash and investments 90,852,842 Total cash and investments (per Statement of Net Assets) 369,955,931 Pension trust fund 99,625 Agency funds 159,856 Total cash and investments $370,215,412

TOWN OF GILBERT, ARIZONA NOTES TO THE FINANCIAL STATEMENTS
June 30, 2012
49
Note 4 - Taxes Receivable and Due from Other Governments
The general fund taxes receivable amount at June 30, 2012, includes $1,383,268 in state shared sales tax and $2,737,791 in local sales tax due from the State of Arizona. Amounts due from other governments recorded in the streets special revenue fund include $1,014,085 in highway user revenues and $250,431 in vehicle license tax both due from the State of Arizona. Other governmental funds include $500,403 in federal grants from the U.S. Department of Housing and Urban Development, $926,459 from the U.S. Department of Energy, and $93,435 from the U.S. Department of Homeland Security. The balance of these receivables represents various grants from the state and federal governments. Note 5 – Interfund Receivables and Payables The composition of interfund balances as of June 30, 2012, is as follows: Due to/from other funds are short-term loans that cover cash deficits and are recorded in the following funds: Due To Due From General fund $ - $489,782 Other governmental funds 489,782 - Total $489,782 $489,782 Advances from/to other funds are long-term loans that cover cash deficits for capital expenditures and are recorded in the following funds: Advance from Advance to General fund $ - $23,208,408 Municipal facilities capital projects fund 23,208,408 - Total $23,208,408 $23,208,408

TOWN OF GILBERT, ARIZONA NOTES TO THE FINANCIAL STATEMENTS
June 30, 2012
50
Note 6 – Capital Assets A summary of changes in capital assets for governmental activities, for the fiscal year ended June 30, 2012, is as follows:
July 1, 2011 Additions Deletions June 30, 2012 Non-depreciable assets: Land $ 171,914,361 1,523,716 - 173,438,077 Construction-in-progress 31,286,075 30,391,053 (43,576,048) 18,101,080 Total non-depreciable assets 203,200,436 31,914,769 (43,576,048) 191,539,157 Depreciable assets: Buildings 212,698,533 3,962,046 - 216,660,579 Improvements other than buildings 68,088,459 1,566,380 - 69,654,839 Machinery and equipment 57,566,155 1,057,360 (4,452,879) 54,170,636 Infrastructure 887,246,242 41,752,231 - 928,998,473 Total depreciable assets 1,225,599,389 48,338,017 (4,452,879) 1,269,484,527 Less accumulated depreciation: Buildings (50,707,370) (8,541,507) - (59,248,877) Improvements other than buildings (25,223,684) (3,791,336) - (29,015,020) Machinery and equipment (38,804,687) (4,098,534) 4,340,240 (38,562,981) Infrastructure (331,313,584) (31,389,569) - (362,703,153) Total accumulated depreciation (446,049,325) (47,820,946) 4,340,240 (489,530,031) Total depreciable assets, net 779,550,064 517,071 (112,639) 779,954,496 Governmental activities capital
assets, net
$
982,750,500
32,431,840
(43,688,687)
971,493,653 Governmental activities construction-in-progress and related construction commitments at June 30, 2012, were composed of the following: Construction-
in-progress Commitments
Redevelopment $ 864,309 $ 466,930 Municipal facilities 1,704,836 107,746 Parks 734,464 314,364 Storm water 42,129 - Traffic control 872,405 14,315 Streets capital projects 13,882,937 12,869,499 Total $ 18,101,080 $ 13,772,854
In addition, there were non-construction related commitments at June 30, 2012, as follows: General $ 765,920 Streets special revenue 229,119 Other governmental 323,255 Total $ 1,318,294

TOWN OF GILBERT, ARIZONA NOTES TO THE FINANCIAL STATEMENTS
June 30, 2012
51
Depreciation expense was charged to governmental functions in the government-wide financial statement as follows:
Management and policy $ 66,391 Support services 480,487 Legal and court 628,373 Development services 892,084 Police 2,991,396 Fire 3,066,694 Highways and streets 32,482,642 Community services 7,172,037 Total depreciation expense not including internal service funds 47,780,104 Capital assets held by the government’s internal service funds are charged to the various functions based on their usage of the assets 40,842 Total depreciation expense - governmental activities $47,820,946 A summary of changes in capital assets for business-type activities, for the fiscal year ended June 30, 2012, is as follows:
July 1, 2011 Additions Deletions June 30, 2012
Non-depreciable assets: Land $ 45,923,688 4,779,561 - 50,703,249 Construction-in-progress 3,513,610 8,731,038 (9,200,508) 3,044,140 Total non-depreciable assets 49,437,298 13,510,599 (9,200,508) 53,747,389 Depreciable assets: Plant and equipment 131,252,470 227,858 (394,452) 131,085,876 Water rights 9,146,281 - - 9,146,281 Infrastructure 400,813,517 8,903,481 - 409,716,998 Total depreciable assets 541,212,268 9,131,339 (394,452) 549,949,155 Less accumulated depreciation:
Plant and equipment (41,370,150) (5,995,525) 394,452 (46,971,223) Water rights (1,495,827) (98,292) - (1,594,119) Infrastructure (96,346,395) (10,453,823) - (106,800,218) Total accumulated depreciation
(139,212,372)
(16,547,640)
394,452
(155,365,560)
Total depreciable assets, net 401,999,896 (7,416,301) - 394,583,595 Business-type activities
capital assets, net
$
451,437,194
6,094,298
(9,200,508)
448,330,984

TOWN OF GILBERT, ARIZONA NOTES TO THE FINANCIAL STATEMENTS
June 30, 2012
52
Business-type activities construction-in-progress and related construction commitments at June 30, 2012, are composed of the following: Construction-
in-progress Commitments
Water system $ 2,158,346 $ 5,456,610 Wastewater system 885,794 - Total $ 3,044,140 $ 5,456,610
Note 7 - Risk Management Traditional Commercial Insurance Programs Gilbert operates with traditional commercial insurance programs against major losses in property, plant, equipment, and liability. Administrative responsibility for the safety program, education, and loss prevention resides with the Human Resources Department. Insurance is procured on a competitive quotation basis, using the services of an independent broker as a consultant. Gilbert processes all claims and evaluates their validity to determine if insurance reporting is warranted, or if the claim can be resolved administratively. Claims settled administratively, which are generally less than the deductibles of the appropriate policy, are paid from the funds where the claims occurred. During fiscal year 2012, there was no reduction in insurance coverage from prior years. Additionally, settlements have not exceeded insurance coverage during any of the last three fiscal years. Self-Insurance Gilbert has established an employee benefit self-insurance trust to account for and finance its uninsured risks of loss for medical claims. Gilbert purchases commercial stop loss insurance to limit the claims liability to the employee benefit self-insurance fund. The stop loss insurance provides specific (individual member) coverage for medical claims incurred in excess of $250,000 with an additional $75,000 risk retention. During fiscal year 2012, the plan received recoveries for $2,363 through specific stop loss coverage for prior year claims. The stop loss deductible was not reached for any members for claims incurred in fiscal year 2012, so no recoveries are attributable to the fiscal year 2012 policy. Claim settlements did not exceed insurance coverage during any of the last three fiscal years. Premiums are paid into the employee benefit self-insurance trust by all other funds and are available to pay claims and administrative costs of the program and fund claim reserves. As with any risk retention program, Gilbert is contingently liable with respect to claims beyond those actuarially projected. The claims liability of $1,244,571 reported in the employee benefit self-insurance trust at June 30, 2012, is based on the requirements of Governmental Accounting Standards Board Statement No. 10, which requires that a liability be reported when it is probable that a loss has occurred and the amount of the loss can be reasonably estimated. Liabilities include an amount for claims that have been incurred but not reported (IBNR). The employee benefit self-insurance trust includes medical and dental benefits. For fiscal year 2012, an increase of $157,721 was added for IBNR claims under the medical plan and an increase of $6,409 was added for IBNR claims under the dental plan. Claim liabilities are calculated considering the effects of inflation, recent claim settlement trends including frequency and amount of payouts and other economic and social factors. Fiscal year 2012 reflects an increase in claims costs from fiscal year 2011. Of the $2,246,964 increase in claims costs during fiscal year 2012, $2,109,546 was attributable to medical benefits and $137,418 was attributable to dental benefits.

TOWN OF GILBERT, ARIZONA NOTES TO THE FINANCIAL STATEMENTS
June 30, 2012
53
Changes in the fund’s claim liability amount in fiscal years 2011 and 2012 were:
Year Ended,
June 30
Claim Liability at Beginning of Fiscal Year
Fiscal Year Claims and Changes in Estimates
Fiscal Year Claim
Payments
Claim Liability at End of
Fiscal Year 2011 $ 988,431 11,259,687 11,167,677 $1,080,441 2012 $ 1,080,441 13,506,651 13,342,521 $1,244,571
Note 8 - Long-Term Debt
General Obligation Bonds Gilbert issues general obligation bonds to provide funds for the acquisition and construction of major capital facilities. General obligation bonds have been issued for both governmental and business-type activities. General obligation bonds are direct obligations and pledge the full faith and credit of Gilbert. General obligation bonds outstanding at June 30, 2012, were as follows (the 7/1/12 principal payment was deducted as fiscal year 2012 resources were dedicated):
Governmental Business-type 2002 General Obligation Refunding Bonds, 3.5% to 5.75%, original amount $20,960,000, annual retirements due July 1, 2003, through July 1, 2015 $ - $3,870,000 2005 General Obligation Refunding Bonds, 3.0% to 5.0%, original amount $14,115,000, annual retirements due July 1, 2006, through July 1, 2016 11,715,000 - 2008 General Obligation Bonds, 3.0% to 5.0%, original amount $187,990,000, annual retirements due July 1, 2009, through July 1, 2023 147,750,000 - Total $159,465,000 $3,870,000
Annual debt service requirements to maturity for general obligation bonds are as follows: Year Ending Governmental Activities Business-type Activities June 30 Principal Interest Principal Interest
2013 $ 11,900,000 $ 7,177,000 $1,760,000 $ 222,525 2014 12,500,000 6,592,000 1,865,000 121,325 2015 12,350,000 5,967,000 245,000 14,088 2016 17,465,000 5,349,500 - - 2017 13,200,000 4,476,250 - - 2018-2022 75,050,000 12,005,000 - - 2023 17,000,000 510,000 - - Total $159,465,000 $42,076,750 $3,870,000 $ 357,938

TOWN OF GILBERT, ARIZONA NOTES TO THE FINANCIAL STATEMENTS
June 30, 2012
54
Under the provisions of the Arizona Constitution, outstanding general obligation bonded debt for combined water, wastewater, electric, parks and open space, streets, and public safety purposes may not exceed 20% of Gilbert's net secondary assessed valuation, nor may outstanding general obligation bonded debt for all other purposes exceed 6% of Gilbert's net secondary assessed valuation. In November 2006, voters amended the constitution to move streets, fire, and police from the six percent bond type to the twenty percent bond type. The following is a summary of legal borrowing capacity at June 30, 2012:
Water, Wastewater, Electric, Streets, Fire, Police, and Parks All Other General and Open Space Purposes Bonds Obligation Bonds Secondary Assessed Valuation $1,675,360,422 Secondary Assessed Valuation $1,675,360,422 20% constitutional limit 335,072,084 6% constitutional limit 100,521,625 Less general obligation Less general obligation bonds outstanding (163,335,000) bonds outstanding - Available 20% limitation Available 6% limitation borrowing capacity $171,737,084 borrowing capacity $100,521,625
As of June 30, 2012, Gilbert had authorized, but unissued bonds, approved by the voters as follows:
Revenue bonds Water and wastewater $ 1,110,000 Electric 27,500,000 Total $28,610,000 General obligation bonds 6% bond type $ 290,000 20% bond type 82,769,000 Total $83,059,000
Bond authorization elections on October 18, 1988, November 6, 2001, March 14, 2006, and November 6, 2007, authorized the 6% bond type and the 20% bond type to be issued as general obligation or revenue debt. Special Assessment Bonds with Governmental Commitment As trustee for the improvement districts, Gilbert is responsible for collection of assessments levied against the owners of property within the improvement districts and for disbursement of these amounts for retirement of the respective bonds issued to finance the improvements. At June 30, 2012, the special assessments receivable, together with amounts paid in advance and interest to be received over the life of the assessment period, are adequate for the scheduled maturities of the bonds payable and the related interest. Special assessment bonds are collateralized by properties within the districts. In the event of default by the owner, Gilbert may enforce an auction sale to satisfy the debt service requirements of the improvement bonds. Gilbert is contingently liable on special assessment bonds to the extent that proceeds from auction sales are insufficient to retire outstanding bonds.

TOWN OF GILBERT, ARIZONA NOTES TO THE FINANCIAL STATEMENTS
June 30, 2012
55
Special assessment bonds outstanding at June 30, 2012, were as follows (the 7/1/12 principal bond call was deducted as fiscal year 2012 resources were dedicated):
Governmental
2002 Improvement District #19 Bonds, 5.2%, original amount $6,510,000, annual retirements due January 1, 2005 through January 1, 2027 $ 2,640,000 2009 Improvement District #20 Bonds, 5.1%, original amount $8,675,000, annual retirements due January 1, 2012 through January 1, 2029 8,375,000 Total $11,015,000
Annual debt service requirements to maturity for special assessment bonds are as follows:
Year Ending Governmental Activities June 30 Principal Interest
2013 $ 435,000 $ 553,258 2014 470,000 530,065 2015 475,000 505,845 2016 500,000 480,858 2017 540,000 454,205 2018-2022 3,145,000 1,814,842 2023-2027 4,075,000 897,177 2028-2029 1,375,000 70,763 Total $11,015,000 $5,307,013
Street and Highway User Revenue Bonds Street and highway user revenue bonds are issued specifically for the purpose of street and highway construction projects. These bonds are payable solely from the revenues derived from highway user taxes, including motor vehicle fuel taxes and all other taxes; fees and charges relating to registration, operation or use of vehicles on public highways or streets; or to fuels or any other energy source used for the vehicles collected by the State and returned to Gilbert. Street and highway user revenue bonds outstanding at June 30, 2012, were as follows (the 7/1/12 principal payment was deducted as fiscal year 2012 resources were dedicated):
Governmental
2003 Street and Highway User Revenue Bonds, 3.75% to 5.00% original amount $35,000,000, annual retirements due July 1, 2004, through July 1, 2013 $ 2,525,000 2012 Street and Highway User Revenue Refunding Bonds, 3.00% to 5.00% original amount $16,945,000, annual retirements due July 1, 2014, through July 1, 2019 16,945,000 Total $19,470,000

TOWN OF GILBERT, ARIZONA NOTES TO THE FINANCIAL STATEMENTS
June 30, 2012
56
Annual debt service requirements to maturity for street and highway user revenue bonds are as follows:
Year Ending Governmental Activities June 30 Principal Interest
2013 $ 2,525,000 $ 807,400 2014 2,030,000 693,450 2015 2,750,000 632,550 2016 2,845,000 550,050 2017 2,975,000 436,250 2018-2019 6,345,000 479,750 Total $19,470,000 $ 3,599,450
Utility Revenue Bonds Water and wastewater revenue bonds are issued as authorized by the voters to provide funds to acquire and construct certain improvements to the water and wastewater systems and to pay the costs incurred in connection with the issuance of the bonds. These bonds are secured by a pledge of revenues from these enterprises, and do not constitute a general obligation of Gilbert backed by the general taxing authority (see also Note 15). Revenue bonds outstanding at June 30, 2012, were as follows (the 7/1/12 principal payment was deducted as fiscal year 2012 resources were dedicated):
Business-type 2004 Water and Wastewater Revenue Refunding Bonds, 2.0% to 5.0%, original amount $25,225,000, annual retirements due July 1, 2004 through July 1, 2022 $15,410,000
Annual debt service requirements to maturity for revenue bonds are as follows:
Year Ending Business-type Activities June 30 Principal Interest
2013 $ 1,430,000 $ 681,662 2014 1,500,000 610,162 2015 1,585,000 535,163 2016 1,660,000 455,913 2017 1,745,000 372,912 2018-2022 7,490,000 956,688 Total $15,410,000 $3,612,500
Municipal Property Corporation (MPC) Revenue Bonds The Public Facilities MPC exists solely for the purpose of financing the multipurpose public safety complex (the 2001 issue); the service center facility, a police property facility and a sports complex (the 2006 issue); and the cost of acquisition of certain interests in real property to locate public safety and parks and recreation facilities and the costs of design, construction and outfitting of parks and recreation facilities and a parking facility (the 2009 issue). The Water MPC exists solely for the purpose of financing the construction of water and wastewater capital improvement projects. (See also Note 15 regarding Pledged Revenues.)

TOWN OF GILBERT, ARIZONA NOTES TO THE FINANCIAL STATEMENTS
June 30, 2012
57
Municipal property corporation revenue bonds outstanding at June 30, 2012, were as follows (the 7/1/12 principal payment was deducted as fiscal year 2012 resources were dedicated):
Governmental Business-type
2001 Public Facilities Municipal Property Corporation Revenue Bonds, 2.375% to 5.0%, original amount $39,715,000, retirements due July 1, 2003, through July 1, 2013 $ 205,000 -
2006 Public Facilities Municipal Property Corporation Revenue Bonds, 3.5% to 5.0%, original amount $73,420,000, retirements due July 1, 2007, through July 1, 2021 49,595,000 - 2007 Water Resources Municipal Property Corporation, Water System Development Fee and Subordinate Lien Water Utility Revenue Bonds, 4.0% to 5.0%, original amount $146,175,000, retirements due October 1, 2008, through October 1, 2032 - 118,895,000 2009 Public Facilities Municipal Property Corporation Revenue Bonds, 3.0% to 5.5%, original amount $80,585,000, retirements due July 1, 2009 through July 1, 2028 71,210,000 - 2011 Public Facilities Municipal Property Corporation Revenue Refunding Bonds, 3.0% to 4.75%, original amount $20,980,000, retirements due July 1, 2013 through July 1, 2021 20,980,000 - Total $141,990,000 $118,895,000
Annual debt service requirements to maturity for municipal property corporation revenue bonds are as follows: Year Ending Governmental Activities Business-type Activities June 30 Principal Interest Principal Interest
2013 $ 9,695,000 $ 6,873,353 $ 3,700,000 $ 5,726,888 2014 10,080,000 6,458,288 3,875,000 5,551,388 2015 7,515,000 6,028,788 4,075,000 5,352,638 2016 7,950,000 5,700,138 4,275,000 5,143,888 2017 8,950,000 5,330,088 4,500,000 4,924,513 2018-2022 52,085,000 19,037,073 26,225,000 20,910,685 2023-2027 34,515,000 9,552,500 33,425,000 13,719,500 2028-2032 11,200,000 616,000 38,820,000 4,496,994 Total $141,990,000 $59,596,228 $118,895,000 $65,826,494
During the fiscal year ended June 30, 2012, Gilbert paid $15,620,000 of the 2004 Water Resources Municipal Property Corporation, Wastewater System Development Fee and Subordinate Lien Wastewater Utility Revenue Bonds and $5,205,000 of the 2007 Water Resources Municipal Property Corporation, Water System Development Fee and Subordinate Lien Water Utility Revenue Bonds. Proceeds collected from the wastewater and water system development fees were deposited in an irrevocable trust with an escrow agent to provide for the future debt service payments of the bonds. Accordingly, the trust account assets and the liability for these bonds are not included in the financial statements. These bonds have been fully defeased.

TOWN OF GILBERT, ARIZONA NOTES TO THE FINANCIAL STATEMENTS
June 30, 2012
58
Changes in Long-term Liabilities Long-term liability activity for the year ended June 30, 2012, was as follows:
Balance
July 1, 2011
Additions
Reductions Balance
June 30, 2012 Due Within
One Year Governmental activities: Bonds payable: General obligation bonds $178,635,000 - (19,170,000) 159,465,000 11,900,000 Special assessment bonds with government commitment 11,415,000
-
(400,000)
11,015,000
435,000
Revenue bonds 186,195,000 37,925,000 (53,325,000) 170,795,000 11,860,000 Unamortized bond premium 3,025,757 4,110,575 (373,412) 6,762,920 - Unamortized charge - refunding
bonds (839,543)
(2,006,798)
66,072
(2,780,269)
- Total bonds payable 378,431,214 40,028,777 (73,202,340) 345,257,651 24,195,000 Compensated absences 8,974,374 7,448,439 (6,643,935) 9,778,878 3,637,231 Total long-term liabilities $387,405,588 47,477,216 (79,846,275) 355,036,529 27,832,231 Business-type activities: Bonds payable: General obligation bonds $ 5,530,000 - (1,660,000) 3,870,000 - Revenue bonds 160,065,000 - (25,760,000) 134,305,000 3,700,000 Unamortized bond discount (69,696) - 28,449 (41,247) - Unamortized bond premium 529,335 - (45,509) 483,826 - Unamortized charge - refunding
bonds (786,181)
-
65,022 (721,159)
- Total bonds payable 165,268,458 - (27,372,038) 137,896,420 3,700,000 Compensated absences 1,564,366 1,514,428 (1,250,132) 1,828,662 706,592 Total long-term liabilities $166,832,824 1,514,428 (28,622,170) 139,725,082 4,406,592
Internal service funds predominantly serve the governmental funds. Accordingly, long-term liabilities for them are included as part of the above totals for governmental activities. At year-end, $154,383 of internal service funds compensated absences are included in the above amounts. Long-term compensated absences of governmental activities are expected to be liquidated by the operating funds (primarily the general fund and the streets special revenue fund) as they come due. Conduit Debt Obligations The Industrial Development Authority, a discretely presented component unit of the Town of Gilbert, has issued Industrial Revenue Bonds to provide financial assistance to private sector entities for the acquisition and construction of industrial and commercial facilities deemed to be in the public interest. Neither Gilbert, Maricopa County nor the State of Arizona shall in any event be liable for payment of principal, premium or interest on these bonds, and accordingly they have not been reported in the accompanying combined financial statements. At June 30, 2012, Industrial Development Authority Revenue Bonds outstanding were $3,569,111.

TOWN OF GILBERT, ARIZONA NOTES TO THE FINANCIAL STATEMENTS
June 30, 2012
59
Note 9 – Refunding Bonds On July 26, 2011, Gilbert Public Facilities MPC issued $20,980,000 of revenue refunding bonds with a net premium of $1,896,084 to advance refund $21,670,000 of outstanding Series 2001 Public Facilities MPC revenue bonds. The Series 2011 Public Facilities MPC revenue refunding bonds were issued with an average interest rate of 4.22 percent. Gilbert realized net proceeds of $22,757,872, after payment of $118,537 for underwriting fees. These proceeds were provided to an escrow trustee to pay issuance costs of approximately $110,000 with remaining $22,647,547 used to provide cash and purchase United States government securities. The cash and government securities were deposited in an irrevocable trust to provide for all future debt service payments of the Series 2001 refunded bonds. As a result, the refunded bonds are considered to be defeased and the liability for those bonds has been removed. The purpose of the refunding was to take advantage of lower interest rates thereby reducing future debt service payments. The refunding will reduce debt service payments by $1,697,106 over the next 9 years producing an economic gain (difference between present value of old and new debt service payments) of $1,493,115. On June 21, 2012, Gilbert issued $16,945,000 of street and highway user revenue refunding bonds with a net premium of $2,214,491 to advance refund $17,950,000 of outstanding Series 2003 street and highway user revenue bonds. The Series 2012 street and highway user revenue refunding bonds were issued with an average interest rate of 4.36 percent. Gilbert realized net proceeds of $19,106,187, after payment of $55,241 for underwriting fees. These proceeds were provided to an escrow trustee to pay issuance costs of approximately $125,000 with remaining $18,979,251 used to provide cash and purchase United States government securities. The cash and government securities were deposited in an irrevocable trust to provide for all future debt service payments of the Series 2003 refunded bonds. As a result, the refunded bonds are considered to be defeased and the liability for those bonds has been removed. The purpose of the refunding was to take advantage of lower interest rates thereby reducing future debt service payments. The refunding will reduce debt service payments by $1,174,675 over the next 7 years producing an economic gain (difference between present value of old and new debt service payments) of $1,140,937. Note 10 - Retirement and Pension Plans
Plan Descriptions and Financial Reports Gilbert contributes to three retirement plans described below. Benefits are established by state statute and generally provide retirement, long-term disability, and health insurance premium benefits including death and survivor benefits. The retirement benefits are generally paid at a percentage, based on years of service, of the retirees’ average compensation. Long-term disability benefits vary by circumstance, but generally pay a percentage of the employee’s monthly compensation. Health insurance premium benefits are generally paid as a flat dollar amount per month towards the retiree’s health care insurance premiums, in amounts based on whether the benefit is for the retiree or for the retiree and dependents.
The Arizona State Retirement System (ASRS) administers cost-sharing multiple-employer defined benefit pension, health insurance premium, and long-term disability plans that cover employees of the State of Arizona and participating political subdivisions and school districts. The ASRS is governed by the Arizona State Retirement System Board according to the provisions of A.R.S. Title 38, Chapter 5, Article 2. The system issues a publicly available financial report that includes financial statements and required supplementary information. This report may be obtained by writing to the Arizona State Retirement System, 3300 N. Central Ave., P.O. Box 33910, Phoenix, Arizona, 85067-3910 or by calling (602) 240-2000 or 1 (800) 621-3778.

TOWN OF GILBERT, ARIZONA NOTES TO THE FINANCIAL STATEMENTS
June 30, 2012
60
The Public Safety Personnel Retirement System (PSPRS) administers agent multiple-employer defined benefit pension and health insurance premium plans that cover public safety personnel who are regularly assigned hazardous duty as employees of the State of Arizona or one of its political subdivisions. The PSPRS, acting as a common investment and administrative agent, is governed by a five-member board, known as The Fund Manager, and the participating local boards according to the provisions of A.R.S. Title 38, Chapter 5, Article 4. The PSPRS issues a publicly available financial report that includes financial statements and required supplementary information. This report may be obtained by writing to the Public Safety Personnel Retirement System, 3010 East Camelback Road, Suite 200, Phoenix, Arizona 85016-4416, or by calling (602) 255-5575. The Elected Officials’ Retirement Plan (EORP) administers cost-sharing multiple-employer defined benefit pension and health insurance premium plans that cover State of Arizona and County elected officials and judges, and elected officials of participating municipalities. The Fund Manager of the PSPRS is the administrator for the EORP which was established by A.R.S. Title 38, Chapter 5, Article 3. Because the health insurance premium plan benefit of the EORP is not established as a formal trust, it is reported in accordance with GASB Statement No. 45 as an agent multiple-employer plan. Accordingly, the disclosures that follow reflect the EORP as if it were an agent multiple-employer plan. EORP issues a publicly available financial report that includes financial statements and required supplementary information. This report may be obtained by writing to the Elected Officials’ Retirement Plan, 3010 East Camelback Road, Suite 200, Phoenix, Arizona 85016-4416, or by calling (602) 255-5575.
Funding Policy The Arizona State Legislature establishes and may amend active plan members’ and their employers’ contribution rates for all plans of the ASRS, PSPRS, and EORP. Cost-sharing plans - For the year ended June 30, 2012, active ASRS members were required by statute to contribute at the actuarially determined rate of 10.74% (10.5% for retirement and 0.24% for long-term disability) of the members’ annual covered payroll and Gilbert was required by statute to contribute at the actuarially determined rate of 10.74% (9.87% for retirement, 0.63% for health insurance premium, and 0.24% for long-term disability) of the members’ annual covered payroll. Gilbert’s contributions for the current and two preceding years, all of which were equal to the required contributions, were as follows: Fiscal Year Retirement Health Benefit Long-Term Ended Fund Supplement Fund Disability Fund 2012 $ 3,658,186 $233,501 $ 96,821 2011 3,236,934 211,964 89,656 2010 3,085,526 244,178 147,470 Agent plans - For the year ended June 30, 2012, active PSPRS members were required by statute to contribute 8.65% of police member’s annual covered payroll and 7.65% for fire member’s annual covered payroll. Gilbert was required to contribute at the actuarially determined rate of 14.64% for police personnel, of which 0.54% was the health insurance premium portion; and 10.85% for fire personnel, of which 0.48% was the health insurance premium portion. Active EORP members were required by statute to contribute 10% of the members’ annual covered payroll; and Gilbert was required to remit a designated portion of certain court fees plus additional contributions at the actuarially determined rate of 32.99% of the members’ annual covered payroll, of which 1.79% was the health insurance premium portion.

TOWN OF GILBERT, ARIZONA NOTES TO THE FINANCIAL STATEMENTS
June 30, 2012
61
Actuarial methods and assumptionsThe contribution requirements for the year ended June 30, 2012, were established by the June 30, 2010 actuarial valuations, and those actuarial valuations were based on the following actuarial methods and assumptions. Actuarial valuations involve estimates of the value of reported amounts and assumptions about the probability of events in the future. Amounts determined regarding the funded status of the plans and the annual required contributions are subject to continual revision as actual results are compared to past expectations and new estimates are made. The required schedule of funding progress presented below provides multiyear trend information that shows whether the actuarial value of the plans’ assets are increasing or decreasing over time relative to the actuarial accrued liability for benefits. Projections of benefits are based on 1) the plans as understood by Gilbert and plan members and include the types of benefits in force at the valuation date, and 2) the pattern of sharing benefit costs between Gilbert and plan members to that point. Actuarial calculations reflect a long-term perspective and employ methods and assumptions that are designed to reduce short-term volatility in actuarial accrued liabilities and the actuarial value of assets. The significant actuarial methods and assumptions used are the same for all plans and related benefits (unless noted), and the actuarial methods and assumptions used to establish the fiscal year 2012 contribution requirements, are as follows: Actuarial valuation date June 30, 2010 Actuarial cost method Projected unit credit Amortization method Level percent closed for unfunded actuarial accrued liability, open for excess Remaining amortization period 26 years for underfunded actuarial accrued liability, 20 years for excess Asset valuation method 7-year smoothed market value Actuarial assumptions: Investment rate of return 8.5% Projected salary increases 5.5% - 8.5% for PSPRS and 5.0% for EORP Payroll growth 5.5% for PSPRS and 5.0% for EORP Annual Pension/OPEB Cost – Gilbert’s pension/OPEB cost for the agent plans for the year ended June 30, 2012, and related information follows (actual contributions made were equal to the annual pension/OPEB cost): PSPRS-Police PSPRS-Fire EORP Pension $2,337,045 $1,391,121 $51,135 Health Insurance 89,504 64,391 2,934

TOWN OF GILBERT, ARIZONA NOTES TO THE FINANCIAL STATEMENTS
June 30, 2012
62
Trend InformationAnnual pension cost information for the current and two preceding years follows for each of the agent plans. Percentage of Fiscal Year Annual Pension/ Annual Cost Net Pension/ Plan Ended OPEB Cost Contributed OPEB Obligation PSPRS-Police Pension 2012 $ 2,439,689 100.0% -0- 2011 2,496,320 100.0% -0- 2010 2,267,067 100.0% -0- Health Insurance 2012 97,156 100.0% -0- 2011 92,055 100.0% -0- 2010 75,123 100.0% -0- PSPRS-Fire Pension 2012 $ 1,297,068 100.0% -0- 2011 1,422,492 100.0% -0- 2010 1,427,182 100.0% -0- Health Insurance 2012 62,951 100.0% -0- 2011 57,488 100.0% -0- 2010 44,283 100.0% -0- EORP Pension 2012 $51,135 100.0% -0- 2011 45,923 100.0% -0- 2010 41,427 100.0% -0- Health Insurance 2012 2,934 100.0% -0- 2011 2,901 100.0% -0- 2010 2,999 100.0% -0- Schedule of Funded Status and Funding ProgressFollowing are the schedules of funded status and funding progress of the plans as of the most recent valuation date, June 30, 2012, and the previous two fiscal years. The fiscal year 2012 actuarial methods and assumptions used for the schedules are not significantly different than the fiscal year 2010 actuarial methods and assumptions as described on page 61. The EORP, by statute, is a cost-sharing plan. However, because of its statutory construction, in accordance with GASB Statement No. 43, the EORP is reported for such purposes as an agent multiple-employer plan. The Fund Manager obtains an actuarial valuation for the EORP on its statutory basis as a cost-sharing plan and, therefore, actuarial information for Gilbert, as a participating government, is not available. PSPRS - Police (1) (2) (3) (4) (5) (6) Funding Excess Actuarial Actuarial Actuarial Funding (Unfunded Liability) Valuation Value of Accrued (Liability) Funded Annual As Percentage of Date Plan Liability Excess Ratio Covered Covered Payroll June 30 Assets (AAL) (1)-(2) (1)/(2) Payroll (3)/(5)____ Pension 2012 $ 46,823,028 61,175,480 (14,352,452) 76.5% 16,652,610 (86.2)% 2011 40,140,063 53,624,989 (13,484,926) 74.9% 16,176,077 (83.4)% 2010 35,764,039 45,612,797 ( 9,848,758) 78.4% 16,588,316 (59.4)%

TOWN OF GILBERT, ARIZONA NOTES TO THE FINANCIAL STATEMENTS
June 30, 2012
63
(1) (2) (3) (4) (5) (6) Funding Excess
Actuarial Actuarial Actuarial Funding (Unfunded Liability) Valuation Value of Accrued (Liability) Funded Annual As Percentage of Date Plan Liability Excess Ratio Covered Covered Payroll June 30 Assets (AAL) (1)-(2) (1)/(2) Payroll (3)/(5)____ Health Insurance 2012 $ -0- 1,663,617 (1,663,617) 0.0% 16,652,610 (9.99)% 2011 -0- 1,575,279 (1,575,279) 0.0% 16,176,077 (9.74)% 2010 -0- 1,190,829 (1,190,829) 0.0% 16,588,316 (7.18)% PSPRS - Fire (1) (2) (3) (4) (5) (6) Funding Excess Actuarial Actuarial Funding (Unfunded Liability) Valuation Actuarial Accrued (Liability) Funded Annual As Percentage of Date Value of Liability Excess Ratio Covered Covered Payroll June 30 Assets (AAL) (1)-(2) (1)/(2) Payroll (3)/(5)____ Pension 2012 $35,417,839 37,018,127 (1,600,288) 95.7% 13,072,322 (12.2)% 2011 28,233,335 30,559,021 (2,325,686) 92.4% 12,905,560 (18.0)% 2010 23,869,050 22,964,310 904,740 103.9% 12,158,329 7.4 % Funding Excess Actuarial Actuarial Funding (Unfunded Liability) Valuation Actuarial Accrued (Liability) Funded Annual As Percentage of Date Value of Liability Excess Ratio Covered Covered Payroll June 30 Assets (AAL) (1)-(2) (1)/(2) Payroll (3)/(5)____ Health Insurance 2012 $ -0- 1,097,566 (1,097,566) 0.0% 13,072,322 (8.40)% 2011 -0- 1,027,298 (1,027,298) 0.0% 12,905,560 (7.96)% 2010 -0- 638,239 (638,239) 0.0% 12,158,329 (5.25)% Volunteer Firemen’s Relief and Pension Fund The Volunteer Firemen’s Relief and Pension Fund covers retired volunteer firemen and survivors and was established solely upon the provision for such pension and relief funds in the Arizona Revised Statutes. The Statutes grant discretionary powers to Boards of Trustees of such plans related to payment/nonpayment of benefits to qualified retired or disabled volunteer firemen out of the assets of the Fund. These discretionary powers do not extend, however, to the volunteer firemen’s right to their own contributions to the Fund. Gilbert has no actuarial liability for pension benefits as individual retirement benefits are not defined in the plan. Reserves for pensions, therefore, have not been established as the amounts are not vested and payment of benefits (if any) are at the discretion of the Board of Trustees of the plan. Gilbert no longer operates a Volunteer Fire Department. Accordingly, there were no contributions required or made to this plan nor refunds paid for fiscal year 2012. Administrative costs are financed through investment earnings. There is only one remaining pensioner receiving retirement benefits from the Fund.

TOWN OF GILBERT, ARIZONA NOTES TO THE FINANCIAL STATEMENTS
June 30, 2012
64
Note 11 - Capital Contributions During the year ended June 30, 2012, the Enterprise funds external capital contributions consisted of the following:
Water
Wastewater
Total
Contributions from developers $ 2,702,539 $ 1,841,828 $ 4,544,367 Development fees 17,509,478 15,154,154 32,663,632 Total $20,212,017 $16,995,982 $37,207,999
Note 12 – Interfund Transfers
As of June 30, 2012, interfund transfers were as follows: Transfers-In Transfers-Out Governmental funds: General fund $ 4,688,928 $ 5,876,144 Streets special revenue 50,000 3,570,110 General debt service 19,736,738 - Special assessments 305,836 202,978 Streets and transportation 286,869 - Municipal facilities 103,177 6,107,067 Parks, open space and recreation - 5,862,305 Other governmental funds 23,730 4,266,918 Total governmental funds 25,195,278 25,885,522 Enterprise funds: Water 1,050,840 669,513 Wastewater 492,290 183,373 Total enterprise funds 1,543,130 852,886 Total transfers $26,738,408 $26,738,408
The interfund transfers generally fall within one of the following categories: 1) subsidy transfers; 2) transfers to cover debt service payments; 3) transfers for the town match for grants; or 4) transfers to fund capital projects or capital replacement. There were no significant transfers during fiscal year 2012 that were either non-routine in nature or inconsistent with the activities of the fund making the transfer.

TOWN OF GILBERT, ARIZONA NOTES TO THE FINANCIAL STATEMENTS
June 30, 2012
65
Note 13 - Individual Fund Disclosures Individual funds with deficiencies in fund balance/net assets at June 30, 2012, were as follows: Capital projects funds Municipal facilities $16,246,243 Special revenue funds CDBG/HOME 72,596
The deficiency in the municipal facilities fund of the capital projects funds will be eliminated through the future collection of system development fees.
The deficiency in the CDBG/HOME fund of the special revenue funds will be eliminated through reimbursement from the U.S. Department of Housing and Urban Development.
Individual funds with an excess of expenditures over appropriations for the year ended June 30, 2012, were as follows: Debt service funds Special assessments 318 Capital projects funds Special assessments 5,710 Internal service funds Employee benefit self-insurance 63,916
The excess of expenditures over appropriations were all funded by available fund balance/net assets.
Note 14 – Contingent Liabilities
Gilbert is contingently liable with respect to several lawsuits and other claims incidental to its normal operations. Management, with concurrence of the Town's Attorney, is of the opinion that the ultimate resolution of these matters will not have a material adverse effect on Gilbert’s financial condition, results of operations or liquidity.
Note 15 – Pledged Revenues Gilbert has pledged future water and wastewater revenues, net of specified operating expenses, to repay $25,225,000 in water and wastewater revenue refunding bonds issued in 2004. Proceeds from the bonds refunded various other revenue bonds which provided financing for the construction of and improvements to the water and wastewater systems. The bonds are payable solely from water and wastewater net revenues and are payable through 2022. Annual principal and interest payments on the bonds are expected to require less than 8 percent of net revenues. The total principal and interest remaining to be paid on the bonds is $19,022,500. Principal and interest paid for the current year was $2,108,213, and total customer net revenues were $26,581,672.

TOWN OF GILBERT, ARIZONA NOTES TO THE FINANCIAL STATEMENTS
June 30, 2012
66
Gilbert has pledged future water and wastewater connection development fees revenue and future water and wastewater revenues, net of specified operating expenses after debt service payments are made for the 2004 water and wastewater revenue refunding bonds, to repay $219,125,000 in utility revenue bonds issued since 2004. Proceeds from the bonds provided financing for the construction of a joint use wastewater treatment plant; and for the acquisition of additional water production and distribution capacity for the combined water and wastewater system. The bonds are payable from water and wastewater connection development fees revenue and water and wastewater net revenues and are payable through 2033. Annual principal and interest payments on the bonds are expected to require less than 18 percent of revenue. The total principal and interest remaining to be paid on the bonds is $184,721,494. Principal and interest paid for the current year was $30,471,337 (of which $20,825,000 in principal was an advance defeasance). Total water and wastewater connection development fees revenue was $28,745,152 and water and wastewater net revenues after debt payments were $24,473,459. Gilbert has pledged future street and highway revenues to repay $35,000,000 in highway user revenue bonds issued in 2003 and $16,945,000 in highway user revenue refunding bonds issued in 2012. Proceeds from the bonds provided financing for the purpose of street and highway construction projects. Proceeds from the 2012 refunding bonds were used to advance refund $17,950,000 of outstanding 2003 highway user revenue bonds (see note 9). The bonds are payable solely from street and highway revenues (see note 8 for the detail of the sources of these revenues) and are payable through 2019. Annual principal and interest payments on the bonds are expected to require less than 28 percent of revenues. The total principal and interest remaining to be paid on the bonds is $23,069,450. Principal and interest paid for the current year was $2,970,375, and the total street and highway revenues were $10,437,844. Gilbert has pledged future excise taxes and state-shared revenues to repay $193,720,000 in public facilities municipal property corporation (MPC) revenue bonds issued since 2001 and $20,980,000 in public facilities (MPC) revenue refunding bonds issued in 2011. Proceeds from the bonds provided financing of the multipurpose public safety complex, the service center facility, a police property facility, a sports complex, various other parks and recreation facilities, and a parking facility. Proceeds from the 2011 refunding bonds were used to advance refund $21,670,000 of outstanding 2001 public facilities MPC revenue bonds. The bonds are payable through 2028. Annual principal and interest payments on the bonds are expected to require less than 17 percent of excise taxes and state-shared revenues. The total principal and interest remaining to be paid on the bonds is $201,586,228. Principal and interest paid for the current year was $16,484,316, and the total excise taxes and state-shared revenues were $97,342,250. Note 16 - Investment in Joint Venture
Construction of a joint water reclamation plant with the City of Mesa and the Town of Queen Creek was completed during fiscal year 2007. Mesa is the lead agent and is responsible for the operation and maintenance of the plant. Mesa, Gilbert and Queen Creek participate in ownership of the plant and are charged for operating expenses based on gallons of flow. Gilbert’s investment in joint venture is reflected as a separate line item in the proprietary funds financial statements. Separate financial statements for the joint venture are not prepared.
Total investment as of June 30, 2012, was: Mesa’s Share $ 66,803,865 Gilbert’s Share 69,258,182 Queen Creek’s Share 27,603,036 Total $163,665,083

TOWN OF GILBERT, ARIZONA NOTES TO THE FINANCIAL STATEMENTS
June 30, 2012
67
Construction began in fiscal year 2007 for a joint water treatment plant with the City of Chandler. Gilbert is the lead agent on this project. Construction was completed during fiscal year 2009 and the plant will treat 12 million gallons per day each for Gilbert and Chandler. Gilbert’s investment in joint venture is reflected as a separate line item in the proprietary funds financial statements. Separate financial statements for the joint venture are not prepared. Total investment as of June 30, 2012, was: Gilbert’s Share $ 74,783,441 Chandler’s Share 72,491,242 Total $147,274,683 In August 2008, Gilbert entered into an Intergovernmental Agreement with the Cities of Mesa and Apache Junction, Apache Junction Fire District (FD), and the Town of Queen Creek (the Parties) to plan, design, construct, operate, maintain and finance the TOPAZ Regional Wireless Cooperative Network (Trunked Open Arizona Network – 700/800 MHz Network procured and built by the City of Mesa). The City of Mesa acts as the lead agency and is responsible for the planning, budgeting, construction, operation and maintenance of the network, in addition to providing all management personnel and financing arrangements. The Parties participate in ownership of the network and are charged for operating and capital expenses based on subscriber units (radio counts). Gilbert’s investment in joint venture is reflected within the governmental activities in the government-wide statement of net assets. Separate financial statements are not prepared. Total investment as of June 30, 2012, was: Mesa’s Share $1,528,876 Gilbert’s Share 356,343 Apache Junction’s Share 91,108 Apache Junction FD’s Share 44,535 Queen Creek’s Share 20,930 Total $2,041,792 Note 17 - Subsequent Events
Gilbert advance defeased $4,075,000 of Water Resources MPC Water System Development Fee and Subordinate Lien Water Utility Revenue Bonds on October 1, 2012.

68

NONMAJOR FUNDS
OTHER GOVERNMENTAL FUNDS
Special Revenue Funds Special Revenue Funds are used to account for revenues and expenditures from specific taxes or other earmarked sources. Such funds are usually required by statute or ordinance to finance particular functions or activities. Grants - accounts for miscellaneous grants received from Federal, State and local governments that require segregation of revenues and expenditures. Other Special Revenue - accounts for revenues received from various agencies and sources, including seized funds from law enforcement agencies that are required to be used for specific purposes. Community Development Block Grants (CDBG) – accounts for a series of ongoing entitlements received directly from the U.S. Department of Housing and Urban Development (HUD) and used for affordable housing and redevelopment activities. HOME Program accounts for HUD monies received from Maricopa County for affordable housing activities including housing rehabilitation. Street Light Improvement District - accounts for taxes received from and expenditures of the street light maintenance improvement districts. Parkway Maintenance District - accounts for taxes received from and expenditures of the parkway maintenance improvement districts.
Capital Projects Funds Capital Projects Funds are established to account for the acquisition and construction of major capital facilities other than those financed by proprietary funds. Traffic Control - accounts for the acquisition and installation of traffic signals. Flood Control and Storm Water - accounts for the construction of flood control retention basins and storm drains. Special Assessments – accounts for Gilbert’s capital construction of improvement districts. Redevelopment - accounts for the construction of capital improvements in the Heritage District.
69

Grants
Other Special
Revenue CDBG/HOME
Street Light Improvement
District
Parkway Maintenance
DistrictASSETSPooled cash and investments 2,834,705$ 1,432,503$ 12,304$ 268,399$ 187,331$ Receivables, net: Taxes - - - 12,113 13,178 Accrued interest 13,445 3,578 - - 18 Accounts 1,895 49,803 - - -Due from other governments 1,098,319 730,787 500,403 - -Inventories - - - - 1,666 Total assets 3,948,364$ 2,216,671$ 512,707$ 280,512$ 202,193$
LIABILITIES AND FUND BALANCESLiabilities: Accounts payable 244,818$ 48,028$ 93,274$ -$ 44,162$ Accrued liabilities - 21,382 2,247 - 1,814 Due to other funds - - 489,782 - - Deferred revenue: Other 14,600 - - - - Total liabilities 259,418 69,410 585,303 - 45,976
Fund Balances: Nonspendable - - - - 1,666 Restricted 3,688,946 1,933,941 12,576 280,512 154,551 Assigned - 213,320 - - - Unassigned - - (85,172) - - Total fund balances 3,688,946 2,147,261 (72,596) 280,512 156,217Total liabilities and fund balances 3,948,364$ 2,216,671$ 512,707$ 280,512$ 202,193$
June 30, 2012
70
Special Revenue
TOWN OF GILBERT, ARIZONACombining Balance Sheet
Nonmajor Governmental Funds

Traffic Control
Flood Control and Storm
WaterSpecial
Assessments Redevelopment
Total Nonmajor Governmental
Funds
2,397,960$ -$ -$ 3,660,853$ 10,794,055$
- - - - 25,2915,155 - - 8,817 31,013
415 - - - 52,113- - - 195,187 2,524,696- - - - 1,666
2,403,530$ -$ -$ 3,864,857$ 13,428,834$
7,646$ -$ -$ -$ 437,928$ - - - - 25,443- - - - 489,782
- - - - 14,6007,646 - - - 967,753
- - - - 1,6662,380,294 - - 3,752,531 12,203,351
15,590 - - 112,326 341,236- - - - (85,172)
2,395,884 - - 3,864,857 12,461,0812,403,530$ -$ -$ 3,864,857$ 13,428,834$
71
Capital Projects

Grants
Other Special
Revenue CDBG/HOME
Street Light Improvement
District
Parkway Maintenance
DistrictRevenues Taxes: Property -$ -$ -$ 1,434,740$ 1,108,197$ Intergovernmental 2,489,521 1,728 1,515,773 - - Charges for services - 1,392,593 - - - Other entities' participation - 2,370 - - - System development fees - - - - - Gifts and donations - 166,253 - - - Fines and forfeitures - 449,156 - - - Investment earnings 40,001 15,230 48 - 69 Miscellaneous 76,982 - - - - Total revenues 2,606,504 2,027,330 1,515,821 1,434,740 1,108,266
Expenditures Current: General government: Management and policy - 43 - - - Legal and court - 304,686 - - - Development services 28,892 - 836,606 - - Public safety: Police 238,468 1,228,497 - - - Fire 108,062 16,904 - - - Highways and streets 942,438 - - 1,480,383 - Community services - 42,059 - - 1,006,603 Transportation 21,907 - - - - Non departmental 84,042 49,884 - - - Capital outlay 467,560 102,617 - - - Total expenditures 1,891,369 1,744,690 836,606 1,480,383 1,006,603Excess (deficiency) of revenues over (under) expenditures 715,135 282,640 679,215 (45,643) 101,663
Other financing sources (uses) Transfers in 3,975 - - - - Transfers out (2,698,526) (214,516) (768,347) - - Total other financing sources and uses (2,694,551) (214,516) (768,347) - -
Net change in fund balances (1,979,416) 68,124 (89,132) (45,643) 101,663Fund balances at beginning of year 5,668,362 2,079,137 16,536 326,155 54,554Fund balances at end of year 3,688,946$ 2,147,261$ (72,596)$ 280,512$ 156,217$
72
TOWN OF GILBERT, ARIZONACombining Statement of Revenues, Expenditures, and Changes in Fund Balances
Nonmajor Governmental FundsFor the Year Ended June 30, 2012
Special Revenue

Traffic Control
Flood Control and Storm
WaterSpecial
Assessments Redevelopment
Total Nonmajor Governmental
Funds
-$ -$ -$ -$ 2,542,937$ 53,549 - - - 4,060,571
- - - - 1,392,593- - - - 2,370
1,269,395 - - - 1,269,395- - - - 166,253- - - - 449,156
14,360 446 377 26,835 97,366- - - 3,300 80,282
1,337,304 446 377 30,135 10,060,923
- - - - 43- - - - 304,686- - - - 865,498
- - - - 1,466,965- - - - 124,966- - - - 2,422,821- - - - 1,048,662- - - - 21,907- - - - 133,926
254,633 - 5,710 35,486 866,006254,633 - 5,710 35,486 7,255,480
1,082,671 446 (5,333) (5,351) 2,805,443
19,755 - - - 23,730(7,946) (248,209) (305,836) (23,538) (4,266,918)11,809 (248,209) (305,836) (23,538) (4,243,188)
1,094,480 (247,763) (311,169) (28,889) (1,437,745)1,301,404 247,763 311,169 3,893,746 13,898,8262,395,884$ -$ -$ 3,864,857$ 12,461,081$
73
Capital Projects

74

BUDGETARY COMPARISON SCHEDULES
75

Variance withFinal Budget -
Original FinalActual
AmountsPositive
(Negative)Revenues Intergovernmental 5,000,000$ 5,000,000$ 2,489,521$ (2,510,479)$ Investment earnings - - 40,001 40,001 Miscellaneous - - 76,982 76,982 Total revenues 5,000,000 5,000,000 2,606,504 (2,393,496)
Expenditures Current: General government: Development services - - 28,892 (28,892) Public safety: Police - - 238,468 (238,468) Fire - - 108,062 (108,062) Highways and streets - - 942,438 (942,438) Transportation - - 21,907 (21,907) Non departmental - - 84,042 (84,042) Capital outlay - - 467,560 (467,560) Contingency 5,000,000 5,000,000 - 5,000,000 Total expenditures 5,000,000 5,000,000 1,891,369 3,108,631
Excess of revenues over expenditures - - 715,135 715,135
Other financing sources (uses) Transfers in - - 3,975 3,975 Transfers out (2,697,000) (2,697,000) (2,698,526) (1,526) Total other financing sources and uses (2,697,000) (2,697,000) (2,694,551) 2,449
Net change in fund balances (2,697,000)$ (2,697,000)$ (1,979,416) 717,584$
Fund balance at beginning of year 5,668,362Fund balance at end of year 3,688,946$
76
TOWN OF GILBERT, ARIZONAGrants Special Revenue Fund
Schedule of Revenues, Expenditures, and Changesin Fund Balances - Budget and Actual - Budgetary Basis
For the Year Ended June 30, 2012
Budgeted Amounts

Variance withFinal Budget -
Original Final Actual AmountsPositive
(Negative)Revenues Intergovernmental -$ -$ 1,728$ 1,728$ Charges for services 1,265,000 1,265,000 1,392,593 127,593 Other entities' participation - - 2,370 2,370 Gifts and donations 225,000 225,000 166,253 (58,747) Fines and forfeitures 300,890 300,890 449,156 148,266 Investment earnings - - 15,230 15,230 Total revenues 1,790,890 1,790,890 2,027,330 236,440
Expenditures Current: General government: Management and policy - 50 43 7 Support services 1,000 1,000 - 1,000 Legal and court 292,230 366,380 304,686 61,694 Public safety: Police 1,177,130 1,389,380 1,228,497 160,883 Fire 13,600 14,790 16,904 (2,114) Community services 39,900 42,060 42,059 1 Non departmental 50,000 50,000 49,884 116 Capital outlay 33,000 91,130 102,617 (11,487) Contingency 200,000 - - - Total expenditures 1,806,860 1,954,790 1,744,690 210,100
Excess (deficiency) of revenues over (under) expenditures (15,970) (163,900) 282,640 446,540
Other financing sources (uses) Transfers in 20,890 20,890 - (20,890) Transfers out (185,920) (202,250) (214,516) (12,266) Total other financing sources and uses (165,030) (181,360) (214,516) (33,156)
Net change in fund balances (181,000)$ (345,260)$ 68,124 413,384$
Fund balance at beginning of year 2,079,137Fund balance at end of year 2,147,261$
77
TOWN OF GILBERT, ARIZONAOther Special Revenue Funds
Schedule of Revenues, Expenditures, and Changesin Fund Balances - Budget and Actual - Budgetary Basis
For the Year Ended June 30, 2012
Budgeted Amounts

Variance withFinal Budget -
Original FinalActual
AmountsPositive
(Negative)Revenues Intergovernmental 1,357,130$ 1,357,130$ 1,515,773$ 158,643$ Investment earnings - - 48 48 Total revenues 1,357,130 1,357,130 1,515,821 158,691
Expenditures Current: General government: Development services 1,340,450 1,340,450 836,606 503,844 Total expenditures 1,340,450 1,340,450 836,606 503,844
Excess of revenues over expenditures 16,680 16,680 679,215 662,535
Other financing uses Transfers out (438,000) (438,000) (768,347) (330,347) Total other financing uses (438,000) (438,000) (768,347) (330,347)
Net change in fund balances (421,320)$ (421,320)$ (89,132) 332,188$
Fund balance at beginning of year 16,536Fund deficit at end of year (72,596)$
78
TOWN OF GILBERT, ARIZONACDBG/HOME Special Revenue Fund
Schedule of Revenues, Expenditures, and Changesin Fund Balances - Budget and Actual - Budgetary Basis
For the Year Ended June 30, 2012
Budgeted Amounts

Variance withFinal Budget -
Original FinalActual
AmountsPositive
(Negative)Revenues Taxes 1,431,360$ 1,431,360$ 1,434,740$ 3,380$ Total revenues 1,431,360 1,431,360 1,434,740 3,380
Expenditures Current: Highways and streets 1,636,240 1,636,240 1,480,383 155,857 Total expenditures 1,636,240 1,636,240 1,480,383 155,857
Deficiency of revenues under expenditures (204,880) (204,880) (45,643) 159,237
Net change in fund balances (204,880)$ (204,880)$ (45,643) 159,237$
Fund balance at beginning of year 326,155Fund balance at end of year 280,512$
79
TOWN OF GILBERT, ARIZONAStreet Light Improvement District Special Revenue Fund
Schedule of Revenues, Expenditures, and Changesin Fund Balances - Budget and Actual - Budgetary Basis
For the Year Ended June 30, 2012
Budgeted Amounts

Variance withFinal Budget -
Original FinalActual
AmountsPositive
(Negative)Revenues Taxes 1,107,490$ 1,107,490$ 1,108,197$ 707$ Investment earnings - - 69 69 Total revenues 1,107,490 1,107,490 1,108,266 776
Expenditures Current: Community services 1,191,270 1,191,270 1,006,603 184,667 Total expenditures 1,191,270 1,191,270 1,006,603 184,667
Excess (deficiency) of revenues over (under) expenditures (83,780) (83,780) 101,663 185,443
Net change in fund balances (83,780)$ (83,780)$ 101,663 185,443$
Fund balance at beginning of year 54,554Fund balance at end of year 156,217$
80
TOWN OF GILBERT, ARIZONAParkway Maintenance District Special Revenue FundSchedule of Revenues, Expenditures, and Changes
in Fund Balances - Budget and Actual - Budgetary BasisFor the Year Ended June 30, 2012
Budgeted Amounts

Variance withFinal Budget -
Original FinalActual
AmountsPositive
(Negative)Revenues Property taxes 21,400,000$ 21,400,000$ 21,502,322$ 102,322$ Investment earnings 75,000 75,000 90,286 15,286 Total revenues 21,475,000 21,475,000 21,592,608 117,608
Expenditures Debt service: Principal 26,660,000 26,660,000 22,655,000 4,005,000 Interest 16,363,390 16,363,390 15,417,091 946,299 Bond issuance costs - - 402,163 (402,163) Fiscal and other charges 8,320 8,320 1,534 6,786 Total expenditures 43,031,710 43,031,710 38,475,788 4,555,922
Deficiency of revenues under expenditures (21,556,710) (21,556,710) (16,883,180) 4,673,530
Other financing sources (uses) Transfers in 20,333,780 20,333,780 19,736,738 (597,042) Refunding bonds issued - - 37,925,000 37,925,000 Premium on refunding bonds - - 4,110,575 4,110,575 Payment to refunded bond escrow agent - (41,626,810) (41,626,798) 12 Total other financing sources and uses 20,333,780 (21,293,030) 20,145,515 41,438,545
Net change in fund balances (1,222,930)$ (42,849,740)$ 3,262,335 46,112,075$
Fund balance at beginning of year 6,927,284Fund balance at end of year 10,189,619$
81
TOWN OF GILBERT, ARIZONAGeneral Debt Obligations Debt Service Fund
Schedule of Revenues, Expenditures, and Changesin Fund Balances - Budget and Actual - Budgetary Basis
For the Year Ended June 30, 2012
Budgeted Amounts

Variance withFinal Budget -
Original Final Actual AmountsPositive
(Negative)Revenues Special assessments 1,167,660$ 1,167,660$ 878,981$ (288,679)$ Investment earnings - - 1,295 1,295 Total revenues 1,167,660 1,167,660 880,276 (287,384)
Expenditures Debt service: Principal 400,000 400,000 400,000 - Interest 574,660 574,660 574,655 5 Fiscal and other charges 750 750 1,073 (323) Total expenditures 975,410 975,410 975,728 (318)
Excess (deficiency) of revenues over (under) expenditures 192,250 192,250 (95,452) (287,702)
Other financing sources (uses) Transfers in - - 305,836 305,836 Transfers out - - (202,978) (202,978) Total other financing sources and uses - - 102,858 102,858
Net change in fund balances 192,250$ 192,250$ 7,406 (184,844)$
Fund balance at beginning of year 56,611Fund balance at end of year 64,017$
82
TOWN OF GILBERT, ARIZONASpecial Assessments Debt Service Fund
Schedule of Revenues, Expenditures, and Changesin Fund Balances - Budget and Actual - Budgetary Basis
For the Year Ended June 30, 2012
Budgeted Amounts

Variance withFinal Budget -
Original Final Actual AmountsPositive
(Negative)Revenues Intergovernmental 11,895,000$ 11,895,000$ 634,918$ (11,260,082)$ Other entities' participation 1,000,000 1,000,000 1,278,413 278,413 Investment earnings - - 773,594 773,594 Miscellaneous 3,400 3,400 1,779,024 1,775,624 Total revenues 12,898,400 12,898,400 4,465,949 (8,432,451)
Expenditures Current: General government: Development services - 46,770 1,559 45,211 Highways and streets - - 20,852 (20,852) Capital outlay 76,950,840 77,628,543 25,389,756 52,238,787 Total expenditures 76,950,840 77,675,313 25,412,167 52,263,146
Deficiency of revenues under expenditures (64,052,440) (64,776,913) (20,946,218) 43,830,695
Other financing sources Transfers in 2,289,000 2,289,000 286,869 (2,002,131) Total other financing sources 2,289,000 2,289,000 286,869 (2,002,131)
Net change in fund balances (61,763,440)$ (62,487,913)$ (20,659,349) 41,828,564$
Fund balance at beginning of year 87,625,742Fund balance at end of year 66,966,393$
83
TOWN OF GILBERT, ARIZONAStreets and Transportation Capital Projects Fund
Schedule of Revenues, Expenditures, and Changesin Fund Balances - Budget and Actual - Budgetary Basis
For the Year Ended June 30, 2012
Budgeted Amounts

Variance withFinal Budget -
Original Final Actual AmountsPositive
(Negative)Revenues Intergovernmental 529,000$ 529,000$ 53,549$ (475,451)$ System development fees 689,000 689,000 1,269,395 580,395 Investment earnings - - 14,360 14,360 Total revenues 1,218,000 1,218,000 1,337,304 119,304
Expenditures Capital outlay 1,207,000 1,207,000 254,633 952,367 Total expenditures 1,207,000 1,207,000 254,633 952,367
Excess of revenues over expenditures 11,000 11,000 1,082,671 1,071,671
Other financing sources (uses) Transfers in 42,000 42,000 19,755 (22,245) Transfers out (31,000) (31,000) (7,946) 23,054 Total other financing sources and uses 11,000 11,000 11,809 809
Net change in fund balances 22,000$ 22,000$ 1,094,480 1,072,480$
Fund balance at beginning of year 1,301,404Fund balance at end of year 2,395,884$
84
TOWN OF GILBERT, ARIZONATraffic Control Capital Projects Fund
Schedule of Revenues, Expenditures, and Changesin Fund Balances - Budget and Actual - Budgetary Basis
For the Year Ended June 30, 2012
Budgeted Amounts

Variance withFinal Budget -
Original FinalActual
AmountsPositive
(Negative)Revenues Intergovernmental 3,018,000$ 3,018,000$ 2,856,346$ (161,654)$ System development fees 2,564,000 2,564,000 5,677,183 3,113,183 Investment earnings - - 15,848 15,848 Total revenues 5,582,000 5,582,000 8,549,377 2,967,377
Expenditures Current: General government: Development services 250,000 250,000 64,078 185,922 Public safety: Police - - 285,690 (285,690) Fire - - 133,183 (133,183) Debt service: Fiscal and other charges - - 6,582 (6,582) Capital outlay 6,184,000 6,184,000 4,551,246 1,632,754 Total expenditures 6,434,000 6,434,000 5,040,779 1,393,221
Excess (deficiency) of revenues over (under) expenditures (852,000) (852,000) 3,508,598 4,360,598
Other financing sources (uses) Transfers in 2,910,000 2,910,000 103,177 (2,806,823) Transfers out (12,846,150) (12,846,150) (6,107,067) 6,739,083 Total other financing sources and uses (9,936,150) (9,936,150) (6,003,890) 3,932,260
Net change in fund balances (10,788,150)$ (10,788,150)$ (2,495,292) 8,292,858$
Fund deficit at beginning of year (13,750,951)Fund deficit at end of year (16,246,243)$
85
TOWN OF GILBERT, ARIZONAMunicipal Facilities Capital Projects Fund
Schedule of Revenues, Expenditures, and Changesin Fund Balances - Budget and Actual - Budgetary Basis
For the Year Ended June 30, 2012
Budgeted Amounts

Variance withFinal Budget -
Original Final Actual AmountsPositive
(Negative)Revenues Intergovernmental 1,487,000$ 1,487,000$ -$ (1,487,000)$ System development fees 4,092,000 4,092,000 11,010,594 6,918,594 Investment earnings - - 95,905 95,905 Miscellaneous - - 1,520,389 1,520,389 Total revenues 5,579,000 5,579,000 12,626,888 7,047,888
Expenditures Current: Community services 355,000 355,000 49,414 305,586 Capital outlay 4,579,000 4,641,000 328,166 4,312,834 Total expenditures 4,934,000 4,996,000 377,580 4,618,420
Excess of revenues over expenditures 645,000 583,000 12,249,308 11,666,308
Other financing uses Transfers out (5,467,400) (5,467,400) (5,862,305) (394,905) Total other financing uses (5,467,400) (5,467,400) (5,862,305) (394,905)
Net change in fund balances (4,822,400)$ (4,884,400)$ 6,387,003 11,271,403$
Fund balance at beginning of year 8,259,413Fund balance at end of year 14,646,416$
86
TOWN OF GILBERT, ARIZONAParks, Open Space and Recreation Capital Projects Fund
Schedule of Revenues, Expenditures, and Changesin Fund Balances - Budget and Actual - Budgetary Basis
For the Year Ended June 30, 2012
Budgeted Amounts

Variance withFinal Budget -
Original FinalActual
AmountsPositive
(Negative)Revenues Investment earnings -$ -$ 377$ 377$ Total revenues - - 377 377
Expenditures Capital outlay - - 5,710 (5,710) Total expenditures - - 5,710 (5,710)
Deficiency of revenues under expenditures - - (5,333) (5,333)
Other financing uses Transfers out - (311,550) (305,836) 5,714 Total other financing uses - (311,550) (305,836) 5,714
Net change in fund balances -$ (311,550)$ (311,169) 381$
Fund balance at beginning of year 311,169Fund balance at end of year -$
87
TOWN OF GILBERT, ARIZONASpecial Assessments Capital Projects Fund
Schedule of Revenues, Expenditures, and Changesin Fund Balances - Budget and Actual - Budgetary Basis
For the Year Ended June 30, 2012
Budgeted Amounts

Variance withFinal Budget -
Original FinalActual
AmountsPositive
(Negative)Revenues Other entities' participation 349,000$ 349,000$ -$ (349,000)$ Investment earnings - - 26,835 26,835 Miscellaneous - - 3,300 3,300 Total revenues 349,000 349,000 30,135 (318,865)
Expenditures Capital outlay 7,411,000 7,442,660 35,486 7,407,174 Total expenditures 7,411,000 7,442,660 35,486 7,407,174
Deficiency of revenues under expenditures (7,062,000) (7,093,660) (5,351) 7,088,309
Other financing sources (uses) Transfers in 7,062,000 7,061,000 - (7,061,000) Transfers out - - (23,538) (23,538) Total other financing sources and uses 7,062,000 7,061,000 (23,538) (7,084,538)
Net change in fund balances -$ (32,660)$ (28,889) 3,771$
Fund balance at beginning of year 3,893,746Fund balance at end of year 3,864,857$
88
TOWN OF GILBERT, ARIZONARedevelopment Capital Projects Fund
Schedule of Revenues, Expenditures, and Changesin Fund Balances - Budget and Actual - Budgetary Basis
For the Year Ended June 30, 2012
Budgeted Amounts

Variance withFinal Budget -
Original FinalActual
AmountsPositive
(Negative)Operating revenues Charges for services 36,094,000$ 36,094,000$ 36,692,434$ 598,434$ Other 1,440,000 1,440,000 1,646,827 206,827 Total operating revenues 37,534,000 37,534,000 38,339,261 805,261
Operating expenses General and administrative 910,130 1,903,930 1,073,874 830,056 Personal services 5,912,140 7,844,550 6,745,643 1,098,907 Operation and maintenance 13,650,130 13,730,120 12,042,823 1,687,297 Capital outlay 26,282,870 26,281,000 8,156,003 18,124,997 Allocation of indirect expenses 2,309,430 2,309,430 1,149,154 1,160,276 Debt service: Principal 11,393,740 11,393,740 11,326,341 67,399 Contingency 808,000 808,000 - 808,000 Total operating expenses 61,266,440 64,270,770 40,493,838 23,776,932
Operating loss (23,732,440) (26,736,770) (2,154,577) 24,582,193
Nonoperating revenues (expenses) Interest expense (6,988,530) (6,988,530) (6,764,676) 223,854 Investment earnings 90,000 90,000 895,168 805,168 Gain on sale of capital assets - - 4,168 4,168 Total nonoperating revenues (expenses) (6,898,530) (6,898,530) (5,865,340) 1,033,190
Loss before capital contributions and transfers (30,630,970) (33,635,300) (8,019,917) 25,615,383
Capital contributions 7,676,000 7,676,000 17,509,478 9,833,478Transfers in 438,000 438,000 1,050,840 612,840Transfers out (2,445,920) (2,445,920) (669,513) 1,776,407
Change in net assets (24,962,890)$ (27,967,220)$ 9,870,888 37,838,108$
Explanation of difference between budgetary change in net assets at June 30, 2012, and GAAP change in net assets:Obligations for compensated absenses are accrued on the GAAP basis but are not recognized on the budget basis: Add compensated absences at June 30, 2011 734,656 Less compensated absences at June 30, 2012 (900,475)Capital outlays are not recognized as GAAP expenses but are recognized as expenses on the budget basis. 8,156,003Debt service principal payments are not recognized as expenses on the GAAP basis but are recognized as expenses on the budget basis. 11,326,341Capital assets contributed by developers are recognized as revenue for GAAP purposes by are not recognized as revenue on the budget basis. 2,702,539Depreciation is recognized as an expense for GAAP purposes but is not recognized for budgetary purposes. (9,490,239)Amortization of bond issuance costs is recognized as an expense for GAAP purposes but not recognized for budgetary purposes. (111,369) Change in net assets as reported on the statement of revenues, expenses and changes in fund net assets 22,288,344$
89
TOWN OF GILBERT, ARIZONAWater Enterprise Fund
Schedule of Revenues, Expenses and Changesin Net Assets - Budget and Actual - Budgetary Basis
For the Year Ended June 30, 2012
Budgeted Amounts
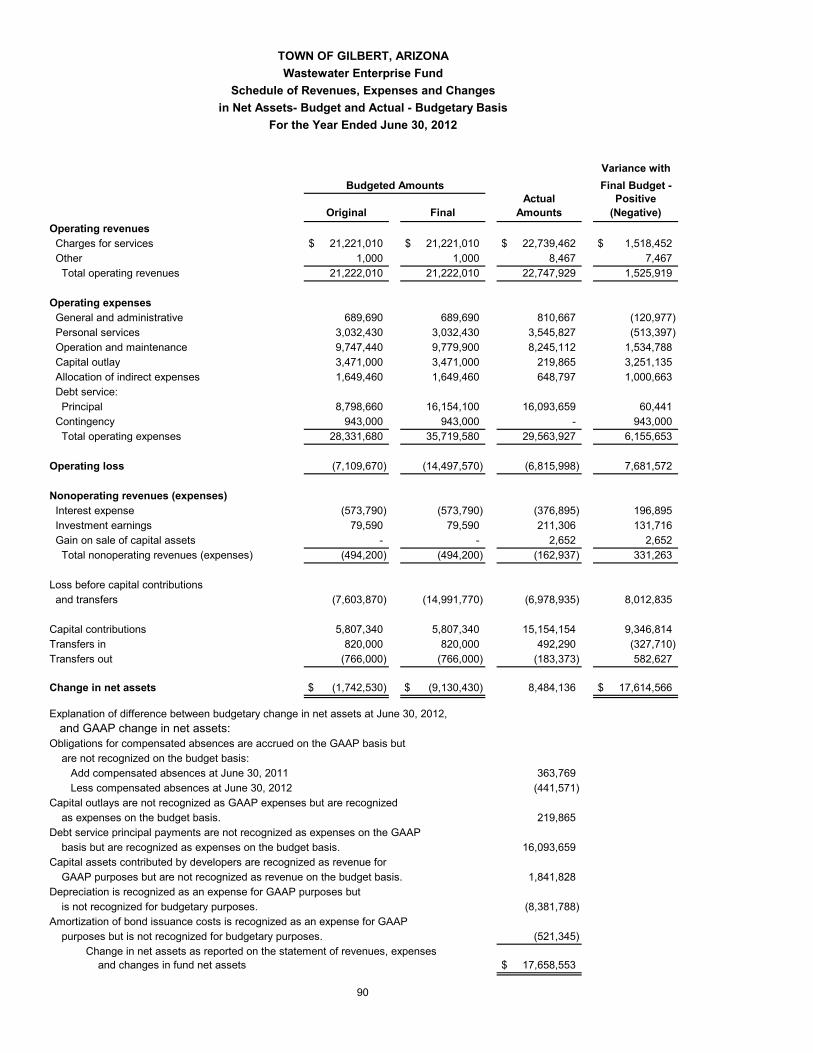
Variance withFinal Budget -
Original FinalActual
AmountsPositive
(Negative)Operating revenues Charges for services 21,221,010$ 21,221,010$ 22,739,462$ 1,518,452$ Other 1,000 1,000 8,467 7,467 Total operating revenues 21,222,010 21,222,010 22,747,929 1,525,919
Operating expenses General and administrative 689,690 689,690 810,667 (120,977) Personal services 3,032,430 3,032,430 3,545,827 (513,397) Operation and maintenance 9,747,440 9,779,900 8,245,112 1,534,788 Capital outlay 3,471,000 3,471,000 219,865 3,251,135 Allocation of indirect expenses 1,649,460 1,649,460 648,797 1,000,663 Debt service: Principal 8,798,660 16,154,100 16,093,659 60,441 Contingency 943,000 943,000 - 943,000 Total operating expenses 28,331,680 35,719,580 29,563,927 6,155,653
Operating loss (7,109,670) (14,497,570) (6,815,998) 7,681,572
Nonoperating revenues (expenses) Interest expense (573,790) (573,790) (376,895) 196,895 Investment earnings 79,590 79,590 211,306 131,716 Gain on sale of capital assets - - 2,652 2,652 Total nonoperating revenues (expenses) (494,200) (494,200) (162,937) 331,263
Loss before capital contributions and transfers (7,603,870) (14,991,770) (6,978,935) 8,012,835
Capital contributions 5,807,340 5,807,340 15,154,154 9,346,814Transfers in 820,000 820,000 492,290 (327,710)Transfers out (766,000) (766,000) (183,373) 582,627
Change in net assets (1,742,530)$ (9,130,430)$ 8,484,136 17,614,566$
Explanation of difference between budgetary change in net assets at June 30, 2012, and GAAP change in net assets:Obligations for compensated absences are accrued on the GAAP basis but are not recognized on the budget basis: Add compensated absences at June 30, 2011 363,769 Less compensated absences at June 30, 2012 (441,571)Capital outlays are not recognized as GAAP expenses but are recognized as expenses on the budget basis. 219,865Debt service principal payments are not recognized as expenses on the GAAP basis but are recognized as expenses on the budget basis. 16,093,659Capital assets contributed by developers are recognized as revenue for GAAP purposes but are not recognized as revenue on the budget basis. 1,841,828Depreciation is recognized as an expense for GAAP purposes but is not recognized for budgetary purposes. (8,381,788)Amortization of bond issuance costs is recognized as an expense for GAAP purposes but is not recognized for budgetary purposes. (521,345) Change in net assets as reported on the statement of revenues, expenses and changes in fund net assets 17,658,553$
90
TOWN OF GILBERT, ARIZONAWastewater Enterprise Fund
Schedule of Revenues, Expenses and Changesin Net Assets- Budget and Actual - Budgetary Basis
For the Year Ended June 30, 2012
Budgeted Amounts

Variance withFinal Budget -
Original FinalActual
AmountsPositive
(Negative)Operating revenues Charges for services 17,162,100$ 17,162,100$ 17,923,883$ 761,783$ Other 70,000 70,000 109,830 39,830 Total operating revenues 17,232,100 17,232,100 18,033,713 801,613
Operating expenses General and administrative 414,690 414,690 927,851 (513,161) Personal services 4,916,070 4,916,070 5,387,927 (471,857) Operation and maintenance 7,158,010 7,158,010 6,243,114 914,896 Capital outlay 2,077,000 2,077,000 149,158 1,927,842 Allocation of indirect expenses 1,352,640 1,352,640 584,653 767,987 Contingency 453,000 453,000 - 453,000 Total operating expenses 16,371,410 16,371,410 13,292,703 3,078,707
Operating income 860,690 860,690 4,741,010 3,880,320
Nonoperating revenues Investment earnings 83,200 83,200 137,675 54,475 Gain on sale of capital assets - - 31,459 31,459 Total nonoperating revenues 83,200 83,200 169,134 85,934
Income before capital contributions 943,890 943,890 4,910,144 3,966,254
Capital contributions - - 13,713 13,713
Change in net assets 943,890$ 943,890$ 4,923,857 3,979,967$
Explanation of difference between budgetary change in net assets at June 30, 2012, and GAAP change in net assets:Obligations for compensated absences are accrued on the GAAP basis but are not recognized on the budget basis: Add compensated absences at June 30, 2011 465,941 Less compensated absences at June 30, 2012 (486,616)Capital outlays are not recognized as GAAP expenses but are recognized as expenses on a budget basis. 149,158Depreciation is recognized as an expense for GAAP purposes but is not recognized for budgetary purposes. (1,674,985) Change in net assets as reported on the statement of revenues, expenses and changes in fund net assets 3,377,355$
91
TOWN OF GILBERT, ARIZONASolid Waste Enterprise Fund
Schedule of Revenues, Expenses and Changesin Net Assets - Budget and Actual - Budgetary Basis
For the Year Ended June 30, 2012
Budgeted Amounts

92

INTERNAL SERVICE FUNDS Internal Service Funds are used to account for the financing of goods or services provided by one department to other departments of the government, on a cost reimbursement basis. Equipment Maintenance - to account for the revenues and expenses from the maintenance of Gilbert's motorized equipment. Copy Services - to account for the revenues and expenses from the operation of centrally located copiers within Gilbert. Employee Benefit Self-Insurance - to account for and finance Gilbert’s uninsured risks of loss for medical claims.
93

Equipment
Maintenance Copier Services
Employee Benefit Self-
Insurance TotalASSETSCurrent assets: Pooled cash and investments 794,020$ 277,533$ 5,155,839$ 6,227,392$ Receivables (net): Accrued interest 1,566 870 1,816 4,252 Accounts 32,949 - 1,910 34,859 Inventories 468,041 - - 468,041 Total current assets 1,296,576 278,403 5,159,565 6,734,544
Noncurrent assets: Capital assets: Property, plant and equipment 223,225 324,888 - 548,113 Less accumulated depreciation (200,381) (112,188) - (312,569) Total capital assets (net) 22,844 212,700 - 235,544Total assets 1,319,420 491,103 5,159,565 6,970,088
LIABILITIESCurrent liabilities: Accounts payable 260,850 92,818 13,253 366,921 Accrued liabilities 23,755 - - 23,755 Current portion of compensated absences 64,110 - - 64,110 Claims payable - - 1,244,571 1,244,571 Total current liabilities 348,715 92,818 1,257,824 1,699,357
Long-term portion of compensated absences 90,273 - - 90,273Total liabilities 438,988 92,818 1,257,824 1,789,630
NET ASSETSInvested in capital assets, net of related debt 22,844 212,700 - 235,544Unrestricted 857,588 185,585 3,901,741 4,944,914Total net assets 880,432$ 398,285$ 3,901,741$ 5,180,458$
94
TOWN OF GILBERT, ARIZONAInternal Service Funds
Combining Statement of Net AssetsJune 30, 2012

Equipment
Maintenance Copier Services
Employee Benefit Self-
Insurance TotalOperating revenues Charges for services 6,955,403$ 355,134$ 12,893,622$ 20,204,159$ Other 5,967 - 46,113 52,080 Total operating revenues 6,961,370 355,134 12,939,735 20,256,239
Operating expenses General and administrative 147,393 - 790,985 938,378 Personal services 1,414,035 - - 1,414,035 Operation and maintenance 5,377,404 383,578 - 5,760,982 Claims Incurred - - 13,506,651 13,506,651 Depreciation 18,979 21,863 - 40,842 Total operating expenses 6,957,811 405,441 14,297,636 21,660,888
Operating income (loss) 3,559 (50,307) (1,357,901) (1,404,649)
Nonoperating revenues (expenses) Investment earnings 3,966 2,723 14,071 20,760 Loss on sale of capital assets - (24,711) - (24,711) Total nonoperating revenues (expenses) 3,966 (21,988) 14,071 (3,951)
Change in net assets 7,525 (72,295) (1,343,830) (1,408,600)
Total net assets, beginning of year 872,907 470,580 5,245,571 6,589,058
Total net assets, end of year 880,432$ 398,285$ 3,901,741$ 5,180,458$
95
TOWN OF GILBERT, ARIZONAInternal Service Funds
Combining Statement of Revenues, Expenses and Changes in Fund Net AssetsFor the Year Ended June 30, 2012

Equipment
MaintenanceCopier
Services
Employee Benefit Self-
Insurance TotalCash flows from operating activities: Other operating cash receipts 5,967$ -$ 46,702$ 52,669$ Cash receipts from other funds for services 6,996,746 355,134 12,893,622 20,245,502 Cash payments to suppliers for goods and services (5,556,770) (290,920) (14,120,556) (19,968,246) Cash payments to employees for services (1,367,150) - - (1,367,150)
Net cash provided by (used in) operating activities 78,793 64,214 (1,180,232) (1,037,225)
Cash flows from capital and related financing activities: Acquisition and construction of capital assets - (159,336) - (159,336)
Net cash used in capital and related financing activities - (159,336) - (159,336)
Cash flows from investing activities: Interest received on investments 3,154 2,280 14,719 20,153
Net cash provided by investing activities 3,154 2,280 14,719 20,153
Net increase (decrease) in cash and cash equivalents 81,947 (92,842) (1,165,513) (1,176,408)Cash and cash equivalents at beginning of year 712,073 370,375 6,321,352 7,403,800
Cash and cash equivalents at end of year 794,020$ 277,533$ 5,155,839$ 6,227,392$
Reconciliation of operating income (loss) to net cash provided by (used in) operations: Operating income (loss) 3,559$ (50,307)$ (1,357,901)$ (1,404,649)$ Adjustments to reconcile operating income (loss) to net cash provided by (used in) operating activities: Depreciation 18,979 21,863 - 40,842 Changes in assets and liabilities: Decrease in accounts receivable 41,343 - 589 41,932 Decrease in prepaid items 7,266 - - 7,266 Increase in inventories (37,614) - - (37,614) Increase (decrease) in accounts payable (1,625) 92,658 12,950 103,983 Increase in claims payable - - 164,130 164,130 Increase in accrued expenses 46,885 - - 46,885
Total adjustments 75,234 114,521 177,669 367,424
Net cash provided by (used in) operating activities 78,793$ 64,214$ (1,180,232)$ (1,037,225)$
TOWN OF GILBERT, ARIZONAInternal Service Funds
Combining Statement of Cash FlowsYear Ended June 30, 2012
96

Variance withFinal Budget -
Original FinalActual
AmountsPositive
(Negative)Operating revenues Charges for services 7,931,060$ 7,931,060$ 6,955,403$ (975,657)$ Other - - 5,967 5,967 Total operating revenues 7,931,060 7,931,060 6,961,370 (969,690)
Operating expenses General and administrative 87,900 87,900 147,393 (59,493) Personal services 1,703,260 1,703,260 1,382,496 320,764 Operation and maintenance 5,767,800 5,767,800 5,377,404 390,396 Depreciation - - 18,979 (18,979) Total operating expenses 7,558,960 7,558,960 6,926,272 632,688
Operating income 372,100 372,100 35,098 (337,002)
Nonoperating revenues Investment earnings 1,200 1,200 3,966 2,766 Total nonoperating revenues 1,200 1,200 3,966 2,766
Change in net assets 373,300$ 373,300$ 39,064 (334,236)$
Explanation of difference between budgetary change in net assets at June 30, 2012, and GAAP change in net assets:Obligations for compensated absences are accrued on the GAAP basis but are not recognized on the budget basis: Add compensated absences at June 30, 2011 122,844 Less compensated absences at June 30, 2012 (154,383) Change in net assets as reported on the statement of revenues, expenses and changes in fund net assets 7,525$
97
TOWN OF GILBERT, ARIZONAEquipment Maintenance Internal Service FundSchedule of Revenues, Expenses and Changes
in Net Assets - Budget and Actual - Budgetary BasisFor the Year Ended June 30, 2012
Budgeted Amounts

Variance withFinal Budget -
Original Final Actual AmountsPositive
(Negative)Operating revenues Charges for services 365,000$ 365,000$ 355,134$ (9,866)$ Total operating revenues 365,000 365,000 355,134 (9,866)
Operating expenses Operation and maintenance 579,130 579,130 383,578 195,552 Depreciation - - 21,863 (21,863) Total operating expenses 579,130 579,130 405,441 173,689
Operating loss (214,130) (214,130) (50,307) 163,823
Nonoperating revenues (expenses) Investment earnings 3,600 3,600 2,723 (877) Loss on sale of capital assets - - (24,711) (24,711) Total nonoperating revenues (expenses) 3,600 3,600 (21,988) (25,588)
Change in net assets (210,530)$ (210,530)$ (72,295)$ 138,235$
98
TOWN OF GILBERT, ARIZONACopier Services Internal Service Fund
Schedule of Revenues, Expenses and Changesin Net Assets - Budget and Actual - Budgetary Basis
For the Year Ended June 30, 2012
Budgeted Amounts

Variance withFinal Budget -
Original FinalActual
AmountsPositive
(Negative)Operating revenues Charges for services 12,630,000$ 12,630,000$ 12,893,622$ 263,622$ Other 65,000 65,000 46,113 (18,887) Total operating revenues 12,695,000 12,695,000 12,939,735 244,735
Operating expenses General and administrative 870,720 870,720 790,985 79,735 Claims Incurred 13,363,000 13,363,000 13,506,651 (143,651) Total operating expenses 14,233,720 14,233,720 14,297,636 (63,916)
Operating loss (1,538,720) (1,538,720) (1,357,901) 180,819
Nonoperating revenues Investment earnings 21,400 21,400 14,071 (7,329) Total nonoperating revenues 21,400 21,400 14,071 (7,329)
Change in net assets (1,517,320)$ (1,517,320)$ (1,343,830)$ 173,490$
99
TOWN OF GILBERT, ARIZONAEmployee Benefit Self-Insurance Internal Service Fund
Schedule of Revenues, Expenses and Changesin Net Assets - Budget and Actual - Budgetary Basis
For the Year Ended June 30, 2012
Budgeted Amounts

100

AGENCY FUNDS Agency Funds are used to account for assets held by the government as an agent for individuals, private organizations, other governments and/or other funds. Flexible Spending - accounts for monies received from employees for medical and dependent care expenses under Internal Revenue Code Section 125. Fire Retirement Health - accounts for monies received from sworn fire employees for providing a monthly stipend for retirees to apply to the cost of their medical and/or dental insurance, medical and dental co-pays, and prescriptions and other benefits.
101

102

103
TOWN OF GILBERT, ARIZONACombining Statement of Changes in Assets and Liabilities
Agency FundsYear Ended June 30, 2012
Flexible Spending Beginning EndingBalance Additions Deductions Balance
AssetsRestricted cash and investments $ 24,277 286,057 287,378 22,956
Total assets $ 24,277 286,057 287,378 22,956
LiabilitiesAccounts payable $ - 1,224 1,224 -Medical benefits payable 8,927 223,672 223,507 9,092Dependent care benefits payable 15,350 63,585 65,071 13,864
Total liabilities $ 24,277 288,481 289,802 22,956
Fire Retirement Health Fund
AssetsRestricted cash and investments $ 92,419 47,055 2,574 136,900Restricted accrued interest 99 391 184 306
Total assets $ 92,518 47,446 2,758 137,206
LiabilitiesAccounts payable - 1,720 1,720 -Other deposits $ 92,518 47,431 2,743 137,206
Total liabilities $ 92,518 49,151 4,463 137,206
Total-All Agency Funds
AssetsRestricted cash and investments $ 116,696 333,112 289,952 159,856Restricted accrued interest 99 391 184 306
Total assets $ 116,795 333,503 290,136 160,162
LiabilitiesAccounts payable $ - 2,944 2,944 -Other deposits 92,518 47,431 2,743 137,206Medical benefits payable 8,927 223,672 223,507 9,092Dependent care benefits payable 15,350 63,585 65,071 13,864
Total liabilities $ 116,795 337,632 294,265 160,162

104

Statistical Section ________________________________ Financial Trends
Revenue Capacity
Debt Capacity
Demographic and Economic Information
Operating Information
Other Information

understanding what the information in the financial statements and note disclosures says about the Town's overallfinancial health.
Contents Page
Financial Trends 105
These schedules contain trend information to help the reader understand how Gilbert's financial performance and well-being have changed over time.
Revenue Capacity 112
These schedules contain information to help the reader assess Gilbert's most significantlocal revenue source, sales tax.
Debt Capacity 115
These schedules present information to help the reader assess the affordability of Gilbert'scurrent levels of outstanding debt and Gilbert's ability to issue additional debt in the future.
Demographic and Economic Information 120
These schedules offer demographic and economic indicators to help the reader understandthe environment within which Gilbert's financial activities take place.
Operating information 122
These schedules contain service and infrastructure data to help the reader understand howthe information in Gilbert's financial report relates to the services Gilbert provides and theactivities it performs.
Other information 125
Sources: Unless otherwise noted, the information in these schedules is derived from the Comprehensive AnnualFinancial Report for the relevant year.
105
STATISTICAL SECTION
This part of Gilbert's Comprehensive Annual Financial Report presents detailed information as a context for

106


![Comprehensive Procurement Review Tool: State Agency ...€¦ · Web view[NEW] Instructions for State Agency Procurement Selection Chart. State agency instructions: To determine](https://img.dokumen.tips/doc/110x75/5e1d0adcae3b7336db5340e0/comprehensive-procurement-review-tool-state-agency-web-viewnew-instructions.jpg)