Embed Size (px)
Citation preview

This is an author produced version of Institutions and facility mergers in the Italian education system: Models and case studies.
White Rose Research Online URL for this paper:http://eprints.whiterose.ac.uk/94833/
Article:
Bruno, G., Esposito, E., Genovese, A. et al. (1 more author) (2016) Institutions and facility mergers in the Italian education system: Models and case studies. Socio-Economic Planning Sciences, 53. pp. 23-32. ISSN 0038-0121
https://doi.org/10.1016/j.seps.2015.11.001
promoting access toWhite Rose research papers
[email protected]://eprints.whiterose.ac.uk/

1
Institutions and Facility Mergers in the Italian Education System: Models and Case Studies
Giuseppe Bruno1, Emilio Esposito1, Andrea Genovese2, Carmela Piccolo1
1 Department of Industrial Engineering (DII), University of Naples Federico II, Piazzale Tecchio, 80 – 80125 Naples, Italy [email protected], [email protected], [email protected]
2 Management School, University of Sheffield, Conduit Road, S1 4DT, Sheffield, UK
[email protected] Abstract In recent years, across Europe, the economic crisis has resulted in an increased pressure on education systems. Notably, Italy has been one of the countries that has experienced the most severe reduction in public expenditure in the education sector. In the described conditions, Italian governmental institutions have started to perform rationalisation actions, aimed at modifying the current configuration of the existing facilities offering educational services (either by entirely closing and merging some of them, or by downsizing or transferring capacities), in order to increase the affordability of the system while still providing a required minimum service level. These strategic choices may have a lasting impact; therefore, there is a need for appropriate decision support tools capable of assisting planners. For this reason, after a description of the context and a review of the current literature, this paper presents two novel mathematical models for addressing rationalisation decisions in the Italian education system. The usability of such models is tested by means of real-world case studies, offering interesting insights. Keywords: location problems, education, facility merging.
1. Introduction In the current economic climate, characterised by growing cuts to public expenditure, public services (e.g., healthcare, policing, public administration) have undergone significant transformations (Sancton, 2000). Such changes have been generally oriented to reduce administrative, managerial and operational burden and costs, through downsizing and merging processes. In this context, an increasing pressure on education systems occurred, due to a combination of effects (Theodoropoulou and Watt, 2012). Indeed, on one hand, poor economic conditions and high unemployment figures have boosted the demand for education, with young people and adults trying to get additional qualifications in order to become more employable or to delay their entry in a depressed labour market. On the other hand, austerity measures resulted in an overall decrease in the public spending in education in many European countries. In 2011, remarkable reductions were registered in Greece, Hungary and Romania (around 17 %), with ones observed in Slovakia, the United Kingdom (precisely, in England and Northern Ireland) and Iceland (around 5%); in 2012, strong cuts were reported in Latvia (almost 9%) and Cyprus, Italy and Croatia (about 7%) (European Commission/EACEA/Eurydice, 2013). In particular, in Italy, there has been a reduction in spending on education quantifiable in 8 billion Euros across three years, from 2009 to 2012 (OECD, 2013); however, education still accounts for 6.8% of the public budget

2
and 3.59% of total GDP (European Commission, 2012). These measures have resulted in several consequences, such as the non-renewal of expiring temporary contracts for non-tenured teaching and administrative staff and the subsequent merger of schools and university departments (Turri, 2014). Indeed, both local and central government institutions have started to perform rationalisation actions, aimed at modifying the current configuration of the existing facilities offering educational services (by entirely closing some of them, or by downsizing or transferring capacities), in order to increase the affordability of the system while still providing a required service level. These decisions may have a strategic value given their long-term impact, and should be planned by taking into account different perspectives. Indeed, while the planning authorities would be interested in the improvement of financial sustainability, users will be damaged by the loss of educational facilities (as, for instance, students will have to travel farther for accessing schools or academic sites). Therefore, to effectively solve this kind of problems, appropriate models can support decision makers to find trade-off solutions between two inherently conflicting goals: the maximisation of the benefit due to the rationalisation action (taking into account planner perspective) and the minimisation of the damage due to the action itself (taking into account user perspective). In this work, after a review of the extant literature, we present two novel mathematical models for addressing reorganisation decisions concerning different levels of Italian education system. Though representing an adaptation of frameworks from the very well established classes of facility location and districting problems, these models constitute a novel attempt to solve rationalisation problems in a public sector scenario, also taking into account the specific structure of education systems. In particular, the first model is oriented to identify, within a region, the set of school facilities that, if merged together in a cluster (and, therefore, sharing management and administration service), could improve the efficiency of the system. The second model, focused on the higher education context, is aimed at identifying, in a given region, the set of academic sites to be closed and/or downsized in order to reduce inefficiencies. Both the models have been tested on real-world case studies, in order to show their capabilities in tackling such kinds of problems. The paper is organised as follows. In the next Section, a brief description of the current Italian education context is provided; then, a literature review about models and methods proposed to deal with rationalisation problems, with a special focus on educational applications, is presented. In Section 4, a common notation to describe a general model for dealing with rationalization problems is introduced; then in section 5 and 6 two mathematical models, concerning the reorganisation of the Italian education system at different levels, are presented and applied to two real case studies. Finally, conclusions and directions for further research are drawn.
2. Features and trends of the Italian Education System The Italian educational system is organised as follows:
- Pre┽primary education, for children between 3 and 6 years of age; - Primary education (lasting 5 years), for children between 6 and 11 years of age; - Lower secondary education (lasting 3 years), for children between 11 and 14 years of age; - Upper secondary education (lasting 3, 4 or 5 years depending on the specific qualification),
for students from 14 years of age;

3
- Higher education (lasting 3 years for Bachelor degrees plus 2 years for Master’s degrees), for students from 19 years of age.
While in the past the organisation was highly centralised, in recent years a general decentralisation process involving each level of the system was implemented. In this framework, central government has exclusive competence on general issues (including, for instance, minimum standards to be guaranteed throughout the country), while local authorities (municipalities, provinces and/or regions) are responsible for planning, organisational and delivery aspects within their respective boundaries (Ferrari and Zanardi, 2012; Grimaldi and Serpieri, 2012). Despite the initial intentions, considering the current context of economic austerity and its political consequences in terms of remarkable cuts to public expenditure, local institutions have enjoyed to a limited extent the advantages related to the implementation of decentralisation processes. In this context governmental institutions and authorities have introduced criteria and requirements to drive the rationalisation of the educational institutions with the objective of obtaining economies of scale (through the closure, and/or the merging of education facilities) and of optimally exploiting available reserves of capacity at existing facilities. Similar initiatives have been also encouraged and stimulated by offering financial subsides and incentives. In particular, at lower levels of the education system (pre-primary, primary and lower secondary schools) single schools were obliged to form clusters with a minimum students’ population of 1000, with the exception of some special cases (schools located in particular areas, such as islands or mountain areas). This merging strategy allows rationalising administrative and management offices and staff, coherently to the cited policies of reduction of public expenditure. In practice, this process should be implemented by grouping schools in clusters, and letting each cluster being managed through the definition of a single cluster centre, providing shared administrative and managerial services. At a higher level, as a consequence of the implementation of the Bologna Process (Powell and Finger, 2013) and as an attempt to cope with the increased demand for higher education occurred in industrialised countries (Schofer and Meyer, 2005), in Italy there has been a strong increase in the number of university sites and degree programmes. From 1995 to 2009, the total number of institutions rose from 60 to 86; in the same period, while the number of cities hosting main academic sites increased from 45 to 57, the number of cities hosting detached (off-main campus) university sites doubled, increasing from 93 to 185. It has to be highlighted that the degree of autonomy of Italian Higher Education institutions is still quite low, if compared to similar countries; moreover, Italian universities are still massively publicly subsidised, as 80% of resources are coming from central and regional government transfers. Also, competition among universities appears to be quite low, as one of the peculiarities of the Italian University system is represented by the so-called legal value of academic qualifications, providing public recognition of degrees (for instance, for the access to professional careers) regardless of the specific awarding institution (and of its prestige). For this reason the above-mentioned rise in the number of academic institutions was not driven by market forces, rather due to splits or creation of decentralised campuses from existing universities. In many cases, faculty staff of the newly created institutions were just transferred from the ‘parent’ organisation (either permanently or temporarily, on a shared employment basis). Some recent analyses performed by the Italian Ministry of University (CNVSU, 2011) revealed that the growth of the supply produced a system characterised by a high percentage of degree

4
programmes attracting demand levels much lower than target values fixed by central government. The affordability of such a system has been largely questioned also given the cited application of austerity measures. In this context, rationalisation strategies have been considered. Taking into account that the mobility of students across Italian regions is quite low, as around 80% of the students choose to study in their home region (Bruno and Genovese, 2012), there is a common agreement on the fact that rationalisation strategies have to be defined at a regional level, by shutting down degree programmes (and, potentially, entire sites) not attracting enough students and considering the possibility of merging institutions. The above-mentioned phenomena illustrate that rationalisation strategies are being actively pursued at every level in the Italian education system. Of course, while these decisions could improve the financial sustainability of the system, users could be negatively affected by them (as, for instance, students will have to travel farther for accessing schools or academic sites); therefore, the feasibility of these strategies should be carefully evaluated through the use of appropriate scenario planning and decision support methodologies, in order to maximise benefits and contain the worsening of the service level within acceptable limits. The following section provides a brief analysis of the extant literature that could support the development of these methodologies.
3. Models for Merging of Educational Institutions: a Literature Review In a context in which constraints on public expenditure impose a general reform of welfare systems, public services in crucial areas (education, healthcare, public transport) have been interested by re-organisation process in the attempt of making systems economically sustainable through the shrinkage, relocation and/or the merging of the existing facilities. (Wang et al., 2003). In the education sector, this may mean reducing the amount of classes or programmes being offered in a given location, relocating shutting down or merging schools and academic sites. These strategic actions have strong long term implications on the regional social and economic development (Drucker, 2015) that should be opportunely analysed, taking into account both planner and user perspectives. Indeed, while the planner would be interested in improving the financial sustainability of the system, by identifying the set of facilities that, if downsized, closed or merged, would optimise a certain benefit index (including, for example, cost measures for facilities operations), users will be damaged by the loss of one or more facilities, as this will increase the accessibility cost and/or cause a drop of coverage and a worsening of users’ satisfaction, potentially congesting the remaining facilities. Therefore, to effectively solve these kinds of problems, decision support models should be able to find a trade-off solution between two inherently conflicting goals: the maximisation of the benefit deriving from the closure (taking into account the planner perspective) and the minimisation of the damage deriving from the closure itself (taking into account the user perspective). In recent years, the location problems literature has offered some contributions concerning the territorial organisation of public services. Traditionally, location models were focused on scenarios in which additional facilities had to be activated in order to satisfy a given demand in a given region. Wang et al. (2003) introduced a model addressing the situation in which, due to some occurring changes in the distribution of the demand, the relocation of the existing facilities is required in order to improve the service level provided to users. This approach simultaneously considered the opening of some new facilities and the closure of some existing ones. ReVelle et al.

5
(2007) introduced the Planned Shrinkage Model that explores the reduction of facilities in a region in a non-competitive environment, particularly suitable to public services. When looking for contributions explicitly related to education systems rationalisation problems, several authors have studied problems related to the organisation of school facility systems, mainly tackling it from a districting perspective. A typical problem, indeed, concerns the so-called school districting, i.e. the partitioning of the demand coming from a given region in groups of students attending each school. In this problems school and class capacity constraints must be satisfied, various social objectives have to be achieved (for instance, racial balance) and some territorial aspects related to the contiguity of districts have to be considered in order to allow students from the same neighborhood to be assigned to the same school. The problem also occurs when a reorganisation action has to be planned, such as the opening or the closing of a school, the modifying of the capacities of existing schools; in these cases, due to the perturbation of the previous demand allocation, districts have to be redesigned considering a potential worsening of the accessibility of users to the service. In this context many models and methods have been defined and applied (see, for instance: Ploughman et al., 1968; Holloway et al., 1975; Brown, 1987; Lemberg and Church, 2000; Caro et al., 2004). Compared to the mentioned contributions available in the literature, the two models described in this paper will deal with strategic rationalisation decisions in which the main driver is represented by budgetary constraints making the current educational supply system unaffordable and unsustainable. Assuming that the current configuration is the best one from the user perspective, any rationalisation action will impose some damage; therefore, in this case, the problem is different from the ones described in the literature, as, apart from possible gains for the planner, any decision will produce some side effects, such as the increase of costs faced by users (in terms of accessibility to services) and, potentially, the worsening of the quality of the offered service (measurable in terms of drop of coverage, worsening of user satisfaction and over-utilisation of the remaining facilities). Therefore, models will be aimed at finding trade-off solutions between two inherently conflicting goals: the need for achieving economic efficiencies and the need to minimise the discomfort imposed on, or the damage caused to, the user (as a consequence of rationalisation decisions). In particular the first model is oriented to identify, within a region, the set of school facilities that, if merged together in a cluster (and, therefore, sharing management and administration service), could improve the efficiency and the sustainability of the system. The second model, related to the higher education context, is aimed at identifying, in a given system, the set of academic sites to be closed and/or downsized in order to find solutions that represent a good trade-off between the goal of the decision maker and the needs of the users.
4. Notation In the models that we are going to introduce, we will refer to an existing education system operating through a set of facilities (already located) that offer one or more types of services in order to satisfy a demand distributed in a given region. Hence, despite the specific rationalisation action to be implemented, which strongly depends on the particular application, we can introduce the following sets and parameters, associated with the current characteristics of the system: 蛍 set of points where facilities are currently located;

6
計 set of services offered by existing facilities; 健賃珍 binary label equal to 1 if and only if facility in 倹 樺 蛍 offers the service 倦 樺 計; 詣珍 set of services provided by facility 倹 樺 蛍 盤弁詣珍弁 噺 軽珍匪┹ 戟賃 set of facilities providing service 倦 樺 計 岫】戟賃】 噺 警賃岻┹ 系賃珍 capacity of service 倦 樺 計 at facili ty 倹 樺 蛍; 荊 set of demand points; 欠沈賃 amount of demand for service 倦 coming from demand point 件 樺 荊; 糠珍沈賃 fraction of demand for service 倦, coming from demand point 件, initially assigned to
facility in 倹 樺 蛍; 穴沈珍 distance between points 件 樺 岫荊 姦 蛍岻 and 倹 樺 蛍┻ In the following, we will introduce two models which describe two rationalisation processes that are taking place in the Italian education system, concerning (1) the clustering of pre-primary, primary and secondary institutions and (2) the reorganisation of university degree programmes. For each model an application to a real-world case study will be illustrated and discussed in order to show the capability of the model to support decisions in real contexts.
5. A Clustering Model for pre-primary, primary and secondary institutions We introduce a model for supporting decisions in merging processes that are taking place at lower levels of the Italian school system (pre-primary, primary, secondary), consisting in the grouping of single schools in clusters. According to the guidelines defined by the central government, a cluster is considered feasible if it is characterised by the presence of a single school, named cluster centre, in which the typical administrative services (i.e. planning and control, operations management, etc) are centralised and if it satisfies some requirements, in terms of composition (types of schools to be included) and minimum dimension (1000 overall number of students attending schools of the cluster). In this context, with reference to the above notation, 蛍 represents the set of points in which schools are located, while 計 噺 岶な┸に┸ぬ岼 includes the offered educational levels (in particular, we denote with 倦 噺 な the pre-primary, 倦 噺 に the primary and 倦 噺 ぬ the lower secondary level). The model aims at creating 喧 feasible clusters and identifying the related centers in order to minimise the average distance between each school and the center of its assigned cluster. This objective reproduces one of the compactness measures typically used in the literature related to districting and clustering models (Ricca et al., 2011), as it represents a good proxy of the quality of provided services. The following groups of decision variables are introduced: y棚 binary variable equal to 1 if and only if school in 倹 樺 蛍 is selected as a cluster’s
centre; x棚担 binary variable equal to 1 if and only if school in 建 樺 蛍 is assigned to the cluster with
centre in 倹 樺 蛍; Hence, the model can be formulated in terms of a location-allocation problem, as follows: mi� 権 噺 布 穴痛珍捲痛珍痛┸珍樺徴 (1) 捲痛珍 判 検珍 褐建┸ 倹 樺 蛍 (2)

7
布 捲痛珍 噺 な珍樺徴 褐建 樺 蛍 (3) 布 検珍 噺 喧珍樺徴 (4) 布 健痛賃捲痛珍痛樺徴 半 検珍 褐 倹 樺 蛍┸ 褐倦 樺 計 (5) 軽陳沈津検珍 判 布 布 欠痛賃捲痛珍 判 軽陳銚掴賃樺懲痛樺徴 褐倹 樺 蛍 (6) 検珍 噺 ど【な┹ 捲痛珍 噺 ど【な 褐建┸ 倹 樺 蛍 (7)
The objective function (1) represents the average distance between schools and their assigned cluster’s centre, to be minimised. Constraints (2) ensure that each school 建 樺 蛍 can be assigned to another school 倹 樺 蛍 only if 倹 is a cluster’s centre (検珍 噺 な); constraints (3) impose that each
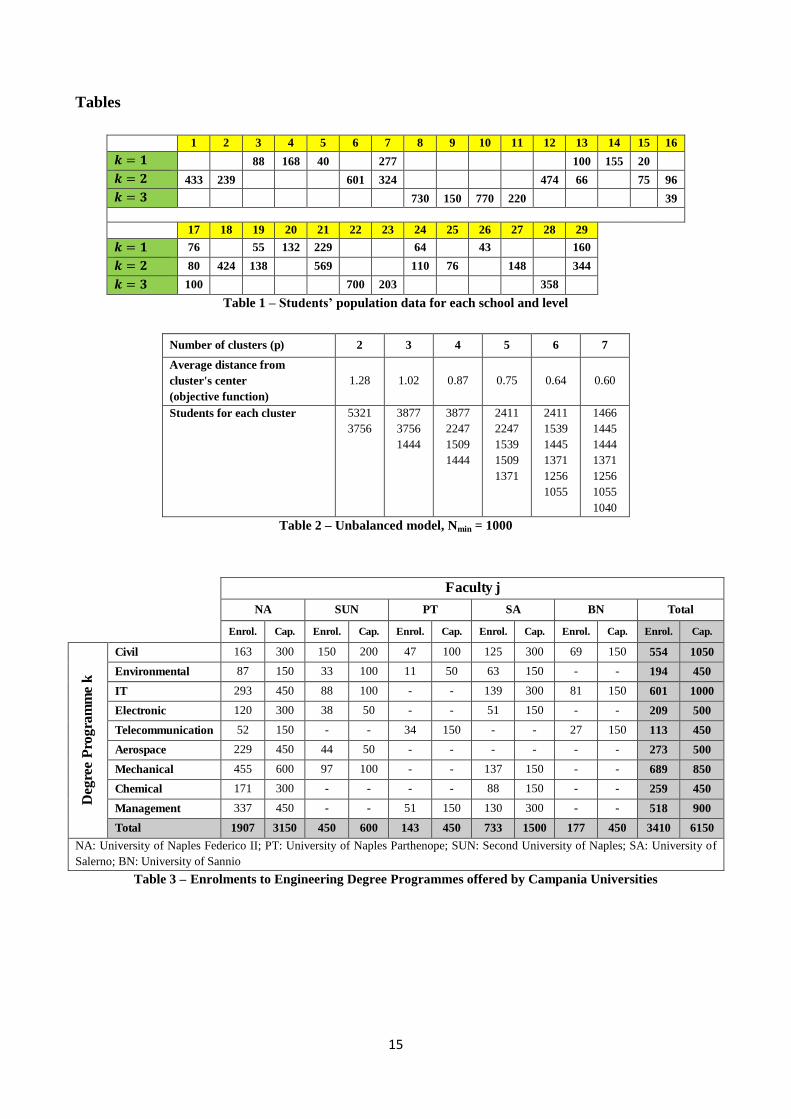
school 建 樺 蛍 can be assigned to only one cluster; while condition (4) fixes the number of clusters equal to p. Conditions (5) impose that in each cluster there is at least one school from each level. Conditions (6) ensure that each cluster has a students’population between 軽陳沈津 and 軽陳銚掴. Constraints (7) define the nature of decision variables. It has to be highlighted that, while the lower bound 軽陳沈津 is a governmental requirement, the upper bound 軽陳銚掴 has been introduced with the aim of producing more balanced clusters. This way it is possible to limit the degradation of the service deriving from the merging process; indeed, it is reasonable to assume that the higher the student population of each cluster, the lower the quality of the provided services (due to congestion effects). 5.1 Case study The model (1-7) has been applied to a real case study related to an urban district of the Municipality of Naples (about 12 km2, more than 100.000 inhabitants). In this area there are 29 schools from the three different levels, accounting for a total number of 9077 students. Figure 1 shows the distribution of schools within the district, while Table 1 reports the students’ population for each school (and the level of each school). ________________________________________________________________________________
INSERT FIGURE 1 HERE
________________________________________________________________________________ ________________________________________________________________________________
INSERT TABLE 1 HERE
________________________________________________________________________________ The proposed model has been solved using CPLEX 12.2 on an Intel Core i7 with 1.86 GigaHertz and 4.00 GigaBytes of RAM, in very limited computational times.
Table 2 shows the solutions, obtained by fixing 軽陳沈津 噺 などどど and relaxing constraints on the maximum size of clusters (軽陳銚掴 半 デ デ 欠賃痛痛樺徴賃樺懲 ), by varying the number 喧 of the produced
clusters from 2 to 7. For each solution, the objective function and the number of students for each obtained cluster (in decreasing order) are reported. As expected, the objective function decreases over p. Generally, the maximum size (in terms of students’ population) of produced clusters also

8
tends to decrease, even if this result is not guaranteed. Indeed, considering the solutions with 喧 噺 の and 喧 噺 は┸ even if the average distance decreases by 17.18% (from 0.75 to 0.64 km), the maximum size does not change. ________________________________________________________________________________
INSERT TABLE 2 HERE
________________________________________________________________________________ In order to obtain more balanced solutions, we solved the model by decreasing the value Nmax, for each value 喧, obtaining the results summarised in Figure 2. Considering a single curve (for a given value of 喧 噺 喧違), it is possible to notice that by decreasing 軽陳銚掴 the model tends to provide worse results in terms of objective function. In particular, after a threshold value, the objective function does not vary anymore, as the balancing constraint becomes not active. Furthermore, the interpretation of Figure 2 can also have interesting managerial implications. In particular, the graph can be interpreted in two ways: by fixing a value of objective function or, alternatively, by fixing a specific maximum value of clusters. In the first case, drawing a horizontal straight line (権 噺 権待), it is possible to identify:
- the values of 喧 that allow the achievement of the value 権待 of objective function; - the corresponding values of 軽陳銚掴; - subsequently, the most preferable combination 岫喧┸ 軽陳銚掴岻 for achieving the given value 権待 of
objective function. In the second case, by drawing a vertical straight line (軽 噺 軽陳銚掴) it is possible to identify:
- the values of p that allow satisfying the constraint on Nmax; - the corresponding objective function values.
Then, it could be possible to compare all the combinations 岫喧┸ 権岻 able to produce feasible clusters with a given maximum size. For example, considering 軽陳銚掴 噺 にねどど, it can be deduced that at least 4 clusters have to be formed; moreover, the objective function value improves in a very significant way by increasing 喧 from 4 to 5, while for values higher than 5 it follows a diminishing returns law. This circumstance would suggest the opening of no more than 5 clusters, as no improvements are produced that can justify the increase in costs related to higher values. ________________________________________________________________________________
INSERT FIGURE 2 HERE
________________________________________________________________________________ The case study and the related considerations developed above show how the model can be used for decision-making purposes in a real-world context. Specifically, Local Authorities (that, in Italy, are still responsible for the overall organisation of pre-primary, primary and secondary institutions) or other public bodies concerned with the centralised organisation of the provision of educational activities and programmes could use a similar tool for performing rationalisation actions in order to respond to governmental requirements or to changes in the budget allocation. Also, in a more pro-active fashion, the model can be used for performing scenario analyses for testing the effect of future policy changes (for instance, in terms of minimum and maximum student population for clusters), with the strategic aim of forecasting future issues in terms of service level and provision and highlighting intervention areas.

9
6. A Model for the Reorganisation of Degree Programmes in Higher Education Systems The next model will address the problem of the reorganisation of degree programmes offered by Italian universities. In this case, 蛍 represents the set of existing faculties, 計 is the set of degree programmes and 荊 the set of districts where students requiring such programmes live. In this context, the planner is interested to obtain a reduction of management costs by closing some programmes (or even some faculties as a whole). However, in doing this, he has to consider the consequences of this action in terms of students’ reallocation. Indeed, students attending a given programme, after its closure, could decide either to patronise another faculty still offering the same programme or even to quit their studies. Then, the interaction rule between students and faculties strongly affects the flows of students toward the programmes that will be kept open and the total attracted demand by each of them. Bruno and Genovese (2012) proved that the spatial distribution of university students over the Italian territory is well described by a gravity model (Joseph and Kuby, 2011), which takes into account not only the distance but also attractiveness factor. Coherently, it is reasonable to assume that the same rule can be used also for the reallocation of students after the closure of some programmes. Assuming that the planner aims at closing 圏 active programmes, in order to cope with the reallocated students, he could be forced to expand the capacities of still active programmes; therefore, a possible objective could be represented by the minimisation of the total extra-capacity to be activated. Considering the common notation above introduced and the following sets of decision variables: 嫌賃珍 binary decision variable equal to 1 if and only if the degree programme 倦 樺 計,
currently provided by the faculty in 倹 樺 蛍, is closed; 権珍沈賃 non-negative decision variable representing the fraction of students coming from
demand point 件 樺 荊 requiring the degree programme 倦 樺 計 (欠沈賃 ) enrolled at faculty 倹 樺 蛍 ┸ after the rationalisation action; ッ賃珍 non-negative integer decision variable, denoting the extra-capacity needed for the
degree programme 倦 樺 計 at faculty in 倹 樺 蛍 to satisfy the reallocated demand. the model can be formulated as follows: 兼件券 権 噺 布 布 ッ賃珍珍樺徴賃樺懲 (8) 嫌賃珍 判 健賃珍 褐倹 樺 蛍┸ 褐倦 樺 計 (9) 布 嫌賃珍斬樺雑 噺 圏
(10) 権珍沈賃 髪 嫌賃珍 判 健賃珍 褐件 樺 荊┸ 褐倹 樺 蛍┸ 褐倦 樺 計 (11) 布 権珍沈賃珍樺徴 噺 な 褐件 樺 荊┸ 褐倦 樺 計 (12)
権珍沈賃 噺 糠珍沈賃盤な 伐 嫌賃珍匪デ 糠痛沈賃岫な 伐 嫌賃痛岻痛樺徴 褐件 樺 荊┸ 褐倦 樺 計, 褐倹 樺 蛍 (13) 布 欠沈賃権珍沈賃沈樺彫 伐 ッ賃珍判 系賃珍 褐倹 樺 蛍┸ 褐倦 樺 計 (14)

10
嫌賃珍 樺 岶ど【な岼┸ 権珍沈賃 半 ど┸ ッ賃珍樺 軽 褐件 樺 荊┸ 褐倹 樺 蛍┸ 褐倦 樺 計 (15)
The objective function (8) represents the total extra-capacity needed to satisfy the reallocated demand. Constraints (9) ensure that a programme 倦 at faculty 倹 may be closed (嫌賃珍 噺 な) if and only
if it is currently offered by it (健賃珍 噺 な). Condition (10) defines the overall number of programmes to
be closed. Constraints (11) impose that, for each 件, the demand for service 倦 can be assigned only to faculties 倹 that offered (健賃珍 噺 な) and still offer 倦 (嫌賃珍 噺 ど). Conditions (12) guarantee that, for each 件, all the demand for service 倦 is covered, thanks to the contribution of faculties still providing that service. Conditions (13) rule the allocation of the demand after the closure of some existing programmes. In particular, they impose that, if the faculty in 倹 still offers programme 倦 (嫌賃珍 噺 ど),
the fraction of demand from 件 assigned to 倹 盤権珍沈賃匪 is calculated by normalising the current fraction 糠珍沈賃 over the sum of the fractions assigned to the other faculties still providing 倦. More precisely, if
programme 倦 remains active at every faculty 倹 樺 戟賃, the allocation does not change 盤権珍沈賃 噺 糠珍沈賃匪┸ being the denominator equal to 1; on the contrary, if 倦 is closed at some faculties, the denominator
is lower than 1 盤デ 糠痛沈賃岫な 伐 嫌賃痛岻 隼 な痛樺徴 匪 and then the fraction allocated to each active faculty is
higher than the current value 糠痛沈賃. Constraints (14) indicate that, for each service 倦┸ the total demand assigned to facility 倹 must not exceed its capacity, including the extra-capacity ッ賃珍.
Constraints (15) define the nature of decision variables. As concerns constraints (13), it should be noticed that they are not-linear and, hence, could make the model much harder to be solved. A possible linearisation of such group of constraints is provided by adapting the procedure proposed by Aros-Vera et al. (2013) with reference to a Logit model. 6.1 Case study We apply the proposed model to analyse the regional university system of Campania (Italy). Campania is the second most populated region in Italy, with about 6 million of inhabitants (density of 425 inhabitants per km2); it is divided in 551 municipalities and hosts 7 public universities, with 5 Engineering Faculties. These faculties (NA: University of Naples Federico II; PT: University of Naples Parthenope; SUN: Second University of Naples; SA: University of Salerno; BN: University of Sannio) offer a wide range of degree programmes, which can be classified into 9 different groups (Civil, Environmental, IT, Electronic, Telecommunication, Aerospace, Mechanical, Chemical and Management Engineering), and attract a very large number of students. Historical data about enrollments for each degree programme are available with reference to the single municipalities of the region, and they were assumed equal to the average value over the last six years, i.e. from the 2008/2009 to 2013/2014. However, in order to aggregate demand data in a manageable way, the zoning introduced by Bruno and Improta (2008) is adopted. This way, Campania Region has been divided into 58 districts as shown in Figure 3, in which the position of each faculty is also highlighted. Accordingly, the set 荊 of demand points coincides with the set of centroids of the 59 districts, while values 欠沈賃 represent the total number of students coming from district 件 enrolling to the degree programme 倦┻ As an example, Figure 4 shows a graphical
representations of values 糠珍沈賃 for the specific degree programmes in Civil Engineering.
________________________________________________________________________________INSERT FIGURES 3 AND 4 HERE

11
________________________________________________________________________________ Table 3 reports, for each degree programme 倦 and each faculty 倹, the total number of students
enrolled 盤畦賃珍 噺 デ 糠珍沈賃欠沈賃沈 匪 and the related capacity 系賃珍. In particular, capacities are fixed on the
basis of the characteristics of the availability of resources at hosting faculties, as defined by the Italian Ministry of Higher Education (CNVSU, 2011). ________________________________________________________________________________
INSERT TABLE 3 HERE
________________________________________________________________________________ The model has been solved by varying the number q of degree programmes to be closed. All the istances were solved by using CPLEX 12.2 on an Intel Core i7 with 1.86 GigaHertz and 4.00 GigaBytes of RAM, in limited computational times. Some interesting managerial insights can be drawn from Figure 5a (illustrating the pattern of the objective function, representing the required additional capacity) and Figure 5b (showing the variation of the utilisation rate over q). The utilisation rate was calculated as the ratio between the total demand in the region 盤デ 欠沈賃沈┸賃 匪 and the total capacity available at the remaining services 盤デ 系賃珍盤健賃珍 伐 嫌賃珍匪 髪 ッ賃珍珍┸賃 匪, i.e. the capacity of remaining services plus the activated additional
capacities. Analysing these figures, it can be noticed that the closure of a significant number of services (q11) can be performed without utilising any additional capacity. This aspect can be
interpreted as a signal of the current inefficiency of the overall system, due to a significant excess of capacity in offered programmes. This fact is confirmed by the current low value of the overall utilisation degree (equal to 3423/6150=0.54, Figure 5b). The reduction of the number of active services (with no activation of additional capacity) allows increasing the degree of overall capacity utilisation of the system up to a maximum value of about 0.70. In order to reach better levels of capacity utilisation, it is necessary to close more services (q12) and invest in additional capacity. However, by closing more services, the remaining ones get
more and more utilised; therefore, even large increases in additional capacity produce very limited improvements in the overall utilisation rate (q16). Hence, the marginal contribution of the
investment in additional capacity on the overall utilisation rate decreases significantly. As an illustrative example, in Table 4 we show the results obtained for 圏= 11. In particular, the table provides, for each degree programme at each faculty, the utilisation rate (i.e., the ratio between enrollments and capacity) before and after the closure of 11 programmes (marked in the table with N/A, meaning that the utilisation rate for such services cannot be calculated, as they have been closed). It can be noticed that the model tends to close services with lower enrollment rates, as reallocating these demand portions is the least costly option. In particular, this solution is characterised by the closure of all the degree programmes offered by the engineering faculty at Parthenope University. ________________________________________________________________________________
INSERT FIGURES 5a AND 5b HERE
________________________________________________________________________________ ________________________________________________________________________________
INSERT TABLE 4 HERE
________________________________________________________________________________

12
The above considerations show how also this model can be used for performing rationalisation actions in a real-world context and, specifically, in the Italian context. The most recent reform of the governance of the Italian university system (Law n. 240, 30.12.2010, http://www.camera.it/parlam/leggi/10240l.htm), explicitly included the Article 3 ("Federation and merging of universities and rationalization of the offered curricula") in which legislator promotes, also providing financial incentives, such rationalization processes. However it is underlined that the acceptance of a project oriented to this direction is dependent on an analitic proposal in which the economic and logistic sustainability of future scenarios and the achievement of efficiency goals are clearly shown. To this aim appropriate tools and models able to put in evidence redundancies (in terms, for instance, of under-utilised degree programmes) in the educational offer, and subsequently perform well-informed actions for improving the financial sustainability of the system, without penalizing users to a large extent may be of great interest. Again, a central decision maker can use such models both in a reactive fashion (in order to respond to changes in legislation and funding regimes, that could make the current offer unsustainable) and in a pro-active one (for performing autonomous rationalisation actions, or for undertaking some scenario analyses).
7. Conclusions During the last decade, the economic recession has produced a severe stress on European education systems, mainly due to funding cuts driven by austerity measures. Among the others, Italy has experienced strong reductions to the budget for state-funded education. In this context, Italian governmental institutions have started to perform rationalisation actions, aimed at improving the affordability of the system by modifying the current configuration of the existing facilities offering educational services (either by entirely closing and merging some of them, or by downsizing or transferring capacities), while still providing a required minimum service level. These decisions may have a strategic value given their long-term impact, and should be planned by taking into account different perspectives. Indeed, while planning authorities would be interested in the improvement of financial sustainability, users will be damaged by the loss of educational facilities (as, for instance, students will have to travel farther for accessing schools or academic sites). Therefore, to effectively solve these problems, appropriate models can provide support to decision-makers in order to find trade-off solutions between two inherently conflicting goals: the maximisation of the benefit due to the rationalisation action (taking into account planner perspective) and the minimisation of the damage due to the action itself (taking into account user perspective). In particular, these problems could be effectively described by adapting models from the very well established class of location and districting problems. After a review of the extant literature, this paper has presented two original mathematical models for addressing reorganisation decisions concerning different levels of Italian education system. Compared to contributions available in the literature, the two described models have been dealing with strategic rationalisation decisions in which the main driver is represented by budgetary constraints making the current educational supply system unaffordable and unsustainable, with the objective of improving the affordability of the system and containing the damage to service levels. Both the models have been tested on case studies dealing with rationalisation actions concerning the Italian education systems; results have shown that the models can be used in an effective way by central decision-makers to deal with real-world problems, also thanks to the very limited computing times needed to find the optimal solution though a commercial solver. The analysis of the results

13
also showed how the models can be used for planning purposes, in order to investigate rationalisation actions in response to changes in legislation and funding regimes or to undertake scenario analyses. Future researches will be devoted in order to verify the opportunity to adapt the proposed models to describe further real-world cases also related to different national educational contexts.
References Aros-Vera F, Marianov V and Mitchell J E (2013). p-Hub approach for the optimal park-and-ride
facility location problem. European Journal of Operational Research, 226: 277 – 285. Brown P J B (1987). Trade-off and compromise in secondary school reorganisation schemes: a goal
programming approach. Papers in Regional Science, 61:115-130. Bruno G and Improta G (2008). Using Gravity Models for the Evaluation of New University Site
Locations: a Case Study. Computers & Operations Research, 35(2): 436–444. Bruno G and Genovese A (2012). A Spatial Interaction Model for the Representation of the
Mobility of University Students on the Italian Territory. Networks and Spatial Economics, 12: 41–57.
Caro F, Shirabe T, Guignard M and Weintraub A (2004). School redistricting: embedding GIS tools with integer programming. Journal of the Operational Research Society, 55:836-849.
CNVSU (2011). Undicesimo rapport sullo stato del sistema universitario italiano. Available online at: http://www.cnvsu.it/_library/downloadfile.asp?id=11778.
Craig J (1981). The expansion of education. Review of research in education, 9: 151–213. Drucker J (2015). Reconsidering the Regional Economic Development Impacts of Higher
Education Institutions in the United States. Regional Studies, (ahead-of-print), 1-18. European Commission (2012). The 2012 Ageing Report Economic and budgetary projections for
the 27 EU Member States (2010-2060). Available online at: http://europa.eu/epc/pdf/economic_and_budgetary_projections_for_the_27_eu_member_states__en.pdf
European Commission/EACEA/Eurydice, 2013. Funding of Education in Europe 2000-2012: The Impact of the Economic Crisis. Eurydice Report. Luxembourg: Publications Office of the European Union.
Ferrari I and Zanardi A (2012). Decentralisation and interregional redistribution in the Italian education system. Education Economics, (ahead-of-print), 1-20.
Garnier M A and Hage J (1991). Class, gender and school expansion in France: a four-systems comparison. Sociology of education, 64: 229-250.
Grimaldi E and Serpieri R (2012). The transformation of the Education State in Italy: a critical policy historiography from 1944 to 2011. Italian journal of sociology of education, 10(1): 146-180.
Holloway C A, Wehrung D A, Zeitlin M P and Nelson R T (1975). An interactive procedure for the school boundary problem with declining enrollment. Operations Research, 23:191-206.
Joseph L and Kuby M (2011). Gravity Modeling and its Impacts on Location Analysis. In Foundations of Location Analysis (Eiselt H.A., Marianov V., Eds.) Springer New York.
14
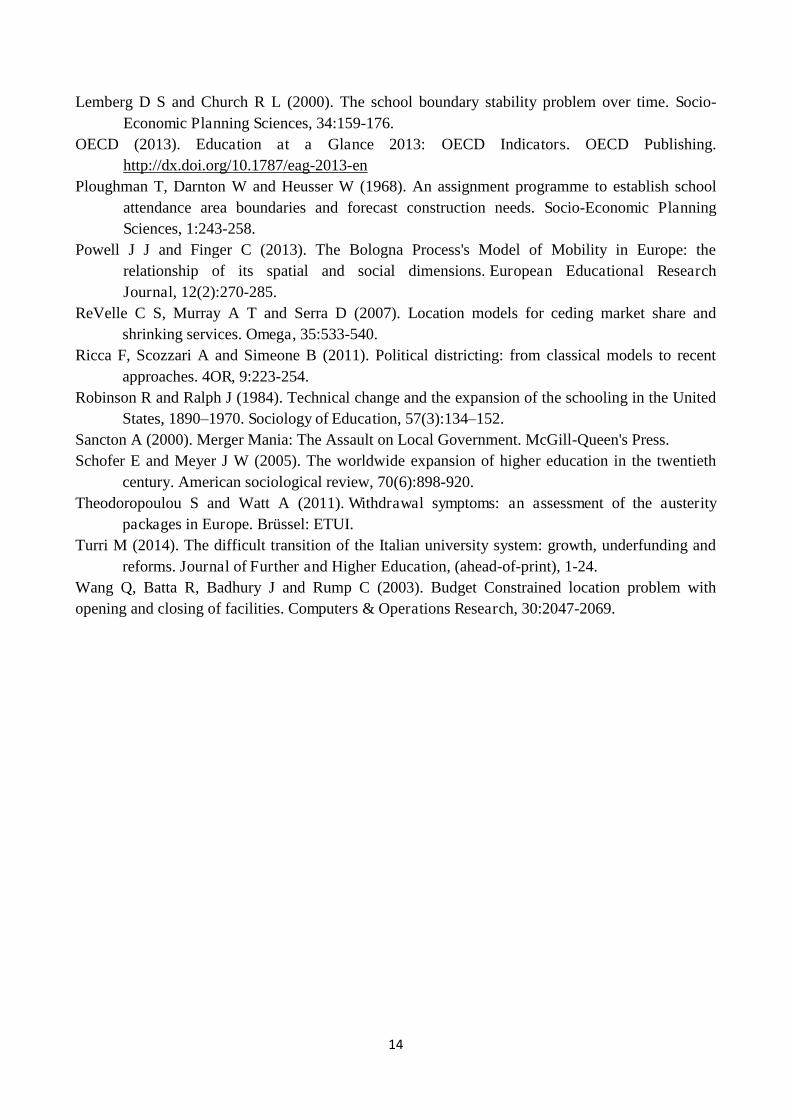
Lemberg D S and Church R L (2000). The school boundary stability problem over time. Socio-Economic Planning Sciences, 34:159-176.
OECD (2013). Education at a Glance 2013: OECD Indicators. OECD Publishing. http://dx.doi.org/10.1787/eag-2013-en
Ploughman T, Darnton W and Heusser W (1968). An assignment programme to establish school attendance area boundaries and forecast construction needs. Socio-Economic Planning Sciences, 1:243-258.
Powell J J and Finger C (2013). The Bologna Process's Model of Mobility in Europe: the relationship of its spatial and social dimensions. European Educational Research Journal, 12(2):270-285.
ReVelle C S, Murray A T and Serra D (2007). Location models for ceding market share and shrinking services. Omega, 35:533-540.
Ricca F, Scozzari A and Simeone B (2011). Political districting: from classical models to recent approaches. 4OR, 9:223-254.
Robinson R and Ralph J (1984). Technical change and the expansion of the schooling in the United States, 1890–1970. Sociology of Education, 57(3):134–152.
Sancton A (2000). Merger Mania: The Assault on Local Government. McGill-Queen's Press.
Schofer E and Meyer J W (2005). The worldwide expansion of higher education in the twentieth century. American sociological review, 70(6):898-920.
Theodoropoulou S and Watt A (2011). Withdrawal symptoms: an assessment of the austerity packages in Europe. Brüssel: ETUI.
Turri M (2014). The difficult transition of the Italian university system: growth, underfunding and reforms. Journal of Further and Higher Education, (ahead-of-print), 1-24.
Wang Q, Batta R, Badhury J and Rump C (2003). Budget Constrained location problem with opening and closing of facilities. Computers & Operations Research, 30:2047-2069.
15
Tables
1 2 3 4 5 6 7 8 9 10 11 12 13 14 15 16 暫 噺 層 88 168 40 277 100 155 20 暫 噺 匝 433 239 601 324 474 66 75 96 暫 噺 惣 730 150 770 220 39
17 18 19 20 21 22 23 24 25 26 27 28 29 暫 噺 層 76 55 132 229 64 43 160 暫 噺 匝 80 424 138 569 110 76 148 344 暫 噺 惣 100 700 203 358
Table 1 – Students’ population data for each school and level
Number of clusters (p) 2 3 4 5 6 7
Average distance from cluster's center (objective function)
1.28 1.02 0.87 0.75 0.64 0.60
Students for each cluster 5321 3756
3877 3756 1444
3877 2247 1509 1444
2411 2247 1539 1509 1371
2411 1539 1445 1371 1256 1055
1466 1445 1444 1371 1256 1055 1040
Table 2 – Unbalanced model, Nmin = 1000 Faculty j NA SUN PT SA BN Total
Enrol. Cap. Enrol. Cap. Enrol. Cap. Enrol. Cap. Enrol. Cap. Enrol. Cap.
Deg
ree
Pro
gram
me
k
Civil 163 300 150 200 47 100 125 300 69 150 554 1050
Environmental 87 150 33 100 11 50 63 150 - - 194 450
IT 293 450 88 100 - - 139 300 81 150 601 1000
Electronic 120 300 38 50 - - 51 150 - - 209 500
Telecommunication 52 150 - - 34 150 - - 27 150 113 450
Aerospace 229 450 44 50 - - - - - - 273 500
Mechanical 455 600 97 100 - - 137 150 - - 689 850
Chemical 171 300 - - - - 88 150 - - 259 450
Management 337 450 - - 51 150 130 300 - - 518 900
Total 1907 3150 450 600 143 450 733 1500 177 450 3410 6150
NA: University of Naples Federico II; PT: University of Naples Parthenope; SUN: Second University of Naples; SA: University of Salerno; BN: University of Sannio
Table 3 – Enrolments to Engineering Degree Programmes offered by Campania Universities

16
Faculty j
NA SUN PT SA BN Before After Before After Before After Before After Before After
Deg
ree
Pro
gram
me
k
Civil 0.77 0.88 0.89 0.97 0.61 N/A 0.42 0.45 0.34 0.35
Environmental 0.64 0.77 0.52 0.57 0.57 N/A 0.35 0.37 - -
IT 0.74 0.95 0.99 N/A - - 0.29 0.30 0.28 0.31
Electronic 0.33 0.59 0.83 N/A - - 0.23 N/A - -
Telecommunication 0.61 N/A - - 0.15 N/A - - 0.08 0.84
Aerospace 0.43 0.53 0.93 N/A - - - - - -
Mechanical 0.73 0.88 0.91 N/A - - 0.60 0.61 - -
Chemical 0.66 0.82 - - - - 0.31 N/A - -
Management 0.93 0.99 - - 0.21 N/A 0.25 0.25 - -
Total 0.67 0.77 0.85 0.42 0.32 N/A 0.34 0.30 0.23 0.50
NA: University of Naples Federico II; PT: University of Naples Parthenope; SUN: Second University of Naples; SA: University of Salerno; BN: University of Sannio
Table 4 – Capacity utilisation rate before and after the closure of q= 11 services

17
Figures
Figure 1 – Distribution of schools within the study region
Figure 2 – Average distance in function of 錆仕珊姉
Figure 3 – Engineering Faculties within Campania Region and zoning system

18
NA PT
SA BN
SUN
Figure 4 – Students Distribution among Engineering Faculties (Civil Engineering)

19
Figure 5a – Variation of the objective function over the number of degree programmes (q) to be closed
Figure 5b – Variation of the overall utilisation rate over the number of degree programmes (q) to be closed
0
100
200
300
400
500
600
700
0 1 2 3 4 5 6 7 8 9 10 11 12 13 14 15 16 17 18 19 20
0,40
0,50
0,60
0,70
0,80
0,90
1,00
0 1 2 3 4 5 6 7 8 9 10 11 12 13 14 15 16 17 18 19 20

20
Appendix
Conditions (13) have been replaced in the model by the group of constraints (16): 権珍沈賃 判 糠珍沈賃糠追沈賃 権追沈賃 髪 嫌賃追 褐件 樺 荊┸ 褐倦 樺 計, 褐倹┸ 堅 樺 戟賃┺ 倹 塙 堅 (16)
It is easy to prove that, for a given service 倦, conditions (16) become redundant, for any 件 樺 荊, if 倦 has been closed at least at one of the two facilities 倹 and 堅 (i.e., if 嫌賃追 OR 嫌賃珍 are equal to 1); they
become active if and only if both facilities 倹 and 堅 already provided 倦 (i.e., if 嫌賃追 AND 嫌賃珍 are equal
to 0). In this case, the paired conditions associated with 倹 and 堅 impose the relation (17) between the
variables 権追沈賃 and 権珍沈賃:
権珍沈賃 噺 糠珍沈賃糠追沈賃 権追沈賃 褐件 樺 荊 (17)
It follows that, for any user 件┸ it is possible to express the fraction of demand assigned to any
facility 倹, still providing 倦, as a function of the same variable 権追沈賃. Then by replacing such expressions in condition (4), it follows: デ 権珍沈賃珍樺徴 噺 デ 権珍沈賃珍樺腸入┺嫌倦倹噺ど 噺 権珍迭沈賃 髪 権珍鉄沈賃 髪 橋 噺 磐底乳迭日入底認日入 髪 底乳鉄日入底認日入 髪 橋 卑 権追沈賃 噺 な . and then: 権追沈賃 噺 糠追沈賃糠珍迭沈賃 髪 糠珍鉄沈賃 髪 橋 噺 糠追沈賃デ 糠珍沈賃倹樺戟倦┺鎚入乳退待
which is equivalent to condition (13).

![h v ] o o W ] + v s o Z o } v Á v D P - Konkurransetilsynet · Mergers sometimes a ect vertical relations between merging and non-merging rms. Vertically integrated non-merging rms](https://img.dokumen.tips/doc/110x75/5e78f76e5d039739614fac94/h-v-o-o-w-v-s-o-z-o-v-v-d-p-konkurransetilsynet-mergers-sometimes-a.jpg)