Embed Size (px)
Citation preview

Institutionen för datavetenskap Department of Computer and Information Science
Final Thesis
A Computational Analysis of Driving Variations in a Distributed Simulated
Driving Environment
By
Ansar-Ul-Haque Yasar Adeel Jameel
LITH-IDA-EX--07/051--SE
2007-09-28


Linköpings universitet Department of Computer and Information Science
Final Thesis
A Computational Analysis of Driving Variations in a Distributed Simulated
Driving Environment
By
Ansar-Ul-Haque Yasar Adeel Jameel
LITH-IDA-EX--07/051--SE
2007-09-28
Examiner: Prof. Dr. Arne Jönsson Supervisor: Dr. Rego Granlund
Department of Computer and Information Science, Linköping University, Sweden.


ii
Dedication
We dedicate our work to our loving parents, who have always been there for us, for their love, prayer, trust and encouragement in everything we do.

iii

iv
Acknowledgement
This study was conducted at Linköping University (LiU) at the Department of Computer and Information Sciences (IDA). We would like to express our heartfelt thanks and gratitude to Dr. Rego Granlund and Ms. Helena Granlund for their advice and guidance in our project. Without their able guidance it would have been very difficult for us to complete our project in time. This study was supported and funded by the IVSS project; we are indebted to Swedish Road Administration, Autoliv Development AB, SAAB Technologies AB and Volvo Car Corporation for having so generously provided us with the hardware required for the project. We are equally grateful to Prof. Kip Smith and Prof. Arne Jönsson for providing us with useful information regarding the subject area of our project. We would like to express our special thanks and gratitude to all of the individuals who participated in out research study. Without their kind cooperation it would have been difficult for us to complete the project. Last but not the least, our thanks to our family for their patience and cooperation in completing our work. Linköping 2007-09-28

v

vi
Abstract
This Master thesis report is the research conducted at the Linköping University (LiU) in the Cognitive Engineering group. This report describes and discusses the possible driving variations at T-intersections. In this study we tested how voice based command (GPS) system and traffic lights did influence the driving behavior. This computational study was conducted on a multi user driving simulation environment at Linköping University. A total of 12 groups each consisting of 4 persons participated in this study. The participants also completed a survey on paper with their valuable comments. To study the driving behavior we analyzed the conflict indicators at the T-intersection. We selected Post Encroachment Time (PET), speed and acceleration as good conflict indicators. Keywords: Simulators, Driving, Computational Analysis, Distributed, Driving Variations

vii
viii
Table of Contents 1. Introduction ................................................................................................................ 1
1.1. Aim ....................................................................................................................... 2 1.2. Accidents Background ...................................................................................... 2 1.3. Limitations ........................................................................................................... 4
2. Literature Study ........................................................................................................ 5 2.1. Simulator research ............................................................................................ 5
2.1.1. Simulated experimentation study ............................................................ 5 2.2. Factors influencing safety ................................................................................ 7
2.2.1. Effect of Stress on driving behavior ........................................................ 7 2.2.2. Variations and traffic velocity ...................................................................... 8 2.2.3. Violation of expectations .......................................................................... 9
2.3. Conflict Indicating Variables .......................................................................... 10 2.3.1. Time to Collision (TTC) ........................................................................... 11 2.3.2. Extended Time to Collision (TET, TIT) ................................................. 11 2.3.3. Time to Accident (TA) .............................................................................. 12 2.3.4. Post-Encroachment Time (PET) ............................................................ 12 2.3.5. Gap Time ................................................................................................... 12
2.4. Schwartz’s Configural Model ......................................................................... 13 2.5. NEO Five Factor Inventory (Neo-FFI) .......................................................... 15 2.6. Questionnaires ................................................................................................. 16
2.6.1. Conflict avoidance, Time horizon and Tolerance for uncertainty ..... 16 2.6.2. Locus of control ........................................................................................ 16 2.6.3. Driver Behavior Questionnaire (DBQ) .................................................. 16 2.6.4. Driver Style Questionnaire (DSQ) ......................................................... 17
2.7. Data Analyzer Study ....................................................................................... 18 3. Research Questions .............................................................................................. 19 4. Methods ................................................................................................................... 21
4.1. Participants ....................................................................................................... 21 4.2. Simulated scenario design study .................................................................. 21
4.2.1. Apparatus .................................................................................................. 21 4.2.2. The Simulator ............................................................................................ 22 4.2.3. The Simulated Environment ................................................................... 22
4.3. Tasks ................................................................................................................. 26 4.4. Questionnaires ................................................................................................. 27 4.5. Procedure ......................................................................................................... 27
4.5.1. The Cycles................................................................................................. 28 4.5.2. Pilot Study ................................................................................................. 28
4.6. Data Collection ................................................................................................. 28 5. Results ..................................................................................................................... 29
5.1. Scenarios ............................................................................................................. 29 5.2. Post Encroachment Time (PET) ...................................................................... 30 5.3. Speed ................................................................................................................ 31
ix
5.4. Acceleration ...................................................................................................... 31 6. Analysis .................................................................................................................... 33
6.1. Expectations and Outcomes .......................................................................... 33 6.2. Claims ................................................................................................................ 34
7. Conclusion and Future Work ................................................................................ 35 8. References .................................................................................................................. 36 9. Appendix ..................................................................................................................... 39
9.1. Data Analyzer Source Code .......................................................................... 39

x
List of Figures Figure 1: Crossing Path Collision ....................................................................................... 3 Figure 2: Turning Path Collision ........................................................................................ 3 Figure 3: Road Traffic Accidents in Sweden 2005 ............................................................. 4 Figure 4: The Time Exposed and Time Integrated TTC proximal safety indicator measures proposed byMinderhoud and Bovy (2001) ....................................................... 11 Figure 5: Grading scale used in the Schwartz value survey. ............................................ 14 Figure 6: Relational Value Model. .................................................................................... 15 Figure 7: The driving simulator at IDA. Figure 8: One of the driving simulators. . 22 Figure 9: The Sävenäs intersection. .................................................................................. 23 Figure 10: Grid view of the world used. Figure 11: Simulated World. ......................... 24 Figure 12: STControl for displaying the environment information. ................................. 25 Figure 13: One of the signs. .............................................................................................. 26 Figure 14: Total Number of Meetings in all four sessions. .............................................. 29 Figure 15: PET variation in all four sessions. ................................................................... 30 Figure 16: Speed variation in all four sessions. ................................................................ 31 Figure 17: Acceleration variation in all four sessions. ..................................................... 32
xi
List of Tables
Table 1: Value types and descriptions of the Schwartz value survey. .............................. 14 Table 2: Neo-FFI description. ........................................................................................... 15 Table 3: Scale for Neo-FFI questionnaire. ........................................................................ 15 Table 4: The driver behavior questionnaire Scale. ........................................................... 17 Table 5: The mean and standard deviation of participants’ age and driving experience in years. ................................................................................................................................. 21 Table 6: Summary of Scenarios used for experimentation. .............................................. 24 Table 7: The order of scenarios. ....................................................................................... 25 Table 8: The sentences. ..................................................................................................... 26 Table 9: The fixed order of questionnaires. ...................................................................... 27
xii
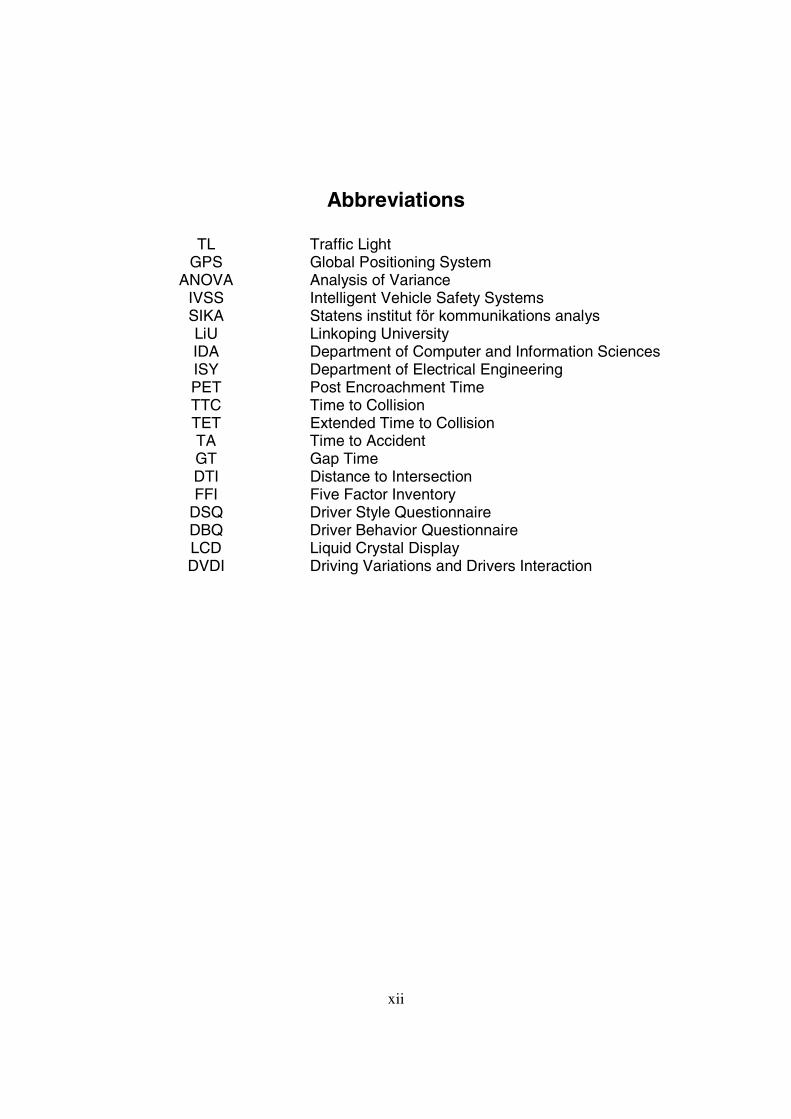
Abbreviations
TL Traffic Light GPS Global Positioning System
ANOVA Analysis of Variance IVSS Intelligent Vehicle Safety Systems SIKA Statens institut för kommunikations analys LiU Linkoping University IDA Department of Computer and Information Sciences ISY Department of Electrical Engineering PET Post Encroachment Time TTC Time to Collision TET Extended Time to Collision TA Time to Accident GT Gap Time DTI Distance to Intersection FFI Five Factor Inventory
DSQ Driver Style Questionnaire DBQ Driver Behavior Questionnaire LCD Liquid Crystal Display DVDI Driving Variations and Drivers Interaction

xiii

Chapter 1 Introduction
1
1. Introduction With the increase in the traffic density on the roads the risks of traffic accidents are increasing day by day. Probability of an accident to occur depends on driving variations between different drivers. Many factors like mood, velocity, situation and environment determine the driving variations. These variations generate need for research studies related to the driving safety and development of an intelligent vehicle safety system. Such systems can help in prevention of road accidents. This study related to driving variations as an important step for identifying the risk factors that may cause an accident. An accident refers to a situation that results in a collision between two or more vehicles, while an incident is a near-accident; situations where two or more vehicles are spatially and/or temporally close to a collision. By an article from the Ministry of Interior in Sweden, almost every fifth casualty is at an intersection, whereas two-third of all accidents that lead to serious injuries takes place in or near an intersection (Chalmers). Traffic accident can cause a lot of damage, not only personal injuries and causalities, but also financial and material damage to the vehicle and property. Most of these accidents can be attributed to human error. Statistics has shown that of all road traffic accidents that occur in Sweden each year. There were a total of 1098 fatal or severe vehicle accidents in 2005 and intersections accidents represent almost half of these accidents (SIKA 2006). These statistics provoked us for conducting a comprehensive research on the driving variations at intersections which can help in the future for road and traffic safety. There are a number of techniques like field studies (may also be called as simulations), surveys or interviews for collecting traffics information. Our study to determine the driving variations at the intersections was conducted with the use of a multi-user distributed driving simulator and a set of questionnaires. Questionnaires helped to identify the personality traits. We used Post Encroachment Time (PET) algorithm to calculate and classify the difference in time between two vehicles approaching an intersection in a simulated environment. This study was conducted at the Department of Computer and Information Sciences, Linköping University (LiU) in an ongoing project supported and funded by the Swedish Road Administration and Autoliv Research. The title of the project is ‘Intersection Accidents’ and a part of Intelligent Vehicle Safety Systems (IVSS) by Autoliv research. Volvo Car Corporation and Saab Automobiles AB are the industrial partners. Other academic partners are Chalmers University

Chapter 1 Introduction
2
(Department of Machine and Vehicle Systems) and the Department of Electrical Engineering (ISY) at Linköping University (LiU). This project is a sub-part of the Intelligent Vehicle Safety System (IVSS) project by Autoliv research to improve the road safety. Due to the high rate of accidents at the intersections our research focuses on the Sävenäs T-intersection in Gothenburg. Sävenäs T-intersection has a low traffic safety causing many accidents. The major project is subdivided into three parts; one part analyzes the driving patterns of the Sävenäs intersection by recording the real intersection with video cameras; the second part let subjects drive in the intersection with an instrumented vehicle equipped with eye-tracking device, a GPS and a radar to study the drivers point to attraction; and the third and the final part is a set of simulated studies in a distributed multi user driving simulated environment at Linköping University (LiU) Sweden. Simulator study in divided into two groups, one responsible for analyzing the PET, speed and acceleration data whereas the other group was responsible for running some co relational analyses on the questionnaire data collected. The main focus is to analyze the PET, speed and acceleration data. 1.1. Aim Our study helps the IVSS project to collect driving behavior at T-intersections in which we have used a controlled and close to reality; simulated driving environment. Our experiments further enable us to conclude that with the change in the driving scenarios tends to alter the driving behavior at the intersections. Our study will also enable the researchers to investigate the environmental quality of the research in a simulated environment. This study will help us and other researchers to identify various experimentation scenarios to get better results. It can also discover the possible limitations of a simulated environment with the remedies to overcome those limitations. 1.2. Accidents Background Automobile accidents are the main cause of tragic personal injuries and unjust death to thousands people on our nation's highways and roads every year. The World Health Organization has reported death of almost 3000 people every day as an outcome of a traffic accident. These figures are around 1.2 million, even worse, around the globe. Death due to traffic accidents constitutes 65% of the total deaths and it is going to increase with every day. This may be the third largest cause in the coming years predicted to be 2020. According to SIKA’s research (the Institute for Communication Analysis Sweden) in 2006, the most number of road traffic accidents occur at intersections in most parts of the world. The statistics of the road traffic accidents at intersections
Chapter 1 Introduction
3
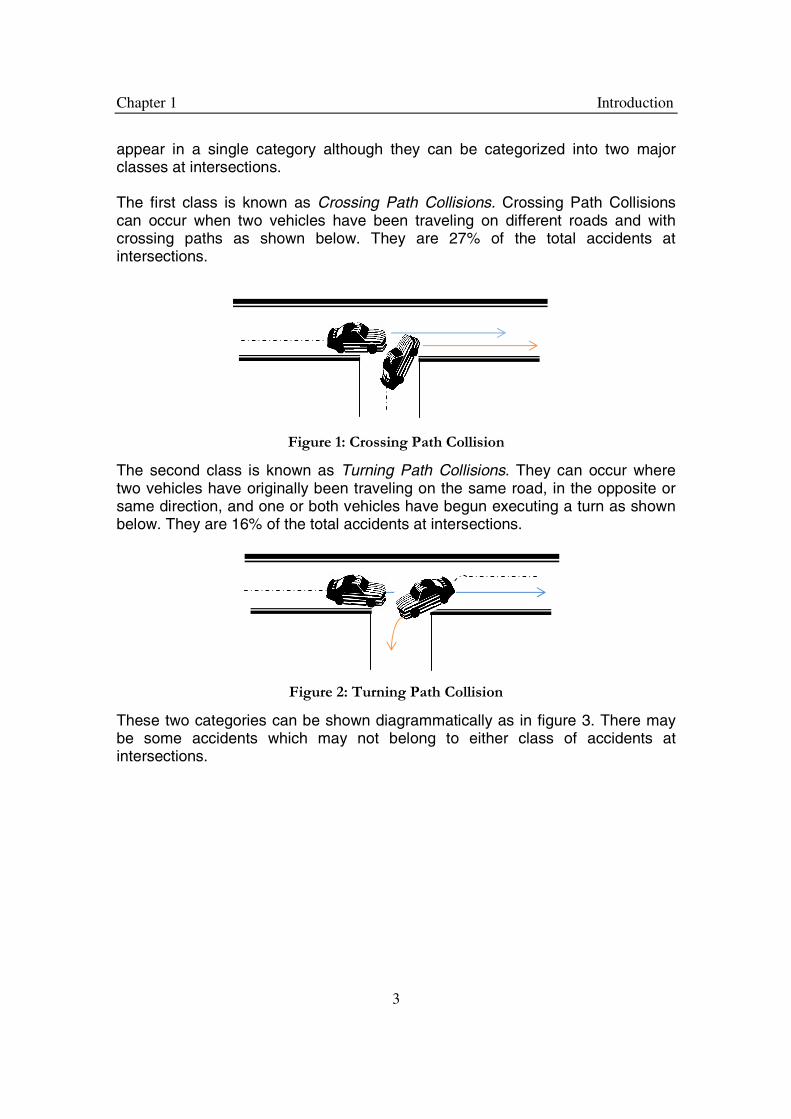
appear in a single category although they can be categorized into two major classes at intersections. The first class is known as Crossing Path Collisions. Crossing Path Collisions can occur when two vehicles have been traveling on different roads and with crossing paths as shown below. They are 27% of the total accidents at intersections.
Figure 1: Crossing Path Collision
The second class is known as Turning Path Collisions. They can occur where two vehicles have originally been traveling on the same road, in the opposite or same direction, and one or both vehicles have begun executing a turn as shown below. They are 16% of the total accidents at intersections.
Figure 2: Turning Path Collision
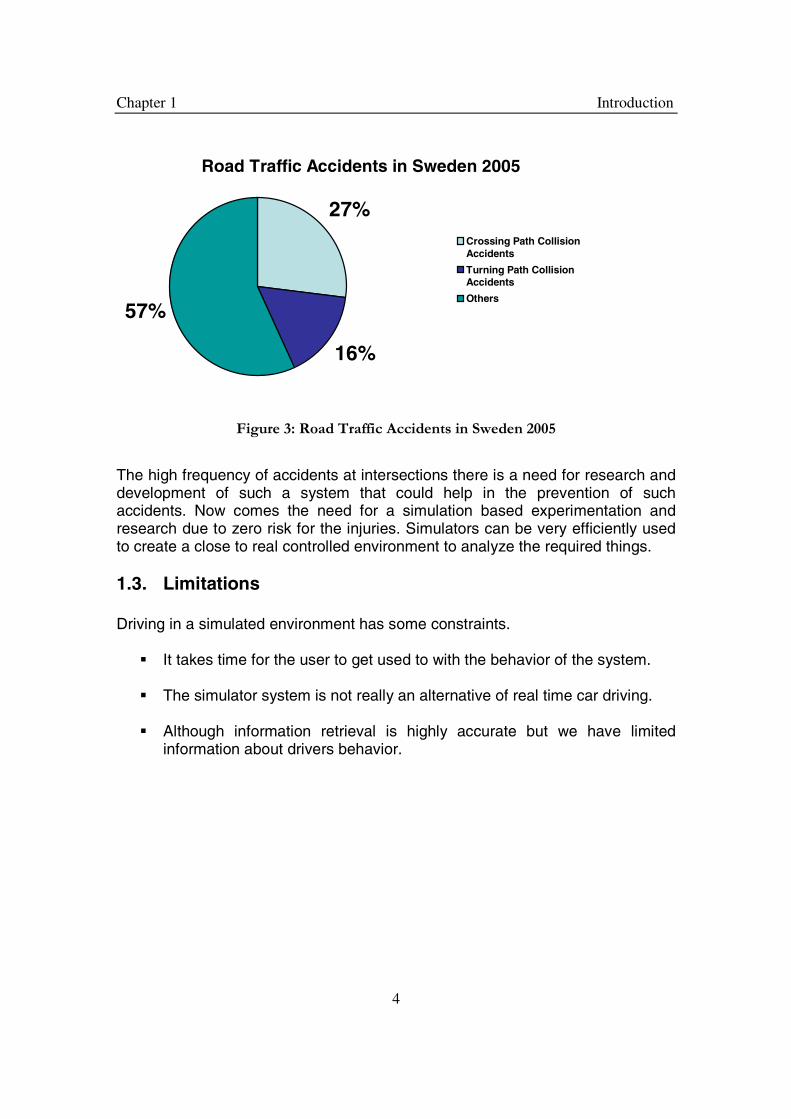
These two categories can be shown diagrammatically as in figure 3. There may be some accidents which may not belong to either class of accidents at intersections.
Chapter 1 Introduction
4
Figure 3: Road Traffic Accidents in Sweden 2005
The high frequency of accidents at intersections there is a need for research and development of such a system that could help in the prevention of such accidents. Now comes the need for a simulation based experimentation and research due to zero risk for the injuries. Simulators can be very efficiently used to create a close to real controlled environment to analyze the required things. 1.3. Limitations Driving in a simulated environment has some constraints.
It takes time for the user to get used to with the behavior of the system. The simulator system is not really an alternative of real time car driving.
Although information retrieval is highly accurate but we have limited
information about drivers behavior.
Road Traffic Accidents in Sweden 2005
27%
16%
57%
Crossing Path CollisionAccidents
Turning Path CollisionAccidents
Others

Chapter 2 Literature Study
5
2. Literature Study Our study focuses on the research in the area of simulated driving environment to analyze driving behavior. During our studies we discovered different factors and variables which can be used effectively for our research work. We have also designed the simulated world and related functionalities along with data analyzer being developed using Java.
2.1. Simulator research Simulator is an important part in the research related to the traffic accidents at the intersections. Real World is not feasible to be used for the experimentation purpose to study the driving behavior at intersections. Various studies have already been done to get the best out of a simulated scenario / world with proper experimentation. 2.1.1. Simulated experimentation study Simulated experimentation study comprises of different steps to create a real world effect, depending on the requirement of research work. 2.1.1.1. Types of Simulated Environments There are two types of simulated environments, first one is moving based simulated environment and second one is fixed-based simulated environment (Reed and Green, 1999).
2.1.1.1.1. Moving Based Simulated Environment A moving based simulator gives feedback from the steering wheel and the chair about how the car is moving in the simulated world.
2.1.1.1.2. Fixed-Based Simulated Environment This simulated environment gives no feedback from the steering wheel and the chair. A validity study made by Reed and Green on fixed-based simulator and comparison with real world cars shows that fixed-based simulators has been found to be less precise than that of actual vehicles or moving-based simulators mainly due to the lack of motion queues.

Chapter 2 Literature Study
6
Sideway steering precision was worse in the simulator as compared to a real car. However in Reed and Green study showed that participants were better at keeping a constant speed in the simulator as compared to real car. They claimed that it is most likely a result of the absence of wind and uneven roads. The degree of importance of the simulator’s validity can vary depending on the nature of study and ecological validity of the simulator. Advanced and expensive simulators may seem to be the best option but depending on the research question and the goal of study. One may be able to use a simpler simulator with less ecological validity and still get good results. More advance simulators should be used in those cases where the main focus is to get the realistic feeling of driving and that the ecological validity must be high. Whereas if the main focus is on the behaviors in a driving environment, then a less advance simulator might me suffice (Santos et al., 2005). Reed and Green study shows us that fixed-based simulators are usable tools when it comes to study of human behavior in traffic, and they show a high absolute validity on speed control but shows an overall low absolute validity. At the same time they show a high relative validity on the driving accuracy. A fixed-based simulator has generally low absolute validity and high relative validity. Santos’ et al. (2005) study on driving behavior using a simulator compared and evaluated a standardized visual performance test in three different environment’s laboratory, simulator and instrumented vehicle. The goal of study was to assess the suitability for each test environment for testing the effects of In-Vehicle-Information-System on driving performance. Simulator results couldn’t be applied to the real world whereas they gave an enormous strength to the experimental design. A comparison between simulator and the instrumented vehicle with self report data indicated that the level of seriousness, of potential effect with respect to traffic safety, was lower in the simulator compared to the instrumented vehicle. Despite this the study provided a good first insight to the vehicle development industry for the improvement of assessing and designing for example safety systems. A study made by Hancock and de Ridder (2003) on accident avoidance behavior in a controlled simulated environment, focus on the final seconds and milliseconds before a collision. There simulated environment were constructed so that drivers could be seated in two full vehicle simulators and interact within the same simulated world. That setup meant that they could create simulated situations that could evoke responses paralleling those observed in real world situations. In their experiment, a total of 45 participants were tested within the virtual world. Two ambiguous traffic situations were created for the driving participants, who crossed path with each other in the simulated world. Those situations were an intersection and a hill. In the intersections the two drivers met by approaching each other from an angle of 135 degrees. Objects blocked there
Chapter 2 Literature Study
7
views to keep both drivers from detecting each other early in the scenario, where as hill scenario represented a wrong way conflict. Qualitative results were obtained through post experience questionnaires about the participant driving habits, simulated experience and their response to specific experimental events. There study shows that situations with realistic avoidance response behavior can be created and replicated in a simulation environment. Hancock and de Ridder (2003) methodology is used in our research. 2.2. Factors influencing safety People’s behavior and performance is affected by several factors of daily life. In particular case of traffic safety, it is prohibited to drive a car after taking alcohol or other drugs. Jeffery Archer (2005) explains internal and external factors like stress, fatigue, social psychological factors such as attitudes, social cognition, biases and norms and personality factors of daily life which can affect a person’s behavior during driving. Swedish Road Authority (SRA, 1996) has also identified human functions that are critical for safe driving. SRA points out that stress, strain, tiredness, alcohol, medication as factors which can have a serious negative effect on driver performance. They also identified that inexperienced and incorrect attitudes of drivers can be potential problem areas with regard to safety. The factor’s which can be important from research point of view and can be studied during simulated research involves drivers attitude and stress about the task and effect of this on the driving parameters. 2.2.1. Effect of Stress on driving behavior According to Hennessy and Wiesenthal (1999) many traffic accidents occur due to stress or aggression in the driver’s behavior. The reason of person’s in stress may be due to the problems of job or home or time pressure. A stress condition during driving can make the person behavior aggressive on the road; as a result can be a cause of accident. Hennessy’s and Wiesenthal (1999) research examine the difference between the stress and aggression state of driver’s in high and low congestion conditions. The results of the study shows a high level of stress and aggression in the driver’s in high congestion conditions. It is noticeable that time factor was main cause of stress in high and low congestion conditions, and aggression was the cause of stressful behavior in high congestion conditions. Howard and Joint (1994) discuss the relation between stress and fatigue in driving. They say that long distance driving becomes the cause of fatigue for drivers whose minds are busy in thinking something else while they are driving. Those drivers are driving without awareness. This fatigue can cause stress in drivers, which is a result of concentration of mind in other things during driving. It is seen that when you are concentrating on other things during driving, distraction can occur easily. This distraction during the driving can be dangerous and hinders the driver’s concentration during driving and cause accidents.

Chapter 2 Literature Study
8
This study proves that stressful conditions can affect a person’s driving behavior, yet this research is not opted to create stress less behavior. 2.2.2. Variations and traffic velocity A connection between the variability of the vehicles speed and road safety is discussed by Solomon (1964). There is a deep connection between speed of the vehicles and traffic safety. Speed reduction helps to improve safety on roads. Solomon in his paper discusses relationship between crash risks and variability in speed i.e. sub-optimal interaction in present in traffic streams by different speeds of the vehicles. Solomon study shows research of 10,000 crash reports in 35 sections of rural highways between 1955 and 1958. He shows that pre-crash speed of vehicle was determined by police, the driver himself or the witnesses of the crash sites. Solomon study involves the calculation of 290,000 vehicles speeds on each of the 35 sections of rural highways. He then calculated the mean speed for each of the 35 sections. While doing the comparison of the speed of the vehicle during the crash with means speed of particular road section Solomon found that crash-involvement rate was higher when vehicle drove faster or slower than the mean speed of the particular section. And the crash-involvement rate was rather low where mean speed is close to the vehicle speed. The accidents occurring at mean speeds below average could be because of numbers of intersections and driveways on the crashes spots stated by Frith and Patterson (2001). Those points may be the reason for congestion on the roads. Solomon also states the same consideration, with reference to other places which also share the same point that intersections and other access points are reason for large number of accidents. So it is not correct to conclude that only high or low speed on highways can be a factor for accidents occurrence, also low speeds at intersection may also cause accidents to occur. In the Solomon’s study results 46% of the totals are low-speed crashed, 51% were rear-end crashes and 38% were angle crashes. The accidents occurring at intersections and congestion conditions at rear-end. Driving with high speed are cause accidents to occur more frequently. “The smaller the variation within the stream, the smoother and safer the traffic flow will be.” (p. 6) said by Frith and Patterson (2001). A study about New Zealand in Frith and Patterson (2001) tells us that if the mean speed is lowered the variation in the traffic is decreased. This takes us to the conclusion that the reduction in speed variation takes us to the traffic safety. For decreasing the variability in the traffic velocity, we can make the slow moving drivers drive fast or fast moving drivers drive slow. Later case is the best option, as fast driving can lead to more accidents, so it is better to reduce there speed.
Chapter 2 Literature Study
9
This shows that traffic velocity has significant role in the traffic safety. In simulated environment traffic velocity can be enforced easily with the help of simulation experiments, which is the reason of including range of traffic velocity in our experiments.
2.2.3. Violation of expectations Anticipated behavior of other people is expectation. During communication it can be generalized or person specified. Expectancy violation theory can be used to examine effects of expectations. According to this theory, other people expect the communication behavior from others and violation of their expectations lead to a cognitive evaluative process that results in either a positive or negative evaluation of the perceived outcome. Following are the factors that affect the outcome, according to the expectation violation theory: target characteristics, relationship characteristics and context features. Theory of expectancy and Theory of expectancy violation provides support to study the behavior changes occur due to the changes in perceived and expected behavior. In order to study changes in behavior, differences in expectations are created by e.g. manipulation of instructions. Expectancy violation theory according to Bonito et al. (1999) “…is concerned with the degree to which expectations frame behavior and the consequences of such framing on interaction and task outcomes” (p. 231). Interpretation and evaluation of violation of expectations is a very important issue of expectancy violation theory. Positive or negative valence is assigned during the characterization of violations. Positive violation are socially valued behavior that exceeds the quality of anticipated actions, while on the other hand negative violations are relatively undesirable acts that fall short of expectations. In 1976 Burgoon introduced the theory of expectation violation. It was at that time used at theory of non-verbal behavior. This theory is specific towards theory discourse and interaction and also considered as theory of communication processes. Burgoon and Le Poire, (1993) presented their study “Affect of communication expectancies, actual communications, and expectancy disconfirmation on evaluations of communicator and their communication behavior” and Bonito et al. (1999) presented “The role of expectations in human-computer interaction” both uses those theories in their studies. The study by burgoon and Le Poire shows changes in expectations due to different factors. Bonito et al. (1999) study shows support of expectancy violations theory’s premises and predictions. The study by Bonito et al. (1999) shows the decision making tasks difference when people are interacting with the human partners or compute agents. Influence and perceptions of partners are affected by expectations and evaluations which are shown by correlation analysis of five different computer conditions.

Chapter 2 Literature Study
10
In our experiments, drivers expectation are analyzed by providing them different instruction sets to see if it would create deviations of expectations, so to view a change in the driving behavior of the drivers. 2.3. Conflict Indicating Variables A traffic conflict may result in a collision if the traffic participant would have continued with the same speed and direction. It is always desired to be able to predict the probable accident or collision by finding different factors involving the collision. Conflict indicator variables are set of those factors which can be used to identify the circumstances where an accident is about to be happen. For the analysis work, these variables have lot of importance in order to draw useful outcomes. It is possible to get these details from the simulated environment with respect to the each participant and analyze their behavior. Conflict indicator’s classification depends on its handling in a specific safety situation. Conflict variables can be calculated using two types of method.
Objective Methods These methods feature time distance and speed to calculate the severity of the safety situation.
Subjective Methods These methods are dependent on human observation, who records the perceived risk at the moment of conflict. It is also possible to use a video observation from a fixed camera.
To be able to get better result the combination of the mentioned methods may be used (Lu et al., 2001). The merging of these methods results an appropriate risk value. The usefulness of these variables can be classified by evaluating the following three criteria (Svensson 1998):
1. Indicators should complement accident data and be more frequent than accidents.
2. Indicators have a statistical and causal relationship to accidents.
3. Indicators have the characteristics of ‘near-accidents’ in a hierarchical scale that describes all severity levels of driver interaction with accidents at the highest level and very safe passages with a minimum of interaction at the lowest level.
Some of the variables which are relevant for the current study are described as under.

Chapter 2 Literature Study
11
2.3.1. Time to Collision (TTC) In studies related to Traffic Conflicts Techniques, Time-To-Collision (TTC) has been considered to be a valuable measure for rating of traffic conflicts’ severity and to differentiate between critical and normal behavior. Hayward (1972) defined TTC as: "The time required for two vehicles to collide if they continue at their present speed and on the same path". TTC continue to be decrease if there is no change in speed and path. Disadvantages of TTC according to Archer are that it does not clarify the sternness of a traffic situation and not a good measure for comparison. 2.3.2. Extended Time to Collision (TET, TIT) Two alternative to proximal safety indicators have been proposed by Dutch researchers Minderhood and Bovy (2001) on the basis of general principles of the Time-to-Collision concept. These are Time Exposed TTC (TET) and Time Integrated TTC (TIT).For the period where TTC-event remains a chosen TTC-threshold TET is used to calculate the time of that period. On the other hand TIT referred to as Time Integrated TTC (TIT), is similar to the TET but it represents a measure of the integral of the TTC-profile during the time it is below the threshold.
Figure 4: The Time Exposed and Time Integrated TTC proximal safety indicator measures proposed byMinderhoud and Bovy (2001)

Chapter 2 Literature Study
12
2.3.3. Time to Accident (TA) Time to Accident is a Safety indicator measure which based on a subjective estimation of speed and distance for conflicting road-users at a common conflict point. The Time-to-Accident measure is recorded only once at the time when evasive action is first taken by a conflicting road-user. TA-values are used in determination of the scale of conflict seriousness accordance with a threshold function (Archer 2005). 2.3.4. Post-Encroachment Time (PET)
Post-Encroachment Time (PET) is the further variation of TTC. PET is used to measure in situations where two road-users, not on a collision course, pass over a common spatial point or area with a temporal difference that is below a predetermined threshold (Archer 2005) (typically 1 to 1.5 seconds). The main difference between PETs and TTCs is the absence of the collision course criterion i.e. even if no collision occur PET value can be calculated. PET’s can be easily extracted using photometric analysis, video or simulated environment, than TTC as with TTC relative speed and distance data is required. It represents time difference between the passage of the “offended” and “conflicted” road-users over the area where collision may occur. This makes PET a useful objective and less resource-demanding in contrast of TTC’s data extraction process. It is so as PET does not involve recalculations at each time-step during a conflict zone or safety warning zone (Archer 2005). On the other hand the PET-concept is only useful in the case of transversal (i.e. crossing) trajectories in safety critical events. TTC- concept suits for events with similar trajectories. PET-measurement are done on a fixed projected point of collision, rather than one that changes with the dynamics of the safety critical events. Small PET values indicate that two vehicles have a short distance to one another, whilst zero PET values indicate a collision between two vehicles. Thus PET is a measure of how nearly a collision has been avoided. These considerations led us to adopt PET as our measure of when an incident has or may have occurred, and thus we can draw conclusions about driving behavior in intersections.
2.3.5. Gap Time If the road user continues with the same velocity and trajectory then the time lapse between the completion of an approaching by a turning road-user and the arrival time of a crossing road-user is known as Gap Time (GT).

Chapter 2 Literature Study
13
The ‘Gap Time’ concept estimates the time of arrival at the potential point of conflict in spite of the actual time difference. It relies on a measure at the point when evasive action is first taken. While this accounts for the effect of braking by a secondary vehicle the elementary nature of the original PET concept is lost as resource demanding measures of both speed and distance are required during data extraction process (Archer 2005). 2.4. Schwartz’s Configural Model Different questionnaires were obtained to gather information about the behavior, personality, religious beliefs of the participants. One of the most authentic and reliable questionnaire was of Schwartz value survey. It was used for correlation of the Schwartz value survey with other questionnaire values such as NEO Five Factor Inventory. In 1990 Schwartz formulated a theory describing the universal content and structure of values. He (1992, 1994) described a model that gives a detail insight on the basis of empirical cross-cultural studies (Schwartz, 1992; Schwartz & Bilsky, 1987, 1990). Values were defined as desirable trans situational goals, varying in importance, that serve as guiding principles in the life of a person or social entity (Schwartz, 1994, p. 21) (Dairo). Three universal requirements were thought to be at the root of values: needs of individuals as biological organisms, requisites of coordinating social interaction, and requirements for the functioning of society and the survival of groups. From these three basic goals, 10 motivational value types were derived; they are described in the table below (Table 1). Value type Symbol Description Self Direction SD Independent thoughts and actions; autonomy and
independence. Stimulation ST The organismic need for variety, excitement, novelty, and
challenge. Hedonism HE Pleasure or sensuous gratification for oneself.
Achievement AC Demonstrating competence to obtain social approval; the focus is social esteem.
Power PO Attainment of social status and prestige, and control or dominance over people and resources; the focus is social esteem.
Security SE Safety, harmony, and stability of society, of relationships, and of self.
Conformity CO Self-restraint in everyday interaction; restraint of actions, inclinations, and impulses likely to upset or harm others and violate social expectations or norms.
Chapter 2 Literature Study
14
Tradition TR Respect, commitment, and acceptance of the customs and ideas that one’s culture or religion imposes on the individual.
Benevolence BE Concern for the welfare of close others.
Universalism UN Understanding, appreciation, tolerance and protection of the welfare of all people and for nature.
Table 1: Value types and descriptions of the Schwartz value survey.
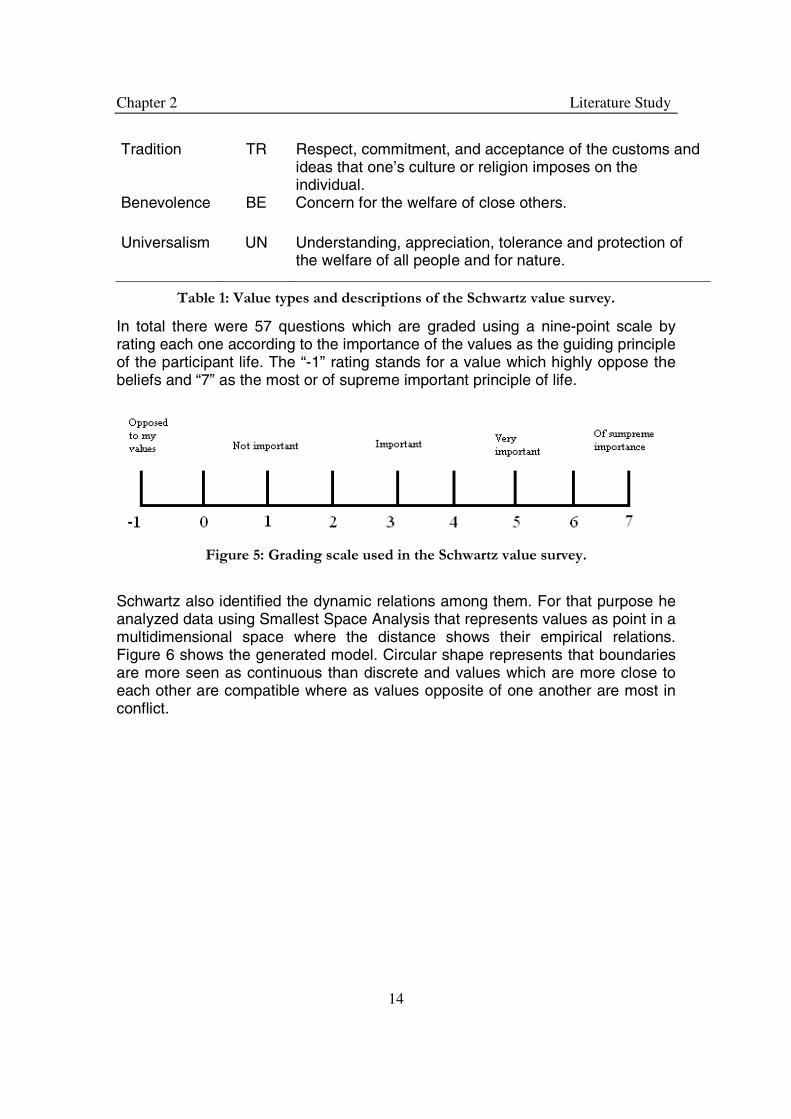
In total there were 57 questions which are graded using a nine-point scale by rating each one according to the importance of the values as the guiding principle of the participant life. The “-1” rating stands for a value which highly oppose the beliefs and “7” as the most or of supreme important principle of life.
Figure 5: Grading scale used in the Schwartz value survey.
Schwartz also identified the dynamic relations among them. For that purpose he analyzed data using Smallest Space Analysis that represents values as point in a multidimensional space where the distance shows their empirical relations. Figure 6 shows the generated model. Circular shape represents that boundaries are more seen as continuous than discrete and values which are more close to each other are compatible where as values opposite of one another are most in conflict.

Chapter 2 Literature Study
15
Figure 6: Relational Value Model. 2.5. NEO Five Factor Inventory (Neo-FFI) NEO Five Factor Inventory is used to measure the personality traits. There are said to be Big Five model, these big five are the five domains of the adult personality. These are Extraversion, Agreeableness, Conscientiousness, Emotional stability and Openness (Costa and McCrae, 1992). This model is widely used to get the better understanding of the differences between the different subjects or individuals. NEO Five Factor Inventory is described in the table below.
Extraversion Confidence and self-assuredness
Agreeableness Willingness to get along with people who are
different or have different opinions.
Conscientiousness Punctuality and following through commitments.
Emotional stability In control of emotions.
Openness Intellectual curiosity and openness to
experience.
Table 2: Neo-FFI description.
In our questionnaire there are total of 60 questions, which are graded by the scale shown below in the table. 1. Strongly disagree
2. Disagree 3. Neither disagree nor agree
4. Agree 5. Strongly agree
Table 3: Scale for Neo-FFI questionnaire.

Chapter 2 Literature Study
16
Here in the scale “1” is the most negative value and “5” is the most positive value. 2.6. Questionnaires To support the simulated environment study, different questionnaires are used in order to match different traits of participant with the data received from simulator. Each questionnaire addressing different traits and can be used for further detailed studies.
2.6.1. Conflict avoidance, Time horizon and Tolerance for uncertainty In Smith’s et al (2007) study several questionnaires were used to see the involved cooperation and decision making in micro worlds and cultural differences. These questionnaires are on conflict avoidance, time horizon and tolerance of uncertainty. These questionnaires used the same scale mentioned above in Table 3. In conflict avoidance there are 23 questions in total, these questions assessed the person’s ability to react in the presence of conflict. The tolerance of uncertainty instrument consists of 24 items that assessed the degree of comfort in decision making situation with incomplete information or in an unfamiliar situation. In time horizon there are 18 questions, these question assessed how far people plan in advance, the time frame of their goals, and how far ahead they look to justify their actions. 2.6.2. Locus of control Rotter (1966) developed Locus of control questionnaire, it consists of 13 questions. It measures locus of control of the participants or people that it is either internal or external. People with internal locus of control have a strong belief that their own actions determine their success in life where as on the other hand people with external locus of control believe that there is a hand of nature that control the larger degree of their actions and that their own behavior does not matter as much. In locus of control there were two statements and participant has to select one of the two statements which he or she feels correct. 2.6.3. Driver Behavior Questionnaire (DBQ) Driver Behavior Questionnaire was first developed at the University of Manchester, in United Kingdom. This questionnaire gives a detail insight of the driving habits of the driver during driving. There are three main types of driving

Chapter 2 Literature Study
17
behaviors, and all the questions in the questionnaire belong these three categories.
• Lapses – absentminded behaviors with consequences for the perpetrator while not threatening to other road users.
• Errors – Typically misjudgments and failures of observation that may be dangerous.
• Violations – Deliberate actions that break against norms and rules in traffic.
In Driver Behavior Questionnaire there were total of 24 questions and participants were required to indicate on a 5 point-scale (shown in Table 4) how often they indulged in the proposed behavior.
Hardly ever Occasionally Quite often Frequently Nearly all the time
Table 4: The driver behavior questionnaire Scale.
2.6.4. Driver Style Questionnaire (DSQ) Driver Style Questionnaire was also first designed in United Kingdom as a tool to judge the drivers style of driving. The questions in DSQ can relate to six different factors of driver style, these are described as under:
• Focus – The ability to drive cautiously and ignore distractions.
• Calmness – The ability to stay calm in dangerous and quick-paced situations.
• Social resistance – The driver’s preference for being given advice about driving abilities.
• Speed – Whether the driver drives fast and/or over the posted limit.
• Deviance – Whether the driver’s behavior are inconsiderate and dangerous.
• Planning – Whether the driver tend to plan ahead before setting out for a trip.
These questionnaires was created in such a way that it includes questions about behavior related to accidents, decision-making styles and reactions to advice that other gives them.

Chapter 2 Literature Study
18
2.7. Data Analyzer Study The simulator was configured so that it collected the relevant data for this project. During the session all four simulators did record all real time data that was defined in the configuration. To analyze the data we constructed a java based data analyzer program. The analyzer was based on the analyzer being developed by the previous group (Aronsson S. et al. 2007) which was working on this project. The main functionalities of the analyzer are as follows:
1. Raw data files from our four simulators were read by the analyzer.
2. The data was put into a stack if there are two cars meeting at an intersection.
3. The PET, Speed and Acceleration values were calculated from the relevant data in the stack.
4. A human readable output file was generated with all the information about a particular meeting.
Chapter 3 Research Questions
19
3. Research Questions In this study, we have manipulated the voice based command (GPS) system and the Traffic Light to see the changes in the respective PET, speed and the acceleration values to ascertain whether these factors may contribute to accidents at intersections. Four hypotheses have been formulated in relation to the aims and goals of this study. The first very important research question is whether there is a difference in incident rate at intersections between sessions based on the voice based command (GPS) assistance system, traffic lights and baseline condition (without GPS and traffic light). H0: There is no significant difference in incident rate in intersections between
sessions based on the voice based command (GPS) assistance system, traffic lights and baseline condition.
HA1: There is a significant difference in incident rate in intersections between
sessions based on the voice based command (GPS) assistance system, traffic lights and baseline condition.
To assess whether differences in the incident rate at intersections we implemented different mechanism to follow like a voice based command (GPS) system and traffic light. We used the combination of the GPS and the traffic light in the one of the scenarios, used the traffic light and GPS separately in two of the scenarios and didn’t use anything in one the scenarios known as the baseline condition. The difference in the traffic systems will hopefully show a significant difference in the PET value that would lead to a rejection of the null hypothesis. The second research question is the average PET value across the four different scenarios. H0: The average PET value will be same across all the four sessions.
HA1: The average PET value will be least across the GPS and Traffic Light session.
HA2: The average PET value will be least across the baseline session.
The third research question is the changes in the speed when meeting another car at an intersection in all the four sessions.
H0: The speed is same in all the four sessions.
HA1: The speed is not all the same in all the four sessions.

Chapter 3 Research Questions
20
The fourth research question is the changes in the acceleration when meeting another car at an intersection in all the four sessions. H0: The acceleration is same in all the four sessions. HA1: The acceleration is not all the same in all the four sessions. The PET, speed and acceleration data was calculated in each condition to see if there is a difference in driver behavior at intersections. If such a difference is found, then we can reject the null hypothesis. If the difference is in the anticipated direction, we can support our alternative hypothesis that people tend to be speed up or slow down to avoid collision at an intersection. We were also planning to analyze the differences or correlations between the self-reported data (the questionnaires).

Chapter 4 Methods
21
4. Methods The implementation of the project was conducted by the help of four multi-user driving simulators that were located at IDA at LiU. Each experimental session lasted for approximately two and a half hours. The participants also filled out several questionnaires. The goal was to examine if certain personality types correlate with PET data. The total experimentation period lasted for two weeks. The subjects were from different parts of the world having different nationalities. 4.1. Participants A total of 48 participants were selected through posters put up all over IDA, Linkoping University. A valid driver’s license was a requirement for participation. The participants were mostly students at the Linkoping University. The mean and standard deviation of the participants’ age and driving experience in years is also calculated.
Women Men Mean, age 23.28 26.85
Standard deviation, age 2.36 9.51
Mean, Driving experience 4.33 1.93
Standard deviation, experience
8.74 9.59
Table 5: The mean and standard deviation of participants’ age and driving experience in years.
4.2. Simulated scenario design study The simulated scenario design study is based on the apparatus used and the mode of experimentation. 4.2.1. Apparatus There were four driving simulators installed at the Department of Computer and Information science at Linkoping University. No driver was able to see the other driver.
Chapter 4 Methods
22
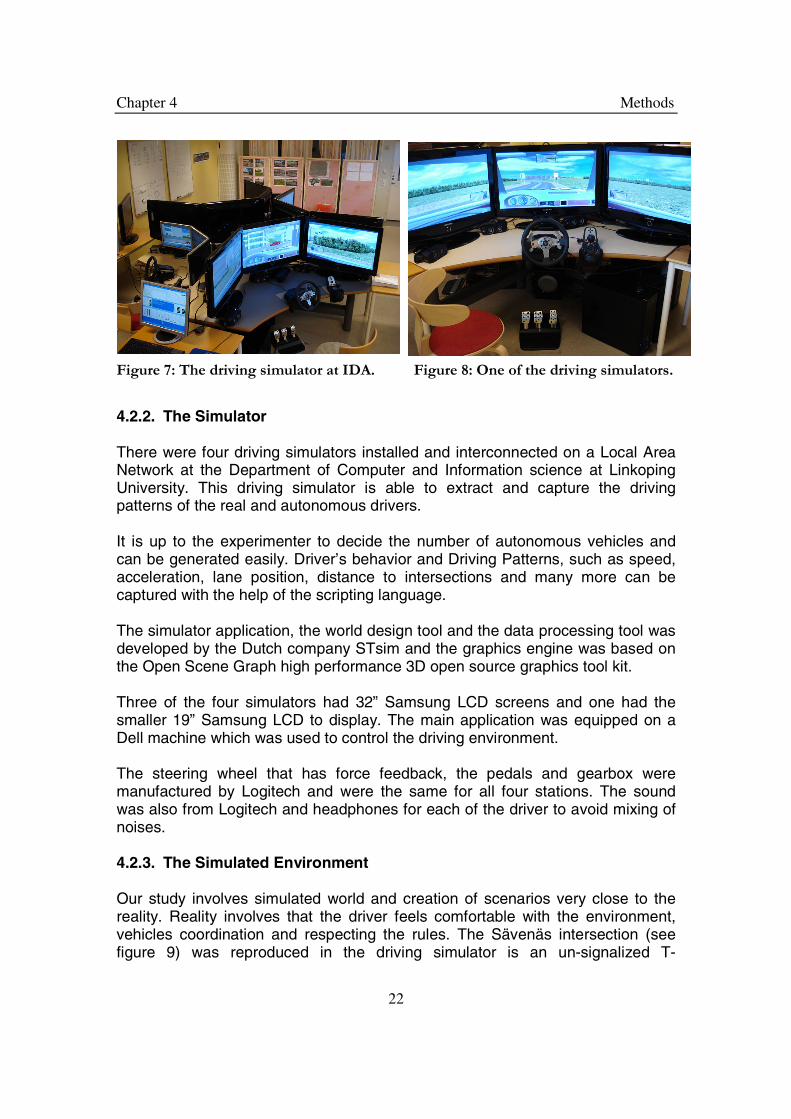
Figure 7: The driving simulator at IDA. Figure 8: One of the driving simulators.
4.2.2. The Simulator There were four driving simulators installed and interconnected on a Local Area Network at the Department of Computer and Information science at Linkoping University. This driving simulator is able to extract and capture the driving patterns of the real and autonomous drivers. It is up to the experimenter to decide the number of autonomous vehicles and can be generated easily. Driver’s behavior and Driving Patterns, such as speed, acceleration, lane position, distance to intersections and many more can be captured with the help of the scripting language. The simulator application, the world design tool and the data processing tool was developed by the Dutch company STsim and the graphics engine was based on the Open Scene Graph high performance 3D open source graphics tool kit. Three of the four simulators had 32” Samsung LCD screens and one had the smaller 19” Samsung LCD to display. The main application was equipped on a Dell machine which was used to control the driving environment. The steering wheel that has force feedback, the pedals and gearbox were manufactured by Logitech and were the same for all four stations. The sound was also from Logitech and headphones for each of the driver to avoid mixing of noises. 4.2.3. The Simulated Environment Our study involves simulated world and creation of scenarios very close to the reality. Reality involves that the driver feels comfortable with the environment, vehicles coordination and respecting the rules. The Sävenäs intersection (see figure 9) was reproduced in the driving simulator is an un-signalized T-

Chapter 4 Methods
23
intersection in the outer parts of Gothenburg. The reason behind selecting this intersection was due to the heavy traffic load on it causing road traffic accidents. Another major reason for selecting the Sävenäs intersection is that the buildings and vegetation around the intersection block the drivers’ view earlier studied by Hancock and de Ritter (2003). The road slopes around the actual Sävenäs intersection could not be implemented in the simulated world due to the limitations in the simulator. The other elements of the intersection were represented in a realistic manner.
Figure 9: The Sävenäs intersection.
There were four different scenarios in our study, in which a driver was analyzed. There were total of four real and eight autonomous cars making a grand total of twelve cars in a single scenario. The driving speed was 50 km/h for the autonomous cars and the speed limit was the same for the real drivers. Scenarios were designed to find the changes in the behavior of the driver. The proposed scenarios were:
Scenario A: World with the Traffic Light and voice based command system (GPS).
Scenario B: World with the Traffic Light but without the GPS.
Scenario C: World with the GPS but no Traffic Light functionality.
Scenario D: No Traffic Light and GPS functionality.

Chapter 4 Methods
24
With Traffic Light Without Traffic Light
With GPS A B
Without GPS C D
Table 6: Summary of Scenarios used for experimentation.
The traffic light and the voice based command (GPS) system were implemented in order to help the drivers to meet at the intersection so that we can get more relevant data. The implementation was achieved using the scripting language provided by the simulator. The first step involved the designing the simulated world using the simulation software (stRoadDesign by STSoftware) for simulated world designing. It was important to have T-intersections in our simulated world. All the scenarios were implemented on the same world shown as under:
Figure 10: Grid view of the world used. Figure 11: Simulated World.
Although the world was same for each scenario, STScenario scripting language was used to implement Traffic Light and the GPS.

Chapter 4 Methods
25
Traffic light and GPS were introduced in the world to make it possible that driver intercept each other more frequently at the T-intersection. Traffic Light was controlled with respect to the position of vehicles. Along with the STRoad Design and STScenario, STControl is used to control the environment in the simulated world on each of the simulator.
Figure 12: STControl for displaying the environment information. The order of scenario presentation was shuffled across all the 12 experimental groups. This was done to decrease the perplexing variable of driving the same session before another. Table 7 shows the order of the scenarios for each experimental group.
Experimental group
Scenarios Order
1 2 3 4 5 6 7 8 9 10 11 12
ABDC BCDA CDAB DABC ACBD CBDA BDAC DACB ADCB DCBA CBAD BADC
Table 7: The order of scenarios.

Chapter 4 Methods
26
4.3. Tasks In each session the participants were assigned a task to generate a purpose for their driving and to make them more eager to explore the world. The task was different in each of the four sessions. The drivers had to collect a number of signs (words) collectively forming a sentence. The sentence is a part of a song which was tokenized randomly.
Sentences Session A: Meet you downstairs in the bar and heard Your rolled up sleeves and your skull t-shirt. Session B: Hey baby, when we are together, doing things that we love. Every time you're near I feel like I’m in heaven, feeling high. Session C: Every night in my dreams i see you, i feel you, that is how i know you go on far across the distance and spaces between us. Session D: "I'm Alive" When you call on me When I hear you breathe.
Table 8: The sentences.
Figure 13: One of the signs.
The signs were placed randomly in each of the world. The drivers had to drive through the world according to the requirements of the session and collect the signs. They had to pull off the road, giving way to other traffic, on the side walk to stop and write down each of the sign.
Chapter 4 Methods
27
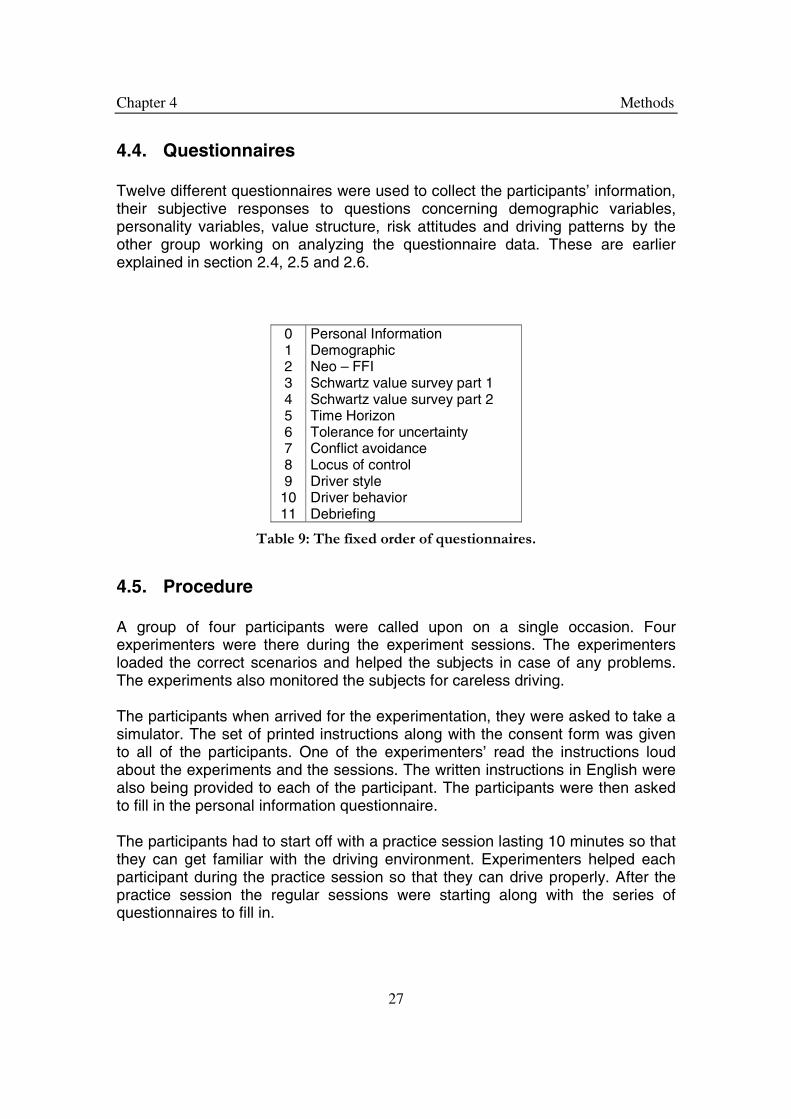
4.4. Questionnaires Twelve different questionnaires were used to collect the participants’ information, their subjective responses to questions concerning demographic variables, personality variables, value structure, risk attitudes and driving patterns by the other group working on analyzing the questionnaire data. These are earlier explained in section 2.4, 2.5 and 2.6.
0 1 2 3 4 5 6 7 8 9
10 11
Personal Information Demographic Neo – FFI Schwartz value survey part 1 Schwartz value survey part 2 Time Horizon Tolerance for uncertainty Conflict avoidance Locus of control Driver style Driver behavior Debriefing
Table 9: The fixed order of questionnaires.
4.5. Procedure A group of four participants were called upon on a single occasion. Four experimenters were there during the experiment sessions. The experimenters loaded the correct scenarios and helped the subjects in case of any problems. The experiments also monitored the subjects for careless driving. The participants when arrived for the experimentation, they were asked to take a simulator. The set of printed instructions along with the consent form was given to all of the participants. One of the experimenters’ read the instructions loud about the experiments and the sessions. The written instructions in English were also being provided to each of the participant. The participants were then asked to fill in the personal information questionnaire. The participants had to start off with a practice session lasting 10 minutes so that they can get familiar with the driving environment. Experimenters helped each participant during the practice session so that they can drive properly. After the practice session the regular sessions were starting along with the series of questionnaires to fill in.
Chapter 4 Methods
28
4.5.1. The Cycles The main experimental trial consisted of 4 sessions as described earlier in Table-6. Each cycle was followed by a series of questionnaires. The participants were given instructions about the upcoming sessions verbally by the experimenter. The participants had to listen to the instructions about the specific session using scripting within the session. The participants were not allowed to talk between the sessions although they could ask the experimenter if they had any problems related to the sessions. A short coffee break was given after the second cycle. The length of the break varied between 15 to 25 minutes. The participants had to drive two more sessions after the coffee break. The total time of all the sessions was about 2 hours and 30 minutes. The participants were provided with a cinema ticket as thank you gift in the end.
4.5.2. Pilot Study A pilot study was conducted with the first four participants before calling on other participants. There were a number of flaws identified in the time of the practice session and the instructions for driving the car. The errors were then fixed for the next experiments. As a result the practice session was prolonged for 10 minutes in total whereas the instructions for driving a car were provided in black and white. 4.6. Data Collection The Data Analyzer was developed using Java in order to collect the relevant PET, speed, acceleration and lane position variables from the data collected. The chosen data from the sessions contained statistics from within 30 meters of the Sävenäs based intersections. The PET was calculated if two vehicles were both within 30 meters of the centre point of the intersection at the same time. The PET algorithm worked only when one of the vehicles made a left turn, a right turn and when those vehicles had entered the intersection in different lanes. The predetermined threshold for calculating PET-values was set to 10 seconds i.e. we are not analyzing PET value above 10 seconds.

Chapter 5 Methods
29
5. Results This section presents the simulator data containing PET, Speed and Acceleration. Chi Square-tests and within subject analysis of variance (AVONA) tests on the PET, Speed and Acceleration data were conducted. The data for PET values above 10 seconds is not being included in the analysis. 5.1. Scenarios There were a total of 244 meetings at an intersection in total within all the four sessions.
Figure 14: Total Number of Meetings in all four sessions.
The null hypothesis was that the number of data points is the same across the four experimental sessions / conditions. This hypothesis states that we expect the experimental manipulations to have no effect on the number of encounters. As the number of data points is not a continuous measure, we cannot use ANOVA to test the hypothesis so we must use the Chi-Square test. Chi-Square test is better because there are 4 categories and 3 degrees of freedom. The test statistic, 62.5 is large. The likelihood of getting this result by chance is extremely small. So the probability of getting these results is less than 0.001 i.e. Chi-square (3) = 62.5, p < .001.
Chapter 5 Methods
30
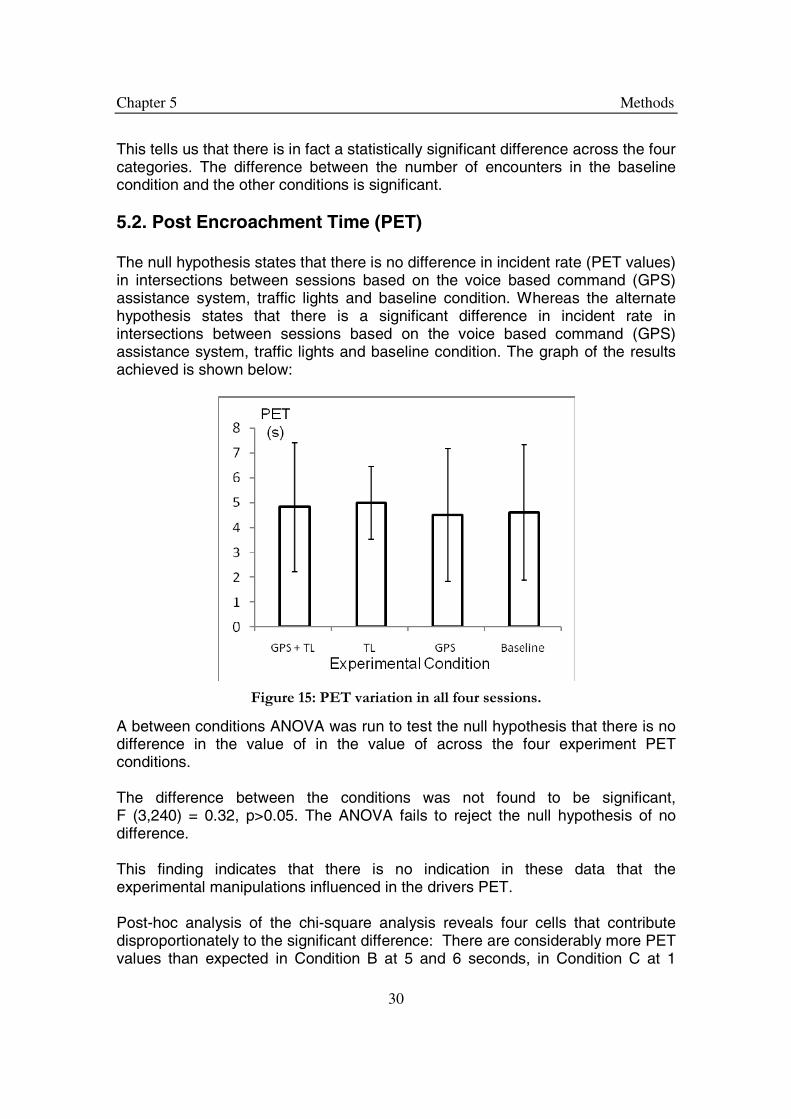
This tells us that there is in fact a statistically significant difference across the four categories. The difference between the number of encounters in the baseline condition and the other conditions is significant. 5.2. Post Encroachment Time (PET) The null hypothesis states that there is no difference in incident rate (PET values) in intersections between sessions based on the voice based command (GPS) assistance system, traffic lights and baseline condition. Whereas the alternate hypothesis states that there is a significant difference in incident rate in intersections between sessions based on the voice based command (GPS) assistance system, traffic lights and baseline condition. The graph of the results achieved is shown below:
Figure 15: PET variation in all four sessions.
A between conditions ANOVA was run to test the null hypothesis that there is no difference in the value of in the value of across the four experiment PET conditions. The difference between the conditions was not found to be significant, F (3,240) = 0.32, p>0.05. The ANOVA fails to reject the null hypothesis of no difference. This finding indicates that there is no indication in these data that the experimental manipulations influenced in the drivers PET. Post-hoc analysis of the chi-square analysis reveals four cells that contribute disproportionately to the significant difference: There are considerably more PET values than expected in Condition B at 5 and 6 seconds, in Condition C at 1

Chapter 5 Methods
31
second, and in Condition D at 3 seconds. In fact, in Conditions A and B, PET values were larger (times were longer, cars were further apart) than in conditions C and D. 5.3. Speed This value is captured when the vehicle is 5 meters apart from an intersection. A between conditions ANOVA was run to test the null hypothesis that there is no difference of values of across the four experiments speed conditions. The difference between the conditions was not found to be significant, F (3,240) = 1.66, p> 0.05. The graph is as under:
Figure 16: Speed variation in all four sessions.
The ANOVA fails to reject the null hypothesis of no difference. This finding indicates that there is no indication in these data that the experimental manipulations influenced the drivers’ speed. 5.4. Acceleration This value is captured when the vehicle is 5 meters from the centre of an intersection. A between conditions ANOVA was run to test the null hypothesis that there is no difference of values of across the four experiments acceleration conditions. The difference between the conditions was not found to be significant, F (3,240) = 1.76, p >0.05.

Chapter 5 Methods
32
The graph is shown as under:
Figure 17: Acceleration variation in all four sessions.
The ANOVA fails to reject the null hypothesis of no difference. This finding indicated that there is no indication in these data that the experimental manipulations influenced the drivers’ acceleration.

Chapter 6 Analysis
33
6. Analysis The primary purpose of this study is to examine the driving behavior at intersections. The use of voice based command (GPS) system and traffic light do not seem to have an effect on the participants’ driving behavior. However, this null result is encouraging. It suggests that the driving behavior of the participants in the study was stable enough not to be effected by our manipulations. Driving behavior appears to be robust across experimental manipulations. 6.1. Expectations and Outcomes The experimental design could have altered the participants’ behavior. According to Burgoon et al. (1993), expectancy violations can alter the behavior of people. A violation of expectations is created whenever behavior deviates from the expected norm. This may have been the case in the interaction between human-driven and autonomous vehicles. Our hypothesis was that the participants will meet more frequently in the newly introduced GPS and traffic light system but the results negated our hypothesis. There were more number of meetings in the scenario without both the GPS and the traffic light. The result was quite surprising so the reason behind this could be due the underlying points: 1. The participants and the autonomous cars had to stop on the traffic light
which could have been the reason behind the cars not able to meet at the intersections.
2. The participants’ cars had to listen very carefully in the scenarios having
GPS, which could have resulted in the slowing down of speed. The results can be verified from by comparing the speed and PET results achieved earlier.
3. The distance between the Traffic Light placed and the intersection may be
very long. It took more time for a participant to start off from the traffic light and meet the upcoming car at the intersection.
4. Some of the drivers were circling around the same intersection in the scenario without the voice based command system and traffic light.
5. In the baseline experimental scenario the participants were free to roam as they would have liked, this must have encouraged more number of PET values.

Chapter 6 Analysis
34
Further side effects which may have lead to negate our hypothesis could be:
1. The signs varied in number and text written. This could have also varied the speed and time leading to lesser PET values.
2. They were placed on different locations in all the scenarios/sessions. The participants may have to vary the speed accordingly leading to lesser PET values.
The simulator is the core element of this study and as its ecological validity is limited so it is a crucial topic for discussion. The simulator was in general perceived well by the participants. However, a few participants thought that it was unrealistic. The instructions given to the participants in the beginning of the experimentation may have encouraged the participants to drive unrealistically. The most relevant reason could be that the participants must have realized that the consequences were not real. The second reason could be the environment provided to the participants for driving. A model car must have been used which could have given a closer to really feel to the participants. 6.2. Claims There was no significant difference in the PET value across all the four experimental scenarios although there was more number of meetings in the baseline scenario. The possible reason could be the same that the participants were aware of the unreal consequences. If the participants are equally aware of the risks involved in driving regardless of the external influences affecting them, and take precautions to drive safely when driving faster, this would correspond to the real world, where a potential crash is both dangerous and costly.
Chapter 7 Conclusion and Future Work
35
7. Conclusion and Future Work The claim that changes in the driving environment like voice based command (GPS) system or traffic lights may trigger more PET values is proven to be false with the help of our experiment data. The drivers get more concerned when they have to follow certain commands and route while driving. As a result to this scenario the driving behavior is being altered causing less number of meetings. Another nice fact that was deduced during this experimentation is the variation in the speed and acceleration in a particular experimental scenario. The drivers tend to be a lot more careful while driving on slower speed with less number of PET values. Whereas, in the scenario without voice based command (GPS) system and traffic light, the drivers tend to drive on higher speeds. This scenario also generated more PET values and had a higher road safety risk. In this study we have chosen to overlook individual differences, due to the fact that we are interested in representative behavior. However, we may have got some interesting results if we would have examined the individual data and thus it may have been a lot of differences between the individuals that the mean value for the whole group did not show. Our study contributes to further research on traffic behavior in intersections, primarily with our chosen experimental method and the data that we have collected. It will be used in the continued research involving the Sävenäs intersection. We have recorded more relevant data variables than we have analyzed, like Distance to Intersection (DTI), Lane Position and Time to Collision (TTC) with respect to the vehicle in front. If the other data variables are also being examined this might give a better picture and explanation of the vehicles meetings at intersections. This may eventually give way for the development of active traffic safety systems that prevent accidents from occurring. We recommend that the other research groups at IDA, Linkoping University may work with analyzing different aspects of the bulk of data already collected by the current and the old research groups. An analysis may be conducted between the PET, speed and acceleration data with the questionnaire data collected by the other group. Several other variables may also be considered for identifying new facts and figures. Our study has also contributed to the understanding and development of simulator-based research. The method of choice has illustrated the usability of the simulator and will work as a springboard for this research area, and in the future others might be able to implement this study in the real world and compare it with these findings.

Chapter 8 References
36
8. References Archer, J (2005) Indicators for traffic safety assessment and prediction and their
application in micro-simulation modeling: A study of urban and suburban intersections. Stockholm: Kungliga Tekniska Högskolan
Aronsson S. et al. (2007). An empirical study on driving behavior in a simulated
T-intersection – the effect of manipulation of instruction set and the variability in traffic velocity. Linköping University.
Autoliv (2007). Overall Project Description in Intelligent Vehicle Safety Systems (IVSS) Research Application, for project Intersection Accidents – Analysis and Prevention, 2007.
Bonito J.A., Burgoon J.K. and Bengtsson B. (1999) The role of expectations in
human-computer interactions, Proceedings of the international ACM SIGGROUP conference on Supporting Group Work pp. 229-238.
Burgoon, J.K., Le Poire, B.A. (1993) Effects of communication expectancies,
actual communication, and expectancy disconfirmation on evaluations of communication behavior, Human communication research, Vol. 20, pp. 67-96.
Costa P.T. Jr. and McCrae R.R. (1992) Revised NEO Personality Inventory
(NEO-PI-R) and NEO- Five Factor (NEO-FFI), Inventory professional manual, Odessa, FL: PAR Inc.
Dario Spini, Measurement Equivalence of 10 Value Types from the Schwartz
Value Survey Across 21 Countries, Universities of Lausanne Geneva. Erica W. and Jessica W. (2007) Analysis of traffic-flow information in video
recorded intersections – Incident classification, Chalmers University of Technology.
Frith, W .J., Patterson, T. L. (2001) Speed variation, absolute speed and their
contribution to safety, with special reference to the work of Solomon, IPENZ Transportation Group, Technical Conference Papers
Hayward, J.Ch. (1972). Near miss determination through use of a scale of
danger. Report no.TTSC 7115, The Pennsylvania State University, Pennsylvania.
Hancock, P.A., De Ridder, S.N. (2003) Behavioral accident avoidance science:
understanding response in collision incipient conditions, University of Central Florida, Taylor & Francis Ltd.

Chapter 8 References
37
Hennessy D.A. and Weisenthal D.L. (1999) Traffic congestion, driver stress,
and driver aggression, Aggressive Behavior, Volume 25, pp. 409-423. Lu, J., Dissanayake , S., Castillo, N., Williams, K. (2001) Safety evaluation of
right turns followed by U-turns at signalized intersection as an alternative to direct left turns – conflict analysis, Tampa, FL: University of South Florida.
Minderhoud, M. M., and Bovy, P. H. L., (2001) Extended Time-to-Collision
Measures for Road Traffic Safety Assessment, Accident Analysis and Prevention, Vol 33, pp.89-9
Reed, M. P., Green, P. A., (1999) Comparison of driving performance on-road
and in a low-cost simulator using a concurrent telephone dialing task, Ergonomics, 1999, vol.42, nr.8, s. 1015-1037
Santos, J., Merat, N., Mouta, S., Brookhuis, K., De Waard, D. (2005) The
interaction between driving an in-vehicle information systems: comparison of results from laboratory, simulator and realworld studies. Transportation Research Part F: Traffic Psychology and behaviour, 8(2), pp.135-146
Santos J., Merat N,, Mouta S., Brookhuis K., De Waard D. (2005) The
interaction between driving and inter-vehicle information systems: Comparison of results from laboratory, simulator and realworld studies. Transportation Research Part F: Traffic Psychology and behavior, 8(2), pp. 135-146.
SIKA, Statens institut för kommunikations analys (2006) Road Traffic Injuries
2005. Stockholm; EO Grafiska AB. 2006:31. Solomon, D. (1964) Accidents on main rural highways related to speed, driver
and vehicle, Washington, DC: US Department of Commerce & Bureau of Public Roads.
SRA (1996). ARENA: TRICS för att Uppnå Nollvisionen (Eng. ARENA: TRICS to
Achieve the Zero-Vision), Swedish Road Administration (Vägverket), Borlänge, Sweden
STSoftware (2004), Software modules for developers of driving simulators, ST
Software B.V. STSoftware (2005), StControl: Userinterface (GUI) module for research driving
simulators running on software from ST Software, ST Software B.V.

Chapter 8 References
38
STSoftware (2006), StScenario scripting language, ST Software B.V. STSoftware (2006), STRoadDesign documentation, ST Software B.V. Svensson Å. (1998) A Method for Analyzing the Traffic Process in a Safety
Perspective, University of Lind, Department of traffic planning and engineering, Bulletin 166.
Wedlin P. (2004). Functional requirements for a multi-user traffic behavior
simulator, Linköping University.
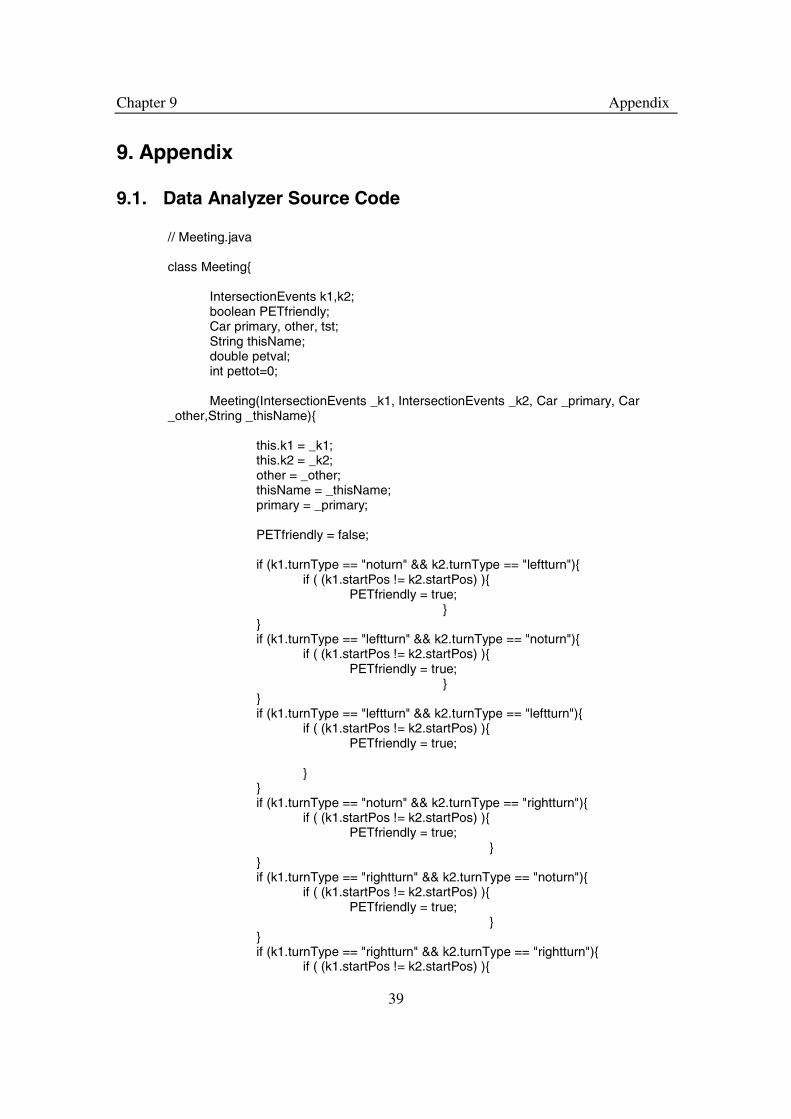
Chapter 9 Appendix
39
9. Appendix 9.1. Data Analyzer Source Code
// Meeting.java class Meeting{ IntersectionEvents k1,k2; boolean PETfriendly; Car primary, other, tst; String thisName; double petval; int pettot=0; Meeting(IntersectionEvents _k1, IntersectionEvents _k2, Car _primary, Car _other,String _thisName){ this.k1 = _k1; this.k2 = _k2; other = _other; thisName = _thisName; primary = _primary; PETfriendly = false; if (k1.turnType == "noturn" && k2.turnType == "leftturn"){ if ( (k1.startPos != k2.startPos) ){ PETfriendly = true; } } if (k1.turnType == "leftturn" && k2.turnType == "noturn"){ if ( (k1.startPos != k2.startPos) ){ PETfriendly = true; } } if (k1.turnType == "leftturn" && k2.turnType == "leftturn"){ if ( (k1.startPos != k2.startPos) ){ PETfriendly = true; } } if (k1.turnType == "noturn" && k2.turnType == "rightturn"){ if ( (k1.startPos != k2.startPos) ){ PETfriendly = true; } } if (k1.turnType == "rightturn" && k2.turnType == "noturn"){ if ( (k1.startPos != k2.startPos) ){ PETfriendly = true; } } if (k1.turnType == "rightturn" && k2.turnType == "rightturn"){ if ( (k1.startPos != k2.startPos) ){

Chapter 9 Appendix
40
PETfriendly = true; } } getPET(); } void getPET(){ float leastDistance = (float) 999999.0; long pos1 = 0; long pos2 = 0; for (long p1 = k1.x1;p1 < k1.x2;p1++){ for (long p2 = k2.x1;p2 < k2.x2;p2++){ Float[] s = (Float[]) primary.trail.get((int)p1); Float[] t = (Float[]) other.trail.get((int)p2); float x1 = s[1]; float y1 = s[2]; float x2 = t[1]; float y2 = t[2]; double dist = Math.sqrt((x2 - x1)*(x2 - x1) + (y2 - y1)*(y2 - y1)); if (dist < leastDistance){ leastDistance = (float)dist; pos1 = p1; pos2 = p2; } } } // bajs = Junk if (/*primary.name == "bajs" && */this.PETfriendly){ Float []a = (Float[])primary.trail.get((int)pos1); Float []b = (Float[])other.trail.get((int)pos2); System.out.println(); System.out.println("Meeting: " + other.name); petval = Math.floor( (Math.abs(b[0] - a[0]))); pettot = pettot + 1; System.out.println("PET Tot: " + pettot); System.out.println("PET = " + Math.abs(b[0] - a[0])); System.out.println("PET = " + (b[0] - a[0])); }

Chapter 9 Appendix
41
} void getSpeed30(){ Float[] ea = (Float[])primary.trail.get((int)k1.x1); System.out.println(ea[3]); System.out.println(ea[4]); System.out.println(ea[5]); System.out.println(ea[6]); System.out.println(ea[7]); System.out.println(ea[8]); System.out.println(ea[9]); } void getSpeed20(){ for (int p1 = (int)k1.x1;p1 < k1.x2;p1++){ Float[] ea = (Float[])primary.trail.get((int)p1); if (primary.inBox(primary.intersections[k1.intersection].x,primary.intersections[k1.intersection].y,ea[1],ea[2],20)){ System.out.println("x = " + ea[1]); System.out.println("y = " + ea[2]); System.out.println(ea[3]); System.out.println(ea[4]); System.out.println(ea[5]); System.out.println(ea[6]); System.out.println(ea[7]); System.out.println(ea[8]); System.out.println(ea[9]); return; } } } void getSpeed10(){ for (int p1 = (int)k1.x1;p1 < k1.x2;p1++){ Float[] ea = (Float[])primary.trail.get((int)p1); if (primary.inBox(primary.intersections[k1.intersection].x,primary.intersections[k1.intersection].y,ea[1],ea[2],10)){ System.out.println("x = " + ea[1]); System.out.println("y = " + ea[2]); System.out.println(ea[3]); System.out.println(ea[4]); System.out.println(ea[5]); System.out.println(ea[6]); System.out.println(ea[7]); System.out.println(ea[8]); System.out.println(ea[9]); return; }

Chapter 9 Appendix
42
} } void getSpeed5(){ for (int p1 = (int)k1.x1;p1 < k1.x2;p1++){ Float[] ea = (Float[])primary.trail.get((int)p1); if (primary.inBox(primary.intersections[k1.intersection].x,primary.intersections[k1.intersection].y,ea[1],ea[2],5)){ System.out.println("x = " + ea[1]); System.out.println("y = " + ea[2]); System.out.println(ea[3]); System.out.println(ea[4]); System.out.println(ea[5]); System.out.println(ea[6]); System.out.println(ea[7]); System.out.println(ea[8]); System.out.println(ea[9]); return; } } } void print(){ System.out.println(); System.out.println("Meeting!!!"); System.out.println("mellan:"); System.out.println(thisName); System.out.println(other.name); System.out.println(k1.startTime); System.out.println(k1.endTime); System.out.println(k2.startTime); System.out.println(k2.endTime); System.out.println("turntyp1: " + k1.turnType); System.out.println("turntyp2: " + k2.turnType); System.out.println("startpos1: " + k1.startPos); System.out.println("endpos1: " + k1.endPos); System.out.println("startpos2: " + k2.startPos); System.out.println("startpos2: " + k2.endPos); } }
// PET.java class PET { public static void main (String args[]) {
Chapter 9 Appendix
43
Data mainTarget1Data = new Data("c:/data/Data-20070828-G12-S4-WD-C1-P45.dat"); Data mainTarget2Data = new Data("c:/data/Data-20070828-G12-S4-WD-C2-P46.dat"); Data mainTarget3Data = new Data("c:/data/Data-20070828-G12-S4-WD-C4-P47.dat"); Data mainTarget4Data = new Data("c:/data/Data-20070828-G12-S4-WD-C3-P48.dat"); Car [] MT = new Car[4]; // HumanCar MT[0] = new Car((float)4.6, (float)1.75, "P45"); MT[0].loadTrail(mainTarget1Data,0,1,2,4,5,6,7,9,8,3); MT[1] = new Car((float)4.6, (float)1.75, "P46"); MT[1].loadTrail(mainTarget2Data,0,1,2,4,5,6,7,9,8,3); MT[2] = new Car((float)4.6, (float)1.75, "P47"); MT[2].loadTrail(mainTarget3Data,0,1,2,4,5,6,7,9,8,3); MT[3] = new Car((float)4.6, (float)1.75, "P48"); MT[3].loadTrail(mainTarget4Data,0,1,2,4,5,6,7,9,8,3); // AI-car Car[] AIcars = new Car[8]; int AIbil = 1; int ptr1 = 10; for (int i = 0;i < 2;i++){ AIbil++; AIcars[i] = new Car((float)4.6, (float)1.75, "AI-Car " + AIbil); AIcars[i].loadTrail(mainTarget1Data,0,ptr1,ptr1+1,ptr1+3,ptr1+4,ptr1+5,ptr1+6,ptr1+8,ptr1+7, ptr1+2); ptr1 += 9; } int ptr2 = 10; for (int i = 2;i < 4;i++){ AIbil++; AIcars[i] = new Car((float)4.6, (float)1.75, "AI-Car " + AIbil); AIcars[i].loadTrail(mainTarget2Data,0,ptr2,ptr2+1,ptr2+3,ptr2+4,ptr2+5,ptr2+6,ptr2+8,ptr2+7, ptr2+2); ptr2 += 9; } int ptr3 = 10; for (int i = 4;i < 6;i++){

Chapter 9 Appendix
44
AIbil++; AIcars[i] = new Car((float)4.6, (float)1.75, "AI-Car " + AIbil); AIcars[i].loadTrail(mainTarget3Data,0,ptr3,ptr3+1,ptr3+3,ptr3+4,ptr3+5,ptr3+6,ptr3+8,ptr3+7,ptr3+2); ptr3 += 9; } int ptr4 = 10; for (int i = 6;i < 8;i++){ AIbil++; AIcars[i] = new Car((float)4.6, (float)1.75, "AI-Car " + AIbil); AIcars[i].loadTrail(mainTarget4Data,0,ptr4,ptr4+1,ptr4+3,ptr4+4,ptr4+5,ptr4+6,ptr4+8,ptr4+7, ptr4+2); ptr4 += 9; } mainTarget1Data = null; mainTarget2Data = null; mainTarget3Data = null; mainTarget4Data = null; // Now it is 30 meter from intersection that is used for (int i = 0;i < 4;i++) // Loop all Main Targets { // MT = MainTarget MT[i].getIntersectionsDrivings((float) 30.0); } // Meetings between MainTarget And AICar for (int i = 0;i < 8;i++){ // Loop all AI Cars AIcars[i].getIntersectionsDrivings((float) 30.0); for (int j = 0;j < 4;j++) // Loop all Main Targets { MT[j].getMeetings(AIcars[i]); } } // Meetings between MainTarget And MainTarget for (int k = 0;k < 4;k++) { //4 for (int l = 0;l < 4;l++) { if (k != l) { MT[k].getMeetings(MT[l]); } } } MT[3].dumpMeetings();

Chapter 9 Appendix
45
MT[1].dumpMeetings(); MT[2].dumpMeetings(); MT[0].dumpMeetings(); MT[0].getSpeeds(); MT[1].getSpeeds(); MT[2].getSpeeds(); MT[3].getSpeeds(); } } // Car.java import java.util.ArrayList; import java.util.Iterator; import java.io.*; import java.text.*; import java.math.BigDecimal; class Car { ArrayList trail; ArrayList intersectionEvents; ArrayList meetings; Intersection[] intersections; String name; PrintStream p; PrintStream p1,p2; Car(float _length, float _width,String _name){ this.name = _name; trail = new ArrayList(); // Contain the time xpos ypos and speed for this specific car. meetings = new ArrayList(); // meetings contains times and data when two cars are in the same intersection at the same time. intersections = new Intersection[2]; intersections[0] = new Intersection((float)0.0 , (float)340.0); intersections[1] = new Intersection((float)0.0 , (float)0.0); } void loadTrail(Data data, int timeCol,int xCol,int yCol, int spdCol, int accCol, int lposCol, int ttcCol, int pnCol, int dtiCol, int headCol /* Add Acceleration, LatPos, TTC, */){ Float [] s; Iterator e = data.getMatrix().iterator(); while (e.hasNext()) { Float [] trailDat;
Chapter 9 Appendix
46
trailDat = new Float[10]; s = (Float[])e.next(); for (int i = 0;i < s.length;i++) { if (i == timeCol) trailDat[0] = s[i]; if (i == xCol) trailDat[1] = s[i]; if (i == yCol) trailDat[2] = s[i]; if (i == spdCol) trailDat[3] = s[i]; if (i == accCol) trailDat[4] = s[i]; if (i == lposCol) trailDat[5] = s[i]; if (i == ttcCol) trailDat[6] = s[i]; if (i == pnCol) trailDat[7] = s[i]; if (i == dtiCol) trailDat[8] = s[i]; if (i == headCol) trailDat[9] = s[i]; } trail.add(trailDat); } } String getTurnType(long p1, long p2){ String turnType = "nada"; Float[] s = (Float[])trail.get((int)p1); Float[] t = (Float[])trail.get((int)p2); int startAngle = Math.round((s[9] / (float)90.0)) % 4; int endAngle = Math.round((t[9] / (float)90.0)) % 4; if (endAngle - startAngle == -1) turnType = "rightturn"; if (endAngle - startAngle == 1) turnType = "lefturn"; if (endAngle == 3 && startAngle == 0) turnType = "rightturn"; if (endAngle == 0 && startAngle == 3) turnType = "lefturn"; if (endAngle == startAngle) turnType = "noturn"; return turnType; } boolean inBox(float ix, float iy,float bx,float by,float length){ if (Math.abs(ix - bx) > length) return false; if (Math.abs(iy - by) > length) return false; return true; } int getPos(long p, float ix,float iy,float dist){ int pos = -1;
Chapter 9 Appendix
47
Float[] s = (Float[])trail.get((int)p); float bx = s[1]; float by = s[2]; if (inBox(ix, iy - dist, bx,by, dist / 2)) pos = 0; if (inBox(ix + dist, iy, bx,by, dist / 2)) pos = 1; if (inBox(ix, iy + dist, bx,by, dist / 2)) pos = 2; if (inBox(ix - dist, iy, bx,by, dist / 2)) pos = 3; return pos; } float getTime(long p){ Float[] s = (Float[])trail.get((int)p); return s[0]; } void getIntersectionsDrivings(float range) { // range variable is not used if (trail.size() == 0){ System.out.println("car data are not loaded"); System.exit(0); } intersectionEvents = new ArrayList(); long pos = 0; long x1 = 0; long x2 = 0; int inIntersection = -1; Float [] s; Iterator e = trail.iterator(); while (e.hasNext()) { s = (Float[])e.next(); for (int i = 0;i <2;i++){ boolean in = inBox(intersections[i].x,intersections[i].y,s[1],s[2],30); if (in){ if (inIntersection == -1){ x1 = pos; inIntersection = i; } } if (!in){ if (inIntersection == i){ x2 = pos; String turnType = this.getTurnType(x1,x2);

Chapter 9 Appendix
48
int startPosition = getPos(x1,intersections[inIntersection].x,intersections[inIntersection].y, (float)30.0); int endPosition = getPos(x2,intersections[inIntersection].x,intersections[inIntersection].y, (float)30.0); float startTime = getTime(x1); float endTime = getTime(x2); if (startPosition != -1) intersectionEvents.add(new IntersectionEvents(inIntersection,turnType,startPosition,endPosition,x1,x2,startTime,endTime)); inIntersection = -1; } } } pos += 1; } } private static String roundOff (String s) { if (s == null || s.trim().length() == 0 || "0.00".equalsIgnoreCase(s) || "0".equalsIgnoreCase(s) || "-0.00".equalsIgnoreCase(s) || "-00.0".equalsIgnoreCase(s) || "-00.00".equalsIgnoreCase(s)|| "-0".equalsIgnoreCase(s)|| "-0.0".equalsIgnoreCase(s)) { return "0.00"; } double d = 0.00; int ind = s.indexOf('.'); if (ind>0) { String dec = s.substring(ind); if (dec.length() == 1){ s = s.concat("00"); return s; } if (dec.length() == 2) { s = s.concat("0"); return s; } if (dec.length() == 3) { return s; } } if (ind == -1) { return s.concat(".00"); } try { d = Double.parseDouble(s);

Chapter 9 Appendix
49
int decimalPlaces = 2; BigDecimal bd = new BigDecimal (d); bd = bd.setScale (decimalPlaces, BigDecimal.ROUND_HALF_UP); d = bd.doubleValue(); return String.valueOf(d); } catch (java.lang.NumberFormatException nfe) { return s.substring(0,ind); } } void getMeetings(Car other){ Iterator e = this.intersectionEvents.iterator(); while (e.hasNext()) { // s = one intersection event that we are observing // A intersection event is when a car is in a intersection. IntersectionEvents s = (IntersectionEvents)e.next(); Iterator f = other.intersectionEvents.iterator(); while (f.hasNext()) { // t = the other car's intersection event IntersectionEvents t = (IntersectionEvents) f.next(); boolean crossed = false; if ((s.startTime >= t.startTime) && (s.startTime <= t.endTime) && s.intersection == t.intersection) { crossed = true; // meetings contains times when two cars are in the same intersection at the same time. meetings.add(new Meeting(s,t,this,other,this.name)); } if ((s.endTime >= t.startTime) && (s.endTime <= t.endTime) && s.intersection == t.intersection && crossed != true) { crossed = true; meetings.add(new Meeting(s,t,this,other,this.name)); } if ((t.startTime >= s.startTime) && (t.startTime <= s.endTime) && s.intersection == t.intersection && crossed != true) { crossed = true; meetings.add(new Meeting(s,t,this,other,this.name)); } if ((t.endTime >= s.startTime) && (t.endTime <= s.endTime) && s.intersection == t.intersection && crossed != true) { crossed = true; meetings.add(new Meeting(s,t,this,other,this.name)); }

Chapter 9 Appendix
50
} } } void printMeetings(){ Iterator e = meetings.iterator(); while (e.hasNext()) { Meeting m = (Meeting) e.next(); m.print(); } } void dumpMeetings(){ Iterator e = meetings.iterator(); FileOutputStream out; FileOutputStream out1; FileOutputStream out2; int meetnumb = 0; while (e.hasNext()) { String PETable; Meeting meeting = (Meeting) e.next(); meetnumb++; if (meeting.PETfriendly){ PETable = "YESPET"; }else{ PETable = "NOPET"; } try { out = new FileOutputStream("c:/data/meetings/" + this.name +" "+ "S4" +" "+" Meeting " + meetnumb + "_" + PETable + ".dat"); out1 = new FileOutputStream("c:/data/meetings/" + this.name +" "+ "S4" +" "+ " DI " + meetnumb + "_" + PETable + ".dat"); out2 = new FileOutputStream("c:/data/pet/" + this.name + "_" +" "+ "S4" +" "+ PETable + " "+ meetnumb + ".dat"); p2 = new PrintStream (out2); p = new PrintStream( out ); p1 = new PrintStream( out1 );
Chapter 9 Appendix
51
} catch (Exception ex) { System.err.println ("Error writing to file"); } p.println ("t1 x1 y1 t2 x2 y2"); p1.println("t1 mcar acc spd lpos dti tcar"); p2.println("MCar TCar PETVal PETTotal"); long pos1 = meeting.k1.x1; long pos2 = meeting.k2.x1; int chk = 0; while (pos1 < meeting.k1.x2 || pos2 < meeting.k2.x2){ String t1 = " "; String t2 = " "; String x1 = " "; String y1 = " "; String x2 = " "; String y2 = " "; String acc1 = " "; String spd1 = " "; String lpos1 = " "; String dti1 = " "; if (pos1 < meeting.k1.x2){ Float[] g1 = (Float[])this.trail.get((int) pos1); t1 = g1[0].toString(); x1 = g1[1].toString(); y1 = g1[2].toString(); chk = 0; if (g1[8] <5 && g1[8]>0){ acc1 = g1[4].toString(); spd1 = g1[3].toString(); lpos1 = g1[5].toString(); dti1 = g1[8].toString(); chk = 1; } } if (pos2 < meeting.k2.x2){ Float[] g2 = (Float[])meeting.other.trail.get((int) pos2); t2 = g2[0].toString(); x2 = g2[1].toString(); y2 = g2[2].toString(); chk = 0; if (g2[8] <5 && g2[8]>0){ acc1 = g2[4].toString(); spd1 = g2[3].toString(); lpos1 = g2[5].toString(); dti1 = g2[8].toString(); chk = 1; }
Chapter 9 Appendix
52
} //if (meeting.PETfriendly){ //p2.println(this.name + " " + "P1" +" "+ meeting.other.name + " " + meeting.petval + " " + meeting.pettot ); //} p.println( roundOff(t1) + " " + roundOff(x1) + " " + roundOff(y1) + " " + roundOff(t2) + " "+ roundOff(x2) + " " + roundOff(y2) ); if(chk == 1) p1.println(roundOff(t1) + " " + this.name +" "+ roundOff(acc1) + " " + roundOff(spd1) + " " + roundOff(lpos1) + " "+ roundOff(dti1)+ " "+ meeting.other.name ); pos1++; pos2++; } p2.append(this.name + " " + meeting.other.name + " " + meeting.petval + " " + meeting.pettot ); p.close(); p1.close(); p2.close(); } } void getSpeeds(){ System.out.println("Meeting speed for " + this.name); System.out.println("30:"); Iterator e1 = this.meetings.iterator(); while (e1.hasNext()) { Meeting s1 = (Meeting)e1.next(); s1.getSpeed30(); } System.out.println("20:"); Iterator e2 = this.meetings.iterator(); while (e2.hasNext()) { Meeting s2 = (Meeting)e2.next(); //s2.getSpeed20(); } System.out.println("10:"); Iterator e3 = this.meetings.iterator();

Chapter 9 Appendix
53
while (e3.hasNext()) { Meeting s3 = (Meeting)e3.next(); s3.getSpeed10(); } System.out.println("5:"); Iterator e4 = this.meetings.iterator(); while (e4.hasNext()) { Meeting s4 = (Meeting)e4.next(); //s4.getSpeed5(); } } void printintersectionEvents() { System.out.println("IntersectionEvents:"); System.out.println("Car: " + this.name); System.out.print("number of detected intersections: "); System.out.println(intersectionEvents.size()); IntersectionEvents s; Iterator e = intersectionEvents.iterator(); while (e.hasNext()) { s = (IntersectionEvents)e.next(); System.out.print("intersection " + s.intersection + ", p1 " + s.x1 + ", p2 " + s.x2 + ", Svängtyp " + s.turnType + ", startPos " + s.startPos + ", endPos " +s.endPos + ",t1 " + s.startTime + ",t2 " + s.endTime); System.out.println(); } System.out.println(); } void printTrail() { System.out.println("storlek på trailen:"); System.out.println(trail.size()); Float [] s; Iterator e = trail.iterator(); while (e.hasNext()) { s = (Float[])e.next(); for (int i = 0;i < s.length;i++) { System.out.print(s[i]); System.out.print(","); } System.out.println();

Chapter 9 Appendix
54
} } } // Data.java import java.io.DataInputStream; import java.io.FileInputStream; import java.util.ArrayList; import java.util.Iterator; import java.util.StringTokenizer; class Data { String[] titles; ArrayList dataRows; int columns; Data (String filename) { try { dataRows = new ArrayList(); System.out.println("Loading data"); FileInputStream fstream = new FileInputStream(filename); DataInputStream in = new DataInputStream(fstream); StringTokenizer rubr = new StringTokenizer(in.readLine()); titles = new String [rubr.countTokens()]; int rubn = 0; while (rubr.hasMoreTokens ()){ titles[rubn] = rubr.nextToken(); rubn += 1; } in.readLine(); while (in.available() != 0) { StringTokenizer st = new StringTokenizer (in.readLine()); int colums = st.countTokens(); Float [] dataRad; dataRad = new Float [st.countTokens()]; int radn = 0; while (st.hasMoreTokens ()) { String str = st.nextToken(); try { // dataRad = is a row in the logfile dataRad[radn] = Float.valueOf(str.trim()).floatValue(); radn += 1; } catch (NumberFormatException nfe) {

Chapter 9 Appendix
55
System.out.println("NumberFormatException: " + nfe.getMessage()); } } dataRows.add(dataRad); } in.close(); } catch (Exception e) { System.out.println("File input error"); System.exit(0); } System.out.println("Data loaded."); } void print() { Float [] s; Iterator e = dataRows.iterator(); while (e.hasNext()) { s = (Float[])e.next(); for (int i = 0;i < s.length;i++) { System.out.print(s[i]); System.out.print(","); } System.out.println(); } } void print_titles() { for (int i = 0;i < titles.length;i++) { System.out.print(titles[i]); System.out.print(","); } System.out.println(); System.out.println(); } int rows() { return dataRows.size(); } int cols() { return titles.length; } ArrayList getMatrix() { return dataRows;
Chapter 9 Appendix
56
} } // IntersectionEvents.java import java.util.ArrayList; class IntersectionEvents{ int intersection; String turnType; long x1,x2; int startPos,endPos; float startTime, endTime; IntersectionEvents(int _intersection, String _turntype, int _startPos, int _endPos,long _p1, long _p2,float _startTime,float _endTime){ this.intersection = _intersection; this.turnType = _turntype; this.x1 = _p1; this.x2 = _p2; this.startPos = _startPos; this.endPos = _endPos; this.startTime = _startTime; this.endTime = _endTime; } boolean meets(IntersectionEvents other){ System.out.println("now called Intersection Events.meets()"); return false; } } // Intersection.java class Intersection{ float x; float y; Intersection(float _x, float _y){ this.x = _x; this.y = _y; } }