Embed Size (px)
Citation preview
First Quarter of 2011
Institutional Presentation

2
Agenda
1. Investment Highlights2. Strategic Positioning3. GRV acquisition4. Financial Highlights5. Appendix
Index

Agenda
1. Investment Highlights
3

Agenda
Business Model: Main Characteristics
CETIP and GRV Highlights
4
Provide critical market infrastructure
Credit
Strong barriers to entry
Same client base
Core mission
Strong diversification
Less diversified
Growth driver
Client
AssetClasses
Strong operating leverage and cash flow generation
High growth and high margin profile
Relatively high integrated model
Resilient and predictable cash generative business with low execution risk
Business Model
Competition

AgendaCompetition: Barriers to entry
5
Ne
w P
layers
/ com
pe
titors
Network effect (>10,000 clients) &
System integration with customers
Reputation
(“Ativo Cetipado”)
Strong relations with banks and assets managers
Broad portfolio of services and asset classes served
Scale and Regulatory framework
Low prices compared to different alternatives
Network effect (> 5,000 clients) &
System integration with customers
Nationwide integration of DMV’s
Database
Current system works well for all participants
Nationwide system with zero fraud
+ = Dominant
position
Stable Prices

Agenda
6
Registration - Fixed income instruments
Financial Institutions- CDs, IDs, others- Loans participants (CCBs)- Real estate financing (CCI, LCI, others)- Agribusiness financing (LCA, CCA, others)- Export financing- Others
Corporations- Corporate Bonds, Debentures, Commercial
Papers- OTC Derivatives
Custody- Debentures- Quota of Funds- Other assets held in custody
Transactions (custody services)- Management of Corporate
Events
Monthly Utilization- Connectivity Fee
12%*
14%* 9%*
15%*
(*) % of revenue (1Q11)
Business Model
Others- CIP services
8%*
GRV
- GRV Contracts
- SNG Vehicle (Liens)
- Selling Information
14%*
23%*
5%*

Agenda
7
Revenue Drivers (Gross Revenues)
Depository & Repository Services
• Bps (usual); R$/unit (exception)
• Structured and non-structured
• 1Q11 average margin on volume ($) – 0.06 bps
• R$ / unit
• 1Q11 average margin – R$ 0.86 / transaction
Registrar Services
• Bps (usual); R$/unit (exception)
• Intra vs. extra group; tenors
• 1Q11 average margin on volume ($) – 0.09 bps
• R$/contract (usual); bps (exception)
• Structured and non-structured
• 1Q11 average margin – R$ 44.68 / contract
Clearing & Settlement
• Bps (cap & floor)
Processing
• R$/transfer (decreasing fees schedule)
Connectivity
• Increasing fees schedule / customer
• Number of customers and level of activity
• 1Q11 average margin – R$ 1,019 / customer/month
Liens
• R$/lien
• 1Q11 average margin – R$ 25.00 / lien
Auto Loans Contracts
• R$/contract
• 1Q11 average margin – R$ 22.30 / contract
Fixe
d
Inco
me
OTC
D
eriv
ativ
esD
epo
sito
rySe
curi
ties
A
ctio
ns
7

AgendaMultiple Growth Drivers
(Source: Brazilian Central Bank)
Credit Growth in Brazil
326.8 336.4 384.4 418.3 498.7607.0
732.6936.0
1277.31414.3
1705.2
26%25%
22%24% 25%
28%31%
33%
40%
44%47%
0
200
400
600
800
1000
1200
1400
1600
1800
2000 2001 2002 2003 2004 2005 2006 2007 2008 2009 2010
Volume (R$ billion) % GDP
8

Agenda
9¹ Volumes for other countries in 2007Source: BIS, Global Insight, Oliver Wyman analysis
18,3
13,6 13,2
7,0
4,1
0,4
2,8
Annual Volume of OTC Derivatives Trading per Country1 Growth Drivers
UnitedStates
Japan Germany Italy Mexico Brazil’07
Brazil‘12
• Increase in usage of fixed rate debt
• Lengthening of tenors
• Progressive regulatory environment
• Increase in variety of underlying assets and sophistication of managers and investors
• Development of collaterization and tools for fair value calculation
CAGR 63%
Multiple of GDP
Underdeveloped capital markets – OTC Derivatives

Agenda
10
Underdeveloped capital markets – Fixed Income
0,11,6
5,17,2
9,0
14,116,0
29,6
44,3
Corporate Bonds¹
Debt outstanding as % of GDP (Sep/2010)
Turk
ey
¹ Exclude bonds issued by financial institutionsSource:Oliver Wyman, McKinsey, Brazilian Central Bank, International Monetary Fund , Bank for International Settlement
Mortgage Loans
Debt outstanding as % of GDP (2007)
Bra
zil
Au
stra
lia
Mex
ico
Sou
th A
Fric
a
UK
Jap
an
Un
ited
Sta
tes
Spai
n
Developed markets average 18%
Best emerging economies average 8%
2 3,5 3
11
16
26
36
5962
69
86
Turk
ey
‘07
Bra
zil
Mex
ico
Ch
ile
Sou
th A
Fric
a
Jap
an
Irel
and
Spai
n
Un
ited
Sta
tes
‘10
Bra
zil
UK
Developed markets average 64%
Best emerging economies average 12%CAGR
21%

AgendaUnderdeveloped capital markets – Auto Finance
Note: ¹New vehicles sales; ²Includes leasingSource: Fenabrave, BACEN, EIV, ANFAVEA, ANEF, CNW Marketing Research, CETIP, ACEA and UBS (not including motorcycles and light trucks)
New Car Sales¹ Million
Car penetrationCars / population (%)
1,61,8
2,3
2,7 2,8
3,4
2005 2006 2007 2008 2009 2010
CAGR 16% 50 48 47
44
25 23
15
France United Kingdom
EU United States
Korea BrazilRussia
90
61
% Vehicles Financed – 2009 (Includes Leasing) Total Vehicles Financing ²
59,177,4
111,6
139,1157,1
179,4CAGR 25%
2005 2006 2007 2008 2009 2010
2.4% 3.0% 4.1% 4.8% 5.4% 5.8%% GDP
11
Agenda
12
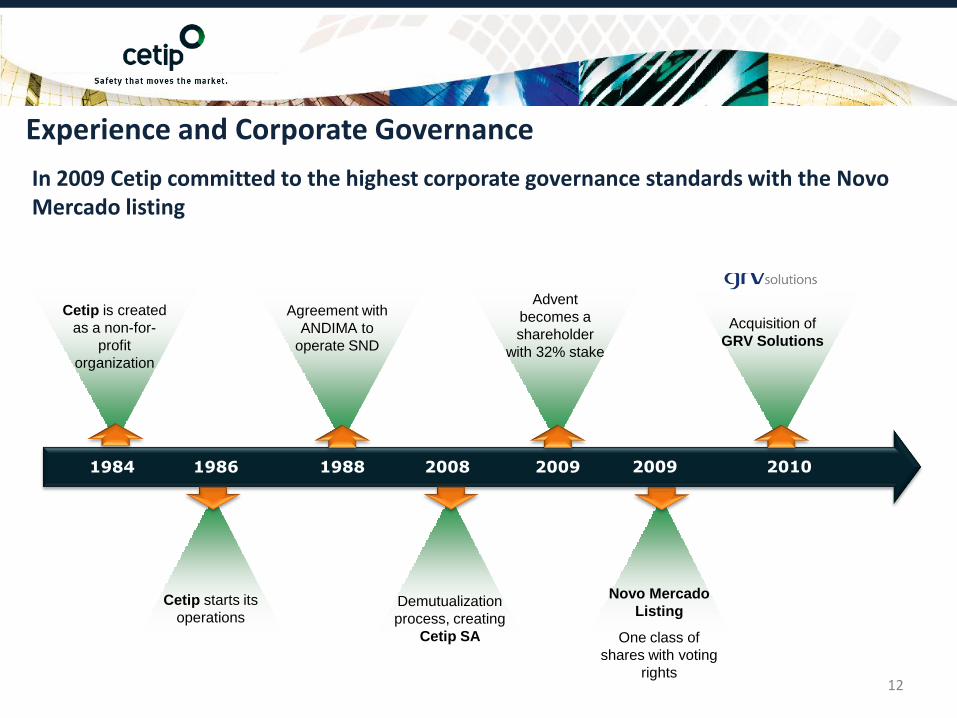
In 2009 Cetip committed to the highest corporate governance standards with the Novo Mercado listing
Experience and Corporate Governance
Cetip starts its
operations
Cetip is created
as a non-for-
profit
organization
1984 1986
Agreement with
ANDIMA to
operate SND
1988
Demutualization
process, creating
Cetip SA
2008
Advent
becomes a
shareholder
with 32% stake
2009 2009
Acquisition of
GRV Solutions
Novo Mercado
Listing
One class of
shares with voting
rights
2010

Agenda
13
Experience and Corporate Governance
Key Management Corporate Governance
Luiz Fernando Vendramini Fleury (CEO)Former CEO of IBI Bank / Redecard
Francisco Carlos Gomes (CFO)Former CFO of Bovespa, created CBLC
Wagner Anacleto (COO)Formerly at BM&FBovespa and CBLC
Carlos Eduardo Ratto Pereira (Commercial & Product Development Director)Formerly at BankBoston, Bank of America, Banco Itaú and HSBC Bank
Maurício Rebouças dos Santos (CIO)Formerly at Mercabolsa (Portugal), ANDIMA (Selic manager)
Carlos Menezes (Self regulation Director)Formerly at Unibanco and BPN Brasil Bank
Fabricio Bossle (Credit Operations Director)Formerly at GRV Solutions and Delloitte
Board
Committees
Self Regulation Board
Board of Directors
Pricing Committee
Self Regulation Officer
CEO
Credit Operations
Shareholders
CFO and Investor Relations
Commercial & Product
Development
Chief Operations
Officer
Chief Technology
Officer
Executive Bodies
Agenda
14
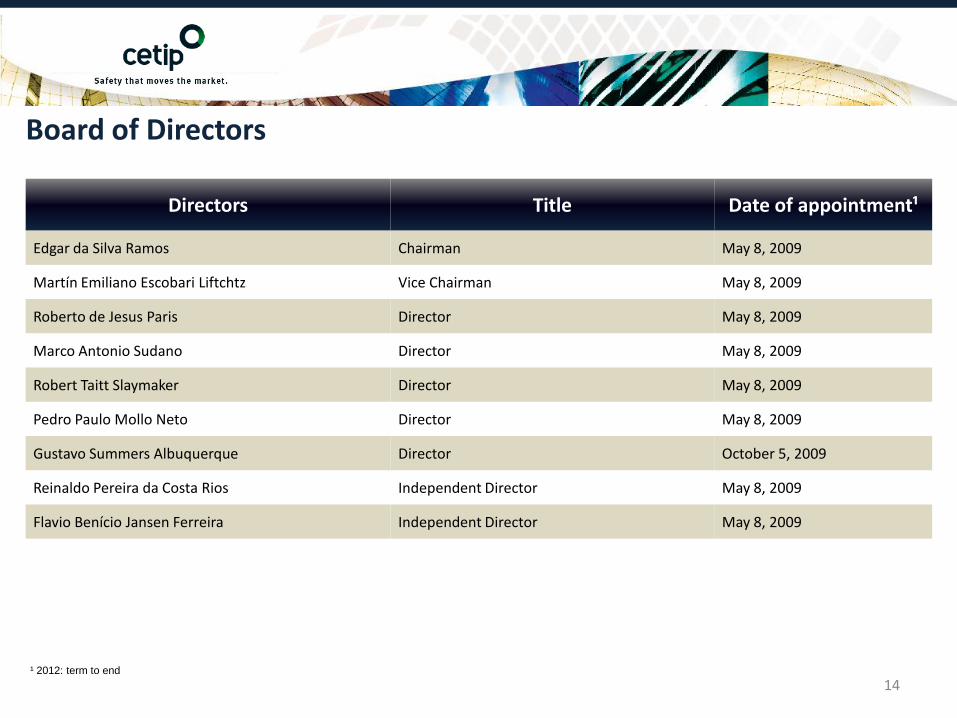
Board of Directors
Directors Title Date of appointment¹
Edgar da Silva Ramos Chairman May 8, 2009
Martín Emiliano Escobari Liftchtz Vice Chairman May 8, 2009
Roberto de Jesus Paris Director May 8, 2009
Marco Antonio Sudano Director May 8, 2009
Robert Taitt Slaymaker Director May 8, 2009
Pedro Paulo Mollo Neto Director May 8, 2009
Gustavo Summers Albuquerque Director October 5, 2009
Reinaldo Pereira da Costa Rios Independent Director May 8, 2009
Flavio Benício Jansen Ferreira Independent Director May 8, 2009
¹ 2012: term to end

Agenda
15
2. Strategic Positioning

Agenda
III. Develop connected businesses
• Renewal CIP contract and GRV acquisition
16
StrategyI. Continuous improvement on current core business
Improve quality of services and systems
• Depository
Introduction of new functionalities
• Resettable swaps and forwards
Broaden asset classes served
• Bank Corporate Bonds (LF)
• Structured Notes (COE)*
• OTC Equity Derivatives
Innovation: Introduction of new services
• MtM and Collateral Management
• Securities lending
1
2
3
4
1 Trading of fixed income securities
• Corporate bonds
• Bank corporate bonds (LF)
Trading of cash instruments
New exchange traded derivatives
Clearing & Settlement platform for specific OTC Derivatives
2
3
4
IV. Enlarge and develop the customer base
• Bill the beneficial owners and increase customer base by the connected business
V. Reinforce relationship with stakeholders
• Competitive prices, state of the art services, product innovation and flexibility
VI. Rationalize costs and maximize operational leverage
• Efficient capital structure
(*) Pending approval by the Brazilian Central Bank.
I. Expand the core business to adjacent layers

Agenda
17
2011 Strategic initiatives
Integrate
GRV
Roll Out
Real
Estate
Solutions
Roll Out
Collateral
Management
Develop right
strategy for our
new trading
fixed income
platform
Agenda
18
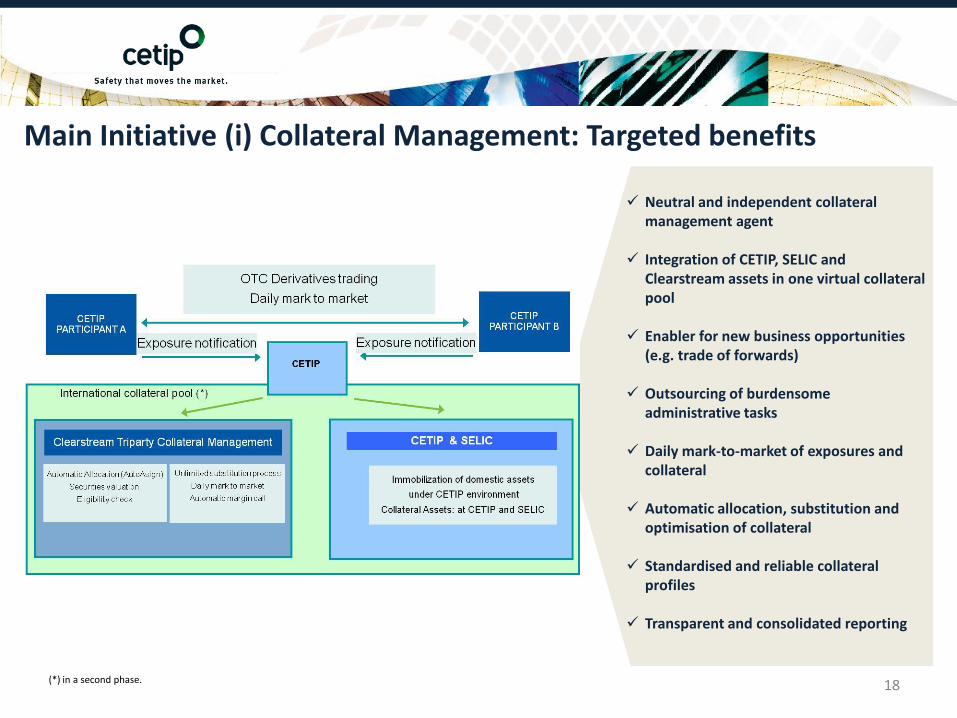
Neutral and independent collateral management agent
Integration of CETIP, SELIC and Clearstream assets in one virtual collateral pool
Enabler for new business opportunities (e.g. trade of forwards)
Outsourcing of burdensome administrative tasks
Daily mark-to-market of exposures and collateral
Automatic allocation, substitution and optimisation of collateral
Standardised and reliable collateral profiles
Transparent and consolidated reporting
Main Initiative (i) Collateral Management: Targeted benefits
(*) in a second phase.

Agenda
19
Main Initiative (ii) Electronic Trading Platform: Fixed Income
On November 11, CETIP and Deutsche Böerse AG
signed a non-binding letter of intention (LOI) to possibly
establish an electronic platform, initially focused on
fixed income security trading. The scope of the possible
strategic partnership will include joint promotion and
commercialization of an electronic trading platform for market participants, and the
parties will define the type of partnership to be established according to their
needs, as well as the market understanding. The scope of the agreement has not
yet been defined.

Agenda
20
Main Initiative (iii) SNG Real Estate
With the acquisition of GRV, we may jointly enhance and continue the project of developing a
platform to standardize and automatize registration of the real estate financing contracts,
integrating real estate notaries, lenders and consumers. SNG Real Estate will allow more agility
and security in the process of real estate registration in Brazil, as well as better management of
credit approval process.
Seller
Buyer
Lien
Registration
Protocol NotaryBank

Agenda
21
Main Initiative (iv) Letra Financeira
Main Characteristics
• Private and Public Offering;
• Remuneration: Fixed; DI; SELIC; IPCA; IGP-M; INPC; IGP-DI;
• Minimum term : 2 years;
• Compulsory requirement: exempt
Historical Growth – Balance outstanding
R$ billion
1,0 2,3 4,0
5,9 8,5
12,4
18,320,3 21,1
31,0
43.0
47,3
54,3
Mar-10 Apr-10 May-10 Jun-10 Jul-10 Aug-10 Sep-10 Oct-10 Nov-10 Dec-10 Jan-10 Feb-11 Mar-11
• Approved by Brazilian Central Bank on February 2010
• Public Placement regulation approved by Brazilian Securities and Exchange Commission – CVM on December 2010
– Effective introduction on January 17, 2011
Source: CETIP and Brazilian Central Bank (BACEN).

Agenda
22
3. GRV acquisition

Agenda
23
Investment Highlights
Focus on registration/custody.
Serves the same client base.
Provides mission critical market infrastructure.
Natural Extension of our Core Business
Preservation of high growth rates and high margin profile.High Growth, High Margins
Nationwide network with zero fraud track record.
Operates online with 27 DMVs and 8,000 clients.Strong Barriers to Entry
Highly accretive.
Optimizes capital structure.Attractive Deal Structure
CETIP will continue committed to the highest Corporate Governance standards, being listed at the Novo Mercado

Agenda
24
GRV deal
Highlights Description
Source: GRV, CETIPNote: ¹ Two years grace on amortization. First 12 installments equivalent to 0.80% of issue amount; 47 amortization installments of 1.88% of issue amount and the last installment -
2.04% of issue amount
• GRV was valued at R$2.0 billion– R$1.0 billion in cash at closing– R$445 million to be paid in CETIP shares– R$555 million in 3 equal installments
• The equal installments will be paid: R$185 million on 30/Dec/2011, R$185 million on 30/Dec/2012 and R$185 million on 31/May/2013. Values are adjusted by IGP-M+2% p.a.
• Issue Amount: R$900 million• Cost: DI + 2.0% p.a.• Total Tenure: 7 years¹
• Underwriters: Bradesco, Itaú, Santander, Votorantim
Payment Conditions
Price
Debentures

Agenda
25
Debt Issuance
Extraordinary Amortization
Debentures• DI +2%• 7 years
Installments• IGPM+2%• 3 equal installments
R$900 million R$555 million
2/3 = 0.50% 1/3 = 0.75%
R$ 185 mm R$ 185 mm R$ 185 mm
01/01/1900 02/01/1900 03/01/190012/31/2011 12/31/2012 05/31/2013
1 2 3 4 5 6 70
1.88%
0.80%
~ R$16 mm
~R$7 mm
~R$18 mm(2.04%)
R$ 900 mm
Princip
al
Grace Period

Agenda
26
4. Financial Highlights

Agenda
27
1 – Derivatives market share is 75% (weighted average based on nominal values Source: CETIP, GRV and BM&FBovespa2 - Other includes: fees for corrections, distribution, info services and GRV Patio3- Depository comprises Custody and Transactions revenues.
Total 15,5% 4,4% 12,2% 10,5% 7,3% 2,6% 1,3% 0,8% 3,7% 25,9% 15,8% 100,0% 100,0% 100,0%
CETIP Market
Share100%
98%100% 100% 100% 70%
100%16% 91%
100%67%
100% 58% 42%
CETIP +
GRV
CETIP
Stand
Alone
GRV
Stand
Alone
53,6% 20,4% 100,0%
23,2% 39,8% 0,0%
3,4% 5,9% 0,0%
0,0% 0,0% 0,0%
3,7% 6,4% 0,0%
0,6% 1,0% 0,0%
15,4% 26,5% 0,0%
Fund
Transfer
Time
Deposits
Interbank
DepositsOther
Corporate
Bonds &
Securitization
Instruments
Quotas of
fundsSwaps Forwards Options TED´s Liens Contracts
Auto LoanFixed Income Instruments OTC Derivatives
Registrar
Services
Depository &
Repository
Services
Trading
Clearing
&Settlement
Processing
Other
Connectivity
Fee
(% of Q11
Revenues)
45%

Agenda
28
Financial Highlights
Net Revenues – R$ mm Adjusted Op. Expenses (ex-D&A) – R$ mm &% of Net Revenues
+ 52.5%
35.341.7 44.8
60.0
44.2
1Q10 2Q10 3Q10 4Q10 1Q11
31.1% 33.2% 30.4% 35.1% 25.5%
+1.1%
113.5 125.6 147.2
171.2 173.1
1Q10 2Q10 3Q10 4Q10 1Q11
Note: 2010 financial information is unaudited combined pro-forma and was based on reasonable premises. For complete disclosure on the adjustments and premises taken into consideration,
please access 1Q11 Earnings Release at www.cetio.com.br/ri

Agenda
29
Financial Highlights
48.7 57.7 61.9
85.0 77.5
1Q10 2Q10 3Q10 4Q10 1Q11
Adjusted EBITDA (R$ mm) & Margin (%) Adjusted Net Income (Cash Earnings) – R$ mm
78.2 83.9 102.4
111.2 128.9
1Q10 2Q10 3Q10 4Q10 1Q11
69.6% 64.9%68.9% 66.8% 74.5%
+ 59.3%
EPS/R$ 0.20 0.23 0.25 0.34 0.31
Note: 2010 financial information is unaudited combined pro-forma and was based on reasonable premises. For complete disclosure on the adjustments and premises taken into consideration,
please access 1Q11 Earnings Release at www.cetio.com.br/ri

AgendaRevenue Breakdown (%)
30
16% 13% 12% 11% 12%
12% 12% 11% 12% 14%
14%13% 13% 14%
15%
7%7%
7% 8%9%
7%7% 7%
9%8%
31%29% 28% 25%
23%
8% 14% 17% 15% 14%
5% 5% 5% 5% 5%
1Q10 2Q10 3Q10 4Q10 1Q11
Registration
Custody
Monthly Utilization
Transactions
Others
SNG Vehicle
GRV Contracts
Selling Information
130.0 144.1 166.8 194.6 196.9GR
GR:Gross revenues in R$mm.

Agenda
31
Adjusted Operating Expenses Breakdown (ex-D&A)
Note: Combined pro-forma for CETIP and GRV
57% 57% 53%62%
54%
32% 31%32%
25%27%
10% 11% 13% 11%13%
1% 1% 1% 5%
1Q10 2Q10 3Q10 4Q10 1Q11
35.3 41.7 44.8 60.0 44.2
+ 25.0%
- 26.4%
Other expenses/revenues
Taxes
Expenses incurred on equipment and system rental
General and administrative expenses
Outsourced services
Personnel
(% and R$ mm)

Agenda
32
(16.1) (42.1) 0.1 (23.6)
40.0
- 7.3 13.0 17.2
Reconciliation of Adjusted Net Income (Cash Earnings) – R$ mm
121.6
77.5
EB
ITD
A
D&
A
Fin
an
cia
l R
es
ult
Eq
uit
y in
th
e r
esu
lt o
f asso
cia
te
Inco
me
Ta
x &
So
cia
l C
on
trib
.
NE
T I
NC
OM
E
No
n r
ec
urr
ing
exp
en
se
s
Sto
ck
Op
tio
n
Go
od
will a
mo
rtiz
ati
on
: ta
x c
red
it
CA
SH
EA
RN
ING
S
Cash Earnings
Inta
ng
ible
go
od
wil
l a
mo
rtiz
ati
on
Agenda
33
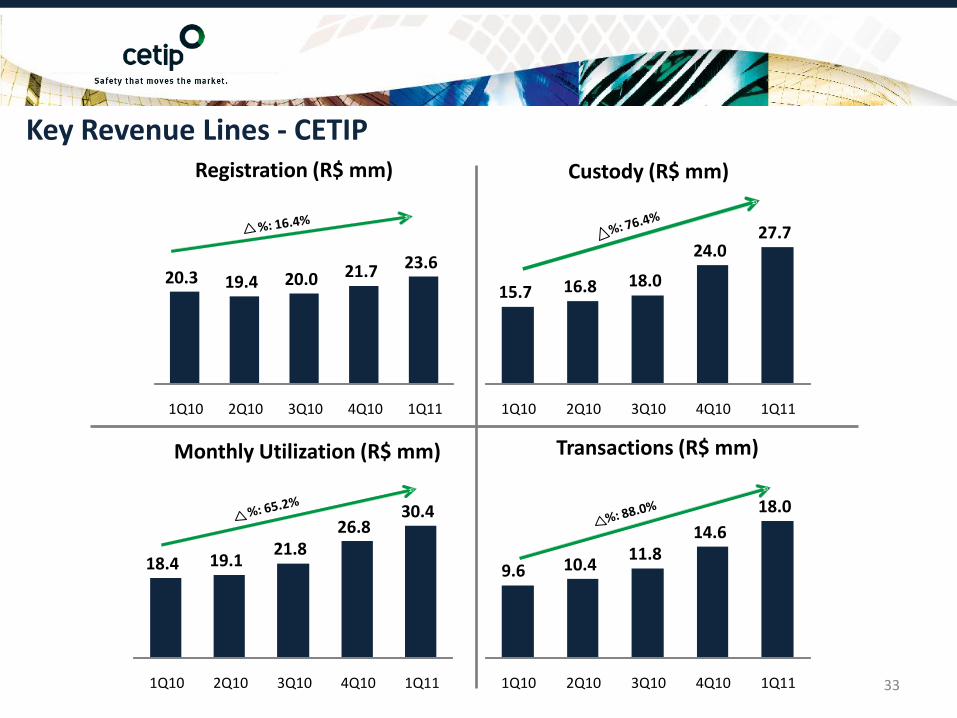
Key Revenue Lines - CETIP
20.3 19.4 20.0 21.7 23.6
1Q10 2Q10 3Q10 4Q10 1Q11
Registration (R$ mm)
15.7 16.8 18.0
24.0 27.7
1Q10 2Q10 3Q10 4Q10 1Q11
Custody (R$ mm)
18.4 19.1 21.8
26.8 30.4
1Q10 2Q10 3Q10 4Q10 1Q11
Monthly Utilization (R$ mm)
9.6 10.4 11.8
14.6
18.0
1Q10 2Q10 3Q10 4Q10 1Q11
Transactions (R$ mm)

Agenda
34
Key Revenue Lines - GRV
Note: Contract Additions began in September 2009.
39.8 41.146.2
49.344.8
1Q10 2Q10 3Q10 4Q10 1Q11
SNG Vehicles (R$ mm)
10.2
20.0
28.5 30.127.2
1Q10 2Q10 3Q10 4Q10 1Q11
GRV Contracts (R$ mm)
Agenda
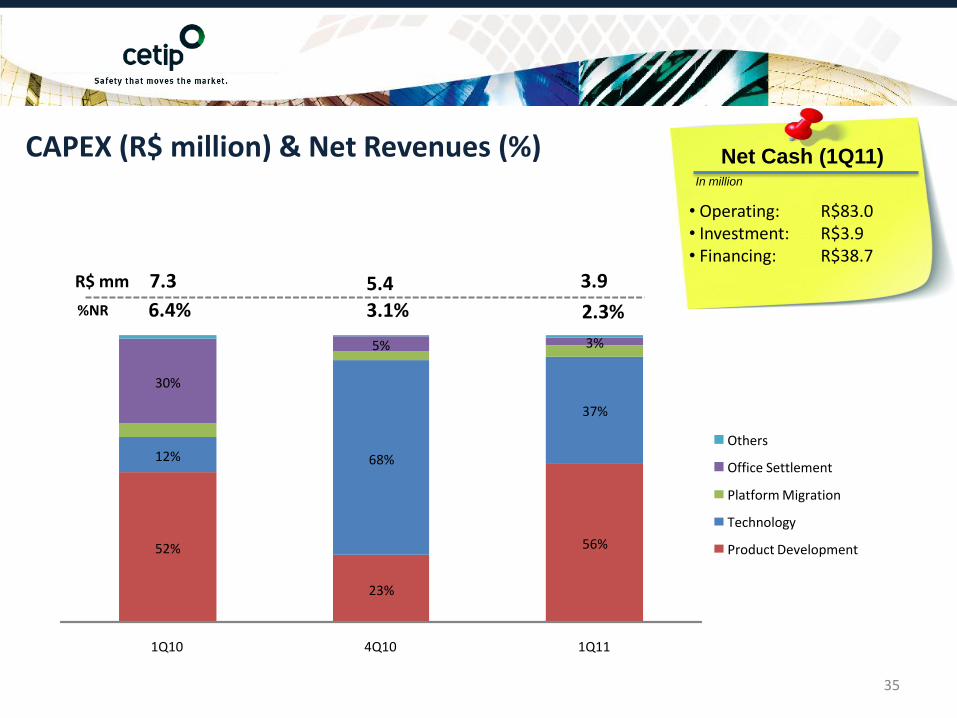
35
52%
23%
56%
12% 68%
37%
30%
5% 3%
1Q10 4Q10 1Q11
CAPEX (R$ million) & Net Revenues (%)
%NR
R$ mm 7.3 5.4 3.9
• Operating: R$83.0• Investment: R$3.9• Financing: R$38.7
Net Cash (1Q11)In million
6.4% 3.1% 2.3%
Others
Office Settlement
Platform Migration
Technology
Product Development
Agenda
36
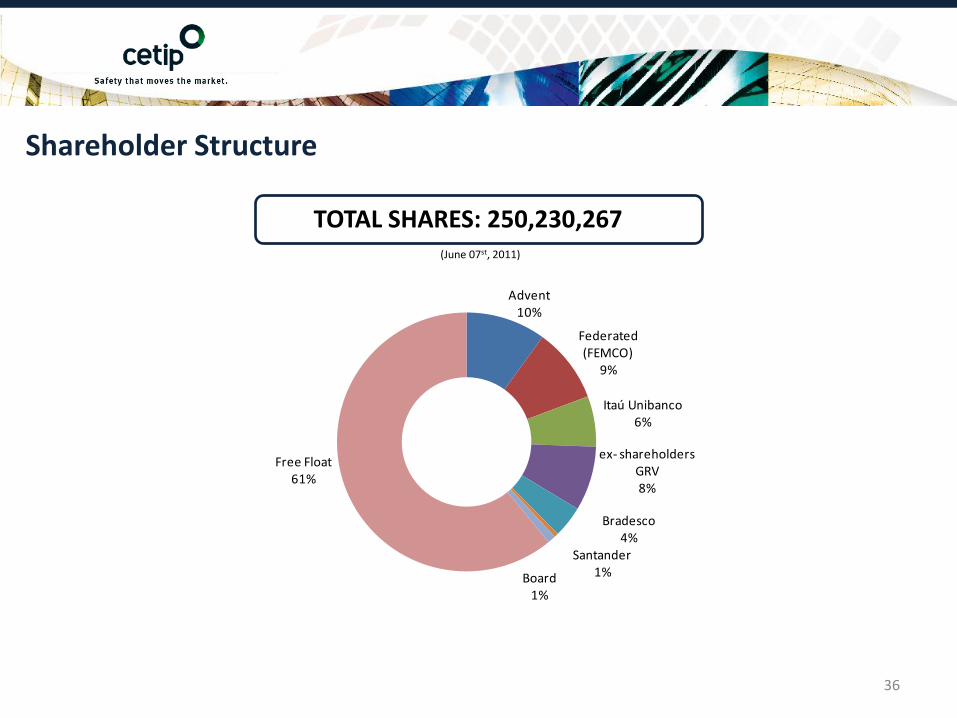
Shareholder Structure
(June 07st, 2011)
Advent10%
Federated (FEMCO)
9%
Itaú Unibanco6%
ex- shareholders GRV8%
Bradesco4%
Santander1%Board
1%
Free Float61%
TOTAL SHARES: 250,230,267

Agenda
-
5,00
10,00
15,00
20,00
25,00
30,00
35,00
40,00
2,00
7,00
12,00
17,00
22,00
27,00
Oct-0
9
No
v-09
De
c-09
De
c-09
Jan-1
0
Jan-1
0
Feb
-10
Feb
-10
Mar-1
0
Mar-1
0
Ap
r-10
Ap
r-10
May-1
0
May-1
0
May-1
0
Jun
-10
Jun
-10
Jul-1
0
Jul-1
0
Au
g-10
Au
g-10
Sep
-10
Sep
-10
Oct-1
0
Oct-1
0
No
v-10
No
v-10
De
c-10
De
c-10
Jan-1
1
Jan-1
1
Feb
-11
Feb
-11
Mar-1
1
Mar-1
1
Ap
r-11
Ap
r-11
May-1
1
May-1
1
Jun
-11
Vo
lum
e (R
$ m
m)
Pri
ce (R
$)
Volume-R$mm Price-R$
37
Price vs. Volume
Source: Bloomberg
CTIP3 (R$) vs. Volume (R$ mm): (10/30/09 – 06/15/11)

Agenda
5. Appendix
38

AgendaRegistration Revenue – R$ million
39
Fixed Income
OTC Derivatives
Others
15.312.6 13.2
15.1 16.2
4.6
5.6 5.24.6
5.40.4
1.2 1.62.1
2.0
1Q10 2Q10 3Q10 4Q10 1Q11
+ 8.9%
+16.4%

AgendaCustody Revenue – R$ million
40
15.716.8
18.0
24.0
27.7
1Q10 2Q10 3Q10 4Q10 1Q11
+76.4%
+ 15.3%

AgendaRevenues and Volumes of Transactions and Monthly Utilization
9.6 10.4 11.814.6
18.0
1Q10 2Q10 3Q10 4Q10 1Q11
+88.0%
8,8279,118
9,3959,705
9,934
1Q10 2Q10 3Q10 4Q10 1Q11
+12.5%
18.4 19.121.8
26.830.4
1Q10 2Q10 3Q10 4Q10 1Q11
+65.2%
+23.2%
+2.4%+13.3%
Transactions – Revenues (R$ million)
Monthly Utilization – Number of Participants Monthly Utilization – Revenues (R$ million)
41
13.3 14.4 16.219.8 21.0
1Q10 2Q10 3Q10 4Q10 1Q11
+57.8%
+6.1%
Transactions – Quantity (million)

AgendaDIs and CDBs - Volumes and Revenues
339398 439
638 601
1Q10 2Q10 3Q10 4Q10 1Q11
814 756896
1,351
1,091
1Q10 2Q10 3Q10 4Q10 1Q11
11.4
7.7 7.4 6.87.9
1Q10 2Q10 3Q10 4Q10 1Q11
+34.1% -30.1%
+77.2%
2.73.2 3.3
4.8 4.6
1Q10 2Q10 3Q10 4Q10 1Q11
+68.2%
-19.3%
-5.7%
+17.6%
-5.9%
CDB – Volume (R$ billion) CDB – Revenue (R$ million)
DI – Revenue (R$ million)DI – Volume (R$ billion)
42
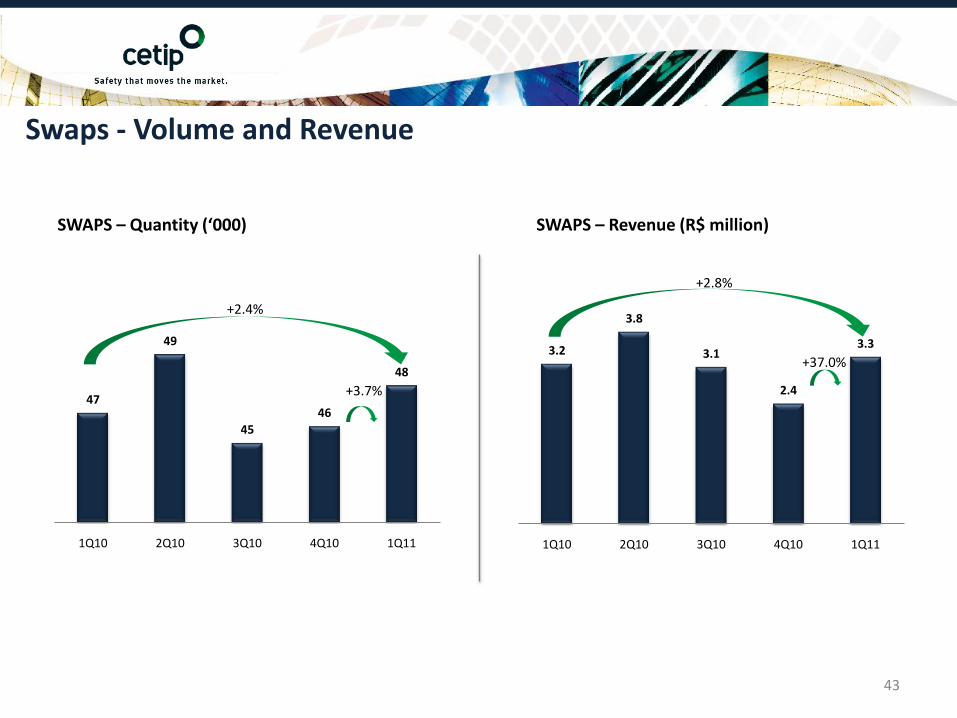
AgendaSwaps - Volume and Revenue
SWAPS – Quantity (‘000) SWAPS – Revenue (R$ million)
47
49
45
46
48
1Q10 2Q10 3Q10 4Q10 1Q11
+2.4%
+3.7%
3.2
3.8
3.1
2.4
3.3
1Q10 2Q10 3Q10 4Q10 1Q11
+37.0%
43
+2.8%

AgendaDebentures and Investment fund-quota – Volumes and Revenues
288
301
317
331342
1Q10 2Q10 3Q10 4Q10 1Q11
+18.6%
9.8 10.4 11.0
14.2 14.8
1Q10 2Q10 3Q10 4Q10 1Q11
+51.2%
656 690 713 766 803
1Q10 2Q10 3Q10 4Q10 1Q11
+22.4%
2.5 2.6 2.8
3.53.8
1Q10 2Q10 3Q10 4Q10 1Q11
+53.4%
+3.3%
+4.8%
+4.6%
+6.5%
Debentures – Average Volume (R$ billion) Debentures – Revenue (R$ million)
Investment fund-quota – Revenue (R$ million)Investment fund-quota – Average Volume (R$ billion)
44

AgendaCETIP: CIP – Revenue and Volume
18.320.0
23.3 24.6 23.8
1Q10 2Q10 3Q10 4Q10 1Q11
6.6
6.2
7.07.2
7.0
1Q10 2Q10 3Q10 4Q10 1Q11
+5.8%
+30.0%
- 1.9%-3.5%
359323
300
391
45Note: Revenue refers only to services of SITRAF – Transfer Funds System.
Processed EFTs(Quantity – MM)
Processed EFTs/day(Quantity - thousand)
Processed EFTs CIP – Revenue (R$ million)
383

AgendaGRV Market Information
46
Source: GRV Solutions and Fenabrave.
(million)
SNG Vehicle 1Q11 4Q10 1Q10 1Q11/4Q10 1Q11/1Q10
Number of vehicles sold 4.0 4.7 3.5 -14.6% 13.0%
New 1.3 1.6 1.2 -16.7% 6.3%
Used 2.7 3.1 2.3 -13.6% 16.6%
Number of Vehicles Financed 1.8 2.2 1.8 -18.5% 1.2%
New 0.9 1.1 0.9 -19.6% -1.3%
Used 0.9 1.1 0.9 -17.4% 3.8%
% Vehicles financed / vehicles sold 45% 47% 50% - -
GRV Contracts
Contracts Additions (Units) 1.2 1.5 0.5 -18.9% 139.4%
% Contracts additions / vehicles financed 68% 68% 29% - -
Volume Change (%)
Agenda
47
Legal Disclaimer
This material was issued by CETIP S.A. – Balcão Organizado de Ativos e Derivativos (“CETIP”). CETIP is authorized to operate by the Brazilian Securities
and Exchange Commission (CVM) and regulated by both the CVM and the Brazilian Central Bank. The information herein is only for reference purposes, as
CETIP has based this material on information obtained from sources it considers reliable, and CETIP may alter the content of this material at any time
without prior notice. CETIP is in no way responsible for losses arising from the direct or indirect use of this material or the consequences thereof. Although,
in some cases, this material may contain the opinions and future expectations of CETIP, there may be a series of risks, uncertainties and other material
factors that may cause real results to differ significantly from CETIP’s expectations. CETIP assumes no responsibility to update or alter this content, be it
due to new information, future events or other situations. Likewise, CETIP does not hereby provide any specific recommendations of a legal, tax, regulatory
or other nature not included the scope of this material. Clients contract any the services herein at their exclusive discretion and risk, and CETIP is only
responsible for communicating new products and services. The examples included herein symbolize hypothetical, simulated situations and are merely
illustrative. Their behavior may or may not represent real market situations, and CETIP is in no way liable for these cases or for the results of real cases.
This material was created by CETIP’s Products division according to applicable regulations and does not contain all the operating procedures and technical
details of the services herein presented. This content may differ from other disclosure materials issued by CETIP, and should not be used in any way as an
update of previous materials disclosed by CETIP. Nothing herein restricts or excludes and applicable legal responsibility of clients, according to legislation
and regulations. This material is the property of CETIP, and reproduction, in whole or in part, of this content, by any means, without express prior consent as
per Law no. 9,610/1998 is expressly prohibited. Due to the characteristics of the markets it serves, CETIP does not have a guaranty fund or other
mechanisms do indemnify losses, and for this reason no fees or contributions are charged for this purpose.
Investor [email protected]