Embed Size (px)
Citation preview

Institutional Ownership, Peer Pressure and Voluntary Disclosures
Yupeng Lin National University of Singapore
Ying Mao
Lingnan University [email protected]
Zheng Wang* City University of Hong Kong
We appreciate helpful comments from Anne Beatty (editor), two anonymous reviewers, Bin Ke, Xu Han, Oliver Zhen Li, Haibin Wu, Zhifeng Yang, Liandong Zhang, seminar participants at the Huazhong University of Science and Technology, and colleagues at the City University of Hong Kong, and the National University of Singapore. We thank the Russell Investment Corporation for providing the Russell index data. We gratefully acknowledge the financial support of the City University of Hong Kong, and the National University of Singapore. Lin also acknowledges financial support from the National Natural Science Foundation of China (Grant Number 71772110). *Correspondence: Dr. Zheng Wang, Department of Accountancy, City University of Hong Kong, 83 Tat Chee Avenue, Kowloon Tong, Hong Kong (e-mail: [email protected]; phone: +852-3442-5204)

Institutional Ownership, Peer Pressure, and Voluntary Disclosures
ABSTRACT: We document peer effect as an important factor in determining corporate voluntary disclosure policies. Our identification strategy relies on a discontinuity in the distribution of institutional ownership caused by the annual Russell 1000/2000 index reconstitution. Around the threshold of the Russell 1000/2000 index, the top Russell 2000 index firms experience a significant jump in institutional ownership compared with their closely-neighbored bottom Russell 1000 index firms due to index funds’ benchmarking strategies. The increase in institutional ownership and resultant improvement in the information environment of the top Russell 2000 index firms create pressures on their industry peers to increase voluntary disclosures. Consistent with this prediction, we find that the discontinuously higher institutional ownership of the top Russell 2000 index firms significantly increases industry peers’ likelihood and frequency of issuing management forecasts. Further analyses show that such an effect could be driven by firms’ incentive to compete for capital.
Keywords: Institutional ownership; peer effect; voluntary disclosures; Russell index
JEL Classifications: G23, G34, M41, D80.
Data Availability: Data are available from the public sources cited in the text.

1
I. INTRODUCTION
Peer effects have long been central research considerations in sociology, social psychology,
and economics (Asch 1952; Merton 1957; Bikhchandani, Hirshleifer, and Welch 1992; Leary and
Roberts 2014). Theoretically, the action chosen by one firm can affect the constraints, expectations,
and/or preferences of its economically related peers and, in turn, its peers’ actions (Manski 2000).
Empirically, there is some evidence from extant studies showing that industry peers have
interdependent corporate policies, including capital structure (Leary and Roberts 2014),
investment (Beatty, Liao, and Yu 2013), and compensation (Bizjak, Lemmon, and Naveen 2008).
A common empirical challenge in this stream of research, as highlighted by Leary and Roberts
(2014), is to credibly establish the causal effect of one firm’s behavior or characteristics on the
interdependent behavior of its peers, since such an association can be driven by the similar
individual characteristics of peers within the same group or by their similar institutional
environments (Manski 1993).
In this study, we overcome the aforementioned empirical challenge and document a peer effect
on corporate disclosures, utilizing a quasi-randomized experiment instituted by the indexing
behavior of the Russell Investment Company (RIC). Every year, on May 31, the RIC ranks all
eligible stocks according to their market capitalization. The first 1000 largest firms are included in
the Russell 1000 index and the next 2000 largest firms constitute the Russell 2000 index. In this
regard, the market capitalizations of these 3000 firms evolve smoothly with respect to the rankings.
Near the Russell 1000/2000 threshold, the differences in size between the top Russell 2000 index
firms (i.e. the largest Russell 2000 index firms) and the bottom Russell 1000 index firms (i.e. the
smallest Russell 1000 index firms) should be small. However, since both the Russell 1000 and
2000 indexes are value weighted, firms in the top of the Russell 2000 index receive significantly

2
higher weights compared to firms in the bottom of the Russell 1000 index within their respective
indexes. When index funds benchmark against the Russell indexes to form their portfolios, they
mechanically hold more shares in the top Russell 2000 index firms and significantly fewer shares
in the bottom Russell 1000 index firms, resulting in a significant jump in quasi-indexer ownership
at the cutoff point between the two indexes (Boone and White 2015; Appel, Gormley, and Keim
2016; Crane, Michenaud, and Weston 2016). Since this discontinuous increase in quasi-indexer
ownership near the Russell 1000/2000 threshold is considered a plausibly exogenous shock to
individual firms, it allows us to establish causal evidence on peer influence by examining the
reactions of the Russell firms’ peers following annual Russell 1000 and 2000 index reconstitution.
Prior studies provide ample evidence that institutional ownership benefits firms by improving
their information environments and, in turn, their access to capital (e.g., Healy, Hutton, and Palepu
1999; Bushee and Noe 2000; Jiambalvo, Rajgopal, and Venkatachalam 2002; Bushman, Piotroski,
and Smith 2004; Ajinkya, Bhojraj, and Sengupta 2005). In particular, Boone and White (2015)
show that the higher quasi-index ownership of the top Russell 2000 index firms leads to an increase
in management disclosures, analyst following, and liquidity. The authors argue that quasi-indexers
have a strong incentive to demand greater public disclosures because it is costly for them to gather
private information on their portfolio firms due to their large and diverse holdings. In addition,
greater corporate transparency can reduce quasi-indexers’ monitoring costs. Both managers and
analysts would cater to quasi-indexers’ demands by supplying more public information, resulting
in a more transparent information environment and better stock liquidity. 1
We rely on the annual reconstitution of the Russell indexes to identify peer influence on
corporate voluntary disclosures. Specifically, we investigate management forecasts of the industry
1 Recent studies show that quasi-indexers are active voters and exert strong influence over corporate policies (Appel et al. 2016; Bird and Karolyi 2016; Chen, Li, and Shevlin 2016; Crane et al. 2016; Khan, Srinivasan, and Tan 2016).
3
peers of the top Russell 2000 index firms versus those of the bottom Russell 1000 index firms
following annual Russell 1000/2000 index reconstitution. We argue that the increase in
institutional ownership and/or resultant improvement in the information environment of the top
Russell 2000 index firms create pressure on other firms in the same industry to take action to
improve their own information environment. Such pressure can stem from managers’ incentive to
compete for capital, mimic peers, or satisfy the demand of common institutional investors (Merton
1957; Bryant 1983; Diamond 1985; Jung 2013). We are interested in examining management
forecasts as a form of voluntary disclosures because they are shown by prior studies to be an
effective strategic mechanism used by managers to improve the information environment. 2
According to Beyer et al. (2010), management forecasts, on average, account for approximately
55 percent of the quarterly stock return variance attributed to accounting-based information,
including earnings announcements and other forms of voluntary disclosure.
Using a regression discontinuity design (RDD), we find that the discontinuity of institutional
ownership around the Russell 1000/2000 threshold causes a significant variation in the likelihood
and frequency of management forecast issuance by industry peers of the Russell index firms.
Compared with the industry peers of firms in the bottom of the Russell 1000 index with lower
institutional ownership, industry peers of the top Russell 2000 index firms, with greater
institutional ownership, are more likely to issue management forecasts and communicate with their
investors more frequently. Given that exposure to high institutional ownership can be viewed as
nearly random when the samples of Russell index firms are restricted to a narrow band, our
inference is unlikely driven by omitted common variables. Our results are robust to the different
2 The role of management forecasts in improving the information environment is well documented (e.g., Ruland, Tung, and George 1990; Marquardt and Wiedman 1998; Lang and Lundholm 2000; Francis, Khurana, and Pereira 2005; Graham, Harvey, and Rajgopal 2005; Balakrishnan, Billings, Kelly, and Ljungqvist 2014). See also the reviews by Hirst, Koonce, and Venkataraman (2008) and Beyer, Cohen, Lys, and Walther (2010).

4
bandwidth choices around the threshold, polynomial orders of the functional forms, the propensity
score matching (PSM) procedure, changes analyses, and the instrumental variable (IV) approach
as an alternative identification strategy.
A large body of literature shows that a better corporate information environment attracts
cheaper capital and lowers firms’ cost of financing.3 Boone and White (2015) provide supportive
evidence by showing an increase in stock liquidity for firms in the top of the Russell 2000 index
due to the increase of their institutional ownership. We thus conjecture that the top Russell 2000
index firms gain competitive advantages on the product market due to their access to cheaper
capital. In oligopoly theory, competitors react to each other’s strategic moves. In addition, the
marginal returns to increasing one’s strategy rise with increases in the competitors’ strategy (e.g.,
Bryant 1983; Diamond 1985; Milgrom and Roberts 1990). In this respect, when one firm’s
information environment is improved, and in turn its cost of capital is lowered, it increases the
marginal benefit of its industry competitors’ actions to improve their own information
environments. Therefore, via the network of industry competition, the competitive advantage of
the top Russell 2000 index firms motivates industry peers to take actions to improve their own
information environments and lower their cost of capital. Therefore, we predict that the industry
peers strategically issue more management forecasts to keep up with the competition for capital.
We first show that the effect of higher institutional ownership on increasing peer firms’
management forecasts as documented in the main test is weakened after controlling for Russell
firms’ stock liquidity during the period following the annual index reconstitution. This result
suggests that the increase in stock liquidity that comes with high institutional ownership drives
3 See, among others, Myers and Majluf (1984), Diamond and Verrecchia (1991), Chung and Jo (1996), Lang and Lundholm (1996), Sengupta (1998), Healy et al. (1999), Easley and O’Hara (2004), Francis et al. (2005), Leone, Rock, and Willenborg (2007), Kothari, Li, and Short (2009), and Beyer et al. (2010).
5
peer firms to respond by increasing their voluntary disclosures, supporting peers’ competition for
capital as one important channel through which peer pressure is exerted. Next, we use Rajan and
Zingales’ (1998) measure of the dependence of external financing, namely, the RZ ratio, and the
market-to-book ratio to proxy for firms’ need to attract external capital. Our cross-sectional
analyses reveal that peer firms with greater needs for external financing represented by a higher
RZ ratio and market-to-book ratio are more responsive to the high institutional ownership of the
top Russell 2000 index firms in the industry. These results suggest that peer firms in need of capital
have stronger incentives to improve their information environment to compete for it.
Our study first contributes to the growing literature on the impact of peer influence on
corporate policies, disclosures, and other firm-specific characteristics.4 Beatty et al. (2013) show
that peers react to fraudulent reports by increasing investments during the period of fraud. Ozoguz
and Rebello (2013) show that firms’ investments respond to innovations in the stock prices of peer
firms, which suggests that managers use information in peer firms’ stock prices in making
investment decisions. Jung (2013) shows that common institutional ownership can drive intra-
industry information demand and diffusion of disclosure practices. There are also studies that
provide evidence of peer firms’ influence on capital structure and financing choice, disclosures,
and compensation (e.g., Arya and Mittendorf 2007; Bizjak et al. 2008; Laschever 2013; Leary and
Roberts 2014).5 We add additional evidence to this literature by documenting peer influence as a
significant factor that drives managers’ decisions to make voluntary disclosures beyond those firm-
specific characteristics documented in earlier studies (Healy and Palepu 2001; Hirst et al. 2008;
4 A few studies document intra-industry information transfer associated with earnings announcements, management forecasts and accounting restatements (e.g., Foster 1981; Baginski 1987; Han, Wild, and Ramesh 1989; Gleason, Jenkins, and Johnson 2008). 5 Leary and Roberts (2014) show that firms’ capital structures and debt and equity issuance decisions are significantly related to peer firm equity shocks. Arya and Mittendorf (2007) show that competing firms can coordinate mutually beneficial disclosures to attract analyst coverage. Bizjak et al. (2008) and Laschever (2013) show that peer comparisons play a role in the determination of executive compensation.

6
Beyer et al. 2010). In addition, this study uses a nearly randomized experiment to overcome the
identification problems faced by empirical studies that examine peer effects. The identification of
peer effects is empirically challenging because the observed interdependent behaviors among peers
can be driven by the similar individual characteristics of peers within the same group or by their
similar institutional environments (Manski 1993). Relying on the exogenous variation in
institutional ownership of those Russell firms near the index threshold, we are able to causally
attribute the variation in their corresponding industry peers’ management forecast behavior as
evidence of a peer effect.
Second, extant studies mostly focus on the beneficial effects of institutional ownership on a
firm’s own information environment, such as disclosure practices, analyst following, and stock
liquidity (e.g., Healy et al. 1999; Bushee and Noe 2000; Ajinkya et al. 2005; Boone and White
2015). However, little is known about the effects of institutional investors on firms beyond those
in which they have invested. Piotroski and Roulstone (2004) find that institutional investors
facilitate the incorporation of firm- and industry-specific information into stock prices. In other
words, the presence of significant institutional ownership facilitates intra-industry information
transfer. Our study contributes to the literature by documenting that the beneficial effect of
institutional ownership can spill over to peer firms in the same industry, causing industry-wide
information transparency.
The remainder of this paper is structured as follows. Section II introduces our identification
strategy. Section III describes our data and sample selection procedure and discusses the main and
control variables. Section IV presents our empirical results, including the main results, and those
of robustness tests and additional analyses. The final section concludes the paper.

7
II. IDENTIFICATION STRATEGY
The Empirical Challenge of Identifying a Peer Effect
If we observe a characteristic X of firm i in a group Ω at time t and we try to infer whether a
peer firm j from the same group Ω would take a responsive action Y (peer effect) at time t, the
following model could be used to investigate the economic significance of the potential peer effect:
Peer Y j,t = β0 + β1 X i,t + Observed Characteristics of peer firm j + Observed Characteristics of firm i+ Observed Characteristics of group Ω + Unobserved Characteristics of peer firm j + Unobserved Characteristics of firm i + Unobserved Characteristics of group Ω + ε j,t . (1)
The challenge in estimating the above model is the omitted variable problem that results from
unobserved characteristics stemming from firm i, the corresponding peer firm j, and the common
group Ω. Controlling firm or group fixed effects is unlikely to resolve this problem, because the
characteristics X of firm i at time t and the response Y of firm j at time t can be simultaneously
driven by unmodeled factors in time t rather than any time-invariant factor captured by fixed
effects. The concern about omitted variables is greater when studying peer effects because both
firm i and the corresponding peer firm j are from the same group Ω, which potentially results in
more omitted common causal variables (Manski 1993; Leary and Roberts 2014). In this regard,
the assumption of a zero conditional mean can be hardly satisfied, since the residual ε captures all
omitted variables that could be related to X (i.e., E(X|ε) ≠ 0).
In the context of this study, an industry firm i’s institutional ownership is unlikely to be
exogenous. For example, the change in institutional ownership could be driven by an industry-
wide shock that simultaneously affects the disclosure behavior of firm i and its corresponding peer
firm j. To address this problem and establish causality between firm i’s action X and firm j’s
response Y, we need to look for a random event that affects only the institutional ownership of firm

8
i but not that of the corresponding peer firm j. With such randomized assignments of treatment
(i.e., higher institutional ownership), we can have the condition E (X| ε) = 0.
Russell Index Reconstitution
We utilize a quasi-randomized experiment instituted by the indexing behavior of the Russell
Investment Company (RIC) to establish the peer effect on firms’ voluntary disclosure behavior.
Every year, on the last trading date in May, the RIC ranks eligible stocks based on their market
capitalization. The largest 1000 stocks are included in the Russell 1000 index and the next 2000
largest stocks are used to construct the Russell 2000 index. Subsequently, the RIC constructs the
indexes on the last date of June using the predetermined weights of member stocks. The index
weights are determined by dividing each firm’s float-adjusted market capitalization by the
cumulative floated-adjusted market capitalization of all firms assigned to that particular index. The
RIC computes each firm’s float-adjusted market capitalization using its actual number of shares
available to trade publicly. Near the Russell 1000/2000 threshold, firms’ market capitalizations
evolve smoothly in the sense that the top Russell 2000 index firms and the bottom Russell 1000
index firms have very similar market capitalizations. However, due to the value-weighted
construction of each index, the top Russell 2000 index firms receive significantly higher index
weights than the bottom Russell 1000 index firms within their respective indexes, resulting in a
sharp jump in weights around the threshold.6
Due to their transparency and convenience, the Russell indexes are popular among institutional
investors. Many index and quasi-index funds rebalance their portfolios based on the movements
of the Russell indexes. Then the discontinuity of the index weights described above plus the fact
that Russell 2000 index is even more popular than Russell 1000 index, mechanically results in
6 In the Internet Appendix Figure IA1, we graphically illustrate the smooth evolvement of market capitalization and a discontinuity in index weights around the threshold of Russell 1000/2000 index.

9
higher ownership by quasi-indexers for firms at the top of the Russell 2000 index compared to
firms at the bottom of the Russell 1000 index near the threshold of the indexes (Lu 2013; Chang,
Hong, and Liskovich 2015). Lee and Lemieux (2010) contend that if the assignment variable (i.e.,
market capitalization in our context) evolves smoothly with respect to the distance to threshold,
the assignment and the outcome of the assignment can be viewed as exogenous for the firms lying
on the two sides nearest to the threshold. In other words, when we restrict firm i to those near the
threshold, firm i’s characteristic X is exogenous and not related to any unobserved characteristics
stemming from firm i, the corresponding peer firm j, or the common group Ω. If we define those
firms nearest to the threshold as Ф, then we can use the following model to examine the peer effect:
Peer Yj,t |(X∈Ф) = β0 + β1 Xi,t |(X∈Ф) + εj,t |(X∈Ф). (2)
Lee and Lemieux (2010) suggest that choosing a sufficiently narrow band Ф can satisfy the
assumption of a linear functional form. Within the narrow band, firms cannot precisely manipulate
inclusion into one index versus another and are therefore like-randomized above and below the
threshold. Then, due to the exogeneity of X (i.e., E(X|ε, X∈Ф) = 0) and the linear functional form,
the local linear estimator of Eq. (2) is unbiased. This approach is also known as an RDD.
Following prior studies (Lu 2013; Boone and White 2015), we use a bandwidth of [-100, +100]
wherein the threshold is defined by the position of the stock ranked 1000th within the Russell 1000
index by the RIC based on its float-adjusted market capitalization at the end of June each year.
Each year, we then take the 100 firms nearest to the threshold on both sides, i.e., the 100 smallest
firms from the Russell 1000 index and the 100 largest firms from the Russell 2000 index. Boone
and White (2015) document a significant discontinuity in institutional ownership around the
Russell 1000/2000 threshold arising from portfolio weighting. We verify this discontinuity by
plotting the institutional ownership of the Russell 1000 and 2000 index firms within the bandwidth

10
[-100, +100] on each side of the threshold. We measure institutional ownership by the proportion
of shares held by institutional investors over the total number of shares outstanding.7 Following
Bushee (1998, 2001) and Bushee and Noe (2000), we classify institutional investors into quasi-
indexers, transient institutional investors, and dedicated institutional investors based on their past
investment patterns in terms of portfolio turnover and diversification.8
In Figures 1(a) to 1(d), we plot total institutional ownership, quasi-indexer ownership,
transient institutional investor ownership, and dedicated institutional investor ownership,
respectively. Figure 1(a) shows that, near the threshold, the top Russell 2000 index firms lying on
the right side experience a significant jump in total institutional ownership compared to the bottom
Russell 1000 index firms lying on the left side, due to their significantly larger index weights.
Consistent with prior studies (e.g., Boone and White 2015), this discontinuity in total institutional
ownership around the threshold is primarily contributed by quasi-indexers. The comparison of
Figures 1(b) and 1(c) shows that quasi-indexer ownership experiences a much larger increase than
transient institutional investor ownership when firms shift from the Russell 1000 index to the
Russell 2000 index across the threshold. Figure 1(d) shows a slight decrease in dedicated
institutional investor ownership when firms move across the threshold from the left to the right.
Boone and White (2015) show that the significant increase in the quasi-indexer ownership of
the top Russell 2000 index firms leads to an increase in public information supplied by both
managers and analysts, resulting in an improved information environment. To verify their findings
with our sample, we plot the likelihood and frequency of managerial forecasts and analyst
7 The institutional holding data are obtained from Thomson’s CDA/Spectrum Database. 8 We are grateful to Professor Brian Bushee for providing data of the three types of institutional ownership. According to Bushee (2001), quasi-indexers use indexing or buy-and-hold strategies that are characterized by large and diversified holdings and low portfolio turnover. Transient institutional investors tend to hold highly diversified portfolios as well, but they trade frequently to realize short-term trading profits, resulting in high portfolio turnover. Dedicated institutional investors provide long-term and stable ownership to a small number of portfolio firms and they have less diversified portfolio holdings and lower portfolio turnover.
11
following of the Russell 1000/2000 index firms lying within the narrow band [-100, +100]. The
figures included in the Internet Appendix (Figure IA2) show a significant increase in management
forecasts and analyst following around the threshold, moving from the Russell 1000 index firms
on the left to the Russell 2000 index firms on the right, consistent with the results of Boone and
White (2015).
III. DATA, SAMPLE SELECTION, AND VARIABLE DEFINITIONS
Data and Sample Selection
Information about the Russell index firms comes from the RIC. We supplement these data with
accounting information from Compustat and stock price information from the Center for Research
in Security Prices (CRSP). We also obtain analyst forecast data from I/B/E/S, managerial forecast
data from the First Call Company Issued Guidance database and institutional holding data from
Thomson’s CDA/Spectrum Database. We follow Boone and White (2015) to set a sample period
of 1998 to 2006. The reason is that, from 2007, the RIC implemented a new policy that permits a
firm to stay in the previous index if its market value is within ±2.5 percent of the new 1000th firm’s
market capitalization. Therefore, the index assignment after 2006 is not entirely determined by
market capitalizations. Nevertheless, our results are robust when we include the period after 2006.
Our sample screening process consists of three steps as shown in Table 1. In the first step, as
described earlier, we choose a narrow bandwidth [-100, +100], as suggested by prior studies
(Boone and White 2015; Appel et al. 2016; Crane et al. 2016), to identify the treatment Russell
index firms and the control Russell index firms. Specifically, each year, we select 100 largest firms
from the Russell 2000 index (treatment Russell index firms) and 100 smallest firms from the
Russell 1000 index (control Russell index firms), providing a total of 1800 Russell index firms for

12
the period 1998 to 2006. Then, we remove a Russell index firm if (1) its Standard Industry
Identification Code (SIC) is missing from Compustat, (2) there are both control and treatment
Russell index firms in the same industry defined by the same four-digit SIC code, and (3) no
industry peer firms are identified based on the four-digit SIC code. This yields a sample of 519
Russell 2000 index firms (treatment Russell index firms), and 567 Russell 1000 Index firms
(control Russell index firms). In the second step, following Leary and Roberts (2014), we use the
four-digit SIC code to identify peers for each Russell index firm obtained from the first step (see
Appendix A).9 In this step, we require that the industry peers should not be one of the treatment or
control Russell index firms in a particular year. We further delete industry peers that have missing
data in calculating the control variables in our regression model. Eventually, we identify 12,740
treatment peer firms and 7,208 control peer firms. In the final step, we remove those Russell index
firms with no peers identified in the second step due to missing data and obtain 450 Russell 2000
index firms and 384 Russell 1000 index firms.
Since the assignment of Russell 1000 index firms and Russell 2000 index firms is viewed as
nearly random when the band (Ф) is sufficiently narrow, the industry distribution of these
treatment and control Russell index firms and that of their industry peers should be highly
dispersed. This is confirmed by the results of our industry analysis presented in the Internet
Appendix Table IA2.
Main Variables
We investigate whether the industry peers of the top Russell 2000 index firms are associated
with more managerial voluntary disclosures in the form of management forecasts in response to
9 Our four-digit SIC peer identification does not introduce additional uncertainty into the assignment of treatment and control firms. Thus, our strategy is considered as a sharp RDD (Hahn, Todd, and van der Klaauw 2001; Lee and Lemieux 2010).

13
the improved information environment of those top Russell 2000 index firms. We develop two
proxies for peer firms’ managerial forecasting behavior. First, the indicator variable Guidance is
equal to one if a firm provides any management forecast after the annual reconstitution of Russell
indexes during the period from July 1 this year to May 31 next year and zero otherwise. Second,
the measure of forecast frequency (Frequency) is defined as the number of annual or quarterly
forecasts during the period from July 1 this year to May 31 next year.
As discussed in the previous section, the corresponding industry peers of Russell 2000 index
firms lying within the narrow band (0, +100] are defined as treatment peer firms. We set an
indicator variable Treatment to be one in the year when the peer firms are classified as the
treatment peer firms. Accordingly, the corresponding industry peers of the Russell 1000 index
firms lying within the narrow band [-100, 0) are defined as control peer firms. In this case, the
indicator variable Treatment equals zero in that particular year.
Pre-Assignment Firm Characteristics
The assumption for a valid RDD is that the evolution of the assignment variable, that is, the
Russell firms’ market capitalization in our context, is smooth with respect to the distance to
threshold, which is consistent with local continuity and the inability of firms to precisely
manipulate the assignments. This is the case with the annual Russell 1000/2000 index
reconstitution (e.g., Boone and White 2015; Chen et al. 2016). Nevertheless, to further mitigate
concerns of index assignment manipulation, we examine the descriptive statistics and the local
continuity of a set of firm-level determinants documented by prior studies that affect corporate
voluntary disclosures for both Russell index firms and their peers (Ball, Jayaraman, and
Shivakumar 2012). These determinants include firm size, earnings volatility, return volatility,
analyst following, R&D activities, and the equity or debt issuance of both Russell index firms and

14
their industry peers. These firm-year level determinants are constructed based on accounting and
stock information prior to the index reconstitution at the end of June each year.10
Panels A and B of Table 2 present the summary statistics of the aforementioned determinants
for the Russell index firms lying within the bandwidth [-100, +100] and their industry peers,
respectively. Panel A shows that the treatment and control Russell index firms differ significantly
in size, return volatility, industry size, R&D expenditures, and debt and equity issuance. In Panel
B, it shows that the corresponding treatment and control peer firms differ significantly in earnings
volatility, analyst following, R&D expenditures, and equity and debt issuance. 11 However, as
pointed out by Lee and Lemieux (2010), the validity of an RDD is violated only by the
discontinuity of the pre-assignment determinants, around the threshold. In the Internet Appendix
Figure IA3, we plot the determinants that are shown in Table 2 to be significantly different between
the treatment and control groups, to check their local continuity around the threshold and find that
they do not exhibit significant discontinuities around the Russell 1000/2000 index threshold. This
result suggests that the observed discontinuous increase (decrease) in the managerial forecasts of
corresponding peer firms around the threshold, if any, is unlikely to be driven by the difference in
pre-assignment firm characteristics between the treatment and control Russell firms and their peers.
IV. EMPIRICAL RESULTS
Main Results
Figure 2 presents the RDD plots for the likelihood and frequency of management forecasts
issued by industry peers during the period from July through May following the June index
reconstitution within our chosen narrow band [-100, +100] around the Russell 1000/2000 threshold.
10 See Appendix B for details of the variable definitions. 11 The descriptive statistics in Panel B are reported for unique (non-duplicate) peer firm years.

15
Specifically, the x-axis represents the distance to threshold of the Russell index firms, whereas the
y-axis represents the likelihood (frequency) of issuing managerial forecasts by the corresponding
peer firms. In Figure 2(a), we observe a sharp jump in the likelihood of managerial forecast
issuance when shifting from the control peer firms (peer firms of the bottom Russell 1000 index
firms) on the left side of the threshold to the treatment peer firms (peer firms of the top Russell
2000 index firms) on the right side. There is no overlap in the 90 percent confidence intervals of
the treatment and control samples around the threshold. We find a similar pattern when using the
frequency of management forecasts as the y variable (Figure 2(b)). Given the nearly random
assignment of the firms into the two indexes around the threshold of Russell 1000/2000, the local
discontinuities in Figure 2 establish the causal effect of the discontinuously higher institutional
ownership of the top Russell 2000 index firms on increasing the probability and frequency of
management forecasts by their industry peers (i.e., the spillover effect of institutional ownership
on peer firms’ management forecast behavior).
We further estimate the treatment effect of index assignment using parametric estimation and
present the results in Table 3. Lee and Lemieux (2010) argue that including baseline covariates
can help establish the validity of the RDD and reduce sampling variability. Therefore, in addition
to baseline regressions, we also include in Eq. (2) the aforementioned pre-assignment
characteristics of the Russell index firms and peer firms to help further establish the validity of our
RDD. Note that we only control for firm characteristics in the pre-assignment period. Therefore,
we can avoid the problem of including causal channels through which the treatment effect
materializes.12 The empirical model is as follows:
12 We control for the pre-assignment characteristics to better identify the causal effect (Pearl 2009; Gow, Larcker, and Reiss 2016). The pre-assignment characteristics could be potential confounders, in the sense that they could be related to the possibility of a peer firm being treated or, in other words, being in the same industry with the top Russell 2000 index firms.

16
Management forecast j t = α + β0 Treatment j t + β1 Absrank i t + β2 Lsize_peer j t-1 + β4 Ret_vol_peer j t-1 + β5 N_analyst_peer j t-1 + β6 Rnd_peer j t-1 + β7 Issuance_peer j t-1 + β8 Lsize_ru i t-1 + β9 Earn_vol_ru i t-1 + β10 Ret_vol_ru i t-1 + β11 N_analyst_ru i t-1 + β12 Rnd_ru i t-1 + β13 Issuance_ru i t-1 + β14 Indsize i t-1 + Year + Industry + ε j t, (3)
where Management forecastj represents peer firm j’s forecast behavior, proxied by the likelihood
and frequency of issuing management forecasts. We include the variable Absrank, the absolute
distance to the Russell 1000 exclusion/inclusion threshold, to capture the effect of the distance to
threshold. We also include industry and year fixed effects.
In columns (1) to (3) of Table 3, we use logit regressions in which the dependent variables are
the indicator variable Guidance. In column (1), we do not control for any pre-assignment
determinant. The coefficient on Treatment is significantly positive (0.326, z = 5.33), suggesting
that the industry peers of the top Russell 2000 firms are more likely to issue management forecasts
than those of the bottom Russell 1000 firms. 13 We further control for the pre-assignment
characteristics of the peer firms in column (2) and still find a significantly positive coefficient on
Treatment (0.347, z = 5.12). In column (3), we add the Russell firms’ pre-assignment
characteristics as additional controls and still find the coefficient on Treatment to be positive and
significant (0.304, z = 4.45). More importantly, we find that the coefficients on Treatment do not
change significantly between columns (1), (2) and (3), which supports our RDD validity and
suggests that the pre-assignment firm characteristics are not likely to confound the treatment effect.
For economic significance, the result in column (3) suggests that firms are 5.62 percent more likely
to make management forecasts if they are industry peers of the top Russell 2000 firms.
In columns (4) to (6) of Table 3, we use a discrete variable Frequency as the dependent variable
and use Poisson regressions. The results are qualitatively similar (0.127, z = 2.48 in column (4);
13 The estimation of a logit model drops observations due to the controlling of industry fixed effect.

17
0.126, z = 3.05 in column (5); 0.111, z = 2.62 in column (6)), revealing that the industry peers of
the top Russell 2000 firms issue management forecasts more frequently. We again find that the
differences in the coefficients on Treatment are not statistically significant between columns (4),
(5) and (6). In terms of economic significance, the results in column (6) suggest that the industry
peers of the top Russell 2000 firms have a 7.44 percent higher management forecast frequency
than those of the bottom Russell 1000 firms.14
Boone and White (2015) find that the increase in the management forecasts of firms in the top
of the Russell 2000 index is mainly driven by an increase in the demand for public disclosures
from quasi-indexers. Quasi-indexers have limited ability to trade on private information and rely
on public disclosures to reduce their monitoring costs. Other studies also show that quasi-indexers
are not passive owners and, instead, exert a strong influence on corporate policies in governance,
tax planning, and dividend payout (Appel et al. 2016; Bird and Karolyi 2016; Chen et al. 2016;
Crane et al. 2016; Khan et al. 2016). A recent article in The Wall Street Journal reports that index
fund managers such as Vanguard, BlackRock, and State Street often cast deciding shareholder
votes on issues such as mergers and leadership changes (Krouse, Benoit, and McGinty 2016).
Along the same line, we further separate total institutional ownership into quasi-indexer
ownership, transient institutional investor ownership, and dedicated institutional investor
ownership and replace the variable Treatment in Eq. (3) by the three types of institutional
ownership. The estimated results reported in Table 4 show that the quasi-indexer ownership can
significantly explain peer firms’ management forecast behavior in terms of both forecast likelihood
and frequency, while transient institutional investor ownership can only explain management
14 In additional analyses, we also examine the precision, horizons, and accuracy of the management forecasts of the industry peers of the top Russell 2000 index firms. We only find some evidence that the high institutional ownership of Russell 2000 index firms significantly affects peer firms’ forecast accuracy. The discussions and results of the analyses are included in the Internet Appendix, Section IA4.

18
forecast likelihood. For dedicated institutional investors, their ownership is not significant in
explaining either peer firms’ management forecast likelihood or frequency. This result can be
partially due to the small variation in dedicated institutional investor ownership across the
threshold between the Russell 2000 and 1000 indexes, as indicated in Figure 1(d), or dedicated
institutional investors’ lower demand for public disclosures.15
Together with the non-parametric results in Figure 2, the results reported in Tables 3 and 4
suggest that the higher institutional ownership, particularly quasi-indexer ownership of the top
Russell 2000 index firms, and the resultant improvement of their information environment drive
their industry peers to make more voluntary disclosures in the form of management forecasts. We
causally attribute such findings to peer effects, because the discontinuity of institutional ownership
around the Russell 1000/2000 threshold is plausibly exogenous and does not affect industry peers.
An Instrumental Variable Approach
We supplement the RDD analyses using an instrumental variable (IV) approach to address the
concern that firms may self-select into treatment or that unobservable firm factors lead to the
outcomes of index assignment (Hahn et al. 2001). Further, the float adjustment employed by the
RIC results in some firms receiving a different portfolio weighting than predicted based on their
market capitalization, which could violate the local continuity assumption around the Russell
1000/2000 threshold. Following Boone and White (2015), Appel et al. (2016) and Crane et al.
(2016), we employ Russell 2000 membership as an instrument of quasi-indexer ownership. As
discussed in Section II, the index assignment mechanically affects quasi-indexer ownership but is
unlikely to have a direct effect on the management disclosure of peer firms. In this respect, it meets
the relevance and exclusion requirements of a valid IV. In the first step, we regress quasi-indexer
15 Boone and White (2015) argue that dedicated institutional investors can profit based on private information and may therefore prefer more opaque information environments that enable them to retain their informational advantages.

19
institutional ownership on the indicator of the top Russell 2000 index firms within the bandwidth
[-100, +100] around the threshold, based on the following specification:
Io_quasi = α0 + α1Treatment + α2 Ln(Float) + Σ αγcontrols + Year + Industry + ε, (4)
where Io_quasi is the corresponding Russell index firm’s percentage of shares held by quasi-
indexers at the end of the quarter following the index reconstitution, for each peer firm in the same
industry. Ln(Float) is the natural logarithm of the float-adjusted market capitalization at the end
of June (provided by RIC), which is used to control for the RIC’s float adjustment. The other
control variables are the same as in Eq. (3). The estimated results of Eq. (4) reported in column (1)
of Table 5 show that the coefficient on the IV (Treatment) is positive and significant. Consistent
with Figure 1(b), such result suggests that the inclusion in Russell 2000 index near the threshold
(Treatment) causally increases quasi-indexer ownership.
In the second step, we regress peer firms’ management forecast behaviors on the instrumented
quasi-indexer ownership of the corresponding Russell index firms (𝐼𝐼𝐼𝐼_𝑞𝑞𝑞𝑞𝑞𝑞𝑞𝑞𝑞𝑞� ), as follows:
Management forecast = α0 + α1𝐼𝐼𝐼𝐼_𝑞𝑞𝑞𝑞𝑞𝑞𝑞𝑞𝑞𝑞� + α2Ln(Float) + Σ αγcontrols + Year + Industry + ε, (5)
where 𝐼𝐼𝐼𝐼_𝑞𝑞𝑞𝑞𝑞𝑞𝑞𝑞𝑞𝑞� is the fitted value of Io_quasi from estimating Eq. (4) in the first step. We include
Ln(Float) and the other control variables as in Eq. (4). The results reported in columns (2) and (3)
of Table 5 show that both the likelihood and frequency of peer firms’ management forecasts
increase with the instrumented quasi-indexer ownership (0.483, t = 2.26 in column (2); 0.700, t =
2.02 in column (3)). We repeat the analyses in Table 5 using total institutional ownership. The
untabulated results are qualitatively similar. Overall, the results of the IV approach confirm those
of the RDD analyses, that the industry peers of firms in the top of the Russell 2000 index are more
likely to issue management forecasts and issue management forecasts more frequently.
Other Robustness Tests

20
We conduct multiple sensitivity analyses to further ensure the robustness of our inferences.
First, we include higher-order polynomials (i.e., first- to third-order polynomials) of the distance
to threshold to allow for nonlinearity in our functional form and the results reported in Panel A of
Table 6 show that the coefficients on Treatment are still positive and significant for both the
forecast likelihood and frequency. Second, we follow the literature on RDD and repeat our main
tests using alternative bandwidths of [-50, +50] and [-150, +150] (Lee and Lemieux 2010; Boone
and White 2015). We find that the coefficients on Treatment are still positive and significant for
both forecast likelihood and frequency (Panel B, Table 6). Third, in our main tests, we allow a peer
firm to be counted multiple times if it is associated with more than one Russell index firm lying
within the selected narrow band. For example, if firm A is the industry peer of a treatment Russell
index firm C and another treatment Russell index firm D, then we will count firm A twice in our
regression model because we view each Russell index firm–peer firm pair as a unique relationship.
Since one peer firm can be counted multiple times, we use within-firm clustering to address the
underestimation in standard errors (i.e., overestimation in z) in our main tests. To check the
robustness of our results, we count each peer firm only once and estimate Eq. (3) using this non-
duplicate sample. The results in Panel C of Table 6 are consistent with our main results reported
in Table 3. Fourth, we employ a propensity score matching (PSM) procedure to create a matched
sample to eliminate the differences between the treatment and control peer firms’ characteristics.
Specifically, we use the peer firms’ pre-assignment characteristics controlled in Eq. (3) to predict
the probability of being the top Russell 2000 firms’ industry peers (Treatment = 1). We then match
each treatment peer firm with the control peer firm with the closest propensity score. Our results
still hold for the matched sample (Panel D, Table 6). Fifth, we conduct falsification tests by setting
two pseudo thresholds at the 500th or the 1,500th largest firm, respectively, based on the firm’s

21
float-adjusted market capitalization (i.e., index weights) at the end of June. As shown in Panel E
of Table 6, all coefficients on Treatment are insignificant for the treatment and control samples
constructed based on these two pseudo thresholds.
Lastly, we include additional controls to ensure the robustness of our main results. First, we
control for firm fixed effects and the results still hold. Second, we control for the average
institutional ownership of the peer firms’ industry and the peer firms’ own institutional ownership
and find similar results. The results confirm that the increase in quasi-indexer ownership caused
by index assignment is exogenous to common industry characteristics and peer firms’ own
characteristics, providing further support for using this setting to examine peer effects. However,
we conjecture that when institutional ownership in the peer firms’ industry is already quite high,
further increases in institutional ownership within the industry might not drive the peer firms to
further increase their management forecasts. To test this conjecture, we partition our sample based
on the average institutional ownership of peer firms in the same industry. We find a significant
treatment effect only for the group of peer firms in the industries with an average level of
institutional ownership below the median. We also partition the sample based on the peer firms’
own institutional ownership and find similar results. We do not tabulate these results for brevity.
Changes Regressions
In this section, we first conduct changes analyses to examine the association between changes
in the treatment variable and changes of peer firms’ management forecast behavior. The estimated
results of the changes regressions reported in columns (1) and (2) of Table 7 show positive and
significant coefficients on ∆Treatment for both management forecast likelihood and frequency.
Next, we separately examine the effect of an increase versus a decrease in the treatment
variable on peer firms’ management forecast behavior. Prior studies show that the issuance of

22
management forecast is a sticky disclosure behavior, especially when it comes to the cessation of
management forecasts (Houston, Lev, and Tucker 2010; Chen, Matsumoto, and Rajgopal 2011).
The cessation of management forecasts is usually associated with a decrease in analyst coverage,
increases in analyst forecast errors and dispersions, and deteriorating stock return performance,
and thus is costly. In contrast, managers initiate or increase management forecasts to alleviate
information asymmetry (Balakrishnan et al. 2014) and cater to institutional investors’ demand for
transparency (Boone and White 2015). Therefore, we expect that it is more likely to observe peer
firms to increase their management forecasts when they switch from the peers of the Russell 1000
control firms to the peers of the Russell 2000 treatment firms (the treatment indicator changes from
zero to one). However, we are less likely to observe peer firms to decrease their management
forecasts when they switch from the peers of Russell 2000 treatment firms to the peers of Russell
1000 control firms (the treatment indicator changes from one to zero). To test this conjecture, we
define two indicators: Switch to Ru2000 and Switch to Ru1000, where Switch to Ru2000 takes a
value of one if ∆Treatment is positive and zero otherwise and Switch to Ru1000 takes a value of
one if ∆Treatment is negative and zero otherwise. We replace ∆Treatment with these two
indicators in the changes regressions and report the estimated results in columns (3) and (4) of
Table 7. The results show that the coefficients on Switch to Ru2000 are positive and significant in
both columns (3) and (4), suggesting that for peer firms with the treatment indicator changing from
zero to one, both the likelihood and frequency of their management forecasts are significantly
increased. Although their sign is negative, the coefficients on Switch to Ru1000 are not significant
at any conventional level, suggesting that when the peer firms are no longer treated within the next
year, their management forecast behavior is not significantly changed. This finding suggests that
management forecast behavior is stickier in the downward direction.

23
Given the stickiness of the managers’ forecasting behavior, we expect that within a short
period, if a firm’s industry peers are treated for multiple times, the first-time/initial treatment
results in a lasting change in forecasting behavior and the subsequent treatments may impose only
a limited effect. We follow Roberts and Sufi (2009) to compare the effect of first-time treatments
and subsequent treatments within a four year window.16 In particular, we define two separate
treatment indicators: New Treatment and Subsequent Treatment. The variable New Treatment
equals one if a firm is the industry peer of a Russell 2000 index treatment firm in the current year,
but not in any of the past three years, and zero otherwise. Subsequent Treatment equals one if a
firm has been the industry peer of a Russell 2000 index treatment firm in any of the past three
years and the current year, and zero otherwise. We then estimate the changes regressions by
replacing ∆Treatment with New Treatment and Subsequent Treatment. By so doing, we separate
the effect of initial versus subsequent treatments on the change in management forecast behavior.
The estimated results reported in columns (5) and (6) of Table 7 show that the coefficient on New
Treatment is positive and significant, but that on Subsequent Treatment is insignificant. This
finding supports the notion that the initial treatment can result in a lasting change in forecasting
behavior given the stickiness of the managers’ forecasting behavior. In contrast, the subsequent
treatment does not impose a significant effect on firms’ forecasting behaviors, suggesting a
decreasing marginal treatment effect. 17
Possible Channels
Competing for Capital
16 Roberts and Sufi (2009) examine the effect of debt covenant violation on firms’ net debt issuance and show that only new/initial covenant violations have a significant effect on reducing net debt issuance. 17 The difference between the coefficients on initial and subsequent treatment appears to be large economically, but it is statistically insignificant. Thus, we caution against a strong interpretation of these results.

24
In this section, we examine whether the peer pressure of improving a firm’s information
environment is driven by the firm’s incentive to compete for capital. Boone and White (2015)
show that stock liquidity increases for firms in the top of the Russell 2000 index due to the increase
in their institutional ownership and public disclosures. Since improvement in stock liquidity can
lead to lower costs of capital, this creates pressure on rivals to improve their own information
environment to compete for cheaper capital. This conjecture is supported by the oligopoly theory
that the marginal returns to increasing one’s strategy rise with increases in the competitors’
strategy (e.g., Bryant 1983; Diamond 1985; Milgrom and Roberts 1990).
To test whether the increase in the Russell 2000 firms’ stock liquidity causes their competitors
(peers) to respond, we examine the change in treatment effect after controlling for Russell firms’
stock liquidity in Eq. (3). Following prior literature, we use two illiquidity measures and one
liquidity measure: the bid–ask spread (Spread_ru) calculated as the closing ask price less the
closing bid price divided by the midpoint of the closing ask and bid prices, Amihud’s (2002)
measure of the price impact calculated as the logarithm of the average ratio of the absolute return
to the dollar volume of trading (Amihud_ru), and dollar trading volumes measured as the logarithm
of the average daily trading volume multiplied by the closing price (Dollarvol_ru) (Balakrishnan
et al. 2014). All three measures are calculated based on trading information during the period
following annual index reconstitution. Consistent with our conjecture, the estimated results
reported in Table 8 show that Russell firms’ stock liquidity is significantly associated with peer
firms’ management forecasts. More importantly, Russell firms’ stock liquidity significantly
absorbs the treatment effect on the frequency of management forecasts (Frequency). The
coefficients on Treatment are no longer significant in columns (6) to (8) after controlling for
Russell firms’ liquidity. In column (8), the inclusion of Russell firms’ liquidity reduces the
25
magnitude of the coefficient on Treatment by almost half, from 0.111 to 0.058. The corresponding
economic impact of Treatment on Frequency decreases from 7.44 percent to 3.94 percent,
representing a 47 percent reduction. As for the probability of management forecast issuance
(Guidance), the marginal effect of Treatment on Guidance decreases from 5.62 percent to 4.34
percent (i.e., the coefficient changes from 0.304 to 0.234) based on column (4), representing a 23
percent reduction. Overall, the results reported in Table 8 suggest that competing for capital can
be an important channel through which peer influence is exerted.
To provide further support for the capital competition channel, we next explore cross-sectional
variations in peer firms’ management forecasting behaviors conditional on their financing needs.
We first use the dependence of external financing (RZ ratio) articulated by Rajan and Zingales
(1998) to proxy for the incentives for peer firms to compete for capital. The variable RZ ratio is
the industry median of firms’ intrinsic demand for external financing for capital investment,
measured as the ratio of total capital expenditures plus research and development expense in excess
of cash flows over the sum of total capital expenditures and research and development expense.
We separate the full sample into two subsamples based on RZ ratio of peer firms and re-estimate
Eq. (3) using each subsample, respectively. In Panel A, Table 9, we observe a stronger peer effect
of increasing both the likelihood and frequency of management forecast issuance when the
treatment peer firms have a higher degree of external financing dependency as measured by the
RZ ratio (0.183, z = 2.29 vs. 0.891, z = 4.83 in columns (1) and (2); 0.003, z = 0.06 vs. 0.427, z =
3.63 in columns (3) and (4)). Seemingly unrelated estimation (SUE) tests show that the differences
between the coefficients for the two subsamples are statistically significant.
Given that higher growth opportunities would further increase demand for capital, one expects
that treatment peer firms with high growth opportunities have stronger incentives to provide

26
management forecasts to compete for capital. Therefore, we also stratify the full sample into two
subsamples based on the market-to-book ratio of industry peers, which we use as a proxy for
growth opportunities. Then, we re-estimate Eq. (3) using each subsample and report the estimated
results in Panel B, Table 9. Consistent with our prediction, the high institutional ownership of the
Russell 2000 index firms has a more significant spillover effect in driving their corresponding peer
firms with higher growth opportunities (i.e., higher market-to-book ratios) to issue management
forecasts (0.196, z = 2.45 vs. 0.503, z = 3.44 in columns (1) and (2); 0.057, z = 1.12 vs. 0.227, z =
2.72 in columns (3) and (4)). The differences in the coefficients are also statistically significant.
Alternative Channels: Herding Effect and Common Institutional Ownership
We argue that peer firms respond to the improved information environment of the top Russell
2000 index firms in the same industry due to their incentive to compete for capital. Peer pressure
could also be exerted through other channels. One possible channel could be the herding effect.
The sociology, psychology and economic literature has long observed that people tend to converge
toward similar behaviors or mimic each other’s behaviors (Asch 1952; Merton 1957; Granovetter
1978; Diamond and Dybvig 1983; Scharfstein and Stein 1990; Banerjee 1992; Rajan 1994;
Trueman 1994; Hong, Kubik, and Solomon 2000; Hirshleifer and Teoh 2003; Sias 2004). When
the top Russell 2000 index firms increase voluntary disclosures to accommodate the demands of
institutional investors for information transparency, managers of peer firms may have to mimic or
converge to this behavior. The herding effect and incentives to compete for capital need not be
mutually exclusive. Mimicking peers’ forecasting behaviors can also lead to enhanced access to
capital, due to improved information transparency. Our test here merely seeks to show whether the
herding effect can explain away the treatment effect on peer firms’ management forecasts.

27
To this end, we control for the frequency of the Russell index firms’ management forecasts
(Frequency_ru) in Eq. (3) following annual index reconstitution and report the estimated results
in columns (2) and (5) of Table 10. It shows that the management forecasting behaviors of Russell
index firms affect the forecasting behaviors of their industry peers. This is consistent with the
notion that herding effect is one possible channel (e.g., Seo 2017). However, including the
management forecasting behaviors of Russell index firms does not significantly change the
magnitude of the treatment effect. For example, the marginal effect of Treatment on the probability
of providing management forecasts decreases only from 5.62 percent to 5.18 percent (i.e., the
coefficient changes from 0.304 to 0.279) based on column (2). This result suggests that herding is
unlikely to be the primary reason why the treatment peer firms (peer firms of the top Russell 2000
index firms) increase their management forecasts.
The peer effect can also be disseminated through common institutional ownership. Cross-
holding investors can serve as conduits between peer firms to spread corporate disclosure policies
(Massa and Zaldokas 2017). Jung (2013) finds that a firm’s decision to follow a first mover in
providing more quantitative disclosures is positively associated with an increase in cross-holdings.
In this respect, we expect peer pressure to be reinforced by common institutional ownership. Since
the increase in institutional ownership of the top Russell 2000 index firms could result in an
increase in cross-holding behavior, it could also lead to an increase in the corresponding peer firms’
management disclosures. We follow Jung (2013) to construct a common ownership variable
(Common holding) based on quasi-indexer holdings. The results reported in columns (3) and (6)
of Table 10 show that common ownership is positively associated with the management forecasts
of peer firms, which is consistent with Jung (2013). However, we find that the economic magnitude

28
of the treatment effect is not reduced by common ownership. In this regard, common ownership is
unlikely to be the first-order factor that drives the peer effect.
One caveat is that the potential mechanisms could be multiple, given the complex nature of
peer effects (Manski 1993). In this regard, we do not claim to have fully explored or provided
convincing evidence to support or rule out these mechanisms. Nevertheless, our empirical results
appear to suggest that competing for capital can be an important force leading to the increase in
the management forecasts of peer firms.
Other Disclosures
We mainly focus on management forecasts as a strategic action taken by managers to improve
firms’ information environment. However, whether overall information environment improves
with increase in management forecasts depends on whether different types of accounting
information are complements or substitutes. If the increase in management forecasts substitutes
for other accounting information, the net effect on the overall information environment will be
uncertain. Prior studies mostly support a complementary relationship between different types of
accounting information (Beyer et al. 2010). For example, Ball et al. (2012) show that audited
financial reports and voluntary disclosure are complements.18 Specifically, the authors show that
the quality of mandatory reporting lends credibility to voluntary disclosure and, as a result,
increases investors’ demand for voluntary disclosures. Boone and White (2015) show an increase
in both management forecasts and voluntary 8-K filings for firms in the top of the Russell 2000
index following annual index reconstitution. To shed more light on the peer firms’ efforts to
improve their information environment, in this section, we examine the peer firms’ earnings
quality and other voluntary news from management. The results reported in Table 11 show that
18 Many other studies argue for and show a complementary relation between voluntary and mandatory disclosures (e.g., McNichols and Trueman 1994; Gigler and Hemmer 1998; Stocken 2000).
29
both earnings quality measured by performance-matched discretionary accruals (Kothari, Leone,
and Wasley 2005) and the amount of other voluntary management disclosures increase for peers
firms in the same industry with the top Russell 2000 firms.19 The increase in earnings quality can
lend credibility to the management forecasts issued by peer firms, enhancing the effectiveness of
management forecasts as a strategy to improve the information environment.
We must admit that outsiders demand accounting information for different reasons.
Information demanded for valuation purposes is likely to differ from that demanded for evaluating
managerial stewardship. The former requires information about firm value, which is a combined
effect of management effort and luck, while the latter requires information that allows investors to
evaluate managers’ efforts only (e.g., Gjesdal 1981; Beyer et al. 2010). Therefore, managers may
act strategically in making their disclosure choices and do not always intend to make more
disclosures. Even if we restrict our attention to information related to raising capital, information
intended by equity investors may not be useful to creditors (Sharpe 1990; Boot 2000). Furthermore,
disclosure can reduce welfare if it destroys risk-sharing opportunities (Beyer et al. 2010). However,
generally, prior studies have provided ample evidence that corporate disclosures reduce
information asymmetries and, in turn, increase a firm’s stock liquidity (e.g., Diamond and
Verrecchia 1991; Kim and Verrecchia 1994; Easley and O’Hara 2004). We thus argue that the
industry peers of the top Russell 2000 index firms increase their management forecasts or other
disclosure to improve their information environment and stock liquidity as a response to the
improved information environment of those top Russell 2000 index firms. 20
19 We follow Edmans, Goncalves-Pinto, Wang, and Xu (2014) to measure the amount of other voluntary news using data from the Capital IQ Key Developments database. 20 It is worth mentioning that disclosure also has proprietary cost. Disclosure can harm a disclosing firm if its competitors on the product market make strategic use of the information to their advantage (Darrough 1993). When firms increase their disclosures as a response to peer pressure, it may not necessarily improve overall welfare on the product market. Darrough (1993) shows that whether firms benefit by hiding or sharing information depends on the nature of competition and private information. Thus, we only focus on the implication of peer induced disclosure on

30
V. CONCLUSION
In this study, we use the discontinuity in the institutional ownership of firms around the
Russell 1000/2000 threshold as a quasi-random experiment to identify peer influence on firms’
voluntary disclosures. We argue that, since the discontinuously higher institutional ownership
results in a better information environment for those top Russell 2000 index firms, it creates
pressure on peer firms in the same industry to take actions to improve their own information
environment. We focus on voluntary management disclosures in the form of management forecasts
as an effective strategic move that peer firms can make to improve their information environment.
We find robust results, where the discontinuously higher institutional ownership of the top Russell
2000 index firms near the threshold leads to a significant increase in the likelihood and frequency
of management forecast issuance by their peer firms in the same industry. Further analyses show
that the incentive for peer firms to compete for capital can at least partially explain the increase in
their management forecasts.
Our findings have important implications for the presence of externalities in corporate
practices and policies. Through peer influence, the effect of beneficial or harmful practices can be
augmented in the economy. Therefore, when regulators and policy makers consider the potential
benefits and costs of new regulations, they should not ignore interactions among firms and how
common corporate practices spread through the economy.
a firm’s information and trading environments. The product market implication of such peer induced disclosure is beyond the scope of this study and may be explored by future studies.

31
References Amihud, Y. 2002. Illiquidity and stock returns: Cross-section and time-series effects. Journal of
Financial Markets 5 (1): 31–56. Ajinkya, B., S. Bhojraj, and P. Sengupta. 2005. The association between outside directors,
institutional investors and the properties of management earnings forecasts. Journal of Accounting Research 43(3): 343-376.
Appel, I. R., T. A. Gormley, and D. B. Keim. 2016. Passive investors, not passive owners. Journal of Financial Economics 121(1): 111-141.
Arya, A., and B. Mittendorf. 2007. The interaction among disclosure, competition between firms, and analyst following. Journal of Accounting and Economics 43(2): 321-339.
Asquith, P., M. B. Mikhail, and A. S. Au. 2005. Information content of equity analyst reports. Journal of Financial Economics 75(2): 245-282.
Baginski, S. P. 1987. Intraindustry information transfers associated with management forecasts of earnings. Journal of Accounting Research 25(2): 196-216.
Balakrishnan, K., M. B. Billings, B. Kelly, and A. Ljungqvist. 2014. Shaping liquidity: On the causal effects of voluntary disclosure. Journal of Finance 69(5): 2237-2278.
Ball, R., S. Jayaraman, and L. Shivakumar. 2012. Audited financial reporting and voluntary disclosure as complements: A test of the confirmation hypothesis. Journal of Accounting and Economics 53(1): 136-166.
Banerjee, A. V. 1992. A simple model of herd behavior. Quarterly Journal of Economics 107(3): 797-817.
Beatty, A., S. Liao, and J. J. Yu. 2013. The spillover effect of fraudulent financial reporting on peer firms’ investments. Journal of Accounting and Economics 55(2): 183-205.
Beyer, A., D. A. Cohen, T. Z. Lys, and B. R. Walther. 2010. The financial reporting environment: Review of the recent literature. Journal of Accounting and Economics 50(2): 296-343.
Bikhchandani, S., D. Hirshleifer, and I. Welch. 1992. A theory of fads, fashion, custom, and cultural change as informational cascades. Journal of Political Economy 100(5): 992-1026.
Bird, A., and S. A. Karolyi. 2016. Governance and taxes: Evidence from regression discontinuity. The Accounting Review (Forthcoming).
Bizjak, J. M., M. L. Lemmon, and L. Naveen. 2008. Does the use of peer groups contribute to higher pay and less efficient compensation? Journal of Financial Economics 90(2): 152-168.
Boone, A. L., and J. T. White. 2015. The effect of institutional ownership on firm transparency and information production. Journal of Financial Economics 117(3): 508-533.
Boot, A. W. 2000. Relationship banking: What do we know? Journal of Financial Intermediation 9(1): 7-25.
Bryant, J. 1983. A simple rational expectations Keynes-type model. Quarterly Journal of Economics 98(3): 525-528.
Bushee, B. J. 1998. The influence of institutional investors on myopic R&D investment behavior. Accounting review 73(3): 305-333.
Bushee, B., and C. F. Noe. 2000. Corporate disclosure practices, institutional investors, and stock return volatility. Journal of Accounting Research 38: 171-202.
Bushee, B. J. 2001. Do institutional investors prefer near‐term earnings over long‐run value? Contemporary Accounting Research 18(2): 207-246.
Bushman, R. M., J. D. Piotroski, and A. J. Smith. 2004. What determines corporate transparency? Journal of Accounting Research 42(2): 207-252.

32
Chang, Y., H. Hong, and I. Liskovich. 2015. Regression discontinuity and the price effects of stock market indexing. Review of Financial Studies 28(1): 212–246.
Chen, S., Y. Huang, N. Li, and T. J. Shevlin. 2016. Quasi-indexer ownership and corporate tax-planning. Working Paper. University of Texas at Austin.
Chen, S., D. Matsumoto, and S. Rajgopal. 2011. Is silence golden? An empirical analysis of firms that stop giving quarterly earnings guidance. Journal of Accounting and Economics 51(1): 134-150.
Chung, K. H., and H. Jo. 1996. The impact of security analysts’ monitoring and marketing functions on the market value of firms. Journal of Financial and Quantitative Analysis 31(4): 493-512.
Cornett, M. M., A. J. Marcus, and H. Tehranian. 2008. Corporate governance and pay-for-performance: The impact of earnings management. Journal of financial economics 87(2): 357-373.
Crane, A. D., S. Michenaud, and J. P. Weston. 2016. The effect of institutional ownership on payout policy: Evidence from index thresholds. Review of Financial Studies 29(6): 1377-1408.
Darrough, M. N. 1993. Disclosure policy and competition: Cournot vs. Bertrand. Accounting review 68: 534-561.
Diamond, D. W. 1985. Optimal release of information by firms. The Journal of Finance 40(4): 1071-1094.
Diamond, D. W., and P. H. Dybvig. 1983. Bank runs, deposit insurance, and liquidity. Journal of Political Economy 91(3): 401-419.
Diamond, D. W., and R. E. Verrecchia. 1991. Disclosure, liquidity, and the cost of capital. Journal of Finance 46(4): 1325-1359.
Easley, D., and M. O’Hara. 2004. Information and the cost of capital. Journal of Finance 59(4): 1553-1583.
Edmans, A., L. Goncalves-Pinto, Y. Wang, and M. Xu. 2014. Strategic news releases in equity vesting months. National Bureau of Economic Research.
Feng, M., C. Li, and S. McVay. 2009. Internal control and management guidance. Journal of Accounting and Economics 48(2): 190-209.
Fichtner, J., E. M. Heemskerk, and J. Garcia-Bernardo. 2016. Hidden power of the Big Three? Passive index funds, re-concentration of corporate ownership, and new financial risk. Business and Politics (2017): 1-29.
Fidelity Investments. 2014. Corporate governance and proxy guidelines. Available at: http://personal.fidelity.com/myfidelity/InsideFidelity/InvestExpertise/governance.shtml. (last accessed September 7, 2014).
Foster, G. 1981. Intra-industry information transfers associated with earnings releases. Journal of accounting and economics 3(3): 201-232.
Francis, J., R. LaFond, P. Olsson, and K. Schipper. 2005. The market pricing of accruals quality. Journal of Accounting and Economics 39(2): 295-327.
Francis, J. R., I. K. Khurana, and R. Pereira. 2005. Disclosure incentives and effects on cost of capital around the world. The Accounting Review 80(4): 1125-1162.
Gigler, F., and T. Hemmer. 1998. On the frequency, quality, and informational role of mandatory financial reports. Journal of Accounting Research 36: 117-147.
Giroud, X., and H. M. Mueller. 2011. Corporate governance, product market competition, and equity prices. Journal of Finance 66(2): 563-600.

33
Gjesdal, F. 1981. Accounting for stewardship. Journal of Accounting Research 19(1): 208-231. Gleason, C. A., N. T. Jenkins, and W. B. Johnson. 2008. The contagion effects of accounting
restatements. The Accounting Review 83(1): 83-110. Gow, I. D., D. F. Larcker, and P. C. Reiss. 2016. Causal inference in accounting research. Journal
of Accounting Research 54(2): 477-523. Graham, J. R., C. R. Harvey, and S. Rajgopal. 2005. The economic implications of corporate
financial reporting. Journal of Accounting and Economics 40(1): 3-73. Granovetter, M. 1978. Threshold models of collective behavior. American Journal of Sociology:
1420-1443. Hahn, J., P. Todd, and W. Van der Klaauw. 2001. Identification and estimation of treatment effects
with a regression‐discontinuity design. Econometrica 69(1): 201-209. Han, J. C., J. J. Wild, and K. Ramesh. 1989. Managers’ earnings forecasts and intra-industry
information transfers. Journal of Accounting and Economics 11(1): 3-33. He, J., and J. Huang. 2014. Product market competition in a world of cross ownership: evidence
from institutional blockholdings. Working Paper. University of Georgia. Healy, P. M., A. P. Hutton, and K. G. Palepu. 1999. Stock performance and intermediation changes
surrounding sustained increases in disclosure. Contemporary Accounting Research 16(3): 485-520.
Healy, P. M., and K. G. Palepu. 2001. Information asymmetry, corporate disclosure, and the capital markets: A review of the empirical disclosure literature. Journal of Accounting and Economics 31(1): 405-440.
Hirshleifer, D., and S. Hong Teoh. 2003. Herd behaviour and cascading in capital markets: A review and synthesis. European Financial Management 9(1): 25-66.
Hirst, D. E., L. Koonce, and S. Venkataraman. 2008. Management earnings forecasts: A review and framework. Accounting Horizons 22(3): 315-338.
Hong, H., J. D. Kubik, and A. Solomon. 2000. Security analysts’ career concerns and herding of earnings forecasts. Rand Journal of Economics 31(1): 121-144.
Houston, J. F., B. Lev, and J. W. Tucker. 2010. To guide or not to guide? Causes and consequences of stopping quarterly earnings guidance. Contemporary Accounting Research 27(1): 143-185.
Jiambalvo, J., S. Rajgopal, and M. Venkatachalam. 2002. Institutional ownership and the extent to which stock prices reflect future earnings. Contemporary Accounting Research 19(1): 117-145.
Jung, M. J. 2013. Investor overlap and diffusion of disclosure practices. Review of Accounting Studies 18: 167-206.
Khan, M., S. Srinivasan, and L. Tan. 2016. Institutional ownership and corporate tax avoidance: New evidence. The Accounting Review 92(2):101-122.
Kim, O., and R. E. Verrecchia. 1994. Market liquidity and volume around earnings announcements. Journal of Accounting and Economics 17(1-2): 41-67.
Kothari, S. P., X. Li, and J. E. Short. 2009. The effect of disclosures by management, analysts, and business press on cost of capital, return volatility, and analyst forecasts: A study using content analysis. The Accounting Review 84(5): 1639-1670.
Kothari, S. P., A. J. Leone, and C. E. Wasley. 2005. Performance matched discretionary accrual measures. Journal of Accounting and Economics 39(1), 163-197.
Krouse, S., D. Benoit, and T. McGinty. 2016. Meet the new corporate power brokers: passive investors. The Wall Street Journal (October 24).

34
Lang, M. H., and R. J. Lundholm. 1996. Corporate disclosure policy and analyst behavior. The Accounting Review 71(4): 467-492.
Lang, M. H., and R. J. Lundholm. 2000. Voluntary disclosure and equity offerings: reducing information asymmetry or hyping the stock? Contemporary Accounting Research 17(4): 623–663.
Laschever, R. A. 2013. Keeping up with CEO Jones: Benchmarking and executive compensation. Journal of Economic Behavior and Organization 93: 78-100.
Leary, M. T., and M. R. Roberts. 2014. Do peer firms affect corporate financial policy? Journal of Finance 69(1): 139-178.
Lee, D. S., and T. Lemieux. 2010. Regression discontinuity designs in economics. Journal of Economic Literature 48(2): 281-355.
Leone, A. J., S. Rock, and M. Willenborg. 2007. Disclosure of intended use of proceeds and underpricing in initial public offerings. Journal of Accounting Research 45(1): 111-153.
Lu, R. 2013. How does institutional ownership affect bank loan pricing: Evidence from a regression discontinuity design. Working Paper. National University of Singapore.
Manski, C. F. 1993. Identification of endogenous social effects: The reflection problem. Review of Economic Studies 60(3): 531-542.
Manski, C. F. 2000. Economic analysis of social interactions. Journal of Economic Perspectives 14(3): 115-136.
Marquardt, C., and C. I. Wiedman. 1998. Voluntary disclosure, information asymmetry, and insider selling through secondary equity offerings. Contemporary Accounting Research 15(4): 505-537.
Massa, M., and A. Zaldokas. 2017. Information transfers among coowned firms. Journal of Financial Intermediation 31 (2017): 77-92.
McNichols, M., and B. Trueman. 1994. Public disclosure, private information collection, and short-term trading. Journal of Accounting and Economics 17(1): 69-94.
Merton, R. K. 1957. Social theory and social structure. Milgrom, P., and J. Roberts. 1990. The economics of modern manufacturing: Technology,
strategy, and organization. American Economic Review 80(3): 511-528. Myers, S. C., and N. S. Majluf. 1984. Corporate financing and investment decisions when firms
have information that investors do not have. Journal of Financial Economics 13(2): 187-221. Ozoguz, A., and M. J. Rebello. 2013. Information, competition, and investment sensitivity to peer
stock prices. Working Paper. University of Texas at Dallas. Pearl, J. 2009. Causality. Cambridge university press. Piotroski, J. D., and D. T. Roulstone. 2004. The influence of analysts, institutional investors, and
insiders on the incorporation of market, industry, and firm-specific information into stock prices. The Accounting Review 79(4): 1119-1151.
Rajan, R. G. 1994. Why bank credit policies fluctuate: A theory and some evidence. Quarterly Journal of Economics 109(2): 399-441.
Rajan, R. G., and L. Zingales. 1998. Which capitalism? Lessons from the East Asian crisis. Journal of Applied Corporate Finance 11(3): 40-48.
Roberts, M. R., and A. Sufi. 2009. Control rights and capital structure: An empirical investigation. The Journal of Finance 64(4): 1657-1695.
Ruland, W., S. Tung, and N. E. George. 1990. Factors associated with the disclosure of managers’ forecasts. The Accounting Review 65(3): 710-721.

35
Scharfstein, D. S., and J. C. Stein. 1990. Herd behavior and investment. American Economic Review 80(3): 465-479.
Sharpe, S. A. 1990. Asymmetric information, bank lending, and implicit contracts: A stylized model of customer relationships. The Journal of Finance 45(4): 1069-1087.
Sengupta, P. 1998. Corporate disclosure quality and the cost of debt. The Accounting Review 73(4): 459-474.
Seo, H. J. 2017. Peer effects in corporate disclosure decision. Working paper. National University of Singapore.
Sias, R. W. 2004. Institutional herding. Review of Financial Studies 17(1): 165-206. Simon, H. A. 1973. Applying information technology to organization design. Public
Administration Review 33(3): 268-278. Stocken, P. C. 2000. Credibility of voluntary disclosure. The RAND Journal of Economics 31(2):
359-374. Thistlethwaite, D. L., and D. T. Campbell. 1960. Regression-discontinuity analysis: An alternative
to the ex post facto experiment. Journal of Educational Psychology 51(6): 309-317. Trueman, B. 1994. Analyst forecasts and herding behavior. Review of Financial Studies 7(1): 97-
124. Vashishtha, R. 2014. The role of bank monitoring in borrowers’ disclosure: Evidence from
covenant violations. Journal of Accounting and Economics 57: 176-195. Zhang, J., and P. Liu. 2012. Rational herding in microloan markets. Management Science 58(5):
892-912. Zhang, L. 2012. The effect of ex ante management forecast accuracy on the post-earnings-
announcement drift. The Accounting Review 87(5): 1791-1818.
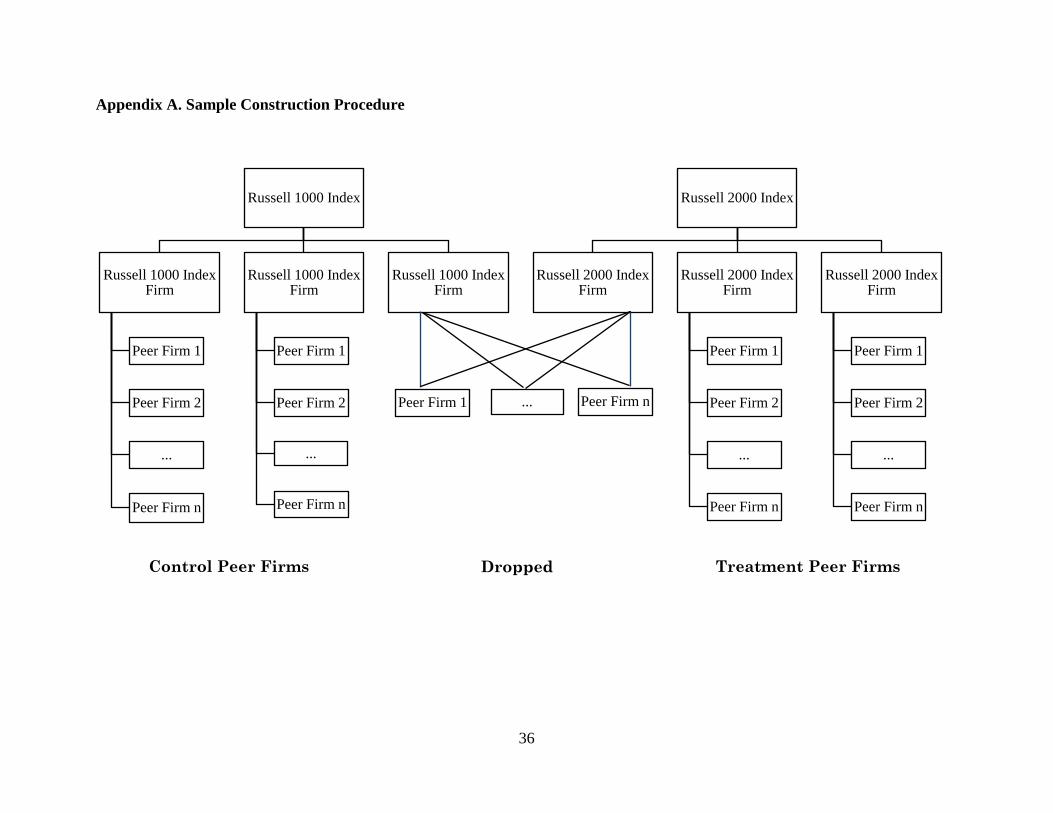
36
Dropped
Control Peer Firms
Treatment Peer Firms
Appendix A. Sample Construction Procedure
Russell 1000 Index
Russell 1000 Index Firm
Peer Firm 1
Peer Firm 2
...
Peer Firm n
Russell 1000 Index Firm
Peer Firm 1
Peer Firm 2
...
Peer Firm n
Russell 1000 Index Firm
Russell 2000 Index
Russell 2000 Index Firm
Russell 2000 Index Firm
Peer Firm 1
Peer Firm 2
...
Peer Firm n
Russell 2000 Index Firm
Peer Firm 1
Peer Firm 2
...
Peer Firm n
Peer Firm 1 ... Peer Firm n

37
Appendix B. Variable Definitions
Management forecast variables
Guidance An indicator variable equal to one if the firm provides annual or quarterly forecasts from July through May subsequent to the index reconstitution, and zero otherwise.
Frequency The number of annual or quarterly forecasts from July through May subsequent to the index reconstitution.
Test variable
Treatment An indicator variable that equals one for corresponding industry peers of the Russell 2000
index treatment firms and zero for the corresponding industry peers of the Russell 1000 index control firms in a particular year.
Control Variables Peer Firms’ Characteristics
Lsize_peer The natural logarithm of market capitalization of peer firms, which is measured by the market value of equity prior to index reconstitution.
Earn_vol_peer Earnings volatility of peer firms, calculated as the standard deviation of ROA over the past five years prior to index reconstitution.
Ret_vol_peer Return volatility of peer firms, calculated as the standard deviation of monthly returns over the past five years prior to index reconstitution.
N_analyst_peer Analyst following of peer firms, calculated as the natural logarithm of one plus the number of analysts following the peer firm in the year prior to index reconstitution.
Rnd_peer R&D expenditures of peer firms scaled by the lagged total asset at the fiscal year-end prior to index reconstitution.
Issuance_peer Equity or debt issuance of peer firms, which is an indicator variable that takes the value of
one if a firm has any seasoned equity offering or long-term debt issuance in the year prior to the index reconstitution.
Indsize The industry size of peer firms, calculated as the natural logarithm of the total market
capitalization of the industry, which is measured by the total market value of equity of the whole industry prior to index reconstitution.
Russell index Firm’s Characteristics Absrank The absolute value of the distance to Russell 1000 exclusion/inclusion threshold.
Lsize_ru The natural logarithm of market capitalization of the Russell index firms. Earn_vol_ru Earnings volatility of Russell index firms. Ret_vol_ru Return volatility of Russell index firms. N_analyst_ru Analyst following of Russell index firms. Rnd_ru Research and development activities of Russell index firms. Issuance_ru Equity or debt issuance of Russell index firms.
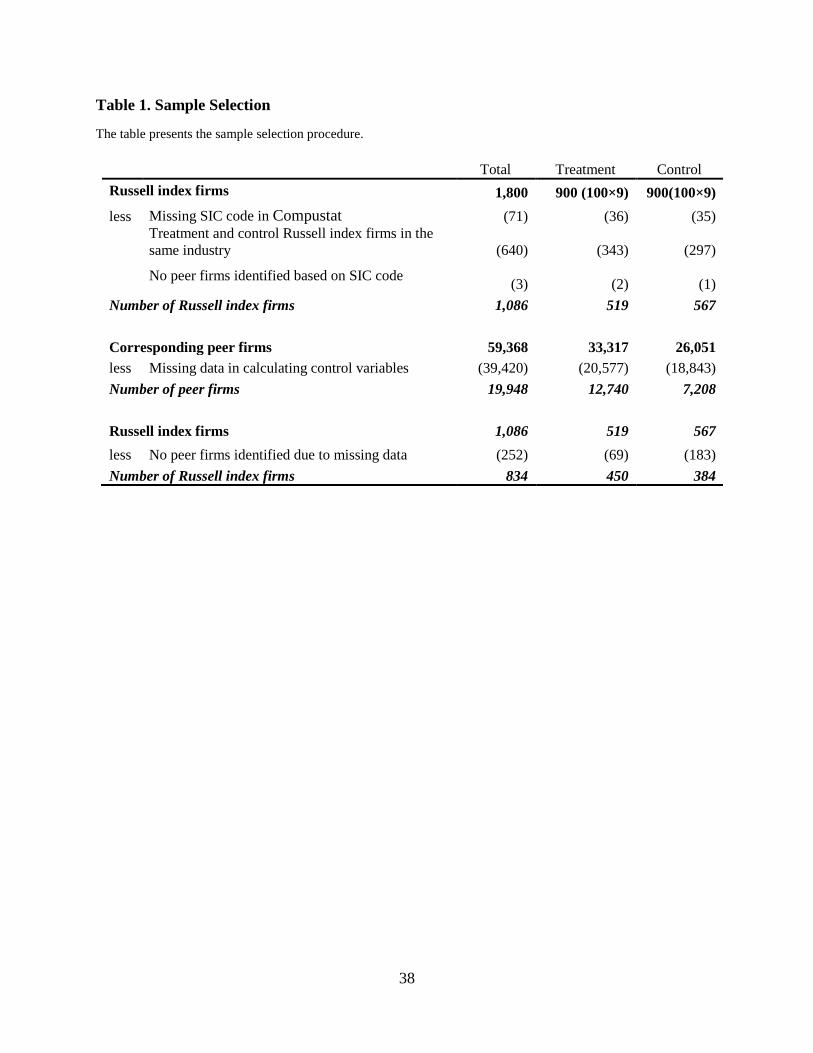
38
Table 1. Sample Selection
The table presents the sample selection procedure.
Total Treatment Control Russell index firms 1,800 900 (100×9) 900(100×9) less Missing SIC code in Compustat (71) (36) (35)
Treatment and control Russell index firms in the same industry (640) (343) (297)
No peer firms identified based on SIC code (3) (2) (1)
Number of Russell index firms 1,086 519 567
Corresponding peer firms 59,368 33,317 26,051 less Missing data in calculating control variables (39,420) (20,577) (18,843) Number of peer firms 19,948 12,740 7,208 Russell index firms 1,086 519 567 less No peer firms identified due to missing data (252) (69) (183) Number of Russell index firms 834 450 384
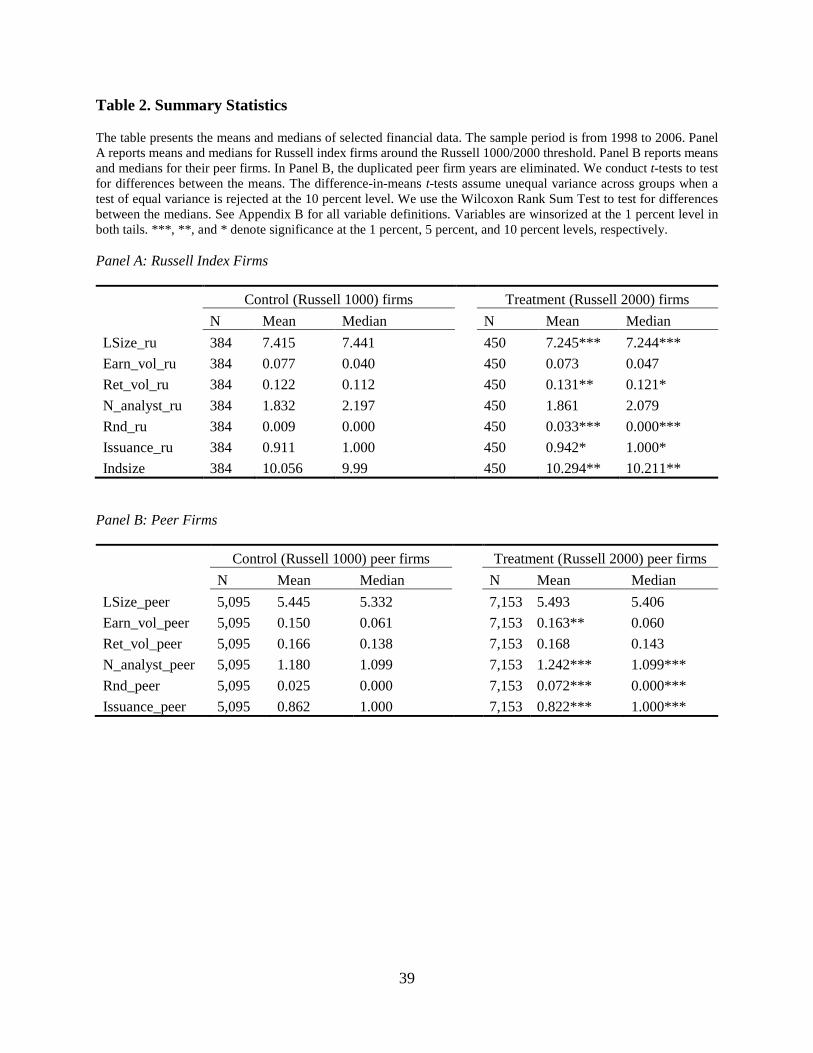
39
Table 2. Summary Statistics
The table presents the means and medians of selected financial data. The sample period is from 1998 to 2006. Panel A reports means and medians for Russell index firms around the Russell 1000/2000 threshold. Panel B reports means and medians for their peer firms. In Panel B, the duplicated peer firm years are eliminated. We conduct t-tests to test for differences between the means. The difference-in-means t-tests assume unequal variance across groups when a test of equal variance is rejected at the 10 percent level. We use the Wilcoxon Rank Sum Test to test for differences between the medians. See Appendix B for all variable definitions. Variables are winsorized at the 1 percent level in both tails. ***, **, and * denote significance at the 1 percent, 5 percent, and 10 percent levels, respectively. Panel A: Russell Index Firms
Control (Russell 1000) firms Treatment (Russell 2000) firms
N Mean Median N Mean Median LSize_ru 384 7.415 7.441 450 7.245*** 7.244*** Earn_vol_ru 384 0.077 0.040 450 0.073 0.047 Ret_vol_ru 384 0.122 0.112 450 0.131** 0.121* N_analyst_ru 384 1.832 2.197 450 1.861 2.079 Rnd_ru 384 0.009 0.000 450 0.033*** 0.000*** Issuance_ru 384 0.911 1.000 450 0.942* 1.000* Indsize 384 10.056 9.99 450 10.294** 10.211**
Panel B: Peer Firms
Control (Russell 1000) peer firms Treatment (Russell 2000) peer firms
N Mean Median N Mean Median LSize_peer 5,095 5.445 5.332 7,153 5.493 5.406 Earn_vol_peer 5,095 0.150 0.061 7,153 0.163** 0.060 Ret_vol_peer 5,095 0.166 0.138 7,153 0.168 0.143 N_analyst_peer 5,095 1.180 1.099 7,153 1.242*** 1.099*** Rnd_peer 5,095 0.025 0.000 7,153 0.072*** 0.000*** Issuance_peer 5,095 0.862 1.000 7,153 0.822*** 1.000***
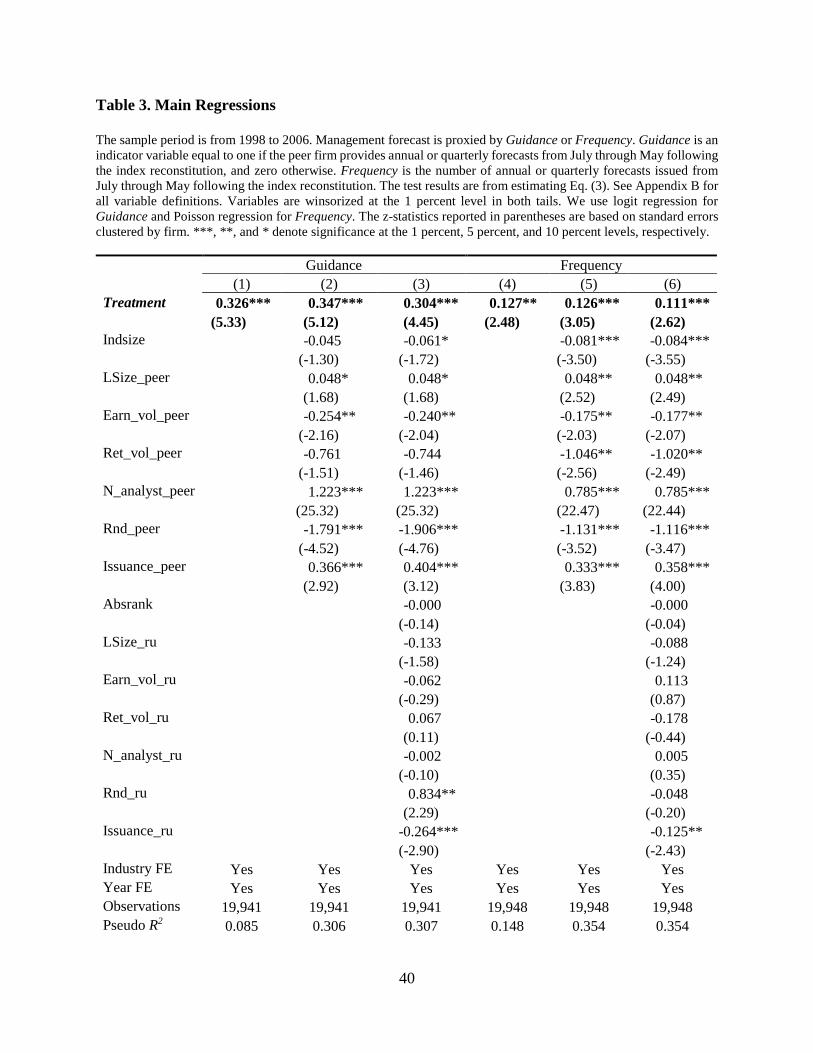
40
Table 3. Main Regressions The sample period is from 1998 to 2006. Management forecast is proxied by Guidance or Frequency. Guidance is an indicator variable equal to one if the peer firm provides annual or quarterly forecasts from July through May following the index reconstitution, and zero otherwise. Frequency is the number of annual or quarterly forecasts issued from July through May following the index reconstitution. The test results are from estimating Eq. (3). See Appendix B for all variable definitions. Variables are winsorized at the 1 percent level in both tails. We use logit regression for Guidance and Poisson regression for Frequency. The z-statistics reported in parentheses are based on standard errors clustered by firm. ***, **, and * denote significance at the 1 percent, 5 percent, and 10 percent levels, respectively. Guidance Frequency
(1) (2) (3) (4) (5) (6) Treatment 0.326*** 0.347*** 0.304*** 0.127** 0.126*** 0.111*** (5.33) (5.12) (4.45) (2.48) (3.05) (2.62) Indsize -0.045 -0.061* -0.081*** -0.084*** (-1.30) (-1.72) (-3.50) (-3.55) LSize_peer 0.048* 0.048* 0.048** 0.048** (1.68) (1.68) (2.52) (2.49) Earn_vol_peer -0.254** -0.240** -0.175** -0.177** (-2.16) (-2.04) (-2.03) (-2.07) Ret_vol_peer -0.761 -0.744 -1.046** -1.020** (-1.51) (-1.46) (-2.56) (-2.49) N_analyst_peer 1.223*** 1.223*** 0.785*** 0.785*** (25.32) (25.32) (22.47) (22.44) Rnd_peer -1.791*** -1.906*** -1.131*** -1.116*** (-4.52) (-4.76) (-3.52) (-3.47) Issuance_peer 0.366*** 0.404*** 0.333*** 0.358*** (2.92) (3.12) (3.83) (4.00) Absrank -0.000 -0.000 (-0.14) (-0.04) LSize_ru -0.133 -0.088 (-1.58) (-1.24) Earn_vol_ru -0.062 0.113 (-0.29) (0.87) Ret_vol_ru 0.067 -0.178 (0.11) (-0.44) N_analyst_ru -0.002 0.005 (-0.10) (0.35) Rnd_ru 0.834** -0.048 (2.29) (-0.20) Issuance_ru -0.264*** -0.125** (-2.90) (-2.43) Industry FE Yes Yes Yes Yes Yes Yes Year FE Yes Yes Yes Yes Yes Yes Observations 19,941 19,941 19,941 19,948 19,948 19,948 Pseudo R2 0.085 0.306 0.307 0.148 0.354 0.354

41
Difference in the coefficients on Treatment (1) vs. (2) (1) vs. (3) (4) vs. (5) (4) vs. (6) chi2 =0.23 chi2 = 0.25 chi2= 0.00 chi2= 0.2 P = 0.63 P = 0.62 P = 0.97 P = 0.65

42
Table 4. Different Institutional Investor Types
The table presents regressions of peer firm management forecast on Russell index firms’ institutional ownership. Io_ded_ru is the ownership of dedicated institutional investors. Io_quasi_ru is the ownership of quasi-indexers. Io_tra_ru is the ownership of transient institutional investors. Institutional ownership is measured as total shares owned by the institutional investors over total number of shares outstanding at the end of September following the June reconstitution of Russell index. The sample period is from 1998 to 2006. The control variables are the same as those in column (3) of Table 3 and thus are abbreviated. Variables are winsorized at the 1 percent level in both tails. We use logit regression for Guidance and Poisson regression for Frequency. The z-statistics reported in parentheses are based on standard errors clustered by firm. ***, **, and * denote significance at the 1 percent, 5 percent, and 10 percent levels, respectively.
Guidance Frequency (1) (2)
Io_ded_ru -0.014 -0.104 (-0.10) (-0.89) Io_quasi_ru 0.517*** 0.208** (3.45) (2.47) Io_tra_ru 0.532*** 0.132 (2.65) (1.18) Other Controls Yes Yes Industry FE Yes Yes Year FE Yes Yes Observations 19,941 19,948 Pseudo R2 0.306 0.354

43
Table 5. IV Analysis This panel presents the two-stage least squares (2SLS) regression using the indicator of the top of Russell 2000 index firm as an instrument for the quasi-indexer institutional ownership. The first stage estimates Io_quasi as a function of the indicator of the top of Russell 2000 index firm as in Eq. (4). Io_quasi is the quasi-indexer ownership of Russell index firms. Float control is the natural logarithm of the float-adjusted market capitalization at the end of June (provided by RIC). The second stage presents estimations of Eq. (5) using instrumented quasi-indexer ownership as test variables. The sample period is from 1998 to 2006. The control variables in Eqs. (4) and (5) are the same as those in column (3) of Table 3 and thus are abbreviated. Variables are winsorized at the 1 percent level in both tails. In columns (1), (2) and (3), we use OLS regressions. The t-statistics reported in parentheses are based on standard errors clustered by firm. ***, **, and * denote significance at the 1 percent, 5 percent, and 10 percent levels, respectively.
First Stage Second Stage Io_quasi Guidance Frequency (1) (2) (3) Treatment (IV) 0.053*** (14.52) Instrumented io_quasi 0.483** 0.700*** (2.26) (2.02) Float control Yes Yes Yes Other controls Yes Yes Yes Industry FE Yes Yes Yes Year FE Yes Yes Yes Observations 19,948 19,948 19,948 Adjusted R2 0.735 0.330 0.358
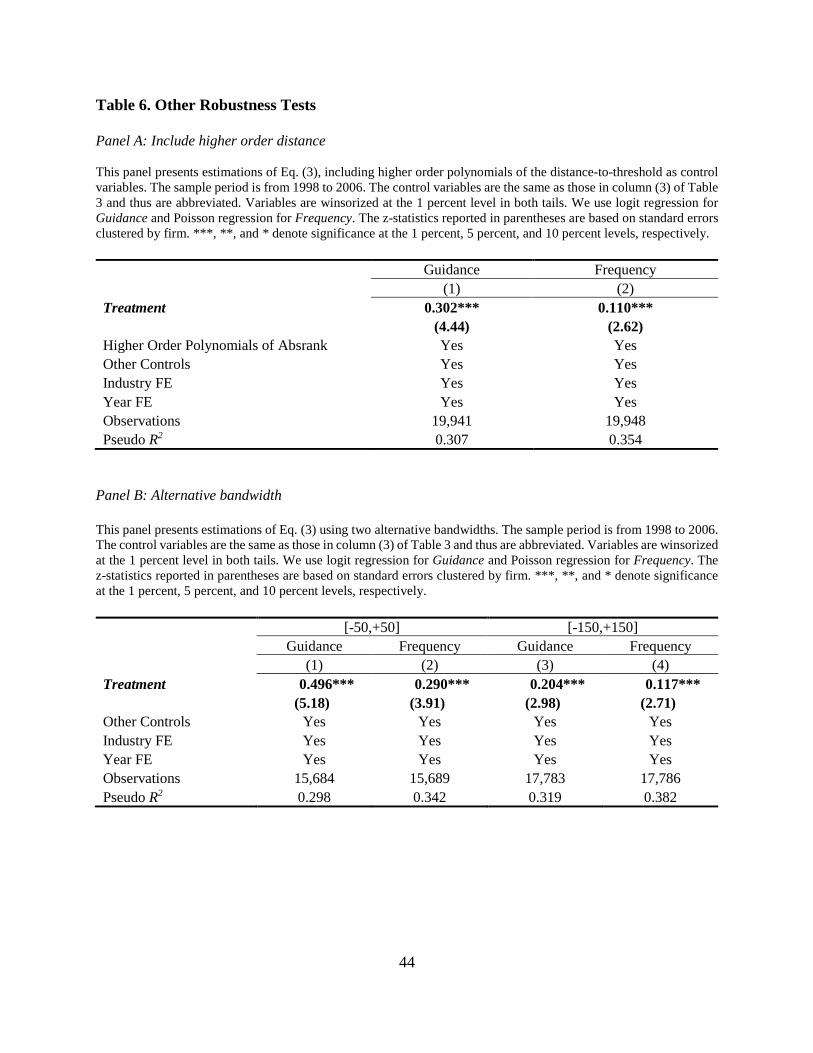
44
Table 6. Other Robustness Tests Panel A: Include higher order distance This panel presents estimations of Eq. (3), including higher order polynomials of the distance-to-threshold as control variables. The sample period is from 1998 to 2006. The control variables are the same as those in column (3) of Table 3 and thus are abbreviated. Variables are winsorized at the 1 percent level in both tails. We use logit regression for Guidance and Poisson regression for Frequency. The z-statistics reported in parentheses are based on standard errors clustered by firm. ***, **, and * denote significance at the 1 percent, 5 percent, and 10 percent levels, respectively. Guidance Frequency (1) (2) Treatment 0.302*** 0.110*** (4.44) (2.62) Higher Order Polynomials of Absrank Yes Yes Other Controls Yes Yes Industry FE Yes Yes Year FE Yes Yes Observations 19,941 19,948 Pseudo R2 0.307 0.354
Panel B: Alternative bandwidth This panel presents estimations of Eq. (3) using two alternative bandwidths. The sample period is from 1998 to 2006. The control variables are the same as those in column (3) of Table 3 and thus are abbreviated. Variables are winsorized at the 1 percent level in both tails. We use logit regression for Guidance and Poisson regression for Frequency. The z-statistics reported in parentheses are based on standard errors clustered by firm. ***, **, and * denote significance at the 1 percent, 5 percent, and 10 percent levels, respectively. [-50,+50] [-150,+150]
Guidance Frequency Guidance Frequency (1) (2) (3) (4) Treatment 0.496*** 0.290*** 0.204*** 0.117*** (5.18) (3.91) (2.98) (2.71) Other Controls Yes Yes Yes Yes Industry FE Yes Yes Yes Yes Year FE Yes Yes Yes Yes Observations 15,684 15,689 17,783 17,786 Pseudo R2 0.298 0.342 0.319 0.382

45
Panel C: Non-duplicate sample This panel presents estimations of Eq. (3) using a non-duplicate peer firm sample. The sample period is from 1998 to 2006. The control variables are the same as those in column (3) of Table 3 and thus are abbreviated. Variables are winsorized at the 1 percent level in both tails. We use logit regression for Guidance and Poisson regression for Frequency. The z-statistics reported in parentheses are based on standard errors clustered by firm. ***, **, and * denote significance at the 1 percent, 5 percent, and 10 percent levels, respectively.
Guidance Frequency
(1) (2) Treatment 0.264*** 0.087** (4.17) (2.25) Other Controls Yes Yes Year FE Yes Yes Industry FE Yes Yes Observations 12,241 12,248 Pseudo R2 0.302 0.357
Panel D: PSM procedure This panel presents the descriptive statistics of selected variables of peer firms between the treatment and matched control groups and results of the second-stage regression of Eq. (3) using the PSM matched sample. The sample period is from 1998 to 2006. We conduct t-tests to test for differences between the means. The difference-in-means t-tests assume unequal variance across groups when a test of equal variance is rejected at the 10 percent level. We use the Wilcoxon Rank Sum Test to test for differences between the medians. See Appendix B for all variable definitions. Variables are winsorized at the 1 percent level in both tails. The t-statistics reported in parentheses are based on standard errors clustered by firm. ***, **, and * denote significance at the 1 percent, 5 percent, and 10 percent levels, respectively. Balance check: Control (Russell 1000) peer firms Treatment (Russell 2000) peer firms
N Mean Median N Mean Median Indsize 1,167 10.574 10.325 1,167 10.571 10.479 LSize_peer 1,167 5.532 5.536 1,167 5.453 5.420 Earn_vol_peer 1,167 0.150 0.069 1,167 0.150 0.068 Ret_vol_peer 1,167 0.179 0.154 1,167 0.176 0.157 N_analyst_peer 1,167 1.262 1.386 1,167 1.240 1.386 Rnd_peer 1,167 0.050 0.000 1,167 0.051 0.000 Issuance_peer 1,167 0.894 1.000 1,167 0.893 1.000
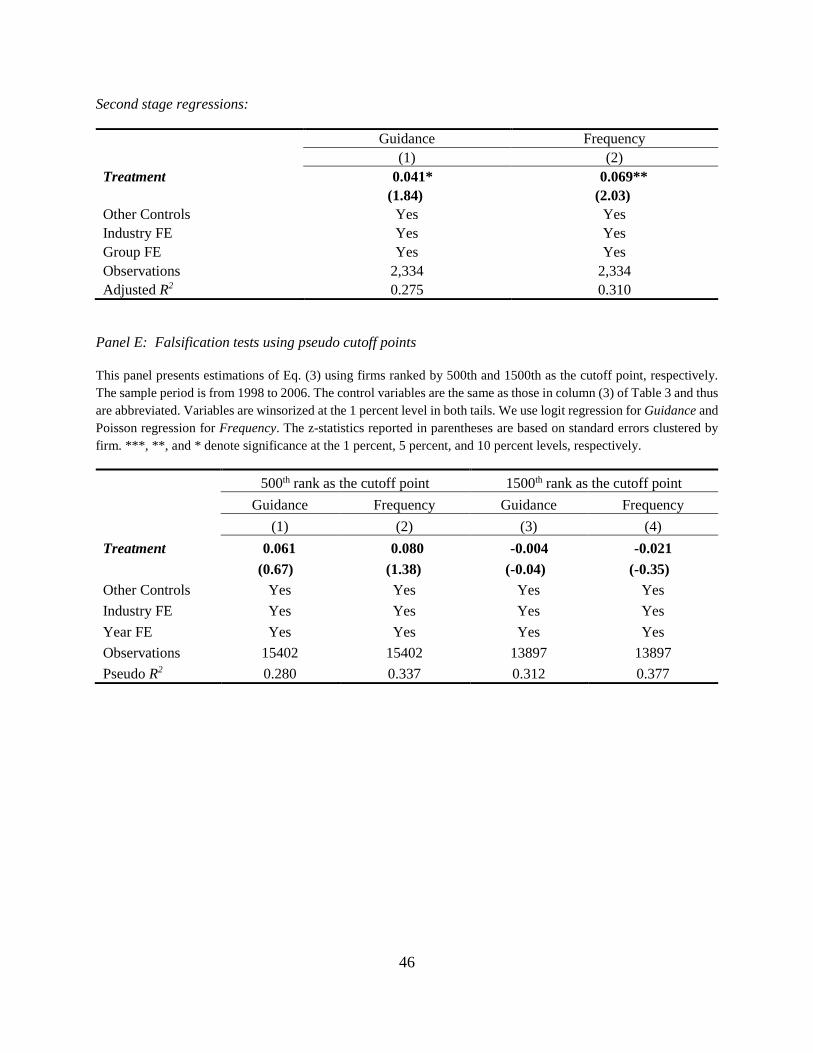
46
Second stage regressions:
Guidance Frequency (1) (2) Treatment 0.041* 0.069** (1.84) (2.03) Other Controls Yes Yes Industry FE Yes Yes Group FE Yes Yes Observations 2,334 2,334 Adjusted R2 0.275 0.310
Panel E: Falsification tests using pseudo cutoff points This panel presents estimations of Eq. (3) using firms ranked by 500th and 1500th as the cutoff point, respectively. The sample period is from 1998 to 2006. The control variables are the same as those in column (3) of Table 3 and thus are abbreviated. Variables are winsorized at the 1 percent level in both tails. We use logit regression for Guidance and Poisson regression for Frequency. The z-statistics reported in parentheses are based on standard errors clustered by firm. ***, **, and * denote significance at the 1 percent, 5 percent, and 10 percent levels, respectively.
500th rank as the cutoff point 1500th rank as the cutoff point
Guidance Frequency Guidance Frequency
(1) (2) (3) (4) Treatment 0.061 0.080 -0.004 -0.021 (0.67) (1.38) (-0.04) (-0.35) Other Controls Yes Yes Yes Yes Industry FE Yes Yes Yes Yes Year FE Yes Yes Yes Yes Observations 15402 15402 13897 13897 Pseudo R2 0.280 0.337 0.312 0.377
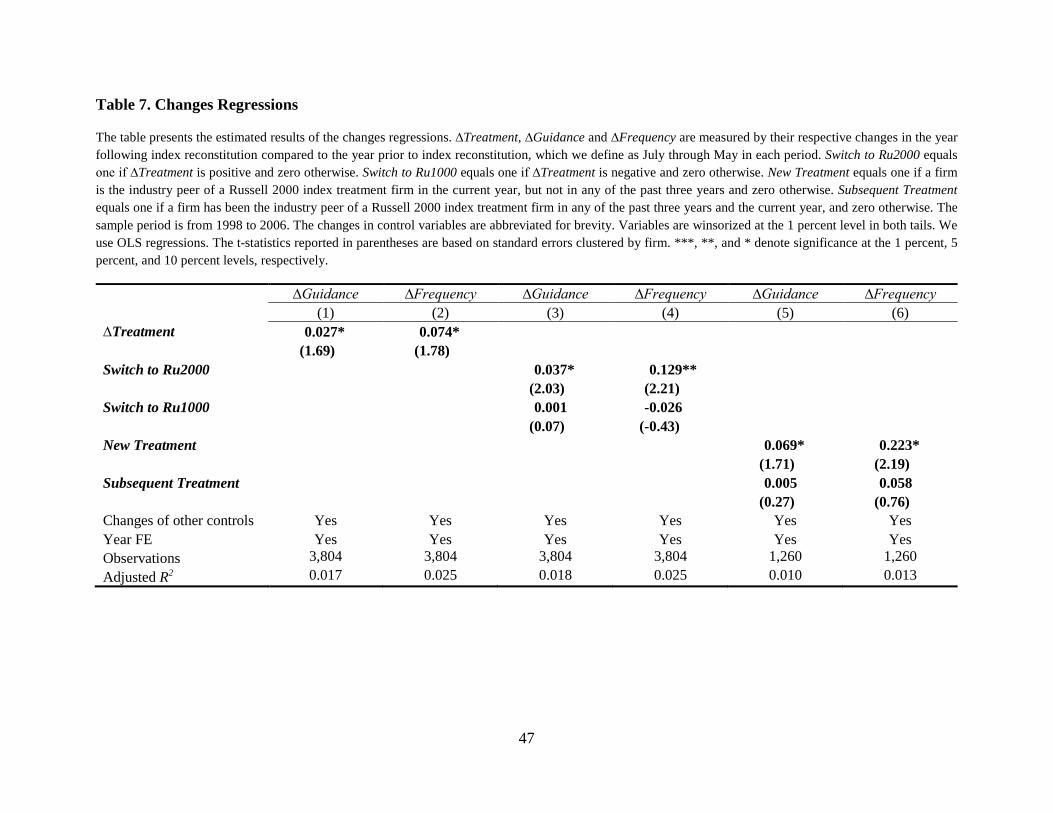
47
Table 7. Changes Regressions
The table presents the estimated results of the changes regressions. ∆Treatment, ∆Guidance and ∆Frequency are measured by their respective changes in the year following index reconstitution compared to the year prior to index reconstitution, which we define as July through May in each period. Switch to Ru2000 equals one if ∆Treatment is positive and zero otherwise. Switch to Ru1000 equals one if ∆Treatment is negative and zero otherwise. New Treatment equals one if a firm is the industry peer of a Russell 2000 index treatment firm in the current year, but not in any of the past three years and zero otherwise. Subsequent Treatment equals one if a firm has been the industry peer of a Russell 2000 index treatment firm in any of the past three years and the current year, and zero otherwise. The sample period is from 1998 to 2006. The changes in control variables are abbreviated for brevity. Variables are winsorized at the 1 percent level in both tails. We use OLS regressions. The t-statistics reported in parentheses are based on standard errors clustered by firm. ***, **, and * denote significance at the 1 percent, 5 percent, and 10 percent levels, respectively.
∆Guidance ∆Frequency ∆Guidance ∆Frequency ∆Guidance ∆Frequency (1) (2) (3) (4) (5) (6)
∆Treatment 0.027* 0.074* (1.69) (1.78) Switch to Ru2000 0.037* 0.129** (2.03) (2.21) Switch to Ru1000 0.001 -0.026 (0.07) (-0.43) New Treatment 0.069* 0.223* (1.71) (2.19) Subsequent Treatment 0.005 0.058 (0.27) (0.76) Changes of other controls Yes Yes Yes Yes Yes Yes Year FE Yes Yes Yes Yes Yes Yes Observations 3,804 3,804 3,804 3,804 1,260 1,260 Adjusted R2 0.017 0.025 0.018 0.025 0.010 0.013
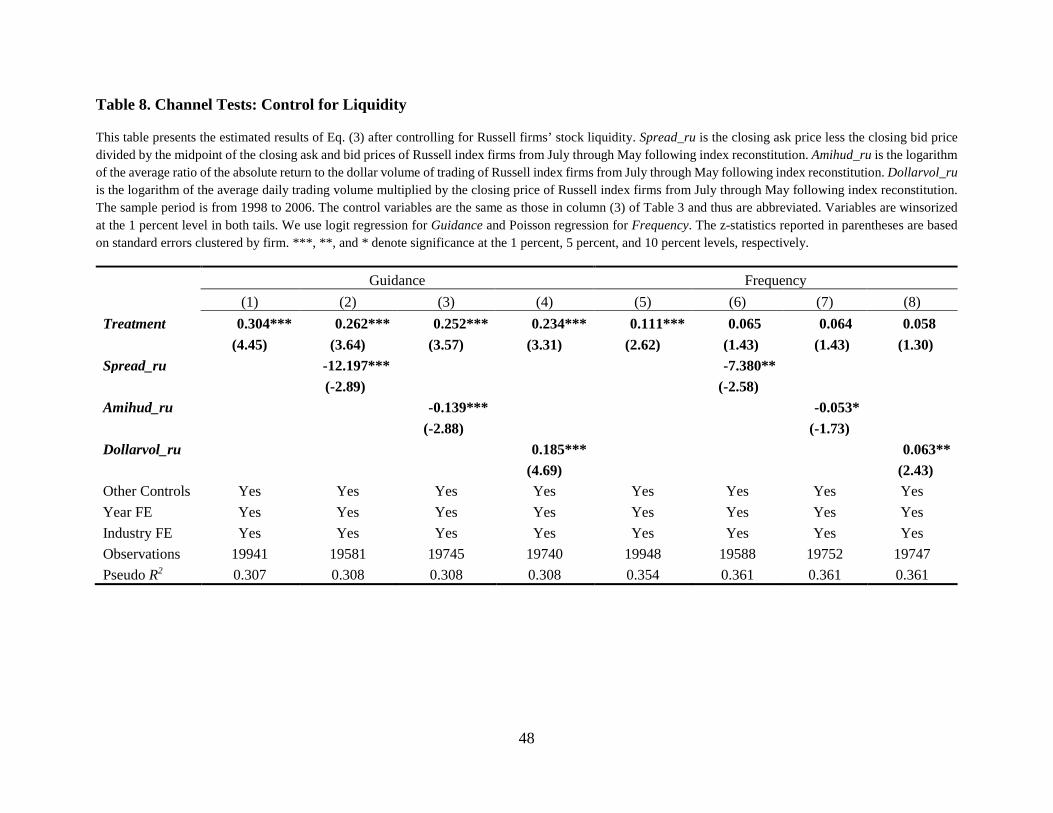
48
Table 8. Channel Tests: Control for Liquidity
This table presents the estimated results of Eq. (3) after controlling for Russell firms’ stock liquidity. Spread_ru is the closing ask price less the closing bid price divided by the midpoint of the closing ask and bid prices of Russell index firms from July through May following index reconstitution. Amihud_ru is the logarithm of the average ratio of the absolute return to the dollar volume of trading of Russell index firms from July through May following index reconstitution. Dollarvol_ru is the logarithm of the average daily trading volume multiplied by the closing price of Russell index firms from July through May following index reconstitution. The sample period is from 1998 to 2006. The control variables are the same as those in column (3) of Table 3 and thus are abbreviated. Variables are winsorized at the 1 percent level in both tails. We use logit regression for Guidance and Poisson regression for Frequency. The z-statistics reported in parentheses are based on standard errors clustered by firm. ***, **, and * denote significance at the 1 percent, 5 percent, and 10 percent levels, respectively.
Guidance Frequency
(1) (2) (3) (4) (5) (6) (7) (8) Treatment 0.304*** 0.262*** 0.252*** 0.234*** 0.111*** 0.065 0.064 0.058 (4.45) (3.64) (3.57) (3.31) (2.62) (1.43) (1.43) (1.30) Spread_ru -12.197*** -7.380** (-2.89) (-2.58) Amihud_ru -0.139*** -0.053* (-2.88) (-1.73) Dollarvol_ru 0.185*** 0.063** (4.69) (2.43) Other Controls Yes Yes Yes Yes Yes Yes Yes Yes Year FE Yes Yes Yes Yes Yes Yes Yes Yes Industry FE Yes Yes Yes Yes Yes Yes Yes Yes Observations 19941 19581 19745 19740 19948 19588 19752 19747 Pseudo R2 0.307 0.308 0.308 0.308 0.354 0.361 0.361 0.361
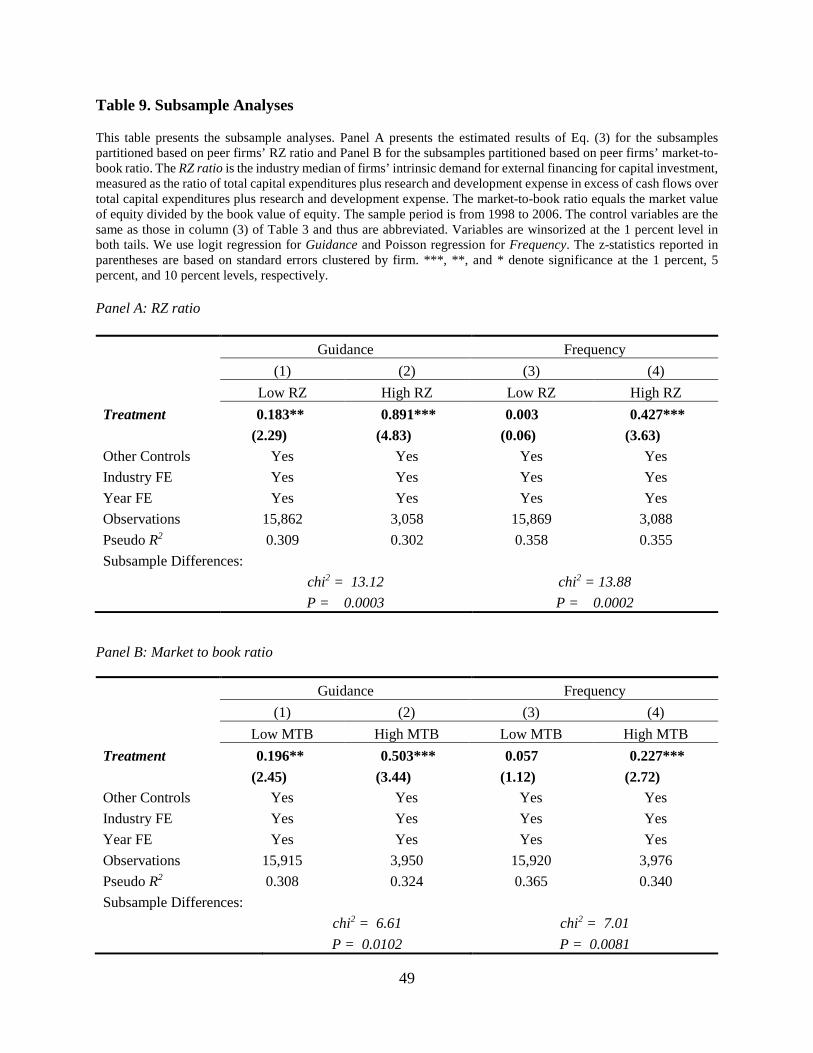
49
Table 9. Subsample Analyses
This table presents the subsample analyses. Panel A presents the estimated results of Eq. (3) for the subsamples partitioned based on peer firms’ RZ ratio and Panel B for the subsamples partitioned based on peer firms’ market-to-book ratio. The RZ ratio is the industry median of firms’ intrinsic demand for external financing for capital investment, measured as the ratio of total capital expenditures plus research and development expense in excess of cash flows over total capital expenditures plus research and development expense. The market-to-book ratio equals the market value of equity divided by the book value of equity. The sample period is from 1998 to 2006. The control variables are the same as those in column (3) of Table 3 and thus are abbreviated. Variables are winsorized at the 1 percent level in both tails. We use logit regression for Guidance and Poisson regression for Frequency. The z-statistics reported in parentheses are based on standard errors clustered by firm. ***, **, and * denote significance at the 1 percent, 5 percent, and 10 percent levels, respectively. Panel A: RZ ratio
Guidance Frequency
(1) (2) (3) (4)
Low RZ High RZ Low RZ High RZ Treatment 0.183** 0.891*** 0.003 0.427*** (2.29) (4.83) (0.06) (3.63) Other Controls Yes Yes Yes Yes Industry FE Yes Yes Yes Yes Year FE Yes Yes Yes Yes Observations 15,862 3,058 15,869 3,088 Pseudo R2 0.309 0.302 0.358 0.355 Subsample Differences: chi2 = 13.12 chi2 = 13.88 P = 0.0003 P = 0.0002
Panel B: Market to book ratio
Guidance Frequency
(1) (2) (3) (4)
Low MTB High MTB Low MTB High MTB Treatment 0.196** 0.503*** 0.057 0.227*** (2.45) (3.44) (1.12) (2.72) Other Controls Yes Yes Yes Yes Industry FE Yes Yes Yes Yes Year FE Yes Yes Yes Yes Observations 15,915 3,950 15,920 3,976 Pseudo R2 0.308 0.324 0.365 0.340 Subsample Differences: chi2 = 6.61 chi2 = 7.01 P = 0.0102 P = 0.0081

50
Table 10. Channel Tests: Herding Effect and Common Ownership
This table presents the estimated results of Eq. (3) after controlling for Russell firms’ management forecasts and common ownership. Frequency_ru is the number of annual or quarterly forecasts of Russell index firms from July through May following the index reconstitution. Common holding is the number of common holding quasi-indexer institutional investors scaled by the total number of institutional investors. The sample period is from 1998 to 2006. The control variables are the same as those in column (3) of Table 3 and thus are abbreviated. Variables are winsorized at the 1 percent level in both tails. We use logit regression for Guidance and Poisson regression for Frequency. The z-statistics reported in parentheses are based on standard errors clustered by firm. ***, **, and * denote significance at the 1 percent, 5 percent, and 10 percent levels, respectively.
Guidance Frequency
(1) (2) (3) (4) (5) (6) Treatment 0.304*** 0.279*** 0.287*** 0.111*** 0.093** 0.095** (4.45) (4.09) (4.21) (2.62) (2.19) (2.25) Frequency_ru 0.034*** 0.015*** (4.80) (4.11) Common holding 0.554*** 0.592*** (3.07) (4.12) Other Controls Yes Yes Yes Yes Yes Yes Industry FE Yes Yes Yes Yes Yes Yes Year FE Yes Yes Yes Yes Yes Yes Observations 19,941 19,941 19,941 19,948 19,948 19,948 Pseudo R2 0.307 0.308 0.308 0.354 0.355 0.356

51
Table 11. Other Disclosures
The table presents regressions of estimating peer firms’ accrual quality and other voluntary disclosures on Russell index firms’ institutional ownership. The sample period is from 1998 to 2006. Earnings quality is measured as the absolute value of performance-matched discretionary accruals (Kothari et al. 2005). Other News is the natural logarithm of one plus the number of news issued from July through May following the index reconstitution excluding mandatory reporting and management forecasts. The control variables are the same as those in column (3) of Table 3 and thus are abbreviated. Variables are winsorized at the 1 percent level in both tails. We use OLS regressions. The t-statistics reported in parentheses are based on standard errors clustered by firm. ***, **, and * denote significance at the 1 percent, 5 percent, and 10 percent levels, respectively.
Earnings Quality Other News
(1) (1) Treatment -0.009*** 0.049*** (-3.12) (2.79) Other Controls Yes Yes Industry FE Yes Yes Year FE Yes Yes Observations 13,840 19,948 Adjusted R2 0.204 0.756
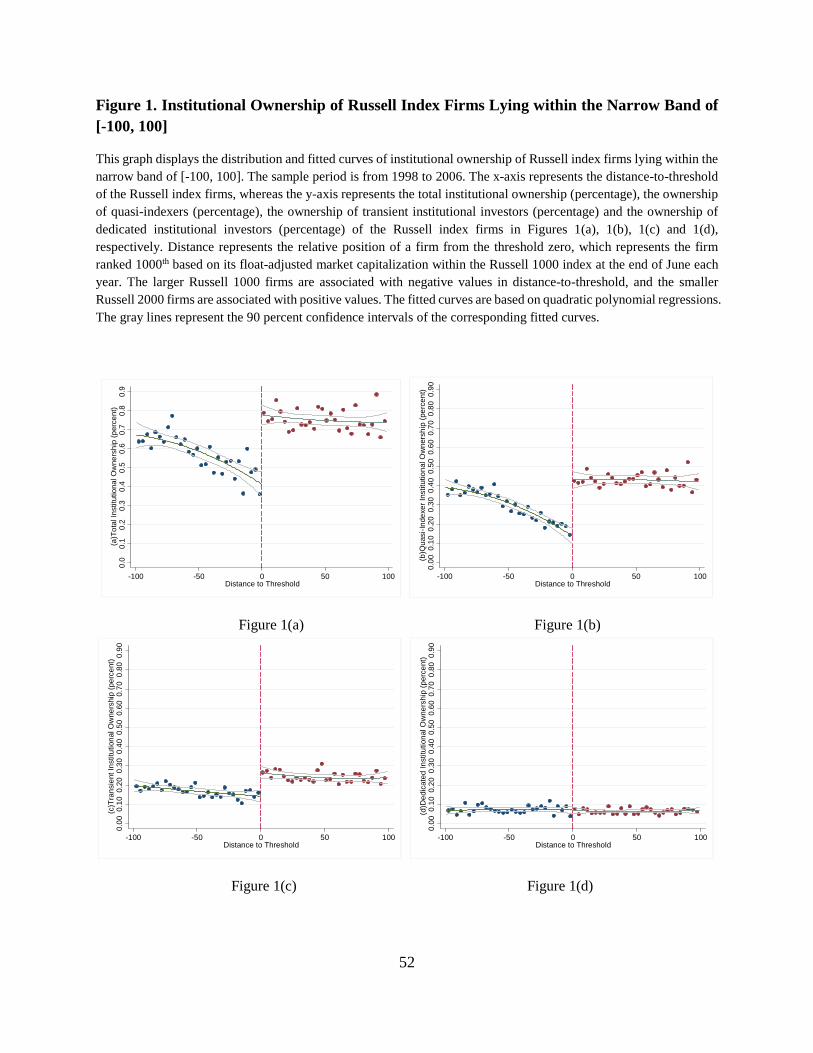
52
Figure 1. Institutional Ownership of Russell Index Firms Lying within the Narrow Band of [-100, 100]
This graph displays the distribution and fitted curves of institutional ownership of Russell index firms lying within the narrow band of [-100, 100]. The sample period is from 1998 to 2006. The x-axis represents the distance-to-threshold of the Russell index firms, whereas the y-axis represents the total institutional ownership (percentage), the ownership of quasi-indexers (percentage), the ownership of transient institutional investors (percentage) and the ownership of dedicated institutional investors (percentage) of the Russell index firms in Figures 1(a), 1(b), 1(c) and 1(d), respectively. Distance represents the relative position of a firm from the threshold zero, which represents the firm ranked 1000th based on its float-adjusted market capitalization within the Russell 1000 index at the end of June each year. The larger Russell 1000 firms are associated with negative values in distance-to-threshold, and the smaller Russell 2000 firms are associated with positive values. The fitted curves are based on quadratic polynomial regressions. The gray lines represent the 90 percent confidence intervals of the corresponding fitted curves.
Figure 1(a) Figure 1(b)
Figure 1(c) Figure 1(d)
0.0
0.1
0.2
0.3
0.4
0.5
0.6
0.7
0.8
0.9
(a)T
otal
Inst
itutio
nal O
wne
rshi
p (p
erce
nt)
-100 -50 0 50 100Distance to Threshold
0.00
0.10
0.20
0.30
0.40
0.50
0.60
0.70
0.80
0.90
(b)Q
uasi
-Inde
xer I
nstit
utio
nal O
wne
rshi
p (p
erce
nt)
-100 -50 0 50 100Distance to Threshold
0.00
0.10
0.20
0.30
0.40
0.50
0.60
0.70
0.80
0.90
(c)T
rans
ient
Inst
itutio
nal O
wne
rshi
p (p
erce
nt)
-100 -50 0 50 100Distance to Threshold
0.00
0.10
0.20
0.30
0.40
0.50
0.60
0.70
0.80
0.90
(d)D
edic
ated
Inst
itutio
nal O
wne
rshi
p (p
erce
nt)
-100 -50 0 50 100Distance to Threshold
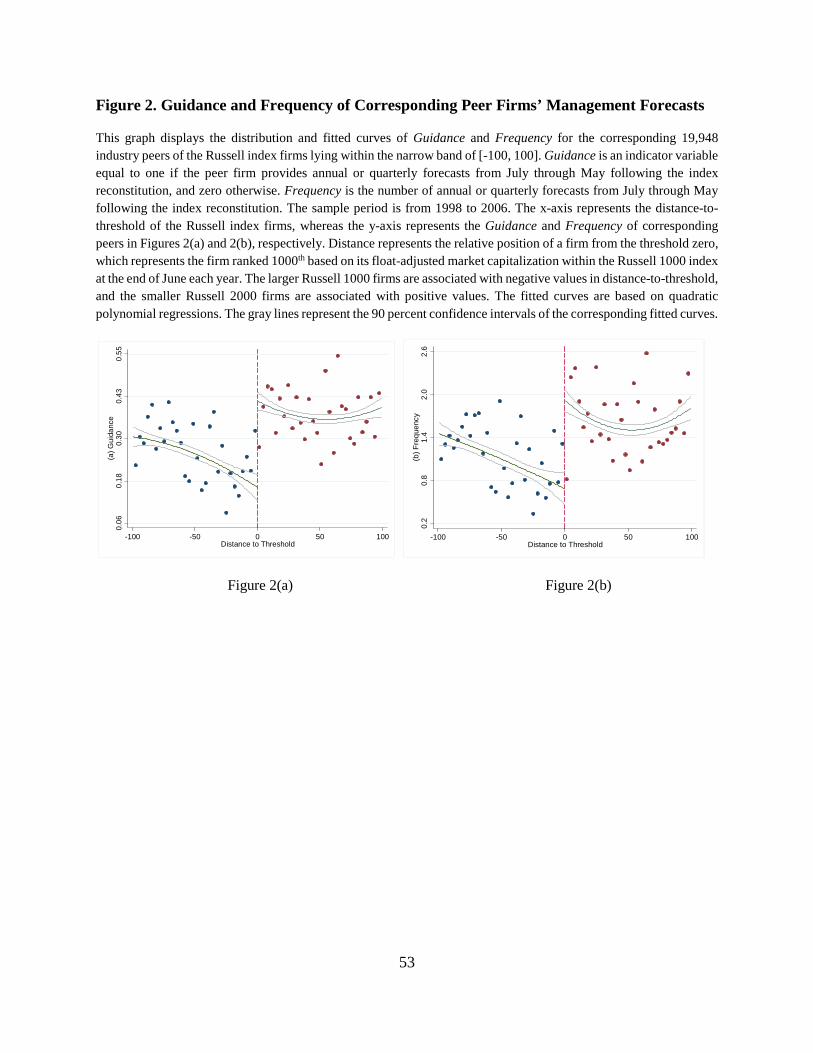
53
Figure 2. Guidance and Frequency of Corresponding Peer Firms’ Management Forecasts
This graph displays the distribution and fitted curves of Guidance and Frequency for the corresponding 19,948 industry peers of the Russell index firms lying within the narrow band of [-100, 100]. Guidance is an indicator variable equal to one if the peer firm provides annual or quarterly forecasts from July through May following the index reconstitution, and zero otherwise. Frequency is the number of annual or quarterly forecasts from July through May following the index reconstitution. The sample period is from 1998 to 2006. The x-axis represents the distance-to-threshold of the Russell index firms, whereas the y-axis represents the Guidance and Frequency of corresponding peers in Figures 2(a) and 2(b), respectively. Distance represents the relative position of a firm from the threshold zero, which represents the firm ranked 1000th based on its float-adjusted market capitalization within the Russell 1000 index at the end of June each year. The larger Russell 1000 firms are associated with negative values in distance-to-threshold, and the smaller Russell 2000 firms are associated with positive values. The fitted curves are based on quadratic polynomial regressions. The gray lines represent the 90 percent confidence intervals of the corresponding fitted curves.
Figure 2(a) Figure 2(b)
0.06
0.18
0.30
0.43
0.55
(a) G
uida
nce
-100 -50 0 50 100Distance to Threshold
0.2
0.8
1.4
2.0
2.6
(b) F
requ
ency
-100 -50 0 50 100Distance to Threshold

Internet Appendix
“Institutional Ownership, Peer Pressure, and Voluntary Disclosures”
Yupeng Lin
National University of Singapore [email protected]
Ying Mao
Lingnan University [email protected]
Zheng Wang
City University of Hong Kong [email protected]

2
This internet appendix provides supplementary figures and tables with discussions to the
manuscript titled “Institutional Ownership, Peer Pressure, and Voluntary Disclosures.” In
particular, Section IA1 discusses Figure IA1 that plots the evolvement of the Russell index firms’
market capitalization and index weights around the threshold of the Russell 1000/2000 index.
Section IA2 graphically replicates the results of Boone and White (2015) using our sample.
Section IA3 discusses Figure IA2 that plots the pre-assignment characteristics for the Russell
index firms and their industry peers. Section IA4 discusses additional analyses on the
management forecast quality of the industry peers of the Russell index firms. The results of the
analyses are reported in Table IA1. Finally, Table IA2 presents the industry distribution of the
Russell index firms and their peer firms.

3
IA1. Market Capitalization and Index Weights of the Russell Index Firms
We plot the market capitalization and index weights of the Russell index firms in Figure IA1.
We define the threshold as the position of the stock ranked 1000th based on its float-adjusted
market capitalization at the end of June each year (the stock with the lowest weight in the Russell
1000 index). The distance to threshold is defined as the relative position of a Russell index firm
from that threshold according to its rank of float-adjusted market capitalization within its
respective index. With respect to the distance to threshold, Russell 1000 index firms are
associated with negative values (on the left of the threshold) and Russell 2000 index firms are
associated with positive values (on the right of the threshold). We observe several important
patterns. First, firms’ market capitalizations evolve smoothly along the distance to the threshold
(Figure IA1 (a)). Second, there is a discontinuity in the level of index weights around the
threshold (Figure IA1 (b)). For example, the weight of the Russell 2000 index firm ranked 1st
within the Russell 2000 index is significantly larger than that of the Russell 1000 index firm
ranked 1000th within the Russell 1000 index, demonstrating a sharp jump in weights around the
threshold.
IA2. Replication of Boone and White (2015)
In this section, we replicate the results of Boone and White (2015) regarding management
forecasts and analyst following using our sample. We plot in Figure IA2, the likelihood and
frequency of managerial forecasts and analyst following of the Russell 1000/2000 index firms
lying within the narrow band [-100, +100]. Figures IA2 (a) and (b) show a significant increase in
both management forecast likelihood and frequency around the threshold, moving from the
Russell 1000 index firms on the left to the Russell 2000 index firms on the right. Figure IA2 (c)

4
shows a similar pattern for analyst following. The results are consistent with those of Boone and
White (2015) that the significant increase in the quasi-indexer ownership of the top Russell 2000
index firms leads to an increase in public information supplied by both managers and analysts.
IA3. Pre-assignment Characteristics
As illustrated in Figure IA1 (a), Russell firms’ market capitalizations evolve continuously
across the Russell 1000/2000 index threshold. In Figure IA3, we plot the rest of the determinants
that are shown in Table 2 (in the manuscript) to be significantly different between the treatment
and control groups, to check their local continuity around the threshold. Figure IA3 shows that
these determinants do not exhibit significant discontinuities around the Russell 1000/2000 index
threshold even though they are significantly different between the treatment and control groups
based on the mean values. 1
IA4. Quality of Management Forecasts
Following the literature, we test the precision, horizons, and accuracy of the management
forecasts (Feng et al. 2009; Boone and White 2015). To fully utilize the information in
managerial forecasts, our estimations are based on individual forecasts made by the management.
We define Precision as equal to zero if the forecast is a qualitative forecast, one if the forecast is
an open-ended forecast, two if the forecast is a range forecast, and three if the forecast is a point
forecast. The forecast horizon (Horizon) is measured as the number of calendar days between the
quarterly (annual) management earnings forecast and the fiscal period-end divided by 90 (365).
Following Zhang (2012), we measure forecast accuracy (Accuracy) as -1 times the absolute
1 The RDD plots of the other determinants do not show any discontinuity around the threshold either. We do not include their figures for brevity.

5
value of the management forecast error, which is computed as the absolute value of the
difference between actual earnings and the management forecast (point or mid-point of the range
forecast) scaled by the average stock price one week before the management forecast
announcement date.
The results of non-parametric estimations are shown in Figure IA4, wherein the x-axis
represents the distance to threshold of the Russell index firms and the y-axis represents the
precision, horizons, or accuracy of the managerial forecasts by corresponding peer firms. The
overlaps in the 90 percent confidence intervals of the treatment and control samples around the
threshold in Figures IA4 (a), IA4 (b) and IA4 (c) for precision, horizons, and accuracy,
respectively, seem to suggest that treatment peer firms are not associated with greater precision,
longer horizons, or more accurate management forecasts compared with control peer firms.
We further conduct parametric estimation of Eq. (3) (in the manuscript) using Precision,
Horizon or Accuracy as the dependent variable and report the results in Table IA1. In these tests,
we include an additional control variable (Period) to indicate whether the management forecast
is for annual or quarterly earnings, because forecasts on annual or quarterly earnings can exhibit
significantly different characteristics. We find that the high institutional ownership of Russell
2000 index firms significantly affects peer firms’ forecast accuracy (0.004, t = 2.73). In contrast,
we find no evidence that the high institutional ownership of Russell 2000 index firms increases
peer firms’ forecast precision or horizons (0.031, z = 0.34 in column (1); -0.033, t = -1.59 in
column (2)). Together with the evidence from non-parametric estimation, we conclude that the
overall effect of high institutional ownership on peer firms’ managerial forecast quality is much
weaker.
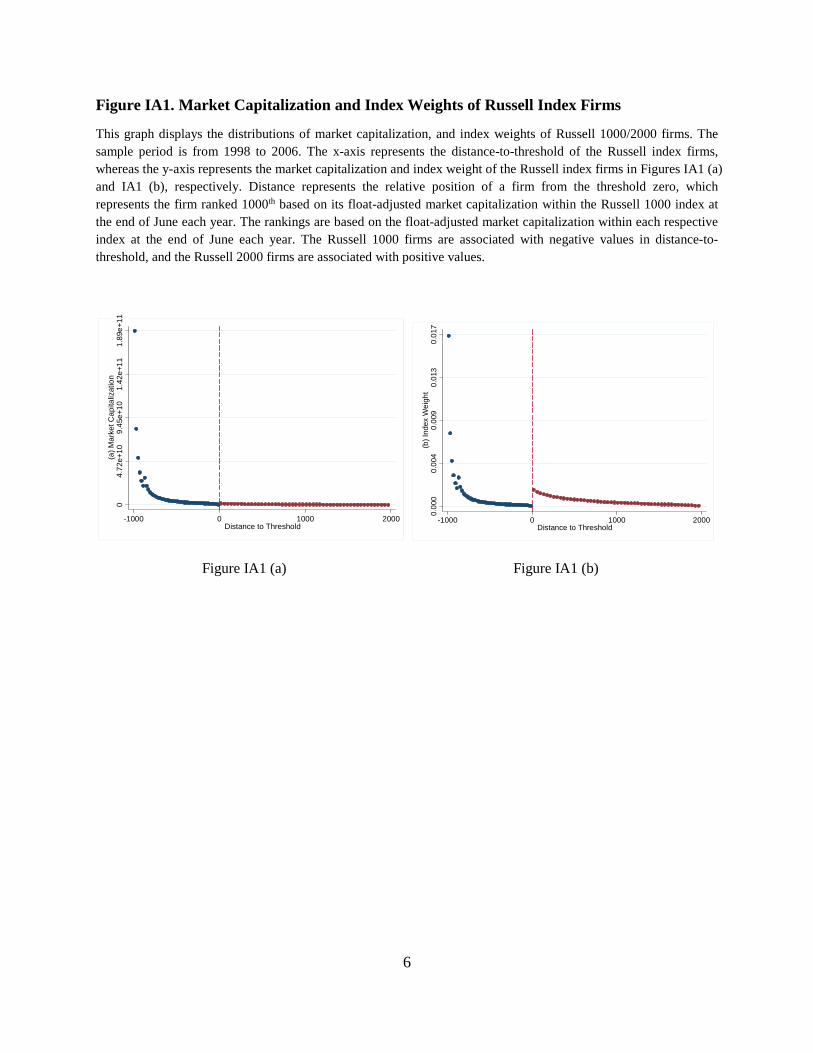
6
Figure IA1. Market Capitalization and Index Weights of Russell Index Firms
This graph displays the distributions of market capitalization, and index weights of Russell 1000/2000 firms. The sample period is from 1998 to 2006. The x-axis represents the distance-to-threshold of the Russell index firms, whereas the y-axis represents the market capitalization and index weight of the Russell index firms in Figures IA1 (a) and IA1 (b), respectively. Distance represents the relative position of a firm from the threshold zero, which represents the firm ranked 1000th based on its float-adjusted market capitalization within the Russell 1000 index at the end of June each year. The rankings are based on the float-adjusted market capitalization within each respective index at the end of June each year. The Russell 1000 firms are associated with negative values in distance-to-threshold, and the Russell 2000 firms are associated with positive values.
Figure IA1 (a) Figure IA1 (b)
04.
72e+
109.
45e+
101.
42e+
111.
89e+
11(a
) Mar
ket C
apita
lizat
ion
-1000 0 1000 2000Distance to Threshold
0.00
00.
004
0.00
90.
013
0.01
7(b
) Ind
ex W
eigh
t
-1000 0 1000 2000Distance to Threshold
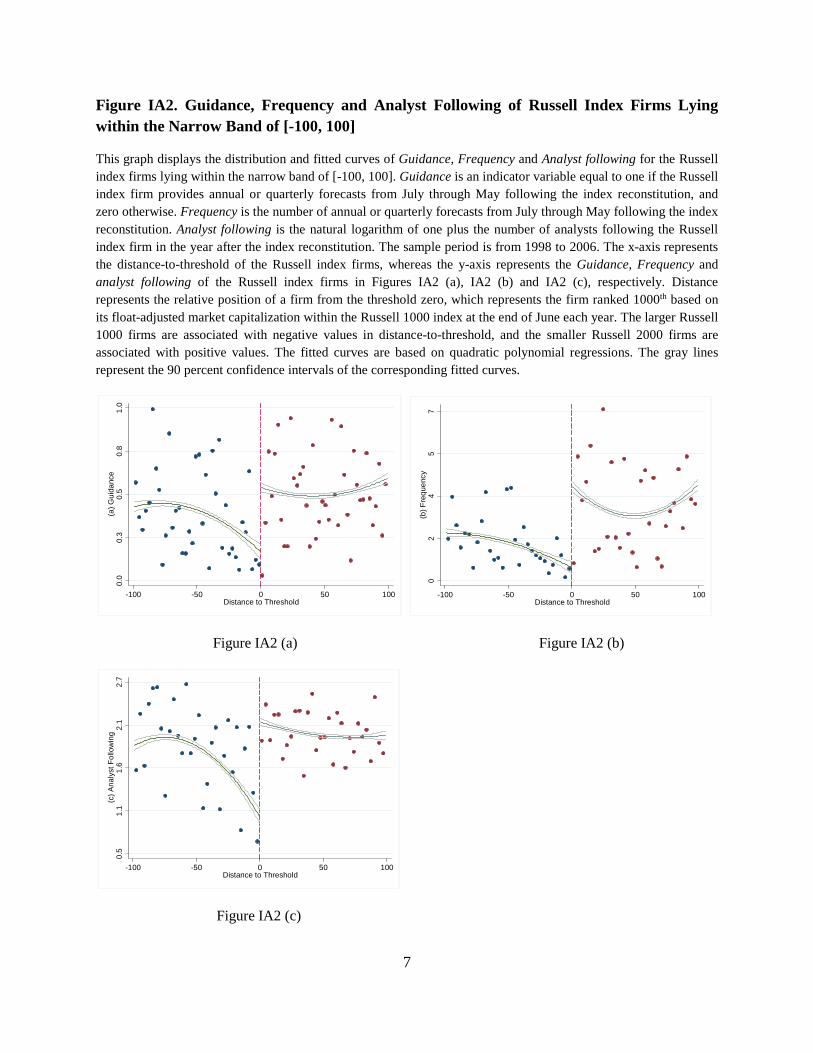
7
Figure IA2. Guidance, Frequency and Analyst Following of Russell Index Firms Lying within the Narrow Band of [-100, 100]
This graph displays the distribution and fitted curves of Guidance, Frequency and Analyst following for the Russell index firms lying within the narrow band of [-100, 100]. Guidance is an indicator variable equal to one if the Russell index firm provides annual or quarterly forecasts from July through May following the index reconstitution, and zero otherwise. Frequency is the number of annual or quarterly forecasts from July through May following the index reconstitution. Analyst following is the natural logarithm of one plus the number of analysts following the Russell index firm in the year after the index reconstitution. The sample period is from 1998 to 2006. The x-axis represents the distance-to-threshold of the Russell index firms, whereas the y-axis represents the Guidance, Frequency and analyst following of the Russell index firms in Figures IA2 (a), IA2 (b) and IA2 (c), respectively. Distance represents the relative position of a firm from the threshold zero, which represents the firm ranked 1000th based on its float-adjusted market capitalization within the Russell 1000 index at the end of June each year. The larger Russell 1000 firms are associated with negative values in distance-to-threshold, and the smaller Russell 2000 firms are associated with positive values. The fitted curves are based on quadratic polynomial regressions. The gray lines represent the 90 percent confidence intervals of the corresponding fitted curves.
Figure IA2 (a) Figure IA2 (b)
Figure IA2 (c)
0.0
0.3
0.5
0.8
1.0
(a) G
uida
nce
-100 -50 0 50 100Distance to Threshold
02
45
7(b
) Fre
quen
cy
-100 -50 0 50 100Distance to Threshold
0.5
1.1
1.6
2.1
2.7
(c) A
naly
st F
ollo
win
g
-100 -50 0 50 100Distance to Threshold

8
Figure IA3. Pre-assignment Firm Characteristics
This graph displays the distribution and fitted curves of the pre-assignment characteristics for the Russell index firms lying within the narrow band of [-100, 100] and their corresponding peer firms. The sample period is from 1998 to 2006. The x-axis represents the distance-to-threshold of the Russell index firms, whereas the y-axis represents the pre-assignment characteristics of the Russell index firms and the corresponding peers. Distance represents the relative position of a firm from the threshold zero, which represents the firm ranked 1000th based on its float-adjusted market capitalization within the Russell 1000 index at the end of June each year. The larger Russell 1000 firms are associated with negative values in distance-to-threshold, and the smaller Russell 2000 firms are associated with positive values. The fitted curves are based on quadratic polynomial regressions. The gray lines represent the 90 percent confidence intervals of the corresponding fitted curves.
Characteristics of Russell index firms:
Figure IA3 (a) Figure IA3 (b)
Figure IA3 (c) Figure IA3 (d)
0.09
0.11
0.13
0.15
0.17
(a) R
usse
ll Fi
rm R
et_v
ol
-100 -50 0 50 100Distance to Threshold
0.00
0.02
0.04
0.07
0.09
(b) R
usse
ll Fi
rm R
nd
-100 -50 0 50 100Distance to Threshold
0.70
0.78
0.85
0.92
1.00
(c)R
usse
ll Fi
rm Is
suan
ce
-100 -50 0 50 100Distance to Threshold
9.1
9.6
10.1
10.5
11.0
(d) I
ndus
try S
ize
-100 -50 0 50 100Distance to Threshold
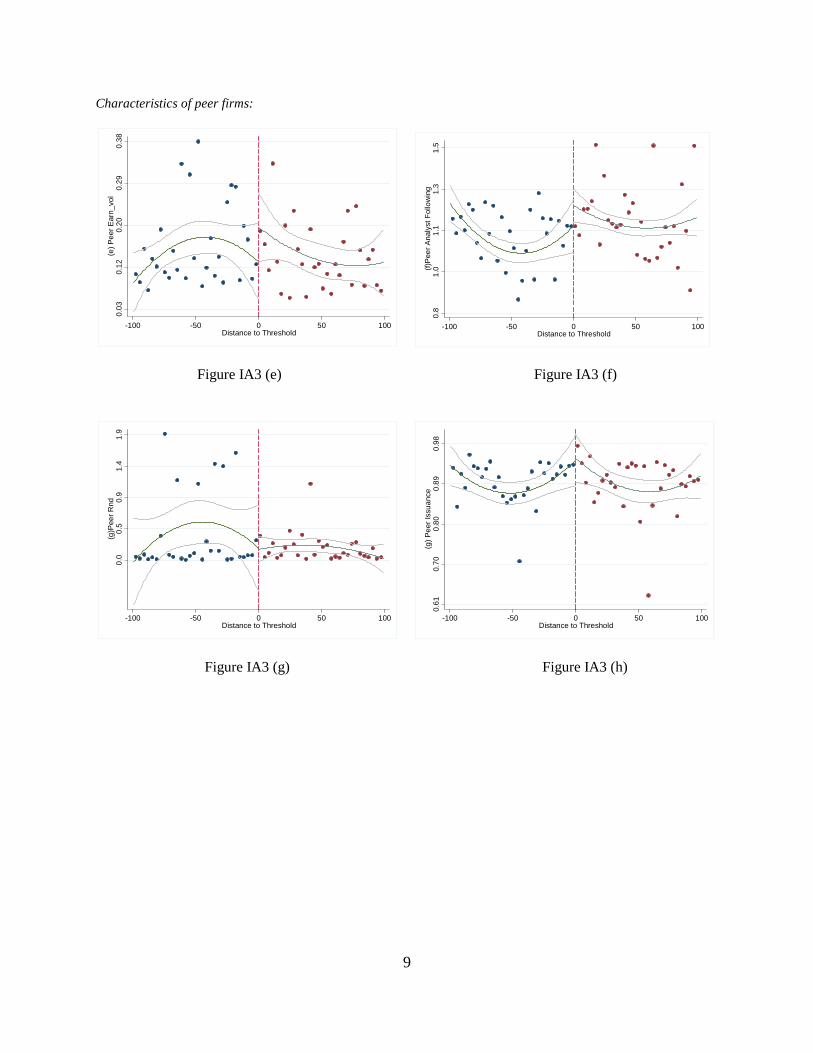
9
Characteristics of peer firms:
Figure IA3 (e) Figure IA3 (f)
Figure IA3 (g) Figure IA3 (h)
0.03
0.12
0.20
0.29
0.38
(e) P
eer E
arn_
vol
-100 -50 0 50 100Distance to Threshold
0.8
1.0
1.1
1.3
1.5
(f)P
eer A
naly
st F
ollo
win
g
-100 -50 0 50 100Distance to Threshold
0.0
0.5
0.9
1.4
1.9
(g)P
eer R
nd
-100 -50 0 50 100Distance to Threshold
0.61
0.70
0.80
0.89
0.98
(g) P
eer I
ssua
nce
-100 -50 0 50 100Distance to Threshold
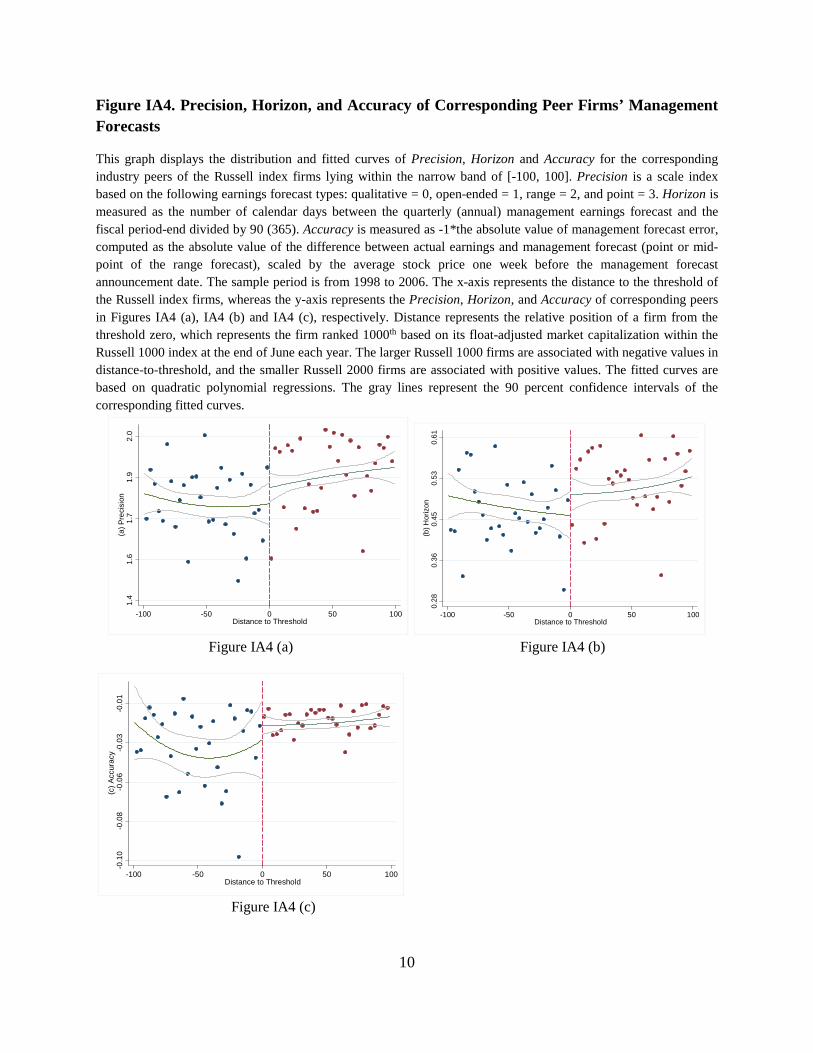
10
Figure IA4. Precision, Horizon, and Accuracy of Corresponding Peer Firms’ Management Forecasts
This graph displays the distribution and fitted curves of Precision, Horizon and Accuracy for the corresponding industry peers of the Russell index firms lying within the narrow band of [-100, 100]. Precision is a scale index based on the following earnings forecast types: qualitative = 0, open-ended = 1, range = 2, and point = 3. Horizon is measured as the number of calendar days between the quarterly (annual) management earnings forecast and the fiscal period-end divided by 90 (365). Accuracy is measured as -1*the absolute value of management forecast error, computed as the absolute value of the difference between actual earnings and management forecast (point or mid-point of the range forecast), scaled by the average stock price one week before the management forecast announcement date. The sample period is from 1998 to 2006. The x-axis represents the distance to the threshold of the Russell index firms, whereas the y-axis represents the Precision, Horizon, and Accuracy of corresponding peers in Figures IA4 (a), IA4 (b) and IA4 (c), respectively. Distance represents the relative position of a firm from the threshold zero, which represents the firm ranked 1000th based on its float-adjusted market capitalization within the Russell 1000 index at the end of June each year. The larger Russell 1000 firms are associated with negative values in distance-to-threshold, and the smaller Russell 2000 firms are associated with positive values. The fitted curves are based on quadratic polynomial regressions. The gray lines represent the 90 percent confidence intervals of the corresponding fitted curves.
Figure IA4 (a) Figure IA4 (b)
Figure IA4 (c)
1.4
1.6
1.7
1.9
2.0
(a) P
reci
sion
-100 -50 0 50 100Distance to Threshold
0.28
0.36
0.45
0.53
0.61
(b) H
oriz
on
-100 -50 0 50 100Distance to Threshold
-0.1
0-0
.08
-0.0
6-0
.03
-0.0
1(c
) Acc
urac
y
-100 -50 0 50 100Distance to Threshold

11
Table IA1. Management Forecast Quality
The table presents regressions of peer firm management forecast quality on Russell index firms’ institutional ownership. The sample period is from 1998 to 2006. Management forecast quality is proxied by Precision, Horizon or Accuracy. Precision is a scale index based on the following earnings forecast types: qualitative = 0, open-ended = 1, range = 2, and point = 3. Horizon is measured as the number of calendar days between the quarterly (annual) management earnings forecast and the fiscal period-end divided by 90 (365). Accuracy is measured as -1*the absolute value of management forecast error, computed as the absolute value of the difference between actual earnings and management forecast (point or mid-point of the range forecast), scaled by the average stock price one week before the management forecast announcement date. See Appendix B for all variable definitions. Variables are winsorized at the 1 percent level in both tails. We use order regression for Precision and OLS regression for Horizon and Accuracy. The t-statistics (or z-statistics) reported in parentheses are based on standard errors clustered by firm. ***, **, and * denote significance at the 1 percent, 5 percent, and 10 percent levels, respectively. Precision Horizon Accuracy
(1) (2) (3)
Treatment 0.031 -0.033 0.004***
(0.34) (-1.59) (2.73)
Period -0.094 -0.020 -0.016*** (-1.20) (-0.83) (-17.42) Indsize -0.058 -0.000 -0.001
(-1.41) (-0.05) (-1.06)
Size_peer 0.071 0.014 0.003***
(1.40) (1.22) (4.69)
Earn_vol_peer 0.032 0.052 0.004*
(0.13) (1.39) (1.79)
Ret_vol_peer 0.178 0.004 -0.033***
(0.21) (0.02) (-3.14)
N_analyst_peer 0.029 0.034* -0.002*
(0.28) (1.80) (-1.94)
Rnd_peer 0.636 -0.245 0.016*
(0.73) (-1.48) (1.96)
Issuance_peer 0.279 0.040 0.001
(1.25) (0.76) (0.32)
Size_ru -0.154 -0.021 -0.002
(-0.98) (-0.83) (-0.69)
Earn_vol_ru -0.080 0.015 0.003*
(-0.41) (0.39) (1.69)
Ret_vol_ru 0.743 -0.126 0.008
(0.96) (-0.77) (0.81)
N_analyst_ru -0.011 0.006 0.000
(-0.42) (1.18) (0.53)
Rnd_ru 1.295** 0.114 0.011
(2.26) (0.88) (0.83)
Issuance_ru 0.018 0.099*** -0.001
(0.18) (3.90) (-0.85)
Absrank -0.000 0.000 -0.000

12
(-0.33) (1.59) (-0.54)
Industry FE Yes Yes Yes Year FE Yes Yes Yes Observations 29,238 29,238 26,999 Pseudo/Adjusted R2 0.021 0.040 0.143
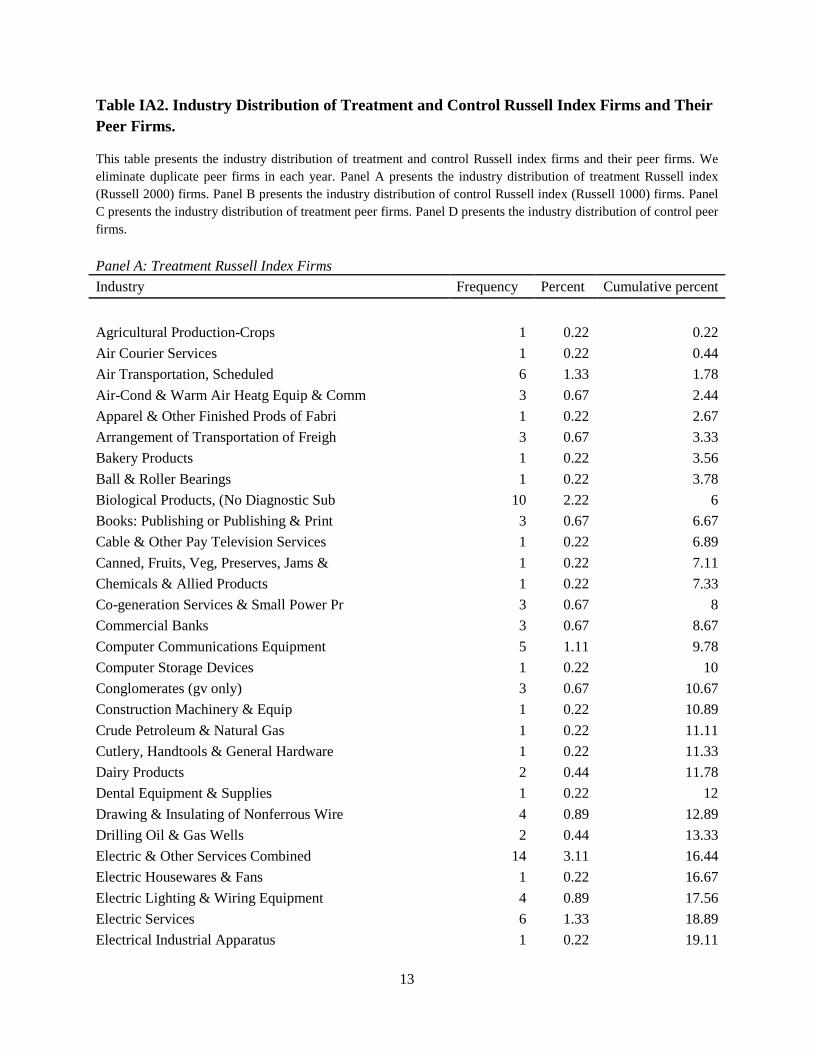
13
Table IA2. Industry Distribution of Treatment and Control Russell Index Firms and Their Peer Firms.
This table presents the industry distribution of treatment and control Russell index firms and their peer firms. We eliminate duplicate peer firms in each year. Panel A presents the industry distribution of treatment Russell index (Russell 2000) firms. Panel B presents the industry distribution of control Russell index (Russell 1000) firms. Panel C presents the industry distribution of treatment peer firms. Panel D presents the industry distribution of control peer firms.
Panel A: Treatment Russell Index Firms Industry Frequency Percent Cumulative percent
Agricultural Production-Crops 1 0.22 0.22 Air Courier Services 1 0.22 0.44 Air Transportation, Scheduled 6 1.33 1.78 Air-Cond & Warm Air Heatg Equip & Comm 3 0.67 2.44 Apparel & Other Finished Prods of Fabri 1 0.22 2.67 Arrangement of Transportation of Freigh 3 0.67 3.33 Bakery Products 1 0.22 3.56 Ball & Roller Bearings 1 0.22 3.78 Biological Products, (No Diagnostic Sub 10 2.22 6 Books: Publishing or Publishing & Print 3 0.67 6.67 Cable & Other Pay Television Services 1 0.22 6.89 Canned, Fruits, Veg, Preserves, Jams & 1 0.22 7.11 Chemicals & Allied Products 1 0.22 7.33 Co-generation Services & Small Power Pr 3 0.67 8 Commercial Banks 3 0.67 8.67 Computer Communications Equipment 5 1.11 9.78 Computer Storage Devices 1 0.22 10 Conglomerates (gv only) 3 0.67 10.67 Construction Machinery & Equip 1 0.22 10.89 Crude Petroleum & Natural Gas 1 0.22 11.11 Cutlery, Handtools & General Hardware 1 0.22 11.33 Dairy Products 2 0.44 11.78 Dental Equipment & Supplies 1 0.22 12 Drawing & Insulating of Nonferrous Wire 4 0.89 12.89 Drilling Oil & Gas Wells 2 0.44 13.33 Electric & Other Services Combined 14 3.11 16.44 Electric Housewares & Fans 1 0.22 16.67 Electric Lighting & Wiring Equipment 4 0.89 17.56 Electric Services 6 1.33 18.89 Electrical Industrial Apparatus 1 0.22 19.11
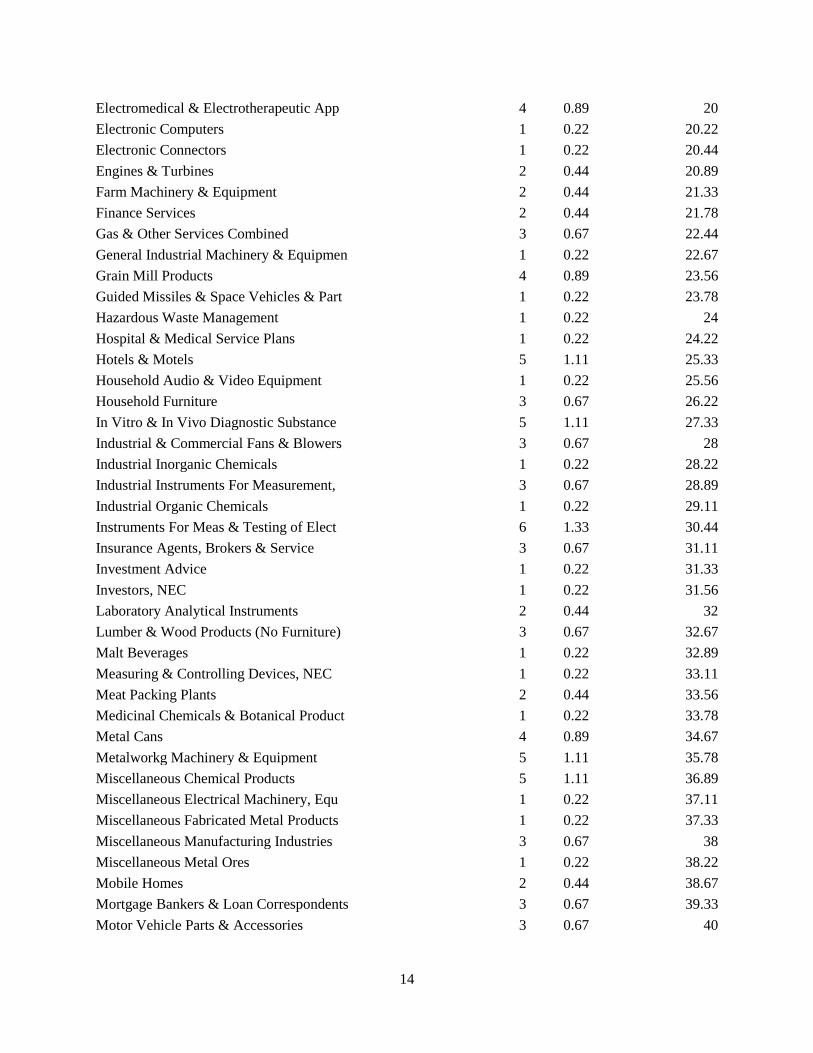
14
Electromedical & Electrotherapeutic App 4 0.89 20 Electronic Computers 1 0.22 20.22 Electronic Connectors 1 0.22 20.44 Engines & Turbines 2 0.44 20.89 Farm Machinery & Equipment 2 0.44 21.33 Finance Services 2 0.44 21.78 Gas & Other Services Combined 3 0.67 22.44 General Industrial Machinery & Equipmen 1 0.22 22.67 Grain Mill Products 4 0.89 23.56 Guided Missiles & Space Vehicles & Part 1 0.22 23.78 Hazardous Waste Management 1 0.22 24 Hospital & Medical Service Plans 1 0.22 24.22 Hotels & Motels 5 1.11 25.33 Household Audio & Video Equipment 1 0.22 25.56 Household Furniture 3 0.67 26.22 In Vitro & In Vivo Diagnostic Substance 5 1.11 27.33 Industrial & Commercial Fans & Blowers 3 0.67 28 Industrial Inorganic Chemicals 1 0.22 28.22 Industrial Instruments For Measurement, 3 0.67 28.89 Industrial Organic Chemicals 1 0.22 29.11 Instruments For Meas & Testing of Elect 6 1.33 30.44 Insurance Agents, Brokers & Service 3 0.67 31.11 Investment Advice 1 0.22 31.33 Investors, NEC 1 0.22 31.56 Laboratory Analytical Instruments 2 0.44 32 Lumber & Wood Products (No Furniture) 3 0.67 32.67 Malt Beverages 1 0.22 32.89 Measuring & Controlling Devices, NEC 1 0.22 33.11 Meat Packing Plants 2 0.44 33.56 Medicinal Chemicals & Botanical Product 1 0.22 33.78 Metal Cans 4 0.89 34.67 Metalworkg Machinery & Equipment 5 1.11 35.78 Miscellaneous Chemical Products 5 1.11 36.89 Miscellaneous Electrical Machinery, Equ 1 0.22 37.11 Miscellaneous Fabricated Metal Products 1 0.22 37.33 Miscellaneous Manufacturing Industries 3 0.67 38 Miscellaneous Metal Ores 1 0.22 38.22 Mobile Homes 2 0.44 38.67 Mortgage Bankers & Loan Correspondents 3 0.67 39.33 Motor Vehicle Parts & Accessories 3 0.67 40
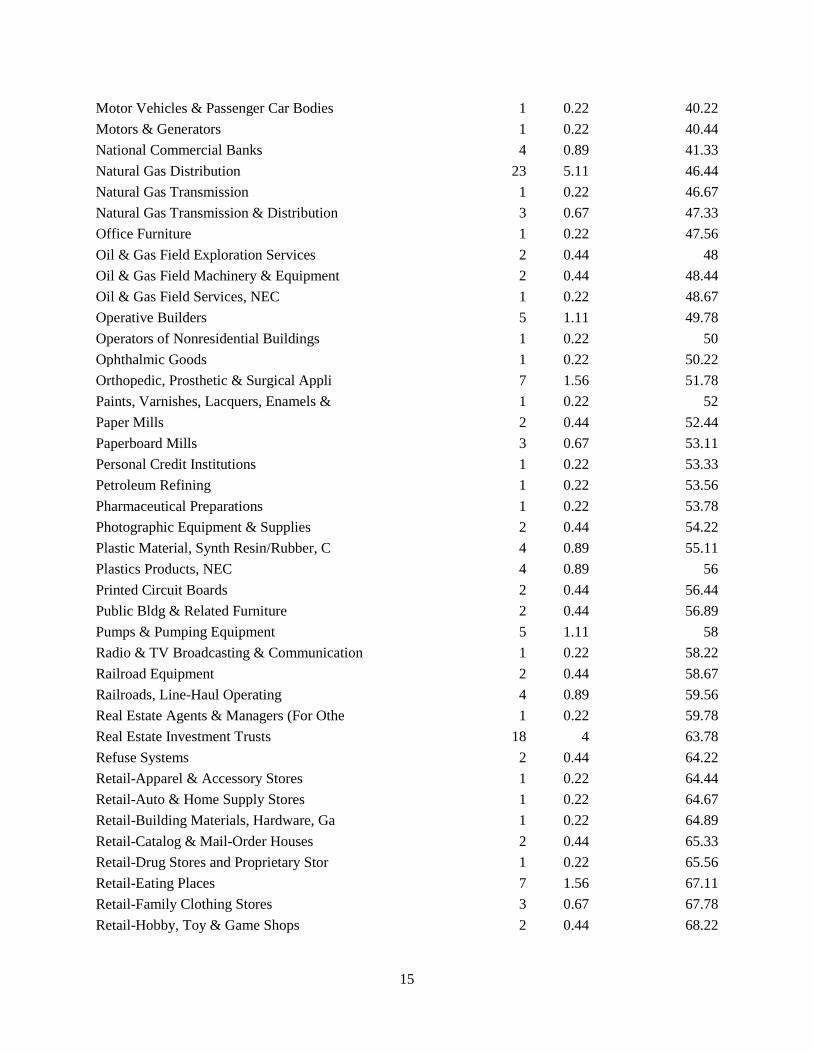
15
Motor Vehicles & Passenger Car Bodies 1 0.22 40.22 Motors & Generators 1 0.22 40.44 National Commercial Banks 4 0.89 41.33 Natural Gas Distribution 23 5.11 46.44 Natural Gas Transmission 1 0.22 46.67 Natural Gas Transmission & Distribution 3 0.67 47.33 Office Furniture 1 0.22 47.56 Oil & Gas Field Exploration Services 2 0.44 48 Oil & Gas Field Machinery & Equipment 2 0.44 48.44 Oil & Gas Field Services, NEC 1 0.22 48.67 Operative Builders 5 1.11 49.78 Operators of Nonresidential Buildings 1 0.22 50 Ophthalmic Goods 1 0.22 50.22 Orthopedic, Prosthetic & Surgical Appli 7 1.56 51.78 Paints, Varnishes, Lacquers, Enamels & 1 0.22 52 Paper Mills 2 0.44 52.44 Paperboard Mills 3 0.67 53.11 Personal Credit Institutions 1 0.22 53.33 Petroleum Refining 1 0.22 53.56 Pharmaceutical Preparations 1 0.22 53.78 Photographic Equipment & Supplies 2 0.44 54.22 Plastic Material, Synth Resin/Rubber, C 4 0.89 55.11 Plastics Products, NEC 4 0.89 56 Printed Circuit Boards 2 0.44 56.44 Public Bldg & Related Furniture 2 0.44 56.89 Pumps & Pumping Equipment 5 1.11 58 Radio & TV Broadcasting & Communication 1 0.22 58.22 Railroad Equipment 2 0.44 58.67 Railroads, Line-Haul Operating 4 0.89 59.56 Real Estate Agents & Managers (For Othe 1 0.22 59.78 Real Estate Investment Trusts 18 4 63.78 Refuse Systems 2 0.44 64.22 Retail-Apparel & Accessory Stores 1 0.22 64.44 Retail-Auto & Home Supply Stores 1 0.22 64.67 Retail-Building Materials, Hardware, Ga 1 0.22 64.89 Retail-Catalog & Mail-Order Houses 2 0.44 65.33 Retail-Drug Stores and Proprietary Stor 1 0.22 65.56 Retail-Eating Places 7 1.56 67.11 Retail-Family Clothing Stores 3 0.67 67.78 Retail-Hobby, Toy & Game Shops 2 0.44 68.22

16
Retail-Home Furniture, Furnishings & Eq 3 0.67 68.89 Retail-Jewelry Stores 5 1.11 70 Retail-Miscellaneous Shopping Goods Sto 2 0.44 70.44 Retail-Misc General Merchandise Stores 1 0.22 70.67 Retail-Retail Stores, NEC 1 0.22 70.89 Retail-Shoe Stores 3 0.67 71.56 Retail-Variety Stores 4 0.89 72.44 Rolling Drawing & Extruding of Nonferro 4 0.89 73.33 Savings Institution, Federally Chartere 4 0.89 74.22 Sawmills & Planing Mills, General 2 0.44 74.67 Search, Detection, Navigation, Guidance 1 0.22 74.89 Security & Commodity Brokers, Dealers, 1 0.22 75.11 Security Brokers, Dealers & Flotation C 2 0.44 75.56 Semiconductors & Related Devices 7 1.56 77.11 Services-Advertising 1 0.22 77.33 Services-Advertising Agencies 1 0.22 77.56 Services-Commercial Physical & Biologic 3 0.67 78.22 Services-Computer Integrated Systems De 4 0.89 79.11 Services-Computer Processing & Data Pre 2 0.44 79.56 Services-Computer Programming, Data Pro 4 0.89 80.44 Services-Detective, Guard & Armored Car 1 0.22 80.67 Services-Educational Services 1 0.22 80.89 Services-Engineering Services 2 0.44 81.33 Services-Engineering, Accounting, Resea 1 0.22 81.56 Services-Facilities Support Management 2 0.44 82 Services-General Medical & Surgical Hos 1 0.22 82.22 Services-Help Supply Services 2 0.44 82.67 Services-Home Health Care Services 3 0.67 83.33 Services-Management Consulting Services 1 0.22 83.56 Services-Medical Laboratories 1 0.22 83.78 Services-Misc Health & Allied Services, 2 0.44 84.22 Services-Offices & Clinics of Doctors o 4 0.89 85.11 Services-Personal Services 3 0.67 85.78 Services-Prepackaged Software 5 1.11 86.89 Services-Video Tape Rental 1 0.22 87.11 Soap, Detergents, Cleaning Preparations 1 0.22 87.33 Special Industry Machinery, NEC 10 2.22 89.56 State Commercial Banks 1 0.22 89.78 Steel Pipe & Tubes 1 0.22 90 Steel Works, Blast Furnaces & Rolling & 2 0.44 90.44
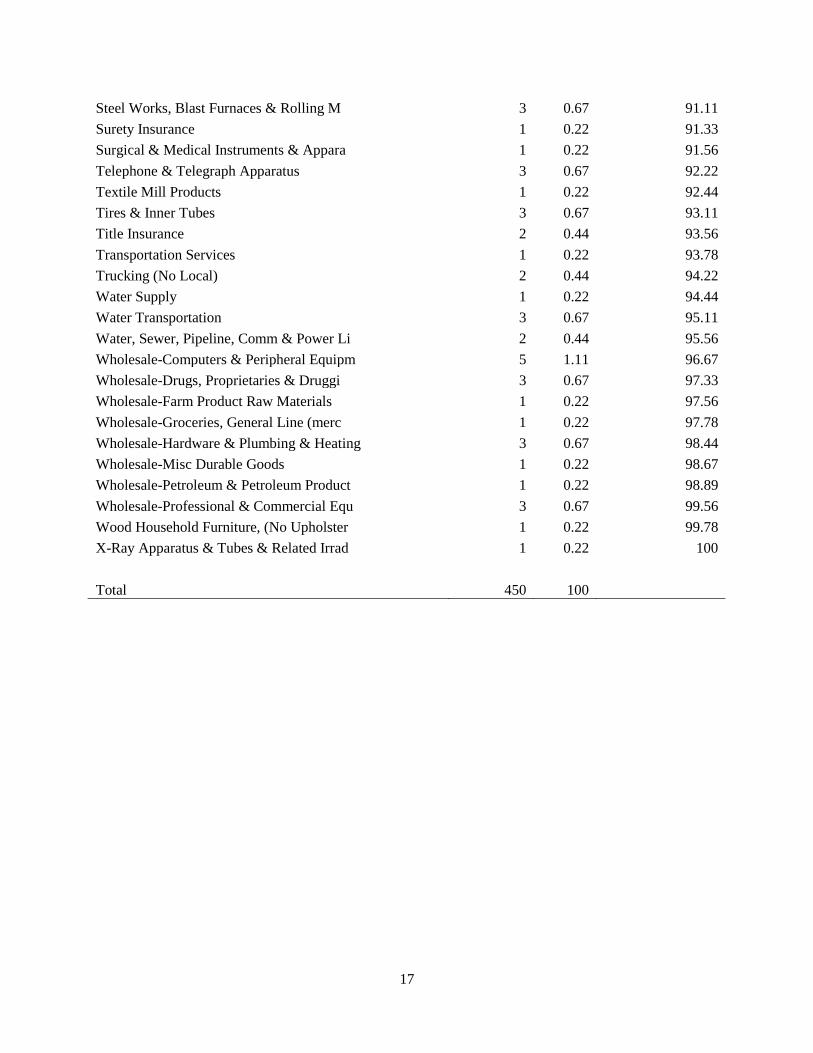
17
Steel Works, Blast Furnaces & Rolling M 3 0.67 91.11 Surety Insurance 1 0.22 91.33 Surgical & Medical Instruments & Appara 1 0.22 91.56 Telephone & Telegraph Apparatus 3 0.67 92.22 Textile Mill Products 1 0.22 92.44 Tires & Inner Tubes 3 0.67 93.11 Title Insurance 2 0.44 93.56 Transportation Services 1 0.22 93.78 Trucking (No Local) 2 0.44 94.22 Water Supply 1 0.22 94.44 Water Transportation 3 0.67 95.11 Water, Sewer, Pipeline, Comm & Power Li 2 0.44 95.56 Wholesale-Computers & Peripheral Equipm 5 1.11 96.67 Wholesale-Drugs, Proprietaries & Druggi 3 0.67 97.33 Wholesale-Farm Product Raw Materials 1 0.22 97.56 Wholesale-Groceries, General Line (merc 1 0.22 97.78 Wholesale-Hardware & Plumbing & Heating 3 0.67 98.44 Wholesale-Misc Durable Goods 1 0.22 98.67 Wholesale-Petroleum & Petroleum Product 1 0.22 98.89 Wholesale-Professional & Commercial Equ 3 0.67 99.56 Wood Household Furniture, (No Upholster 1 0.22 99.78 X-Ray Apparatus & Tubes & Related Irrad 1 0.22 100
Total 450 100
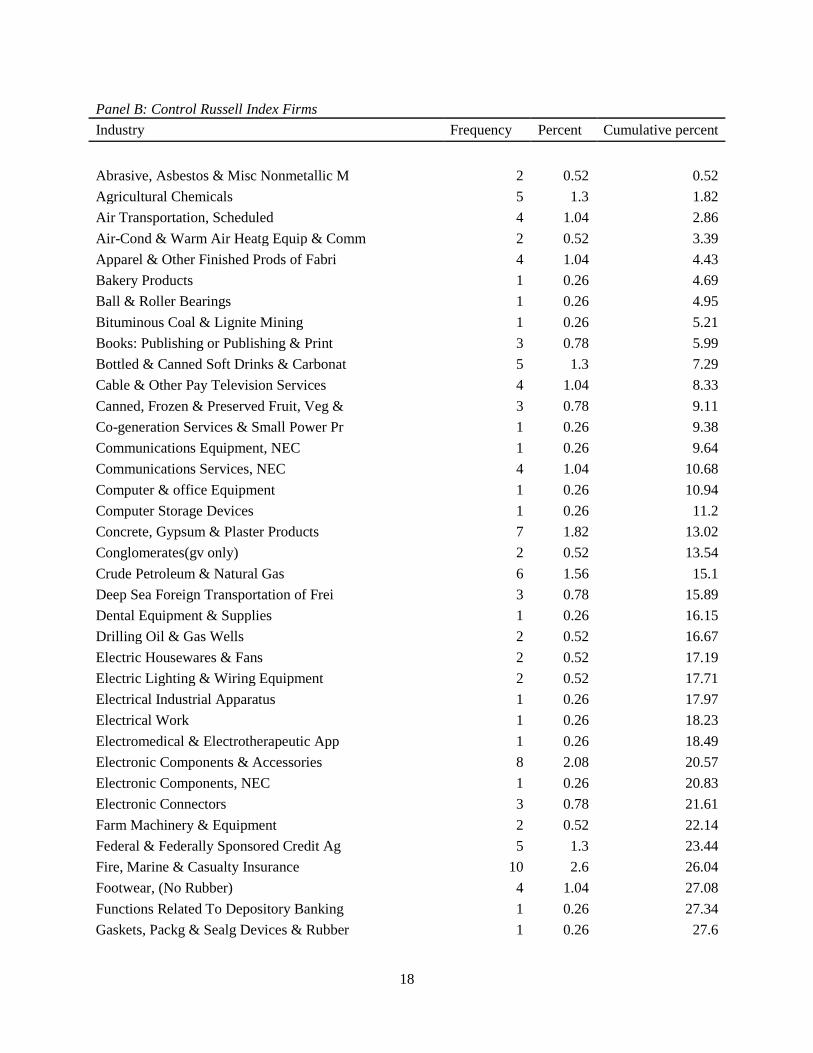
18
Panel B: Control Russell Index Firms Industry Frequency Percent Cumulative percent
Abrasive, Asbestos & Misc Nonmetallic M 2 0.52 0.52 Agricultural Chemicals 5 1.3 1.82 Air Transportation, Scheduled 4 1.04 2.86 Air-Cond & Warm Air Heatg Equip & Comm 2 0.52 3.39 Apparel & Other Finished Prods of Fabri 4 1.04 4.43 Bakery Products 1 0.26 4.69 Ball & Roller Bearings 1 0.26 4.95 Bituminous Coal & Lignite Mining 1 0.26 5.21 Books: Publishing or Publishing & Print 3 0.78 5.99 Bottled & Canned Soft Drinks & Carbonat 5 1.3 7.29 Cable & Other Pay Television Services 4 1.04 8.33 Canned, Frozen & Preserved Fruit, Veg & 3 0.78 9.11 Co-generation Services & Small Power Pr 1 0.26 9.38 Communications Equipment, NEC 1 0.26 9.64 Communications Services, NEC 4 1.04 10.68 Computer & office Equipment 1 0.26 10.94 Computer Storage Devices 1 0.26 11.2 Concrete, Gypsum & Plaster Products 7 1.82 13.02 Conglomerates(gv only) 2 0.52 13.54 Crude Petroleum & Natural Gas 6 1.56 15.1 Deep Sea Foreign Transportation of Frei 3 0.78 15.89 Dental Equipment & Supplies 1 0.26 16.15 Drilling Oil & Gas Wells 2 0.52 16.67 Electric Housewares & Fans 2 0.52 17.19 Electric Lighting & Wiring Equipment 2 0.52 17.71 Electrical Industrial Apparatus 1 0.26 17.97 Electrical Work 1 0.26 18.23 Electromedical & Electrotherapeutic App 1 0.26 18.49 Electronic Components & Accessories 8 2.08 20.57 Electronic Components, NEC 1 0.26 20.83 Electronic Connectors 3 0.78 21.61 Farm Machinery & Equipment 2 0.52 22.14 Federal & Federally Sponsored Credit Ag 5 1.3 23.44 Fire, Marine & Casualty Insurance 10 2.6 26.04 Footwear, (No Rubber) 4 1.04 27.08 Functions Related To Depository Banking 1 0.26 27.34 Gaskets, Packg & Sealg Devices & Rubber 1 0.26 27.6

19
Hazardous Waste Management 1 0.26 27.86 Hospital & Medical Service Plans 1 0.26 28.13 Hotels & Motels 1 0.26 28.39 In Vitro & In Vivo Diagnostic Substance 1 0.26 28.65 Industrial Inorganic Chemicals 3 0.78 29.43 Insurance Agents, Brokers & Service 3 0.78 30.21 Investment Advice 4 1.04 31.25 Investors, NEC 1 0.26 31.51 Laboratory Analytical Instruments 3 0.78 32.29 Land Subdividers & Developers (No Cemet 5 1.3 33.59 Life Insurance 9 2.34 35.94 Manifold Business Forms 1 0.26 36.2 Medicinal Chemicals & Botanical Product 1 0.26 36.46 Men's & Boys' Furnishings, Work Clothin 2 0.52 36.98 Metal Mining 5 1.3 38.28 Miscellaneous Electrical Machinery, Equ 1 0.26 38.54 Miscellaneous Fabricated Metal Products 2 0.52 39.06 Miscellaneous Fabricated Textile Produc 2 0.52 39.58 Miscellaneous Manufacturing Industries 3 0.78 40.36 Mortgage Bankers & Loan Correspondents 1 0.26 40.63 Motor Vehicle Parts & Accessories 1 0.26 40.89 Natural Gas Transmission 1 0.26 41.15 Newspapers: Publishing or Publishing & 5 1.3 42.45 Office Furniture (No Wood) 6 1.56 44.01 Oil & Gas Field Services, NEC 3 0.78 44.79 Operative Builders 4 1.04 45.83 Operators of Nonresidential Buildings 2 0.52 46.35 Ophthalmic Goods 2 0.52 46.88 Optical Instruments & Lenses 1 0.26 47.14 Paperboard Containers & Boxes 3 0.78 47.92 Paperboard Mills 1 0.26 48.18 Patent Owners & Lessors 5 1.3 49.48 Periodicals: Publishing or Publishing & 3 0.78 50.26 Personal Credit Institutions 2 0.52 50.78 Pharmaceutical Preparations 1 0.26 51.04 Photographic Equipment & Supplies 1 0.26 51.3 Poultry Slaughtering and Processing 4 1.04 52.34 Radio Broadcasting Stations 8 2.08 54.43 Radiotelephone Communications 9 2.34 56.77 Railroads, Line-Haul Operating 2 0.52 57.29
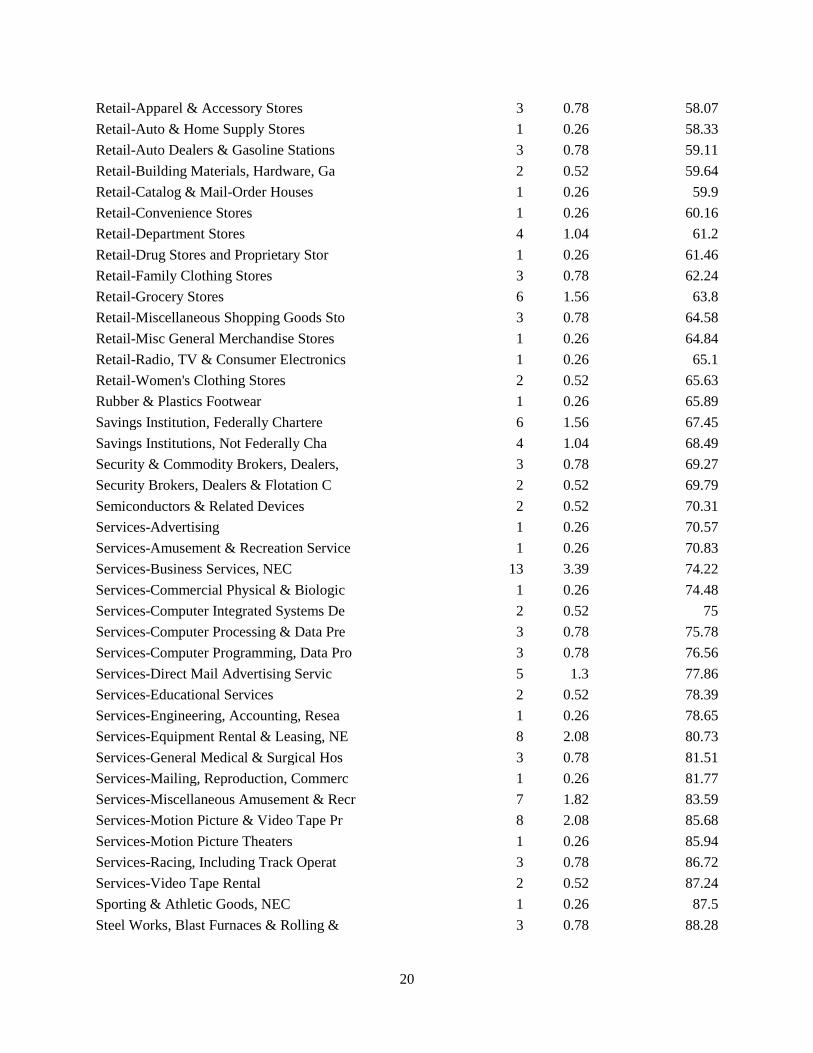
20
Retail-Apparel & Accessory Stores 3 0.78 58.07 Retail-Auto & Home Supply Stores 1 0.26 58.33 Retail-Auto Dealers & Gasoline Stations 3 0.78 59.11 Retail-Building Materials, Hardware, Ga 2 0.52 59.64 Retail-Catalog & Mail-Order Houses 1 0.26 59.9 Retail-Convenience Stores 1 0.26 60.16 Retail-Department Stores 4 1.04 61.2 Retail-Drug Stores and Proprietary Stor 1 0.26 61.46 Retail-Family Clothing Stores 3 0.78 62.24 Retail-Grocery Stores 6 1.56 63.8 Retail-Miscellaneous Shopping Goods Sto 3 0.78 64.58 Retail-Misc General Merchandise Stores 1 0.26 64.84 Retail-Radio, TV & Consumer Electronics 1 0.26 65.1 Retail-Women's Clothing Stores 2 0.52 65.63 Rubber & Plastics Footwear 1 0.26 65.89 Savings Institution, Federally Chartere 6 1.56 67.45 Savings Institutions, Not Federally Cha 4 1.04 68.49 Security & Commodity Brokers, Dealers, 3 0.78 69.27 Security Brokers, Dealers & Flotation C 2 0.52 69.79 Semiconductors & Related Devices 2 0.52 70.31 Services-Advertising 1 0.26 70.57 Services-Amusement & Recreation Service 1 0.26 70.83 Services-Business Services, NEC 13 3.39 74.22 Services-Commercial Physical & Biologic 1 0.26 74.48 Services-Computer Integrated Systems De 2 0.52 75 Services-Computer Processing & Data Pre 3 0.78 75.78 Services-Computer Programming, Data Pro 3 0.78 76.56 Services-Direct Mail Advertising Servic 5 1.3 77.86 Services-Educational Services 2 0.52 78.39 Services-Engineering, Accounting, Resea 1 0.26 78.65 Services-Equipment Rental & Leasing, NE 8 2.08 80.73 Services-General Medical & Surgical Hos 3 0.78 81.51 Services-Mailing, Reproduction, Commerc 1 0.26 81.77 Services-Miscellaneous Amusement & Recr 7 1.82 83.59 Services-Motion Picture & Video Tape Pr 8 2.08 85.68 Services-Motion Picture Theaters 1 0.26 85.94 Services-Racing, Including Track Operat 3 0.78 86.72 Services-Video Tape Rental 2 0.52 87.24 Sporting & Athletic Goods, NEC 1 0.26 87.5 Steel Works, Blast Furnaces & Rolling & 3 0.78 88.28

21
Steel Works, Blast Furnaces & Rolling M 1 0.26 88.54 Sugar & Confectionery Products 6 1.56 90.1 Telephone & Telegraph Apparatus 1 0.26 90.36 Telephone Communications (No Radiotelep 2 0.52 90.89 Television Broadcasting Stations 12 3.13 94.01 Tires & Inner Tubes 1 0.26 94.27 Transportation Services 1 0.26 94.53 Trucking (No Local) 5 1.3 95.83 Watches, Clocks, Clockwork Operated Dev 1 0.26 96.09 Water, Sewer, Pipeline, Comm & Power Li 1 0.26 96.35 Wholesale-Computers & Peripheral Equipm 2 0.52 96.88 Wholesale-Drugs, Proprietaries & Druggi 1 0.26 97.14 Wholesale-Industrial Machinery & Equipm 6 1.56 98.7 Wholesale-Medical, Dental & Hospital Eq 1 0.26 98.96 Wholesale-Paper & Paper Products 1 0.26 99.22 Wholesale-Professional & Commercial Equ 1 0.26 99.48 Women's, Misses', and Juniors Outerwear 1 0.26 99.74 Wood Household Furniture, (No Upholster 1 0.26 100
Total 384 100
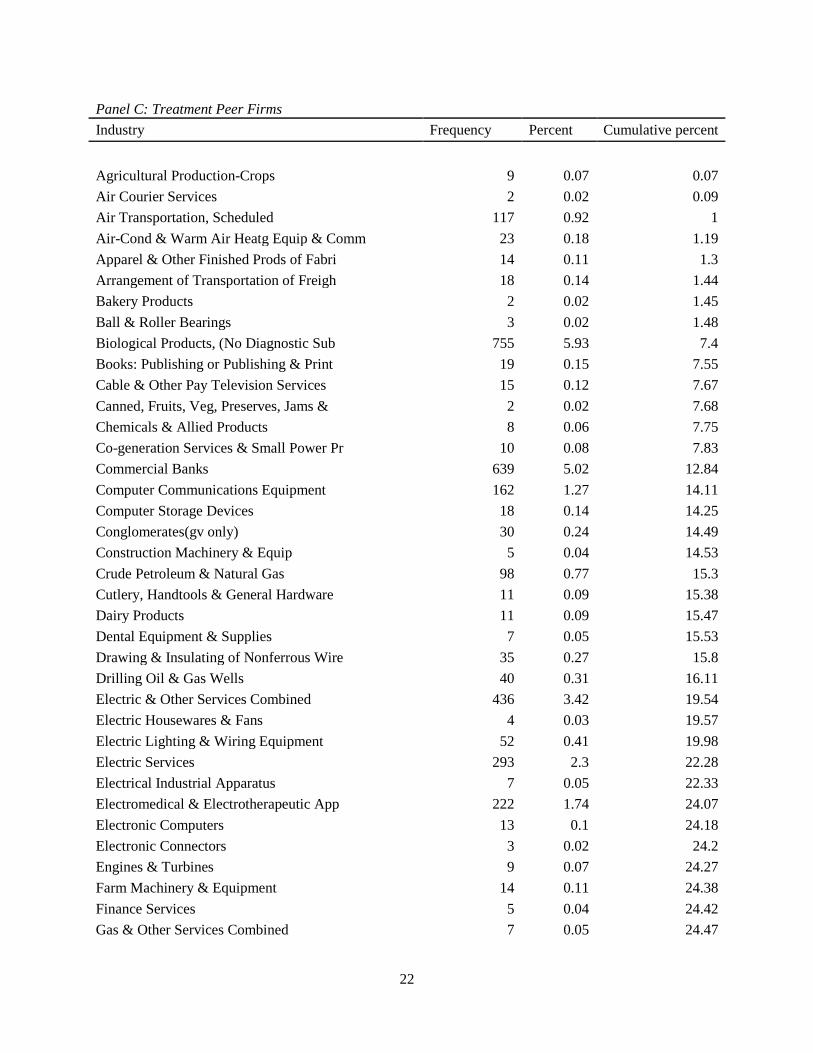
22
Panel C: Treatment Peer Firms Industry Frequency Percent Cumulative percent
Agricultural Production-Crops 9 0.07 0.07 Air Courier Services 2 0.02 0.09 Air Transportation, Scheduled 117 0.92 1 Air-Cond & Warm Air Heatg Equip & Comm 23 0.18 1.19 Apparel & Other Finished Prods of Fabri 14 0.11 1.3 Arrangement of Transportation of Freigh 18 0.14 1.44 Bakery Products 2 0.02 1.45 Ball & Roller Bearings 3 0.02 1.48 Biological Products, (No Diagnostic Sub 755 5.93 7.4 Books: Publishing or Publishing & Print 19 0.15 7.55 Cable & Other Pay Television Services 15 0.12 7.67 Canned, Fruits, Veg, Preserves, Jams & 2 0.02 7.68 Chemicals & Allied Products 8 0.06 7.75 Co-generation Services & Small Power Pr 10 0.08 7.83 Commercial Banks 639 5.02 12.84 Computer Communications Equipment 162 1.27 14.11 Computer Storage Devices 18 0.14 14.25 Conglomerates(gv only) 30 0.24 14.49 Construction Machinery & Equip 5 0.04 14.53 Crude Petroleum & Natural Gas 98 0.77 15.3 Cutlery, Handtools & General Hardware 11 0.09 15.38 Dairy Products 11 0.09 15.47 Dental Equipment & Supplies 7 0.05 15.53 Drawing & Insulating of Nonferrous Wire 35 0.27 15.8 Drilling Oil & Gas Wells 40 0.31 16.11 Electric & Other Services Combined 436 3.42 19.54 Electric Housewares & Fans 4 0.03 19.57 Electric Lighting & Wiring Equipment 52 0.41 19.98 Electric Services 293 2.3 22.28 Electrical Industrial Apparatus 7 0.05 22.33 Electromedical & Electrotherapeutic App 222 1.74 24.07 Electronic Computers 13 0.1 24.18 Electronic Connectors 3 0.02 24.2 Engines & Turbines 9 0.07 24.27 Farm Machinery & Equipment 14 0.11 24.38 Finance Services 5 0.04 24.42 Gas & Other Services Combined 7 0.05 24.47
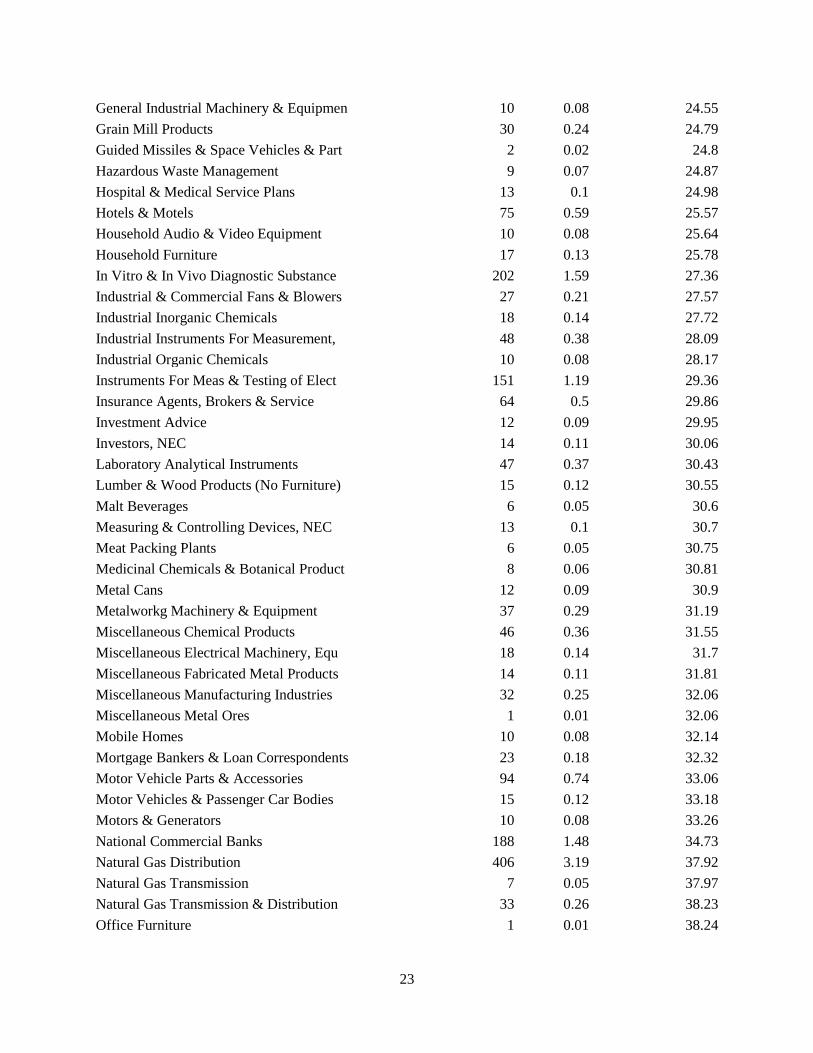
23
General Industrial Machinery & Equipmen 10 0.08 24.55 Grain Mill Products 30 0.24 24.79 Guided Missiles & Space Vehicles & Part 2 0.02 24.8 Hazardous Waste Management 9 0.07 24.87 Hospital & Medical Service Plans 13 0.1 24.98 Hotels & Motels 75 0.59 25.57 Household Audio & Video Equipment 10 0.08 25.64 Household Furniture 17 0.13 25.78 In Vitro & In Vivo Diagnostic Substance 202 1.59 27.36 Industrial & Commercial Fans & Blowers 27 0.21 27.57 Industrial Inorganic Chemicals 18 0.14 27.72 Industrial Instruments For Measurement, 48 0.38 28.09 Industrial Organic Chemicals 10 0.08 28.17 Instruments For Meas & Testing of Elect 151 1.19 29.36 Insurance Agents, Brokers & Service 64 0.5 29.86 Investment Advice 12 0.09 29.95 Investors, NEC 14 0.11 30.06 Laboratory Analytical Instruments 47 0.37 30.43 Lumber & Wood Products (No Furniture) 15 0.12 30.55 Malt Beverages 6 0.05 30.6 Measuring & Controlling Devices, NEC 13 0.1 30.7 Meat Packing Plants 6 0.05 30.75 Medicinal Chemicals & Botanical Product 8 0.06 30.81 Metal Cans 12 0.09 30.9 Metalworkg Machinery & Equipment 37 0.29 31.19 Miscellaneous Chemical Products 46 0.36 31.55 Miscellaneous Electrical Machinery, Equ 18 0.14 31.7 Miscellaneous Fabricated Metal Products 14 0.11 31.81 Miscellaneous Manufacturing Industries 32 0.25 32.06 Miscellaneous Metal Ores 1 0.01 32.06 Mobile Homes 10 0.08 32.14 Mortgage Bankers & Loan Correspondents 23 0.18 32.32 Motor Vehicle Parts & Accessories 94 0.74 33.06 Motor Vehicles & Passenger Car Bodies 15 0.12 33.18 Motors & Generators 10 0.08 33.26 National Commercial Banks 188 1.48 34.73 Natural Gas Distribution 406 3.19 37.92 Natural Gas Transmission 7 0.05 37.97 Natural Gas Transmission & Distribution 33 0.26 38.23 Office Furniture 1 0.01 38.24

24
Oil & Gas Field Exploration Services 7 0.05 38.3 Oil & Gas Field Machinery & Equipment 30 0.24 38.53 Oil & Gas Field Services, NEC 14 0.11 38.64 Operative Builders 125 0.98 39.62 Operators of Nonresidential Buildings 12 0.09 39.72 Ophthalmic Goods 6 0.05 39.76 Orthopedic, Prosthetic & Surgical Appli 236 1.85 41.62 Paints, Varnishes, Lacquers, Enamels & 5 0.04 41.66 Paper Mills 23 0.18 41.84 Paperboard Mills 20 0.16 41.99 Personal Credit Institutions 9 0.07 42.06 Petroleum Refining 24 0.19 42.25 Pharmaceutical Preparations 126 0.99 43.24 Photographic Equipment & Supplies 23 0.18 43.42 Plastic Material, Synth Resin/Rubber, C 15 0.12 43.54 Plastics Products, NEC 73 0.57 44.11 Printed Circuit Boards 37 0.29 44.4 Public Bldg & Related Furniture 7 0.05 44.46 Pumps & Pumping Equipment 18 0.14 44.6 Radio & TV Broadcasting & Communication 61 0.48 45.08 Railroad Equipment 4 0.03 45.11 Railroads, Line-Haul Operating 39 0.31 45.42 Real Estate Agents & Managers (For Othe 3 0.02 45.44 Real Estate Investment Trusts 2,408 18.9 64.34 Refuse Systems 14 0.11 64.45 Retail-Apparel & Accessory Stores 6 0.05 64.5 Retail-Auto & Home Supply Stores 4 0.03 64.53 Retail-Building Materials, Hardware, Ga 1 0.01 64.54 Retail-Catalog & Mail-Order Houses 50 0.39 64.93 Retail-Drug Stores and Proprietary Stor 9 0.07 65 Retail-Eating Places 393 3.08 68.08 Retail-Family Clothing Stores 49 0.38 68.47 Retail-Hobby, Toy & Game Shops 5 0.04 68.51 Retail-Home Furniture, Furnishings & Eq 15 0.12 68.63 Retail-Jewelry Stores 34 0.27 68.89 Retail-Miscellaneous Shopping Goods Sto 22 0.17 69.07 Retail-Misc General Merchandise Stores 3 0.02 69.09 Retail-Retail Stores, NEC 8 0.06 69.15 Retail-Shoe Stores 16 0.13 69.28 Retail-Variety Stores 51 0.4 69.68
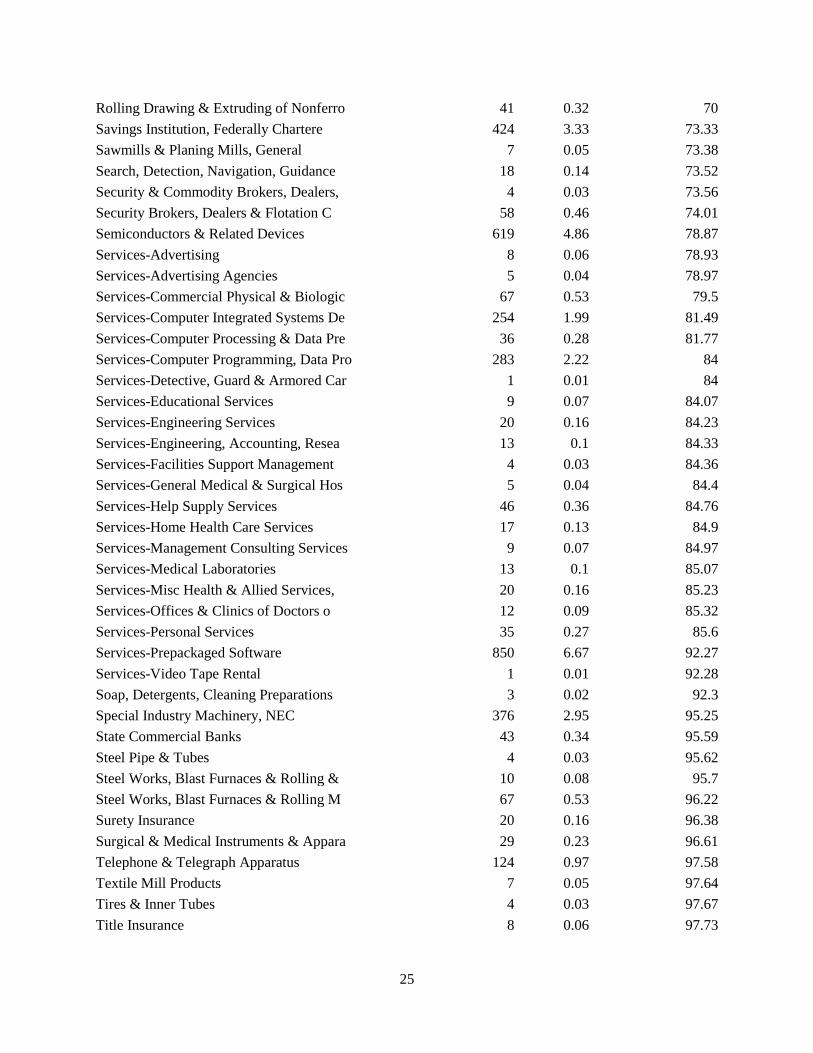
25
Rolling Drawing & Extruding of Nonferro 41 0.32 70 Savings Institution, Federally Chartere 424 3.33 73.33 Sawmills & Planing Mills, General 7 0.05 73.38 Search, Detection, Navigation, Guidance 18 0.14 73.52 Security & Commodity Brokers, Dealers, 4 0.03 73.56 Security Brokers, Dealers & Flotation C 58 0.46 74.01 Semiconductors & Related Devices 619 4.86 78.87 Services-Advertising 8 0.06 78.93 Services-Advertising Agencies 5 0.04 78.97 Services-Commercial Physical & Biologic 67 0.53 79.5 Services-Computer Integrated Systems De 254 1.99 81.49 Services-Computer Processing & Data Pre 36 0.28 81.77 Services-Computer Programming, Data Pro 283 2.22 84 Services-Detective, Guard & Armored Car 1 0.01 84 Services-Educational Services 9 0.07 84.07 Services-Engineering Services 20 0.16 84.23 Services-Engineering, Accounting, Resea 13 0.1 84.33 Services-Facilities Support Management 4 0.03 84.36 Services-General Medical & Surgical Hos 5 0.04 84.4 Services-Help Supply Services 46 0.36 84.76 Services-Home Health Care Services 17 0.13 84.9 Services-Management Consulting Services 9 0.07 84.97 Services-Medical Laboratories 13 0.1 85.07 Services-Misc Health & Allied Services, 20 0.16 85.23 Services-Offices & Clinics of Doctors o 12 0.09 85.32 Services-Personal Services 35 0.27 85.6 Services-Prepackaged Software 850 6.67 92.27 Services-Video Tape Rental 1 0.01 92.28 Soap, Detergents, Cleaning Preparations 3 0.02 92.3 Special Industry Machinery, NEC 376 2.95 95.25 State Commercial Banks 43 0.34 95.59 Steel Pipe & Tubes 4 0.03 95.62 Steel Works, Blast Furnaces & Rolling & 10 0.08 95.7 Steel Works, Blast Furnaces & Rolling M 67 0.53 96.22 Surety Insurance 20 0.16 96.38 Surgical & Medical Instruments & Appara 29 0.23 96.61 Telephone & Telegraph Apparatus 124 0.97 97.58 Textile Mill Products 7 0.05 97.64 Tires & Inner Tubes 4 0.03 97.67 Title Insurance 8 0.06 97.73
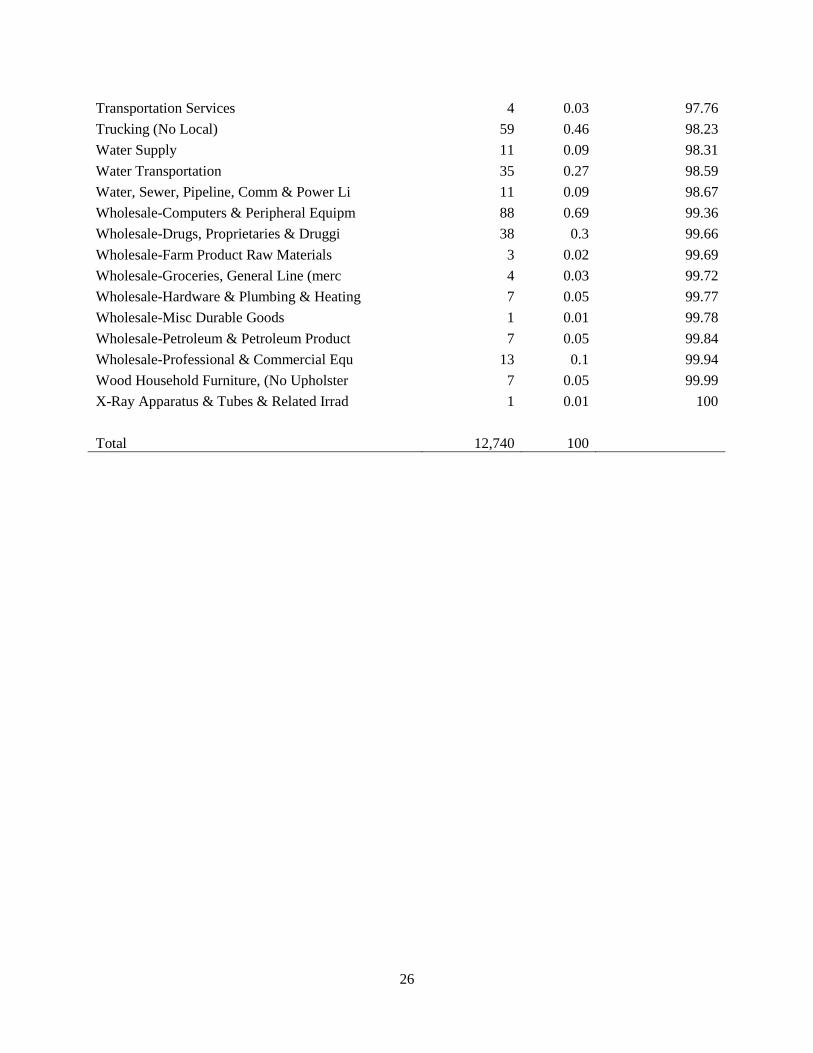
26
Transportation Services 4 0.03 97.76 Trucking (No Local) 59 0.46 98.23 Water Supply 11 0.09 98.31 Water Transportation 35 0.27 98.59 Water, Sewer, Pipeline, Comm & Power Li 11 0.09 98.67 Wholesale-Computers & Peripheral Equipm 88 0.69 99.36 Wholesale-Drugs, Proprietaries & Druggi 38 0.3 99.66 Wholesale-Farm Product Raw Materials 3 0.02 99.69 Wholesale-Groceries, General Line (merc 4 0.03 99.72 Wholesale-Hardware & Plumbing & Heating 7 0.05 99.77 Wholesale-Misc Durable Goods 1 0.01 99.78 Wholesale-Petroleum & Petroleum Product 7 0.05 99.84 Wholesale-Professional & Commercial Equ 13 0.1 99.94 Wood Household Furniture, (No Upholster 7 0.05 99.99 X-Ray Apparatus & Tubes & Related Irrad 1 0.01 100
Total 12,740 100

27
Panel D: Control Peer Firms Industry Frequency Percent Cumulative percent
Abrasive, Asbestos & Misc Nonmetallic M 9 0.12 0.12 Agricultural Chemicals 53 0.74 0.86 Air Transportation, Scheduled 97 1.35 2.21 Air-Cond & Warm Air Heatg Equip & Comm 15 0.21 2.41 Apparel & Other Finished Prods of Fabri 57 0.79 3.2 Bakery Products 2 0.03 3.23 Ball & Roller Bearings 4 0.06 3.29 Bituminous Coal & Lignite Mining 1 0.01 3.3 Books: Publishing or Publishing & Print 16 0.22 3.52 Bottled & Canned Soft Drinks & Carbonat 51 0.71 4.23 Cable & Other Pay Television Services 44 0.61 4.84 Canned, Frozen & Preserved Fruit, Veg & 23 0.32 5.16 Co-generation Services & Small Power Pr 4 0.06 5.22 Communications Equipment, NEC 15 0.21 5.42 Communications Services, NEC 50 0.69 6.12 Computer & office Equipment 2 0.03 6.15 Computer Storage Devices 23 0.32 6.47 Concrete, Gypsum & Plaster Products 48 0.67 7.13 Conglomerates(gv only) 23 0.32 7.45 Crude Petroleum & Natural Gas 675 9.36 16.81 Deep Sea Foreign Transportation of Frei 31 0.43 17.24 Dental Equipment & Supplies 8 0.11 17.36 Drilling Oil & Gas Wells 39 0.54 17.9 Electric Housewares & Fans 8 0.11 18.01 Electric Lighting & Wiring Equipment 30 0.42 18.42 Electrical Industrial Apparatus 9 0.12 18.55 Electrical Work 2 0.03 18.58 Electromedical & Electrotherapeutic App 65 0.9 19.48 Electronic Components & Accessories 60 0.83 20.31 Electronic Components, NEC 23 0.32 20.63 Electronic Connectors 12 0.17 20.8 Farm Machinery & Equipment 16 0.22 21.02 Federal & Federally Sponsored Credit Ag 21 0.29 21.31 Fire, Marine & Casualty Insurance 639 8.87 30.17 Footwear, (No Rubber) 53 0.74 30.91 Functions Related To Depository Banking 8 0.11 31.02 Gaskets, Packg & Sealg Devices & Rubber 3 0.04 31.06
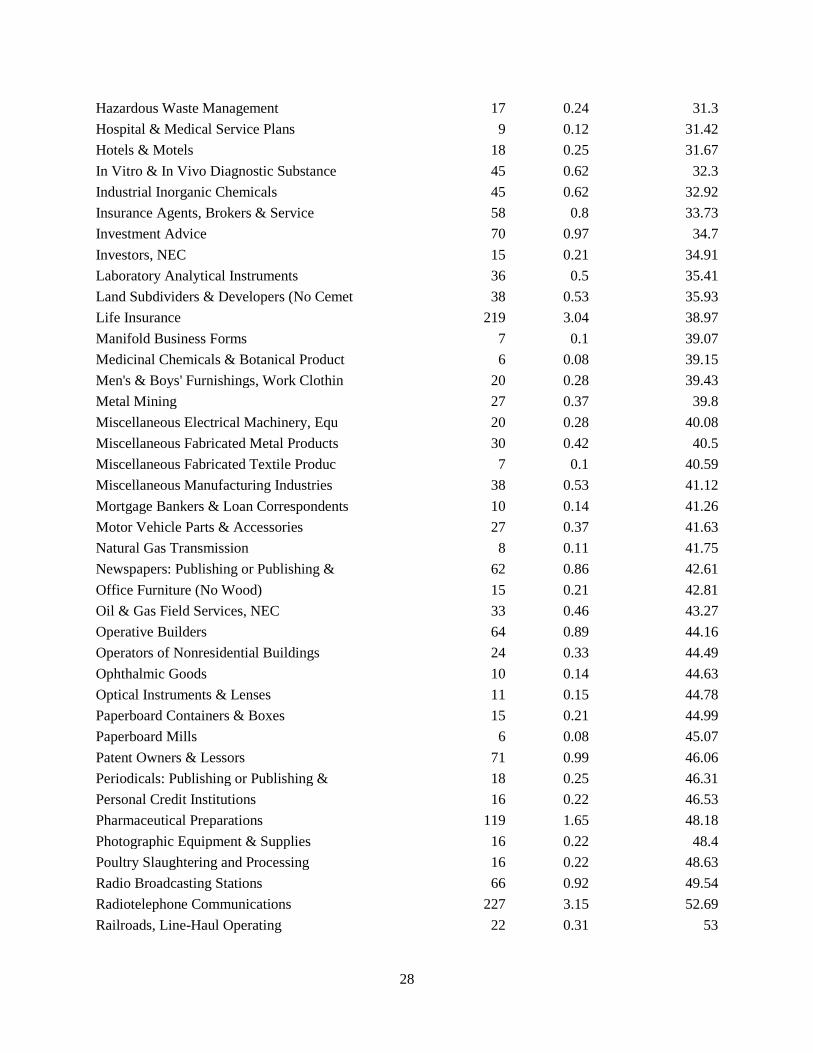
28
Hazardous Waste Management 17 0.24 31.3 Hospital & Medical Service Plans 9 0.12 31.42 Hotels & Motels 18 0.25 31.67 In Vitro & In Vivo Diagnostic Substance 45 0.62 32.3 Industrial Inorganic Chemicals 45 0.62 32.92 Insurance Agents, Brokers & Service 58 0.8 33.73 Investment Advice 70 0.97 34.7 Investors, NEC 15 0.21 34.91 Laboratory Analytical Instruments 36 0.5 35.41 Land Subdividers & Developers (No Cemet 38 0.53 35.93 Life Insurance 219 3.04 38.97 Manifold Business Forms 7 0.1 39.07 Medicinal Chemicals & Botanical Product 6 0.08 39.15 Men's & Boys' Furnishings, Work Clothin 20 0.28 39.43 Metal Mining 27 0.37 39.8 Miscellaneous Electrical Machinery, Equ 20 0.28 40.08 Miscellaneous Fabricated Metal Products 30 0.42 40.5 Miscellaneous Fabricated Textile Produc 7 0.1 40.59 Miscellaneous Manufacturing Industries 38 0.53 41.12 Mortgage Bankers & Loan Correspondents 10 0.14 41.26 Motor Vehicle Parts & Accessories 27 0.37 41.63 Natural Gas Transmission 8 0.11 41.75 Newspapers: Publishing or Publishing & 62 0.86 42.61 Office Furniture (No Wood) 15 0.21 42.81 Oil & Gas Field Services, NEC 33 0.46 43.27 Operative Builders 64 0.89 44.16 Operators of Nonresidential Buildings 24 0.33 44.49 Ophthalmic Goods 10 0.14 44.63 Optical Instruments & Lenses 11 0.15 44.78 Paperboard Containers & Boxes 15 0.21 44.99 Paperboard Mills 6 0.08 45.07 Patent Owners & Lessors 71 0.99 46.06 Periodicals: Publishing or Publishing & 18 0.25 46.31 Personal Credit Institutions 16 0.22 46.53 Pharmaceutical Preparations 119 1.65 48.18 Photographic Equipment & Supplies 16 0.22 48.4 Poultry Slaughtering and Processing 16 0.22 48.63 Radio Broadcasting Stations 66 0.92 49.54 Radiotelephone Communications 227 3.15 52.69 Railroads, Line-Haul Operating 22 0.31 53
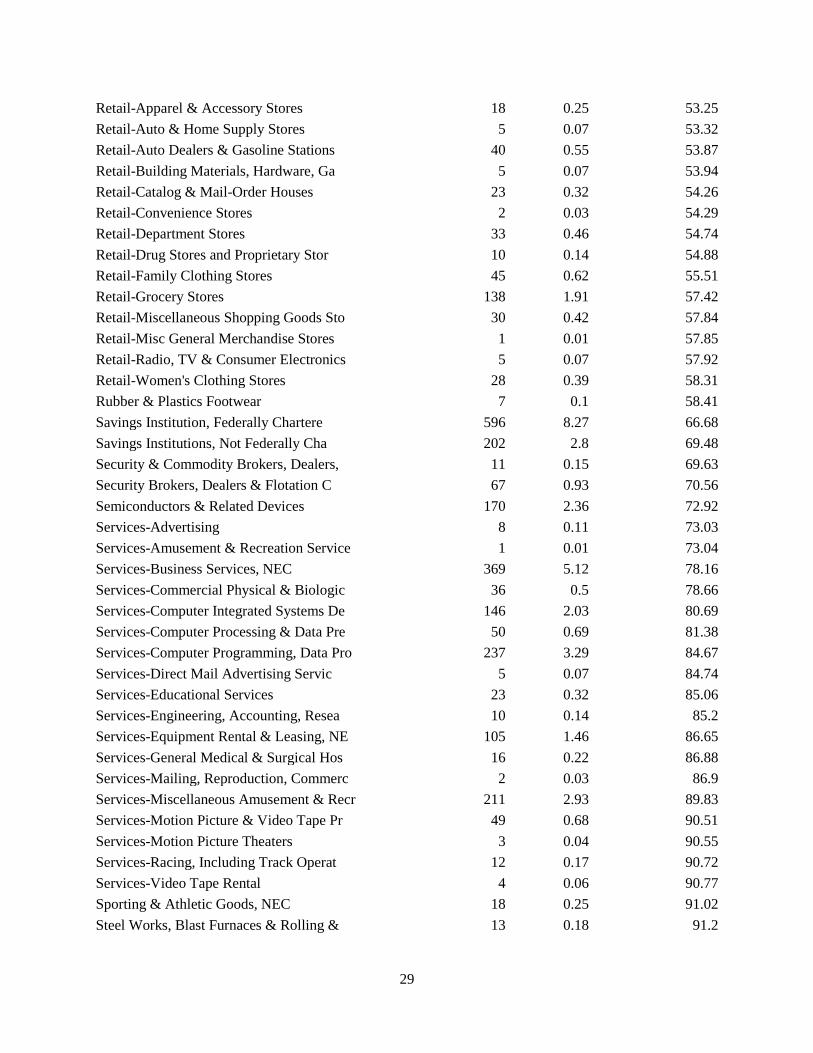
29
Retail-Apparel & Accessory Stores 18 0.25 53.25 Retail-Auto & Home Supply Stores 5 0.07 53.32 Retail-Auto Dealers & Gasoline Stations 40 0.55 53.87 Retail-Building Materials, Hardware, Ga 5 0.07 53.94 Retail-Catalog & Mail-Order Houses 23 0.32 54.26 Retail-Convenience Stores 2 0.03 54.29 Retail-Department Stores 33 0.46 54.74 Retail-Drug Stores and Proprietary Stor 10 0.14 54.88 Retail-Family Clothing Stores 45 0.62 55.51 Retail-Grocery Stores 138 1.91 57.42 Retail-Miscellaneous Shopping Goods Sto 30 0.42 57.84 Retail-Misc General Merchandise Stores 1 0.01 57.85 Retail-Radio, TV & Consumer Electronics 5 0.07 57.92 Retail-Women's Clothing Stores 28 0.39 58.31 Rubber & Plastics Footwear 7 0.1 58.41 Savings Institution, Federally Chartere 596 8.27 66.68 Savings Institutions, Not Federally Cha 202 2.8 69.48 Security & Commodity Brokers, Dealers, 11 0.15 69.63 Security Brokers, Dealers & Flotation C 67 0.93 70.56 Semiconductors & Related Devices 170 2.36 72.92 Services-Advertising 8 0.11 73.03 Services-Amusement & Recreation Service 1 0.01 73.04 Services-Business Services, NEC 369 5.12 78.16 Services-Commercial Physical & Biologic 36 0.5 78.66 Services-Computer Integrated Systems De 146 2.03 80.69 Services-Computer Processing & Data Pre 50 0.69 81.38 Services-Computer Programming, Data Pro 237 3.29 84.67 Services-Direct Mail Advertising Servic 5 0.07 84.74 Services-Educational Services 23 0.32 85.06 Services-Engineering, Accounting, Resea 10 0.14 85.2 Services-Equipment Rental & Leasing, NE 105 1.46 86.65 Services-General Medical & Surgical Hos 16 0.22 86.88 Services-Mailing, Reproduction, Commerc 2 0.03 86.9 Services-Miscellaneous Amusement & Recr 211 2.93 89.83 Services-Motion Picture & Video Tape Pr 49 0.68 90.51 Services-Motion Picture Theaters 3 0.04 90.55 Services-Racing, Including Track Operat 12 0.17 90.72 Services-Video Tape Rental 4 0.06 90.77 Sporting & Athletic Goods, NEC 18 0.25 91.02 Steel Works, Blast Furnaces & Rolling & 13 0.18 91.2
30
Steel Works, Blast Furnaces & Rolling M 29 0.4 91.61 Sugar & Confectionery Products 36 0.5 92.11 Telephone & Telegraph Apparatus 35 0.49 92.59 Telephone Communications (No Radiotelep 122 1.69 94.28 Television Broadcasting Stations 189 2.62 96.91 Tires & Inner Tubes 2 0.03 96.93 Transportation Services 4 0.06 96.99 Trucking (No Local) 104 1.44 98.43 Watches, Clocks, Clockwork Operated Dev 1 0.01 98.45 Water, Sewer, Pipeline, Comm & Power Li 5 0.07 98.52 Wholesale-Computers & Peripheral Equipm 39 0.54 99.06 Wholesale-Drugs, Proprietaries & Druggi 14 0.19 99.25 Wholesale-Industrial Machinery & Equipm 25 0.35 99.6 Wholesale-Medical, Dental & Hospital Eq 9 0.12 99.72 Wholesale-Paper & Paper Products 3 0.04 99.76 Wholesale-Professional & Commercial Equ 4 0.06 99.82 Women's, Misses', and Juniors Outerwear 8 0.11 99.93 Wood Household Furniture, (No Upholster 5 0.07 100
Total 7,208 100