Embed Size (px)
Citation preview

INSTITUTIONAL EQUITY RESEARCH
Page | 1 | PHILLIPCAPITAL INDIA RESEARCH
PhillipCapital – Market Intelligence
Markets rally, FIIs return, and consolidation heats up
INDIA | STRATEGY | Monthly Update
8 March 2017
Market commentary: Nifty was up 2.6% mom (vs. 2.8% MSCI EM) in February as investors digested a largely balanced FY18 Union Budget, no rate cut from the RBI, and modestly better-than-expected 3QFY17 results. Nifty has now rallied 9.4% YTD and trades at 17x one-year forward PE (at a significant premium to other emerging markets and Asia ex-Japan). IT, pharma, media, and realty outperformed mom, while autos underperformed. Flows update: DIIs to the rescue Since demonetisation, DIIs have added a total of US$ 4.4bn in equities, while FIIs have actually seen an outflow of close to US$ 2.1bn. However, the FII outflow trend stabilised somewhat in February with total FII flows exceeding DII (FII flow totaled US$ 1.5bn in Feb vs. DII US$ 165mn). India was the top destination for FII flows in Feb vs. other Asian EM peers, which mostly saw outflows (except South Korea). Key themes to play: Value unlocking and synergies Current market conditions (higher corporate cash balances, subdued top line growth, and peaking valuations) appear conducive for market consolidation and increased buyback activity. Against this backdrop, we have come up with a list of potential M&A candidates (includes companies where our analysts see
a higher probability of M&A (or disinvestments). Top picks: JSW Steel, NIIT Technologies, and Finolex Cables. 3QFY17: Solid performance despite demonetisation The quarter’s results were ahead of our expectations, but most of the outperformance can be attributed to the low base effect in metals and capital goods. PC universe’s sales were +9% yoy vs. estimated -4.5%; +1.5% qoq. PAT was up 21% yoy largely in line with our expectations of 18%; -2.4% qoq. Stocks that beat our expectations — IndusInd Bank, Bharat Financial, Glenmark, Biocon, Castrol India, JSW Steel, Tata Steel, Tech Mahindra, NCC, Ashoka Buildcon, Crompton Greaves, VA Tech Wabag, and Apollo Tyres. For further details, refer to our 3QFY17 review. Sector strategy & top ideas at this juncture We recommend being overweight on media, telecom, metals & mining, financials and cement. We are underweight on autos, IT, pharma, cap goods, and oil & gas. Our top 10 ideas: Vedanta, Tata Steel, Bharti Airtel, IRB Infra, HCC, ITC, ZEEL, Titan, Escorts, VA Tech.
Aashima Mutneja, CFA (+91 22 66679974) [email protected]
Naveen Kulkarni, CFA, FRM (+91 22 66679947) [email protected]

Page | 2 | PHILLIPCAPITAL INDIA RESEARCH
MARKET INTELLIGENCE MONTHLY UPDATE
INDEX
Key theme in focus – M&A ............................................................................................................................... 3
Sector strategy & top picks
PC Top 10 stock ideas ............................................................................................................................ 5-7
Market performance & valuations
Global Indices Performance ................................................................................................................. 9
NIFTY Valuations .................................................................................................................................. 10
Global Valuations ................................................................................................................................. 11
Sector Performance ............................................................................................................................. 12
Sector Valuations ................................................................................................................................. 14-15
BSE500 Top Gainers & Losers .............................................................................................................. 16-17
Styles Performance .............................................................................................................................. 18
Styles Valuations .................................................................................................................................. 19
FII & DII analysis
Flows Update ....................................................................................................................................... 21
Macro & market indicators
Macro Indicators – Global ................................................................................................................... 23
Macro Indicators – India ...................................................................................................................... 24
Market Indicators ................................................................................................................................ 25
Commodities Tracker ........................................................................................................................... 26
Model Portfolio .................................................................................................................................... 27

Page | 3 | PHILLIPCAPITAL INDIA RESEARCH
MARKET INTELLIGENCE MONTHLY UPDATE
Key theme – Position for increased buyback/M&A activity. How to play? Focus on our potential M&A candidates screen
Recent corporate actions NIFTY Buybacks + Dividends as a % of earnings have been rising steadily
Deal Sector Corporate
Action
Announcement
Date
Comments
Idea-Vodafone Merger Telecom M&A 06-02-2017 Announced
TCS Sharebuyback IT Buyback 21-02-2017 Announced
Bharti Airtel-Telenor Telecom Acquisition 23-02-2017 Announced
ONGC - HPCL Oil & Gas Merge 26-02-2017 Not confirmed
by mgmt
Rcom-Aircel-MTSI-Tata
Teleservices Telecom Merge 15-09-2016 In progress
ACC-Ambuja Cement Cement M&A 05-02-2017 Not confirmed
by mgmt
NIFTY cash on balance sheet has seen growth as well List of potential M&A candidates under PC coverage
Company Sector M&A Prob, Comments
Mahindra CIE Automobiles 10% Exploring inorganic growth opportunities
NIIT Technologies IT Services 10% Potential acquirers: TCS, Infy, HCL, Wipro, TechM, Mindtree
Persistent Systems IT Services 10% Potential acquirers: TCS, Infy, HCL, Wipro, TechM, Mindtree
KPIT Technologies IT Services 10% Potential acquirers: TCS, Infy, HCL, Wipro, TechM, Mindtree
SAIL Metals 20% Looking at selling some smaller downstream steel units
Tata Steel Metals 20% Looking for a JV in Europe
JSW Steel Metals 15% Looking to add capacities inorganically
Jindal Steel & Power Ltd Metals 20% Looking to sell various steel and power assets
Finolex Cables Ltd Electricals 10% Looking to acquire smaller companies in consumer durables/appliances space
V‐Guard Industries Ltd Electricals 10% Looking to acquire smaller companies in consumer durables/appliances space
Escorts Ltd Automobiles 10% May look at some inorganic growth in railways
Source: RBI, PhillipCapital India Research
0%
5%
10%
15%
20%
25%
30%
35%
2007 2008 2009 2010 2011 2012 2013 2014 2015 2016
Buyback + Dividends/Earnings LTA
-0.1
0.0
0.1
0.2
0.3
0.4
0
200
400
600
800
1000
1200
1400
1600
2007 2008 2009 2010 2011 2012 2013 2014 2015 2016
Cash on Balance Sheet % Yoy Growth

Page | 4 | PHILLIPCAPITAL INDIA RESEARCH
MARKET INTELLIGENCE MONTHLY UPDATE
PHILLIPCAPITAL – MARKET INTELLEGENCE
Sector Strategy & Top Picks

Page | 5 | PHILLIPCAPITAL INDIA RESEARCH
MARKET INTELLIGENCE MONTHLY UPDATE
PC top-10 stock ideas
METALS & MINING - Overweight Tata Steel TATA IN | RATING: Buy | CMP: Rs 495 | TARGET: Rs 600 | UPSIDE: 21%
Domestic volume growth led by ramp up at Kalinganagar along with higher prices of steel and ferro alloys will drive domestic profitability.
Anti-dumping duty on Chinese/Russian imports into EU and expansion has helped improve profitability. Annual contract price revision (25% of shipments) will drive profitability from FY18.
Tata Steel Europe has sold two of its highest loss-making segments – (1) long-products business in Europe (LPE), which involved Scunthorpe, and (2) its speciality steel business for £ 100mn. These have helped stem the cash burn.
Unions in the UK have voted in favour of proposed changes in pension schemes – to defined contribution from defined benefit – which will lead to further cost savings.
Next triggers: Resolution of pension liabilities (discussions with regulators are on) and a JV with Thyssenkrupp.
Vedanta VEDL IN | RATING: Buy | CMP: Rs 270| TARGET: Rs 300 | UPSIDE: 11%
Better commodity price environment has helped Vedanta across segments. Higher zinc prices will give the biggest delta to profitability.
Asset sweating in its aluminium and power business will drive profitability further, in tandem with higher commodity prices.
Oil and copper businesses are likely to deliver stable performance, thereby supporting overall profitability.
Cairn merger will improve the much required cash fungibility, helping lower finance costs.
MEDIA - Overweight Zee Entertainment – Industry leading ad-revenue growth to continue Z IN | RATING: BUY| CMP: Rs 508 | TARGET: Rs 570 | UPSIDE: 16%
Ad revenue growth to revive from Q1FY18, primarily due to increased competitive intensity in telecom, FMCG and mobile handsets sectors
Steady-to-higher market share gains in regional markets to cushion near‐term negative impact of a market‐share loss in Hindi GEC
New programming launches will prop-up its viewership share in the medium term
Digitisation of phase-3 and 4 markets to help achieve 17-18% subscription revenue CAGR in FY17-19
Zee might use proceeds from the sale of its sports business for redeeming its preference shares in advance.
TELECOM - Overweight Bharti Airtel – Beneficiary of industry consolidation BHARTI IN | RATING: BUY | CMP: Rs 360 | TARGET: Rs 410 | UPSIDE: 14%
Bharti Airtel is a key beneficiary of consolidation in the telecom industry, as it will lead to improvement in return ratios and pricing in the long term.
Medium term will remain challenging because of the onslaught of Jio, but Bharti has executed well and will be able to defend its turf. Jio will start charging customers and its tariff plans indicate an ARPU not much lower than Bharti’s current ARPU. While realisations will decline in the medium term, ARPU decline will be much slower.
In the long term, the telecom market will be supply constrained, which will provide significant pricing support. Bharti, with dominant market position and strong spectrum footprint, will see sharp EBIDTA growth.

Page | 6 | PHILLIPCAPITAL INDIA RESEARCH
MARKET INTELLIGENCE MONTHLY UPDATE
Bharti currently trades 8x FY18 EV/EBIDTA. Considering that its India business is still undervalued at 6.5x EV/EBIDTA, the scope for further rerating is immense considering. Idea trades at 9x FY18 EV/EBIDTA.
AUTOMOBILES - Underweight Escorts Ltd: Play on Rural and Infrastructure ESC IN | RATING: Buy| CMP: Rs 461| TARGET: Rs 550| UPSIDE: 19%
Industry on a recovery mode: After a fall of 24% in FY14-16, the industry recovered in FY17 with a YTD yoy growth of 19%. We estimate double-digit growth in FY18 with a long-term CAGR of 7-8%.
Focused marketing and rejig could drive incremental share in weaker states: Escorts has a weak positioning in key high-growth western and southern states (Andhra Pradesh, Gujarat, Karnataka, and Maharashtra). Therefore, it has undertaken a focused marketing approach and rejigging of its distributors. These are steps in the right direction – they will lead to market-share gains.
Leaner and meaner: Escorts has historically lagged peers in terms of margins, mainly due to legacy costs. However, it has been taking consistent measures to control costs by reducing headcount and product redesigning. These cost-cutting measures, a revival in the market, and positive operating leverage should lead to operating profit margins improving to 9.9% in FY18 from 4.6% in FY16.
Construction business to ride infra growth wave: Construction industry has seen a sharp recovery in FY17 with Escorts reporting a 30% volume growth in 1HFY17. We expect this momentum to continue in FY18 with 15% growth and EBIT margins improving to 2% from -6% in FY16.
Railways – government/new products to drive growth: Railways is Escorts’ most profitable and fastest growing segment. While it is one of the key beneficiaries of increased spending by Indian railways, the new management team (four-years old) has significantly developed capabilities in product upgrades, new products, and new segments. We
expect Escorts to be a key beneficiary of the government’s thrust on railways, with rolling stock likely to grow 4-5x in the next 15 years.
CAPITAL GOODS - Underweight Va Tech Wabag: – Set to beat watered-down expectations VATW IN | RATING: BUY | CMP: Rs 579 | TARGET: Rs 600 | UPSIDE: +4%
Improvement in working capital as (1) cash flows from APGENCO project (Rs 3bn, 15% of receivables) are progressively released, (2) beneficial terms in the Petronas project (12-15% of FY18 revenues).
Pick up in order inflows over 12-18 months. VATW sees a strong pipeline of orders for FY18. Key areas – Middle East, North Africa, Latam, and industrial orders from South East Asia. Domestic orders will be driven by Namami Gange and bunched-up municipality projects.
Our target multiple, 18x September 2018 earnings, is at a 20% discount to its long-term average (22x). We expect 19% earnings CAGR over FY17-19 and a RoE of 15.2% in FY19 (vs. 13.1% in FY17).
VATW’s rerating beyond its averages will depend on its ability to reduce its working capital intensity (currently 33% of sales vs. 19% in FY14).
INFRASTRUCTURE – Equal weight HCC– Perseverance pays... HCC IN | RATING: BUY | CMP: Rs 40 | TARGET: Rs 71 | UPSIDE: +70%
HCC is the perfect turnaround story to play in the infrastructure space. After the turnaround in NCC, Ahluwalia Contracts and ITD Cementation, we see HCC’s story as another manifestation of our ‘EPC Trinity’ hypothesis (read here).
Driven by the S4A restructuring (where Rs 22bn of debt was converted into equity/OCD) and the NITI AYOG directive in Sep-16 (which directed all central government bodies to pay developers 75% of the claims that

Page | 7 | PHILLIPCAPITAL INDIA RESEARCH
MARKET INTELLIGENCE MONTHLY UPDATE
have been awarded in their favour), HCC should be able to payback Rs 24bn of debt and convert Rs 8bn into equity – reducing the standalone debt to Rs 20bn at FY17 (Rs 49bn at FY16). This would lead to a significant jump in earnings (53% CAGR over FY16-19 on a reported basis) and rerating of the stock.
Its current orderbook of Rs 237bn stands at a staggering 6x book-to-sales – providing high revenue visibility. We also see mammoth opportunity in HCC’s key segments of roads, MRTS and nuclear/hydro power projects.
Over FY16-19, HCC should report a robust topline CAGR of 18% (adjusted for claims), stable margin of 12-14%, and earnings CAGR of 53% (adjusted PAT CAGR would be even higher).
Currently HCC is trading at 14x our FY19 earnings – 9.5x adjusting for the value of subsidiaries (Infra and Stiener AG) – a significant discount to all construction peers. We see immense rerating potential being realised as its balance sheet transformation unfolds.
We value the company using SoTP methodology – EPC at 15x FY19 P/E (in line with peers), BOT assets at 0.7x BV, and Stiener AG at 2x BV. We do not attribute any value to Lavasa and value outstanding claims (under arbitration) at 0.3x the claim amount. We recommend BUY with a price target of Rs 71.
IRB Infra – InvIT(ing) valuations, Triggers on the anvil IRB IN | RATING: BUY | CMP: Rs 230 | TARGET: Rs 280 | UPSIDE: 22%
IRB is currently in the last stages of floating its Infrastructure Investment Trust (InvIT). It has placed six of its BOT projects in the InvIT, for which it is seeking an EV of Rs 79bn. If successful, it will lead to net debt reduction of Rs 60bn – taking IRB’s leverage down to 1.7x from current 2.8x. At the same time, it will also lead to cash inflow of Rs 24bn, enabling it to fund the equity commitment of its current and future BOT portfolios.
We acknowledge that the seeking valuations for IRB’s InvIT are high, driven by aggressive assumptions of 7.0-7.5% traffic growth vs. our assumption of 5%. However, even at 10-15% discount to the asking valuations, IRB will see Rs 14bn of cash inflow (worst-case scenario of Rs 67bn EV), which is still enough to take care of its current portfolio’s equity requirements
Most of IRB’s projects have seen robust toll collection growth over the last six quarters. With WPI being negative leading to -2% to +2% tariff hike in most projects, the implied traffic growth stands at an average of 5-7%. We expect robust traffic growth to continue in key projects in IRB’s portfolio, leading to strong topline and earnings growth.
IRB’s stock is currently trading at 13x FY18 P/E and we see significant upside in the stock, based on the quality of its BOT portfolio, strong EPC revenue visibility, and potential to release locked capital from its proposed InvIT listing (the next big trigger). We also note that IRB’s valuation is highly sensitive to interest rate (expected to come down over the next few months) – 1% reduction in interest rate and cost of equity leads to a 15% jump in IRB’s valuations.
At current levels, we see the risk-reward profile as highly favourable. We recommend BUY, with price target of Rs 280 (BOT Rs 180 + EPC Rs 100).
CONSUMER – Equal weight ITC – Strong growth prospects, attractive valuations ITC IN | RATING: BUY | CMP: Rs 268 | TARGET: Rs 300 | UPSIDE: 11%
In the FY18 Union Budget, the government increased excise duty by only 6%. With 35% GST levy on cigarettes and 10% excise duty hike in FY19, we expect cigarettes business EBIT growth in FY18/19 to be 9% each year
We expect FMCG other business to continue to do well and march towards higher profitability with improving operating leverage, strong
Page | 8 | PHILLIPCAPITAL INDIA RESEARCH
MARKET INTELLIGENCE MONTHLY UPDATE
volume growth and higher capital allocation towards foods business where ITC can succeed
We expect hotels, agri business and paper and paper packaging to do well going forward and lead to consolidated EBIT growth of 12% in FY18/19, thereby meeting street expectations
We expect GST to be beneficial for ITC as it will provide a level playing field to ITC to compete with unorganised players in FMCG others. Also a constant GST tax structure across states will help ITC streamline its distribution because in the current regime states charge different VAT on cigarettes and this leads to distribution inefficiencies and proliferation of illegal cigarettes.
The stock trades at 28x one-year forward earnings. On strong growth visibility, we value the stock at 28x FY19 earnings – at Rs 300.
Titan – Organised retail to do well in the GST regime TTAN IN | RATING: BUY | CMP: Rs 438 | TARGET: Rs 450 | UPSIDE: 3%
Titan posted strong numbers in Q3FY17 and we expect its business to see recovery in both topline and bottomline, led by growth revival in jewellery industry, market share gains, new collections, increasing share of exchanged gold, strong GHS collections, and margin expansion.
We expect Tanishq’s growth to be strong on new collection additions, GHS enrolments, and new store additions
Titan will be one of the beneficiaries of GST implementation as it will provide Titan with a level playing field against unorganised players
We value the stock at 34x our FY19 earnings – at Rs 450

Page | 9 | PHILLIPCAPITAL INDIA RESEARCH
MARKET INTELLIGENCE MONTHLY UPDATE
PHILLIPCAPITAL – MARKET INTELLIGENCE
Market Performance & Valuations

Page | 10 | PHILLIPCAPITAL INDIA RESEARCH
MARKET INTELLIGENCE MONTHLY UPDATE
Global Indices Performance NIFTY posted a modest 2.6% gain in February, as investors digested a largely balanced FY18 Union Budget followed by no rate cuts by the RBI – all amidst a busy 3QFY17 earnings season
US’ Nasdaq posted a solid 10% YTD gain; the index had reached an all-time high on a ‘Trump rally’
Source: Bloomberg, PhillipCapital India Research, Prices as of Mar 1, 2017
5.4% 5.1%
4.6% 4.0%
3.5% 2.8%
2.8% 2.6%
2.4% 2.1%
2.0% 1.8%
1.3% 0.9%
0.5%
0.0% 1.0% 2.0% 3.0% 4.0% 5.0% 6.0%
HANG SENG CHINA ENT INDX US (SPX)
US (NASDAQ) STOXX50
MSCI WORLD Asia ex Japan
MSCI EM India Nifty
Taiwan CSI 300
Hong Kong Singapore
Japan Australia
Korea
1m % performance
12.4% 11.9%
9.4% 9.3%
9.2% 8.6%
7.3% 6.6%
5.4% 4.8%
4.4% 4.0% 3.9%
3.7% -3.0%
-4.0% -2.0% 0.0% 2.0% 4.0% 6.0% 8.0% 10.0% 12.0% 14.0%
US (NASDAQ) STOXX50 US (SPX)
MSCI EM India Nifty
MSCI WORLD Asia ex Japan
Singapore Korea Japan
Taiwan HANG SENG CHINA ENT INDX
Hong Kong Australia CSI 300
3m % performance
9.7% 9.5%
9.4% 9.1%
8.9% 8.4%
8.1% 7.0%
5.9% 4.6% 4.5%
3.2% 2.5%
1.5% 0.7%
0.0% 2.0% 4.0% 6.0% 8.0% 10.0% 12.0%
US (NASDAQ) HANG SENG CHINA ENT INDX
India Nifty Asia ex Japan
MSCI EM Singapore
Hong Kong US (SPX)
MSCI WORLD Taiwan
CSI 300 Korea
STOXX50 Japan
Australia
YTD % performance
25.5% 22.9%
22.0% 21.4%
20.6% 19.5%
18.9% 16.9%
15.8% 14.5%
13.6% 13.3% 13.2%
12.2% 7.4%
0.0% 5.0% 10.0% 15.0% 20.0% 25.0% 30.0%
US (NASDAQ) HANG SENG CHINA ENT INDX
MSCI EM India Nifty
US (SPX) Asia ex Japan
Hong Kong MSCI WORLD
Japan Singapore
Australia CSI 300 Taiwan
STOXX50 Korea
1 yr % performance
Page | 11 | PHILLIPCAPITAL INDIA RESEARCH
MARKET INTELLIGENCE MONTHLY UPDATE
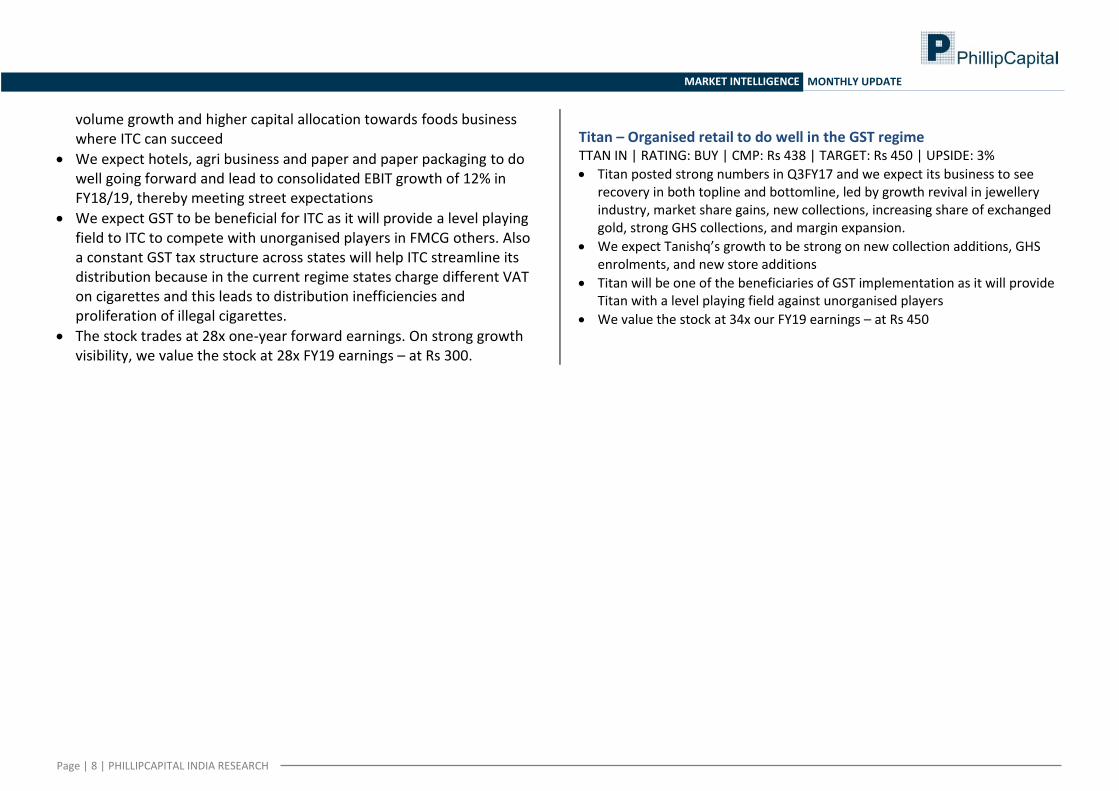
NIFTY Valuations Nifty currently trades at an FY18 PE of 17x – a significant premium to other emerging markets and in line with US & Japan (developed markets)
Nifty vs. other regions Nifty cons. FY17 & FY18 EPS expectations are down 11% since April 2016 Country/Region ____Earnings Growth (%)____ ____________P/E____________ 2016 2017 2018 2016 2017 2018
India 1% -3% 21% 20.1x 19.5x 17.0x Japan -1% 5% 9% 19.0x 18.5x 17.0x S&P 500 1% 9% 12% 18.9x 18.5x 16.5x France 3% 8% 11% 15.5x 14.6x 13.2x Germany -1% 7% 9% 14.2x 14.0x 12.8x Shanghai -11% 13% 14% 14.7x 13.6x 11.9x MSCI Asia ex Japan -8% 16% 10% 13.8x 13.1x 11.9x Brazil 17% 31% 17% 15.3x 13.0x 11.1x MSCI EM -2% 17% 12% 13.5x 12.6x 11.2x Hong Kong -10% 10% 9% 12.1x 12.0x 10.9x South Korea 16% 19% 7% 11.3x 9.9x 9.3x Russia 19% 14% 14% 7.5x 6.3x 5.5x
Nifty one-year forward PE Nifty one-year forward PB
Source: Bloomberg, PhillipCapital India Research, Prices as of Mar 1, 2017
300
350
400
450
500
550
600
650
700
Ap
r-1
1
Jul-
11
Oct
-11
Jan
-12
Ap
r-1
2
Jul-
12
Oct
-12
Jan
-13
Ap
r-1
3
Jul-
13
Oct
-13
Jan
-14
Ap
r-1
4
Jul-
14
Oct
-14
Jan
-15
Ap
r-1
5
Jul-
15
Oct
-15
Jan
-16
Ap
r-1
6
Jul-
16
Oct
-16
Jan
-17
FY12E FY13E FY14E FY15E FY16E FY17E FY18E
Mean + 1SD
Mean
Mean -1SD
5
7
9
11
13
15
17
19
21 1-yr Fwd Nifty PE
Mean + 1SD
Mean
Mean -1SD
1.0
1.5
2.0
2.5
3.0
3.5
4.0
4.5
Jul-05 Jul-06 Jul-07 Jul-08 Jul-09 Jul-10 Jul-11 Jul-12 Jul-13 Jul-14 Jul-15 Jul-16
1-yr Fwd Nifty PB

Page | 12 | PHILLIPCAPITAL INDIA RESEARCH
MARKET INTELLIGENCE MONTHLY UPDATE
Global Valuations Developed markets continue to trade at a premium to their long-run average; EM valuations look more attractive
US S&P 500: One-year forward PE Emerging markets: One-year forward PE
MSCI Asia ex Japan: One-year forward PE trends Developed markets: One-year forward PE
Source: Bloomberg, PhillipCapital India Research, Prices as of Mar 1, 2017
Mean
Mean + 1SD
Mean -1SD
8
9
10
11
12
13
14
15
16
17
18
Mar-07 Mar-08 Mar-09 Mar-10 Mar-11 Mar-12 Mar-13 Mar-14 Mar-15 Mar-16
SPX 1-yr fwd PE
Mean
Mean + 1SD
Mean -1SD
5
7
9
11
13
15
17
Mar-07 Mar-08 Mar-09 Mar-10 Mar-11 Mar-12 Mar-13 Mar-14 Mar-15 Mar-16
MSCI EM 1-y fwd PE
Mean
Mean + 1SD
Mean -1SD
5
7
9
11
13
15
17
19
Mar-07 Mar-08 Mar-09 Mar-10 Mar-11 Mar-12 Mar-13 Mar-14 Mar-15 Mar-16
MSCI Asia ex Japan 1-y fwd PE
Mean
Mean + 1SD
Mean -1SD
7
8
9
10
11
12
13
14
15
16
17
Mar-07 Mar-08 Mar-09 Mar-10 Mar-11 Mar-12 Mar-13 Mar-14 Mar-15 Mar-16
MXWO Index 1-y fwd PE

Page | 13 | PHILLIPCAPITAL INDIA RESEARCH
MARKET INTELLIGENCE MONTHLY UPDATE
Sector Performance Nifty’s 2.6% gain in February was driven by rebounds in IT and realty stocks. Autos and pharma were laggards on 1-m and 3-m basis respectively
Source: Bloomberg, PhillipCapital India Research, Prices as of Mar 1, 2017
10.2%
8.7%
6.2%
5.7%
5.2%
5.0%
5.0%
4.3%
3.8%
3.2%
2.9%
2.6%
1.2%
1.2%
0.7%
0.6%
0.3%
-0.5%
-5.1%
-10.0% -5.0% 0.0% 5.0% 10.0% 15.0%
NIFTY IT
NIFTY REALTY
NIFTY Midcap 50
NIFTY MEDIA
NIFTY Midcap 100
NIFTY PHARMA
NIFTY ENERGY
NIFTY SERV SECTOR
NIFTY BANK
NIFTY500
NIFTY NEXT 50
Nifty
NIFTY COMMODITIES
NIFTY METAL
NIFTY FMCG
NIFTY INFRA
NIFTY PSU BANK
NIFTY MNC
NIFTY AUTO
1m % sector price performance
23.6%
15.9%
14.2%
13.7%
13.5%
12.8%
12.3%
12.2%
11.3%
10.5%
10.2%
10.1%
9.5%
9.2%
8.2%
7.0%
6.9%
5.4%
-3.9%
-25.0% -15.0% -5.0% 5.0% 15.0% 25.0% 35.0%
NIFTY REALTY
NIFTY METAL
NIFTY ENERGY
NIFTY MEDIA
NIFTY Midcap 50
NIFTY BANK
NIFTY Midcap 100
NIFTY COMMODITIES
NIFTY NEXT 50
NIFTY SERV SECTOR
NIFTY FMCG
NIFTY500
NIFTY MNC
Nifty
NIFTY INFRA
NIFTY AUTO
NIFTY IT
NIFTY PSU BANK
NIFTY PHARMA
3m % sector price performance

Page | 14 | PHILLIPCAPITAL INDIA RESEARCH
MARKET INTELLIGENCE MONTHLY UPDATE
Sector Performance Top YTD leaders: Real Estate (+19%), Metals (+18%), and Banks (+16%). Notable yoy gains by Metals (+86%) on a rally in commodities
Source: Bloomberg, PhillipCapital India Research, Prices as of Mar 1, 2017
18.7%
17.7%
15.7%
14.4%
14.2%
13.6%
13.3%
13.3%
11.8%
11.3%
10.7%
9.4%
9.4%
9.4%
9.4%
8.7%
3.8%
3.7%
3.7%
-25.0% -15.0% -5.0% 5.0% 15.0% 25.0%
NIFTY REALTY
NIFTY METAL
NIFTY BANK
NIFTY MEDIA
NIFTY Midcap 100
NIFTY Midcap 50
NIFTY NEXT 50
NIFTY PSU BANK
NIFTY SERV SECTOR
NIFTY COMMODITIES
NIFTY500
NIFTY INFRA
NIFTY ENERGY
NIFTY FMCG
Nifty
NIFTY MNC
NIFTY PHARMA
NIFTY AUTO
NIFTY IT
YTD % sector price performance
85.8%
52.3%
44.5%
44.1%
41.9%
41.8%
37.7%
36.7%
36.6%
30.1%
29.6%
26.4%
25.6%
25.3%
21.8%
21.4%
17.6%
-1.4%
-5.1%
-25.0% -5.0% 15.0% 35.0% 55.0% 75.0% 95.0%
NIFTY METAL
NIFTY COMMODITIES
NIFTY Midcap 50
NIFTY PSU BANK
NIFTY REALTY
NIFTY ENERGY
NIFTY BANK
NIFTY Midcap 100
NIFTY NEXT 50
NIFTY AUTO
NIFTY MEDIA
NIFTY500
NIFTY INFRA
NIFTY MNC
NIFTY SERV SECTOR
Nifty
NIFTY FMCG
NIFTY IT
NIFTY PHARMA
1yr % sector price performance

Page | 15 | PHILLIPCAPITAL INDIA RESEARCH
MARKET INTELLIGENCE MONTHLY UPDATE
Sector Valuations Most sectors are trading above their peak historic one-year forward PE multiples. Pharma valuations are depressed due to higher regulatory pressures
Source: Bloomberg, PhillipCapital India Research, Prices as of Mar 1, 2017
LTA
+ 1SD
-1SD
6
8
10
12
14
16
18
Nov-11 Nov-12 Nov-13 Nov-14 Nov-15 Nov-16
Autos 1-yr fwd PE
LTA
+ 1SD
-1SD
10
15
20
25
30
35 FMCG 1-y fwd PE
LTA
+ 1SD
-1SD
0
5
10
15
20
25 Banks 1-y fwd PE
LTA
+ 1SD
-1SD
5
7
9
11
13
15
17
19
21
23 IT 1-y fwd PE
LTA
+ 1SD
-1SD
5
10
15
20
25
30 Pharma 1-y fwd PE
LTA
+ 1SD
-1SD
0
2
4
6
8
10
12
14
16
PSU Banks 1-y fwd PE

Page | 16 | PHILLIPCAPITAL INDIA RESEARCH
MARKET INTELLIGENCE MONTHLY UPDATE
Sector Valuations Cyclical sector valuations (metals and oil & gas) look attractive despite the recent run-up in commodities
Source: Bloomberg, PhillipCapital India Research, Prices as of Mar 1, 2017.
LTA
+ 1SD
-1SD
0
2
4
6
8
10
12
14
16
18
20
Feb-11 Feb-12 Feb-13 Feb-14 Feb-15 Feb-16 Feb-17
Realty 1-y fwd PE
LTA
+ 1SD
-1SD
4
6
8
10
12
14
16
18
20
Nov-11 Nov-12 Nov-13 Nov-14 Nov-15 Nov-16
Metals 1-y fwd PE
LTA
+ 1SD
-1SD
5
7
9
11
13
15
17
19
21
23 Infra 1-y fwd PE
LTA
+ 1SD
-1SD
5
10
15
20
25
30
35
40
Nov-11 Nov-12 Nov-13 Nov-14 Nov-15 Nov-16
Media 1-y fwd PE
LTA
+ 1SD
-1SD
6
7
8
9
10
11
12
13
14
15 Energy 1-y fwd PE
LTA
+ 1SD
-1SD
5
7
9
11
13
15
17
19
21
23
25 Service Sector 1-y fwd PE

Page | 17 | PHILLIPCAPITAL INDIA RESEARCH
MARKET INTELLIGENCE MONTHLY UPDATE
BSE500 Top Gainers & Losers
BSE500 Top Gainers & Losers this week
Top Gainers Last Price % 1m Chg Top Losers Last Price % 1m Chg
Jindal Steel & Power Ltd 126.9 47.6 KSK Energy Ventures Ltd 12.9 -24.6
Just Dial Ltd 547.0 45.9 Intellect Design Arena Ltd 123.7 -17.7
Jaypee Infratech Ltd 12.9 40.4 Tata Motors Ltd 282.8 -16.7
Aegis Logistics Ltd 195.6 34.0 Indo Count Industries Ltd 161.3 -13.6
Rain Industries Ltd 96.4 32.0 Tata Motors Ltd 464.6 -12.5
Marksans Pharma Ltd 49.5 31.5 eClerx Services Ltd 1324.0 -12.4
GMR Infrastructure Ltd 16.9 30.6 Dr Lal PathLabs Ltd 952.4 -12.0
Unitech Ltd 6.3 30.6 Repco Home Finance Ltd 652.0 -11.4
Sun TV Network Ltd 718.0 30.1 HeidelbergCement India Ltd 118.2 -10.3
Eros International Media Ltd 216.9 28.1 HMT Ltd 38.6 -10.0
BSE500 Top Gainers & Losers this month
Top Gainers Last Price % 3m Chg Top Losers Last Price % 3m Chg
Jaiprakash Associates Ltd 15.8 109.8 KSK Energy Ventures Ltd 12.9 -39.2
Rain Industries Ltd 96.4 89.2 Divi's Laboratories Ltd 764.7 -32.6
Jindal Steel & Power Ltd 126.9 88.5 Bharti Infratel Ltd 290.9 -24.6
Jaypee Infratech Ltd 12.9 79.2 TV Today Network Ltd 259.8 -17.2
Sun TV Network Ltd 718.0 64.0 Dr Lal PathLabs Ltd 952.4 -16.6
BEML Ltd 1332.0 61.3 Lycos Internet Ltd 7.5 -16.4
Vijaya Bank 69.2 56.8 Intellect Design Arena Ltd 123.7 -14.8
India Cements Ltd/The 168.2 51.4 Religare Enterprises Ltd 230.0 -14.4
Sunteck Realty Ltd 288.0 51.1 Syngene International Ltd 492.0 -14.3
Idea Cellular Ltd 110.8 50.7 Balmer Lawrie & Co Ltd 212.6 -12.8
Source: Bloomberg, PhillipCapital India Research, Prices as of Mar 1, 2017.

Page | 18 | PHILLIPCAPITAL INDIA RESEARCH
MARKET INTELLIGENCE MONTHLY UPDATE
BSE500 Top Gainers & Losers
BSE500 Top Gainers & Losers % yoy chg
Top Gainers Last Price % yoy Chg Top Losers Last Price % yoy Chg
Gujarat Narmada Valley Fertilizers & Chemicals Ltd 271.2 275.9 Lycos Internet Ltd 7.3 -70.6
Vedanta Ltd 263.5 255.6 KSK Energy Ventures Ltd 13.9 -65.2
Escorts Ltd 420.0 244.9 Ramco Systems Ltd 363.0 -47.7
Indian Bank 289.0 239.5 Intellect Design Arena Ltd 110.7 -42.1
Manappuram Finance Ltd 99.0 216.6 Texmaco Rail & Engineering Ltd 90.3 -36.2
Dalmia Bharat Ltd 1895.2 187.6 Mindtree Ltd 466.2 -34.6
Rain Industries Ltd 85.0 184.1 Reliance Communications Ltd 35.5 -30.2
Hindalco Industries Ltd 181.0 160.4 Rajesh Exports Ltd 518.1 -27.8
Edelweiss Financial Services Ltd 127.3 159.7 Majesco Ltd 347.0 -27.4
Swan Energy Ltd 160.8 154.4 RattanIndia Power Ltd 7.2 -27.3
BSE500 Top Gainers & Losers YTD
Top Gainers Last Price % YTD Chg Top Losers Last Price % YTD Chg
Yamini Investment Ltd 44.6 89.4 Intellect Design Arena Ltd 110.7 -20.6
Jaiprakash Associates Ltd 14.2 76.5 Texmaco Rail & Engineering Ltd 90.3 -17.6
Jindal Steel & Power Ltd 107.5 55.6 Titagarh Wagons Ltd 104.5 -15.1
Rain Industries Ltd 85.0 55.0 Bharti Infratel Ltd 301.0 -12.4
Just Dial Ltd 518.5 53.2 Majesco Ltd 347.0 -11.3
Aegis Logistics Ltd 194.5 51.4 Multi Commodity Exchange of India Ltd 1126.8 -11.0
Manappuram Finance Ltd 99.0 47.1 Lycos Internet Ltd 7.3 -10.8
Idea Cellular Ltd 107.9 45.8 Mindtree Ltd 466.2 -10.7
Bharat Financial Inclusion Ltd 856.0 45.5 Religare Enterprises Ltd 231.1 -9.3
Jaiprakash Power Ventures Ltd 5.8 45.5 8K Miles Software Services Ltd 587.0 -9.2
Source: Bloomberg, PhillipCapital India Research, Prices as of Mar 1, 2017.

Page | 19 | PHILLIPCAPITAL INDIA RESEARCH
MARKET INTELLIGENCE MONTHLY UPDATE
Styles Performance Value style posted a rebound in Feb alongside large caps that are up 7.5% YTD. Mid-caps also gained ~15% YTD
Value vs. Growth Large-cap vs. small-cap
Large vs. mid-caps Mid vs. small-caps
Source: Bloomberg, PhillipCapital India Research, Prices as of Mar 1, 2017.
0.56
0.57
0.58
0.59
0.60
0.61
0.62
0.63 MSCI Value vs. Growth
Growth Outperforms
Value Outperforms
0.6
0.7
0.8
0.9
1.0
1.1
1.2
1.3
Jun-09 Jun-10 Jun-11 Jun-12 Jun-13 Jun-14 Jun-15 Jun-16
MSCI Large Cap vs. Small Cap
Large Caps outperform
Small Cap outperforms
0.5
0.6
0.7
0.8
0.9
1.0
Jun-09 Jun-10 Jun-11 Jun-12 Jun-13 Jun-14 Jun-15 Jun-16
MSCI Large vs Mid-Caps
Mid-Cap outperforms
Large Cap outperforms
1.0
1.2
1.4
1.6
1.8
2.0
2.2
Jun-09 Jun-10 Jun-11 Jun-12 Jun-13 Jun-14 Jun-15 Jun-16
MSCI Mid vs Small-Caps
Mid Cap outperforms
Smalll cap outperforms

Page | 20 | PHILLIPCAPITAL INDIA RESEARCH
MARKET INTELLIGENCE MONTHLY UPDATE
Styles Valuations Value PE (and PB) currently trades at a reasonable discount to growth, but a recent run-up in large caps has narrowed the PE differential vs. mid-caps
Value vs. growth: One-year forward PE Value vs. growth: One-year forward PB
Large vs. mid-cap: One-year forward PE Large vs. mid-cap: One-year forward PB
Source: Bloomberg, PhillipCapital India Research, Prices as of Mar 1, 2017.
-60%
-50%
-40%
-30%
-20%
-10%
0%
10%
Jul-05 Jul-06 Jul-07 Jul-08 Jul-09 Jul-10 Jul-11 Jul-12 Jul-13 Jul-14 Jul-15 Jul-16
1-yr Fwd PE LTA PE discount (V/G)
-80%
-70%
-60%
-50%
-40%
-30%
-20%
-10%
0%
10%
20%
Jul-05 Jul-06 Jul-07 Jul-08 Jul-09 Jul-10 Jul-11 Jul-12 Jul-13 Jul-14 Jul-15 Jul-16
1-yr Fwd PB PB discount (V/G) LTA
0
5
10
15
20
25
Oct-05 Oct-06 Oct-07 Oct-08 Oct-09 Oct-10 Oct-11 Oct-12 Oct-13 Oct-14 Oct-15 Oct-16
1-yr Forward PE NIFTY Midcap PE NIFTY PE
0
1
2
3
4
5
Jan-06 Jan-07 Jan-08 Jan-09 Jan-10 Jan-11 Jan-12 Jan-13 Jan-14 Jan-15 Jan-16 Jan-17
1-yr Forward PB Nifty Mid-Cap PB NIFTY PB
Page | 21 | PHILLIPCAPITAL INDIA RESEARCH
MARKET INTELLIGENCE MONTHLY UPDATE
PHILLIPCAPITAL – MARKET INTELLIGENCE
FII & DII Analysis

Page | 22 | PHILLIPCAPITAL INDIA RESEARCH
MARKET INTELLIGENCE MONTHLY UPDATE
Flows Update Net DII inflows since demonetisation have totaled US$ 4.4bn, while FII outflows during the same period were close to US$ 2.1bn
FII, DII Flows vs. NIFTY Index (in USD mn) Cumulative FII, DII flow trends
EM Asia Flows (USD, mn) Sector-Wise FII assets under management (USD, mn), (As of Feb 15, 2017)
Net Foreign Flows ($,mn) Today MTD QTD YTD YTD YoY
India 155 1564 1557 1557 149
S. Korea 442 442 2076 2076 -166
Sri Lanka 1 1 4 4 128
Vietnam 0 0 52 52 1242
Pakistan -4 -4 -142 -142 -55
Phillipines -16 -16 -114 -114 -118
Indonesia -26 -26 -159 -159 867
Thailand -27 -27 45 45 -141
Taiwan -132 -132 2940 2940 -978
Source: Bloomberg, NSDL, PhillipCapital India Research, Prices as of Mar 1, 2017
5000
5500
6000
6500
7000
7500
8000
8500
9000
9500
-1000
-500
0
500
1000
1500
(in
$m
n)
INBTDINT Index FIINNET Index NIFTY Index
-5000
0
5000
10000
15000
20000
(in
$ m
n)
DII FII
72.3
56.5
33.7 32.7
26.0 25.4 23.3 20.6 18.2
12.6
5.4 2.2
0
10
20
30
40
50
60
70
80

Page | 23 | PHILLIPCAPITAL INDIA RESEARCH
MARKET INTELLIGENCE MONTHLY UPDATE
PHILLIPCAPITAL – MARKET INTELLIGENCE
Macro & Market Indicators
Page | 24 | PHILLIPCAPITAL INDIA RESEARCH
MARKET INTELLIGENCE MONTHLY UPDATE
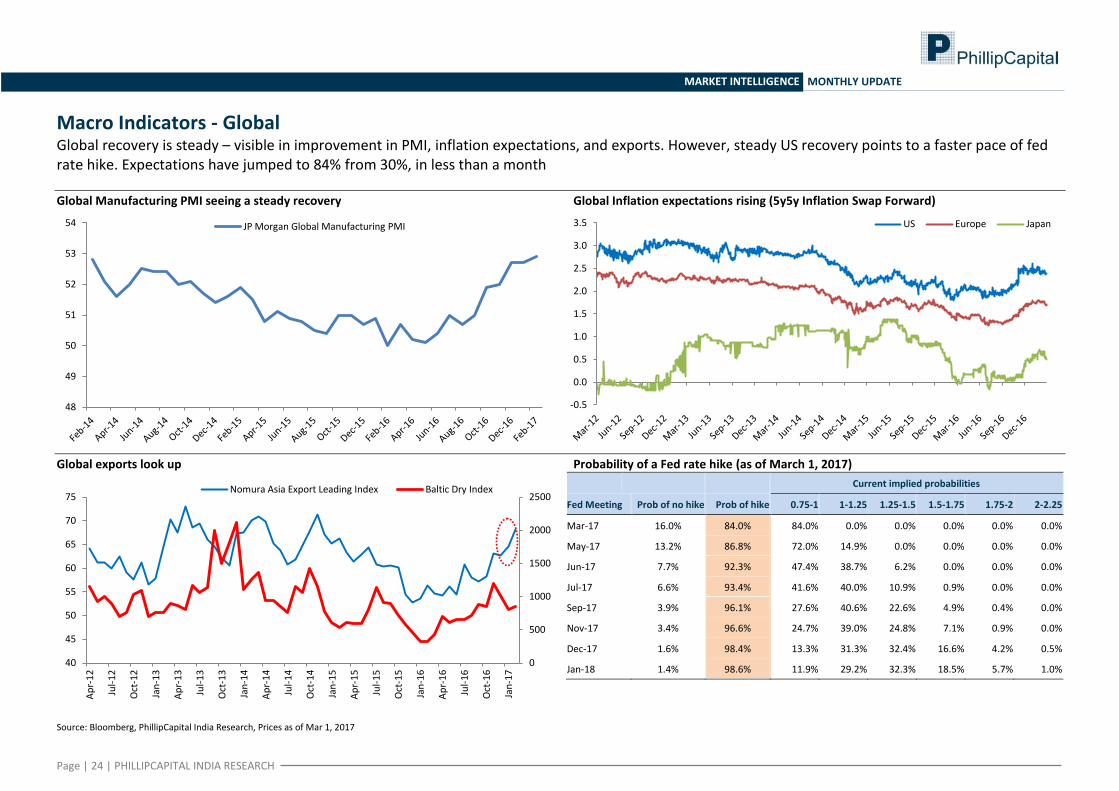
Macro Indicators - Global Global recovery is steady – visible in improvement in PMI, inflation expectations, and exports. However, steady US recovery points to a faster pace of fed rate hike. Expectations have jumped to 84% from 30%, in less than a month
Global Manufacturing PMI seeing a steady recovery Global Inflation expectations rising (5y5y Inflation Swap Forward)
Global exports look up Probability of a Fed rate hike (as of March 1, 2017)
Current implied probabilities
Fed Meeting Prob of no hike Prob of hike 0.75-1 1-1.25 1.25-1.5 1.5-1.75 1.75-2 2-2.25
Mar-17 16.0% 84.0% 84.0% 0.0% 0.0% 0.0% 0.0% 0.0%
May-17 13.2% 86.8% 72.0% 14.9% 0.0% 0.0% 0.0% 0.0%
Jun-17 7.7% 92.3% 47.4% 38.7% 6.2% 0.0% 0.0% 0.0%
Jul-17 6.6% 93.4% 41.6% 40.0% 10.9% 0.9% 0.0% 0.0%
Sep-17 3.9% 96.1% 27.6% 40.6% 22.6% 4.9% 0.4% 0.0%
Nov-17 3.4% 96.6% 24.7% 39.0% 24.8% 7.1% 0.9% 0.0%
Dec-17 1.6% 98.4% 13.3% 31.3% 32.4% 16.6% 4.2% 0.5%
Jan-18 1.4% 98.6% 11.9% 29.2% 32.3% 18.5% 5.7% 1.0%
Source: Bloomberg, PhillipCapital India Research, Prices as of Mar 1, 2017
48
49
50
51
52
53
54 JP Morgan Global Manufacturing PMI
-0.5
0.0
0.5
1.0
1.5
2.0
2.5
3.0
3.5 US Europe Japan
0
500
1000
1500
2000
2500
40
45
50
55
60
65
70
75
Ap
r-1
2
Jul-
12
Oct
-12
Jan
-13
Ap
r-1
3
Jul-
13
Oct
-13
Jan
-14
Ap
r-1
4
Jul-
14
Oct
-14
Jan
-15
Ap
r-1
5
Jul-
15
Oct
-15
Jan
-16
Ap
r-1
6
Jul-
16
Oct
-16
Jan
-17
Nomura Asia Export Leading Index Baltic Dry Index

Page | 25 | PHILLIPCAPITAL INDIA RESEARCH
MARKET INTELLIGENCE MONTHLY UPDATE
Macro Indicators - India RBI left policy rates unchanged in response to firming inflation on the back of higher oil prices
Quarterly GDP Growth Rate (%) Inflation
IIP Growth Rate (%) Rates
Source: Bloomberg, PhillipCapital India Research, Prices as of Mar 1, 2017
5.0%
7.7%
5.4%
4.6%
6.7%
7.8%
6.4%
5.8%
7.5%
8.3%
6.6% 6.7%
7.8% 7.8%
6.5%
7.9%
7.2% 7.4%
7.0%
3%
4%
5%
6%
7%
8%
9%
GD
P G
row
th Y
oY
%
Real GDP Growth (YoY %) Avg GDP (YoY %)
-6
-4
-2
0
2
4
6
8
10
12
14
Jan
-12
Ap
r-1
2
Jul-
12
Oct
-12
Jan
-13
Ap
r-1
3
Jul-
13
Oct
-13
Jan
-14
Ap
r-1
4
Jul-
14
Oct
-14
Jan
-15
Ap
r-1
5
Jul-
15
Oct
-15
Jan
-16
Ap
r-1
6
Jul-
16
Oct
-16
Jan
-17
WPI YoY (%) CPI YoY (%)
-10
-5
0
5
10
15
20
25
Ap
r-0
6
Sep
-06
Feb
-07
Jul-
07
Dec
-07
May
-08
Oct
-08
Mar
-09
Au
g-0
9
Jan
-10
Jun
-10
No
v-1
0
Ap
r-1
1
Sep
-11
Feb
-12
Jul-
12
Dec
-12
May
-13
Oct
-13
Mar
-14
Au
g-1
4
Jan
-15
Jun
-15
No
v-1
5
Ap
r-1
6
Sep
-16
IIP Growth Rate (%)
3
4
5
6
7
8
9
10
%
CRR Repo Reverse Repo

Page | 26 | PHILLIPCAPITAL INDIA RESEARCH
MARKET INTELLIGENCE MONTHLY UPDATE
Market Indicators INR continues to trade at all-time lows, 10-yr G-Sec yields reacted to a potential end in the rate-cut cycle. Brent stabilised at US$ 55-50/bbl
Sharp INR depreciation on continued dollar strength 10-yr G-Sec yields
Brent Crude (USD/bbl) India VIX
Source: Bloomberg, PhillipCapital India Research, Prices as of Mar 1, 2017
20
30
40
50
60
70
80 USD/INR
4
5
6
7
8
9
10
11
12 10yr GOI Yields
LTA
0
20
40
60
80
100
120
140
160 Brent Crude ($/bbl)
0
10
20
30
40
50
60
70
80
Nov-07 Nov-08 Nov-09 Nov-10 Nov-11 Nov-12 Nov-13 Nov-14 Nov-15 Nov-16
India VIX
Page | 27 | PHILLIPCAPITAL INDIA RESEARCH
MARKET INTELLIGENCE MONTHLY UPDATE
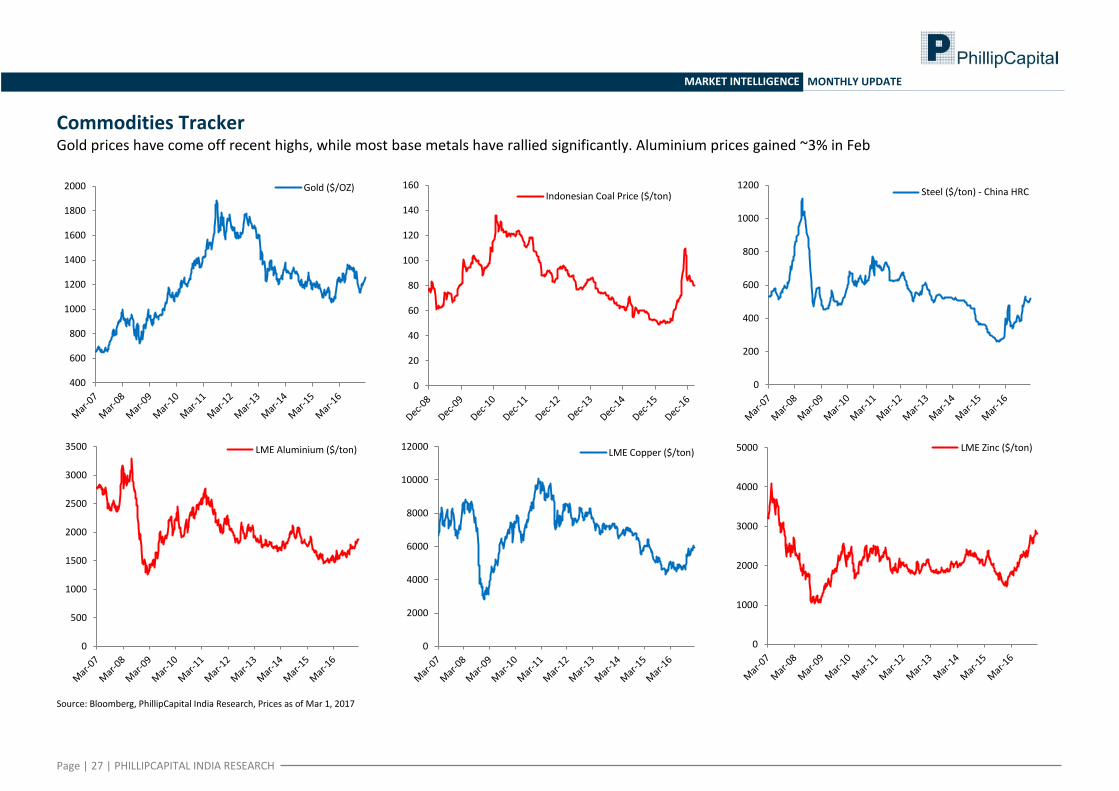
Commodities Tracker Gold prices have come off recent highs, while most base metals have rallied significantly. Aluminium prices gained ~3% in Feb
Source: Bloomberg, PhillipCapital India Research, Prices as of Mar 1, 2017
400
600
800
1000
1200
1400
1600
1800
2000 Gold ($/OZ)
0
20
40
60
80
100
120
140
160 Indonesian Coal Price ($/ton)
0
200
400
600
800
1000
1200 Steel ($/ton) - China HRC
0
500
1000
1500
2000
2500
3000
3500 LME Aluminium ($/ton)
0
2000
4000
6000
8000
10000
12000 LME Copper ($/ton)
0
1000
2000
3000
4000
5000 LME Zinc ($/ton)

Page | 28 | PHILLIPCAPITAL INDIA RESEARCH
MARKET INTELLIGENCE MONTHLY UPDATE
Model Portfolio
_____________EPS (Rs)________________ ___________EPS Growth (%)____________ ______________P/E (x)______________
Company Weight FY16 FY17E FY18E FY16 FY17E FY18E FY16 FY17E FY18E FMCG 10.0%
HUL 2.0% 18.9 19.4 22.1 4% 2% 14% 46 45 40 Colgate Palmolive India Ltd 2.0% 22.3 22.1 25.5 9% -1% 15% 39.9 40.4 35.0 ITC 6.0% 7.8 8.6 9.6 2% 10% 11% 33.9 30.9 27.7 Automobile 8.5%
Maruti 3.0% 151.3 243.2 273.1 23% 61% 12% 39.1 24.3 21.7 Tata motors 3.0% 34.3 24.9 42.3 -21% -28% 70% 13.4 18.6 10.9 Bajaj Auto 2.5% 126.2 137.3 159.3 16% 9% 16% 22.4 20.6 17.8 IT 6.0%
Infy 6.0% 59.0 63.2 71.9 9% 7% 14% 17.3 16.2 14.2 Pharmaceuticals 6.0%
Sun Pharma 4.0% 24.1 29.7 34.3 12% 24% 15% 28.1 22.8 19.7 Aurobindo 2.0% 35.0 40.8 50.3 24% 16% 23% 19.1 16.4 13.3 Cement 4.0%
Ultratech 3.0% 83.3 104.5 108.3 9% 25% 4% 45.8 36.5 35.3 Dalmia Bharat 1.0% 21.5 59.1 65.8 25% 175% 11% 17.4 6.3 5.7 Metals & Mining 12.3%
Tata Steel 3.0% 9.5 25.8 62.3 – 170% 142% 51.9 19.2 7.9 JSW Steel 2.0% 6 15 18 -25% 160% 24% 32 12 10 Hindalco 2.0% 3.8 13.8 16.6 -72% 265% 21% 50.2 13.7 11.4 NTPC 3.3% 12.4 12.1 13.6 21% -2% 12% 12.6 12.9 11.5 Vedanta 2.0% 10.6 21.2 27.9 4% 101% 31% 25.7 12.8 9.7 Industrial 4.0%
L&T 2.0% 44.9 62.1 72.1 -5% 38% 16% 32.8 23.7 20.4 NCC 2.0% 4.3 4.4 6.2 112% 2% 43% 19.0 18.6 13.0 Finance 33.3%
Axis bank 4.0% 34.5 12.7 18.9 11% -63% 49% 14.7 39.9 26.8 indusInd bank 3.0% 38.4 49.7 64.3 13% 29% 29% 34.0 26.3 20.3 SBI 4.5% 14.9 5.0 11.8 -35% -66% 136% 17.9 53.5 22.7 Cholamadalam Fin 2.5% 36.4 47.9 60.3 20% 32% 26% 26.1 19.9 15.8 HDFC Ltd 5.0% 44.9 46.6 51.3 16% 4% 10% 31.2 30.0 27.2 LIC Housing Finance 2.0% 32.9 38.1 41.2 20% 16% 8% 16.8 14.5 13.4 HDFC bank 6.0% 48.6 57.9 69.9 19% 19% 21% 28.4 23.8 19.7 ICICI Bank 6.3% 16.7 14.6 12.2 -13% -13% -16% 16.7 19.1 22.8 Oil & Gas 5.0%
Reliance Industries 5.0% 92.3 96.3 78.3 15% 4% -19% 13.4 12.8 15.8 Telecom 9.5%
Bharti Infratel 2.0% 12.6 14.3 15.4 19% 13% 8% 23.1 20.3 18.8 Bharti Airtel 3.0% 9.8 9.4 14.4 -35% -4% 54% 36.6 38.2 24.8 Dish TV 2.0% 6.6 2.6 3.6 – -61% 41% 14.3 36.8 26.2 Zee Entertainment 2.5% 9.5 11.2 15.9 10% 18% 42% 52.7 44.7 31.5 Others 1.5%
Tata Comm 1.5% 8 5 14 105% -36% 177% 95.9 149.1 53.8

Page | 29 | PHILLIPCAPITAL INDIA RESEARCH
MARKET INTELLIGENCE MONTHLY UPDATE
Disclosures and Disclaimers PhillipCapital (India) Pvt. Ltd. has three independent equity research groups: Institutional Equities, Institutional Equity Derivatives, and Private Client Group. This report has been prepared by Institutional Equities Group. The views and opinions expressed in this document may, may not match, or may be contrary at times with the views, estimates, rating, and target price of the other equity research groups of PhillipCapital (India) Pvt. Ltd.
This report is issued by PhillipCapital (India) Pvt. Ltd., which is regulated by the SEBI. PhillipCapital (India) Pvt. Ltd. is a subsidiary of Phillip (Mauritius) Pvt. Ltd. References to "PCIPL" in this report shall mean PhillipCapital (India) Pvt. Ltd unless otherwise stated. This report is prepared and distributed by PCIPL for information purposes only, and neither the information contained herein, nor any opinion expressed should be construed or deemed to be construed as solicitation or as offering advice for the purposes of the purchase or sale of any security, investment, or derivatives. The information and opinions contained in the report were considered by PCIPL to be valid when published. The report also contains information provided to PCIPL by third parties. The source of such information will usually be disclosed in the report. Whilst PCIPL has taken all reasonable steps to ensure that this information is correct, PCIPL does not offer any warranty as to the accuracy or completeness of such information. Any person placing reliance on the report to undertake trading does so entirely at his or her own risk and PCIPL does not accept any liability as a result. Securities and Derivatives markets may be subject to rapid and unexpected price movements and past performance is not necessarily an indication of future performance.
This report does not regard the specific investment objectives, financial situation, and the particular needs of any specific person who may receive this report. Investors must undertake independent analysis with their own legal, tax, and financial advisors and reach their own conclusions regarding the appropriateness of investing in any securities or investment strategies discussed or recommended in this report and should understand that statements regarding future prospects may not be realised. Under no circumstances can it be used or considered as an offer to sell or as a solicitation of any offer to buy or sell the securities mentioned within it. The information contained in the research reports may have been taken from trade and statistical services and other sources, which PCIL believe is reliable. PhillipCapital (India) Pvt. Ltd. or any of its group/associate/affiliate companies do not guarantee that such information is accurate or complete and it should not be relied upon as such. Any opinions expressed reflect judgments at this date and are subject to change without notice.
Important: These disclosures and disclaimers must be read in conjunction with the research report of which it forms part. Receipt and use of the research report is subject to all aspects of these disclosures and disclaimers. Additional information about the issuers and securities discussed in this research report is available on request.
Certifications: The research analyst(s) who prepared this research report hereby certifies that the views expressed in this research report accurately reflect the research analyst’s personal views about all of the subject issuers and/or securities, that the analyst(s) have no known conflict of interest and no part of the research analyst’s compensation was, is, or will be, directly or indirectly, related to the specific views or recommendations contained in this research report.
Additional Disclosures of Interest: Unless specifically mentioned in Point No. 9 below: 1. The Research Analyst(s), PCIL, or its associates or relatives of the Research Analyst does not have any financial interest in the company(ies) covered in this report. 2. The Research Analyst, PCIL or its associates or relatives of the Research Analyst affiliates collectively do not hold more than 1% of the securities of the company (ies)covered in this report as of the end of the month immediately
preceding the distribution of the research report. 3. The Research Analyst, his/her associate, his/her relative, and PCIL, do not have any other material conflict of interest at the time of publication of this research report. 4. The Research Analyst, PCIL, and its associates have not received compensation for investment banking or merchant banking or brokerage services or for any other products or services from the company(ies) covered in this
report, in the past twelve months. 5. The Research Analyst, PCIL or its associates have not managed or co-managed in the previous twelve months, a private or public offering of securities for the company (ies) covered in this report. 6. PCIL or its associates have not received compensation or other benefits from the company(ies) covered in this report or from any third party, in connection with the research report. 7. The Research Analyst has not served as an Officer, Director, or employee of the company (ies) covered in the Research report. 8. The Research Analyst and PCIL has not been engaged in market making activity for the company(ies) covered in the Research report. 9. Details of PCIL, Research Analyst and its associates pertaining to the companies covered in the Research report:
Sr. no. Particulars Yes/No
1 Whether compensation has been received from the company(ies) covered in the Research report in the past 12 months for investment banking transaction by PCIL No
2 Whether Research Analyst, PCIL or its associates or relatives of the Research Analyst affiliates collectively hold more than 1% of the company(ies) covered in the Research report
No
3 Whether compensation has been received by PCIL or its associates from the company(ies) covered in the Research report No
4 PCIL or its affiliates have managed or co-managed in the previous twelve months a private or public offering of securities for the company(ies) covered in the Research report No
5 Research Analyst, his associate, PCIL or its associates have received compensation for investment banking or merchant banking or brokerage services or for any other products or services from the company(ies) covered in the Research report, in the last twelve months No
Independence: PhillipCapital (India) Pvt. Ltd. has not had an investment banking relationship with, and has not received any compensation for investment banking services from, the subject issuers in the past twelve (12) months, and PhillipCapital (India) Pvt. Ltd does not anticipate receiving or intend to seek compensation for investment banking services from the subject issuers in the next three (3) months. PhillipCapital (India) Pvt. Ltd is not a market maker in the securities mentioned in this research report, although it, or its affiliates/employees, may have positions in, purchase or sell, or be materially interested in any of the securities covered in the report.

Page | 30 | PHILLIPCAPITAL INDIA RESEARCH
MARKET INTELLIGENCE MONTHLY UPDATE
Suitability and Risks: This research report is for informational purposes only and is not tailored to the specific investment objectives, financial situation or particular requirements of any individual recipient hereof. Certain securities may give rise to substantial risks and may not be suitable for certain investors. Each investor must make its own determination as to the appropriateness of any securities referred to in this research report based upon the legal, tax and accounting considerations applicable to such investor and its own investment objectives or strategy, its financial situation and its investing experience. The value of any security may be positively or adversely affected by changes in foreign exchange or interest rates, as well as by other financial, economic, or political factors. Past performance is not necessarily indicative of future performance or results.
Sources, Completeness and Accuracy: The material herein is based upon information obtained from sources that PCIPL and the research analyst believe to be reliable, but neither PCIPL nor the research analyst represents or guarantees that the information contained herein is accurate or complete and it should not be relied upon as such. Opinions expressed herein are current opinions as of the date appearing on this material, and are subject to change without notice. Furthermore, PCIPL is under no obligation to update or keep the information current. Without limiting any of the foregoing, in no event shall PCIL, any of its affiliates/employees or any third party involved in, or related to computing or compiling the information have any liability for any damages of any kind including but not limited to any direct or consequential loss or damage, however arising, from the use of this document.
Copyright: The copyright in this research report belongs exclusively to PCIPL. All rights are reserved. Any unauthorised use or disclosure is prohibited. No reprinting or reproduction, in whole or in part, is permitted without the PCIPL’s prior consent, except that a recipient may reprint it for internal circulation only and only if it is reprinted in its entirety.
Caution: Risk of loss in trading/investment can be substantial and even more than the amount / margin given by you. Investment in securities market are subject to market risks, you are requested to read all the related documents carefully before investing. You should carefully consider whether trading/investment is appropriate for you in light of your experience, objectives, financial resources and other relevant circumstances. PhillipCapital and any of its employees, directors, associates, group entities, or affiliates shall not be liable for losses, if any, incurred by you. You are further cautioned that trading/investments in financial markets are subject to market risks and are advised to seek independent third party trading/investment advice outside PhillipCapital/group/associates/affiliates/directors/employees before and during your trading/investment. There is no guarantee/assurance as to returns or profits or capital protection or appreciation. PhillipCapital and any of its employees, directors, associates, and/or employees, directors, associates of PhillipCapital’s group entities or affiliates is not inducing you for trading/investing in the financial market(s). Trading/Investment decision is your sole responsibility. You must also read the Risk Disclosure Document and Do’s and Don’ts before investing.
Kindly note that past performance is not necessarily a guide to future performance.
For Detailed Disclaimer: Please visit our website www.phillipcapital.in
For U.S. persons only: This research report is a product of PhillipCapital (India) Pvt Ltd., which is the employer of the research analyst(s) who has prepared the research report. The research analyst(s) preparing the research report is/are resident outside the United States (U.S.) and are not associated persons of any U.S.-regulated broker-dealer and therefore the analyst(s) is/are not subject to supervision by a U.S. broker-dealer, and is/are not required to satisfy the regulatory licensing requirements of FINRA or required to otherwise comply with U.S. rules or regulations regarding, among other things, communications with a subject company, public appearances, and trading securities held by a research analyst account.
This report is intended for distribution by PhillipCapital (India) Pvt Ltd. only to "Major Institutional Investors" as defined by Rule 15a-6(b)(4) of the U.S. Securities and Exchange Act, 1934 (the Exchange Act) and interpretations thereof by the U.S. Securities and Exchange Commission (SEC) in reliance on Rule 15a 6(a)(2). If the recipient of this report is not a Major Institutional Investor as specified above, then it should not act upon this report and return the same to the sender. Further, this report may not be copied, duplicated, and/or transmitted onward to any U.S. person, which is not a Major Institutional Investor. In reliance on the exemption from registration provided by Rule 15a-6 of the Exchange Act and interpretations thereof by the SEC in order to conduct certain business with Major Institutional Investors, PhillipCapital (India) Pvt Ltd. has
entered into an agreement with a U.S. registered broker-dealer, Decker & Co, LLC. Transactions in securities discussed in this research report should be effected through Decker & Co, LLC or another U.S. registered broker dealer. If Distribution is to Australian Investors
This report is produced by PhillipCapital (India) Pvt Ltd and is being distributed in Australia by Phillip Capital Limited (Australian Financial Services Licence No. 246827). This report contains general securities advice and does not take into account your personal objectives, situation and needs. Please read the Disclosures and Disclaimers set out above. By receiving or reading this report, you agree to
be bound by the terms and limitations set out above. Any failure to comply with these terms and limitations may constitute a violation of law. This report has been provided to you for personal use only and shall not be reproduced, distributed or published by you in whole or in part, for any purpose. If you have received this report by mistake, please delete or destroy it, and notify the sender immediately.
PhillipCapital (India) Pvt. Ltd. Registered office: No. 1, 18th Floor, Urmi Estate, 95 Ganpatrao Kadam Marg, Lower Parel West, Mumbai 400013