Embed Size (px)
Citation preview

INSTITUTIONAL EQUITY RESEARCH
Page | 1 | PHILLIPCAPITAL INDIA RESEARCH Please see penultimate page for additional important disclosures. PhillipCapital (India) Private Limited. (“PHILLIPCAP”) is a foreign broker-dealer unregistered in the USA. PHILLIPCAP research is prepared by research analysts who are not registered in the USA. PHILLIPCAP research is distributed in the USA pursuant to Rule 15a-6 of the Securities Exchange Act of 1934 solely by Rosenblatt Securities Inc, an SEC registered and FINRA-member broker-dealer.
KEC International (KECI IN)
In-line operating results; diversifying to di-risk slowdown in T&D
INDIA | CAPITAL GOODS | Quarterly Update
10 February 2020
Top takeaways from 3QFY20 Recurring PAT (Rs 1.4bn, +31% yoy) was 8%/3% below our/consensus estimates on
higher than expected interest costs and lower other income even as EBITDA was inline.
Order inflows Rs 66bn grew 47% yoy led by orders from railways and metro projects (60% of inflows). Order book (Rs 220bn, +19% yoy) stood at 1.8x TTM Sales.
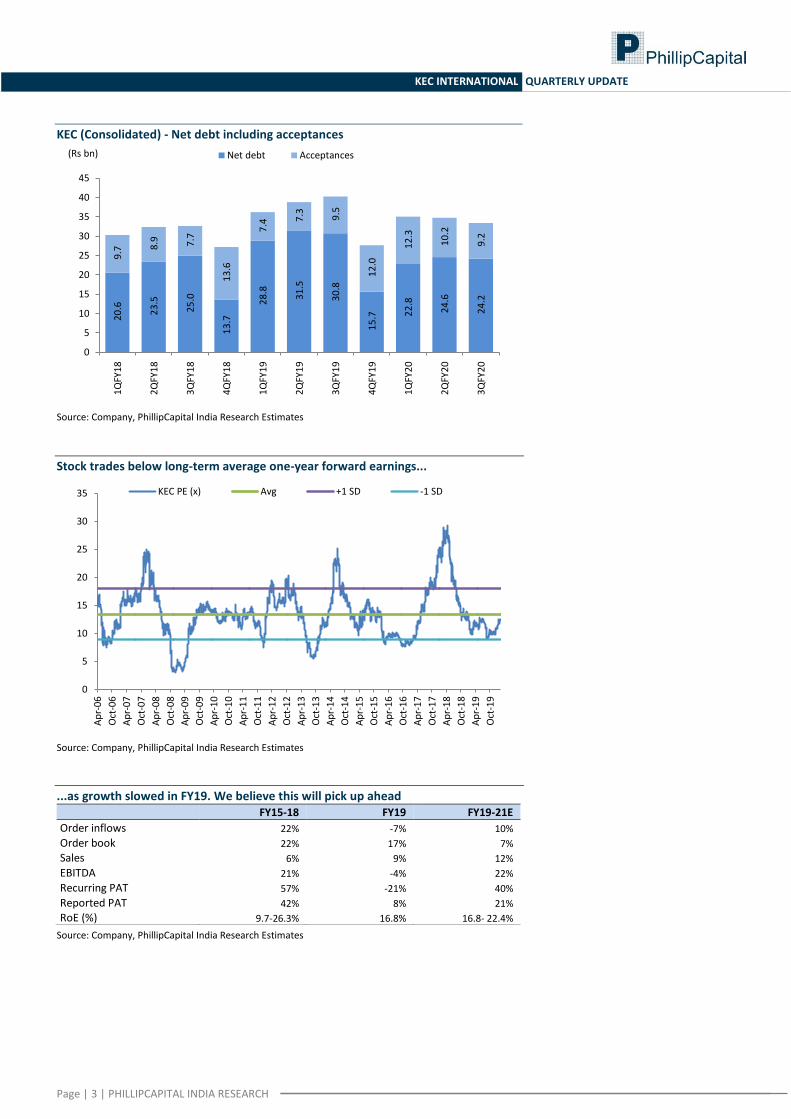
Net debt (including acceptances) declined 16% yoy/4% qoq to Rs 33.4bn as working capital intensity reduced to 123 days vs. 145 days yoy (vs. 120 days qoq).
Key highlights: Revenues at 30.7bn grew 16% yoy (inline) driven by strong growth in T&D (70% of sales, +21% yoy) on strong execution in overseas projects (mainly at SAE) along with railways (20% of sales, +9%) and Smart infra/solar (+163%); while cables and civil revenues declined. Gross margins expanded 210bps yoy due to favourable sales mix on account of higher export sales. However, EBTIDA margin at 10.4% contracted 25bps yoy due to higher employee costs (+43%) attributed to increased manpower in railways and overseas T&D projects (at SAE and Africa) and other expenses (+23%) even after Rs 250mn forex gain.
Conference call takeaways Management cut its guidance for FY20 order inflows to Rs 140bn, flat yoy (vs. +15-20%
earlier) - implying Rs 55bn (+18% yoy) new orders in 4Q, of which it has already won Rs 12.6bn of orders and is L1 in another Rs 25bn projects.
However, it maintained FY20 revenue guidance at 15-20% yoy (vs. 16% in 9M) and flat margins of 10.5%. This implies a 13-28% revenue growth in 4Q which would be driven by railways (+66% yoy, as it expects Rs 27bn sales in FY20), SAE (pick-up in execution of EPC projects) and Civil (on execution of metro projects).
Management expects to achieve double digit margin for the Railway business by 4QFY20.
KEC has collected Rs 6.8bn YTD against receivables from Saudi Arabia which has been normalised with no over-dues. Management expects that execution of stalled Essel project to restart in March 2020 and does not see any risk to its receivables of Rs 1.5bn.
Outlook and valuation: KEC is pro-actively de-risking itself from the structural slowdown in power T&D business (65% of sales) by expanding its civil construction portfolio into new sectors such as metro rail, defence, and oil & gas etc. It is targeting Rs 40bn (vs. Rs 5bn in FY19) sales from civil segment over next 3-4 years. Civil now accounts 11% of its order book (vs. 2% in FY19). Though margins would be lower in metro projects but it should be compensated by lower working capital requirements, resulting in decline in interest costs.
We have raised our FY21 earnings by 10% to factor in higher execution. Based on our revised estimates we expect a 21% CAGR in FY19-21 reported earnings. We maintain our BUY rating with a revised target price of Rs 390 (Rs 310 earlier). We base our target price on 13x PE FY21E (against 12x earlier) to credit the management’s diversification efforts.
Key near term risks to our thesis would be KEC’s inability to recover receivables from slow moving projects and further delay in order placement.
BUY (Maintain) CMP RS 348 TARGET RS 390 (+12%)
SEBI CATEGORY: SMALL CAP
COMPANY DATA
O/S SHARES (MN) : 257
MARKET CAP (RSBN) : 89
MARKET CAP (USDBN) : 1.3
52 - WK HI/LO (RS) : 354 / 230
LIQUIDITY 3M (USDMN) : 1.5
PAR VALUE (RS) : 2
SHARE HOLDING PATTERN, %
Dec 19 Sep 19 Jun 19
PROMOTERS : 51.6 51.6 51.4
FII / NRI : 8.2 8.0 7.3
FI / MF : 27.3 26.7 25.8
NON PRO : 2.1 2.1 2.3
PUBLIC & OTHERS : 10.9 11.6 13.4
KEY FINANCIALS
Rs bn FY19 FY20E FY21E
Net Sales 110.01 127.85 138.44 EBIDTA 9.86 13.43 14.64 Net Profit 4.96 6.26 7.30 EPS, Rs 14.4 25.4 28.4 PER, x 24.1 13.7 12.2 EV/EBIDTA, x 10.6 8.4 7.3 P/BV, x 3.7 3.1 2.5 ROE, % 16.8 24.5 22.4 Total debt/Equity (%) 75.5 92.5 65.7 CHANGE IN ESTIMATES
__Revised Est. __ __% Revision__
Rs bn FY20E FY21E FY20E FY21E
Revenue 127.8 138.4 2% 5%
EBITDA 13.4 14.6 1% 6%
Core PAT 6.5 7.3 1% 10%
EPS (Rs) 25.4 28.4 1% 10% Jonas Bhutta, Research Analyst (+ 9122 6246 4119) [email protected] Vikram Rawat, Research Associate (+ 9122 6246 4120) [email protected] Sandesh Shetty, Research Associate (+ 9122 6246 4139) [email protected]
(Rs mn) Q3FY20 Q3FY19 Change yoy vs. expectations Comments
Order book 2,20,110 1,84,870 19% 2% Stood at 1.8x TTM sales; supports near term revenue visibility
Order inflow 66,050 45,070 47% 0% Led by orders from railways and metro projects - 60% of inflows
Sales 30,731 26,466 16% 0% Driven by strong growth in T&D on strong growth in overseas projects mainly in SAE
Gross margin (%) 30.3% 28.2% 209 bps 211 bps On favorable sales mix on account of higher export sales
EBITDA 3,185 2,814 13% -2% Benefits of improved gross margins was offset by higher employee costs and other
expenses EBITDA margin (%) 10.4% 10.6% -27 bps -22 bps
Recurring PAT 1,449 1,109 31% -8%
Reported PAT 1,449 1,124 29% -8%

Page | 2 | PHILLIPCAPITAL INDIA RESEARCH
KEC INTERNATIONAL QUARTERLY UPDATE
KEC (Consolidated) - quarterly results Rs mn Q3FY20 Q3FY19 Change yoy
Net Sales 30,731 26,466 16% Cost of goods & services 21,422 19,003 13% % of sales 69.7% 71.8% -209 bps Gross profit 9,309 7,464 25% Gross margin 30.3% 28.2% 209 bps Employee cost 3,014 2,111 43% % of sales 9.8% 8.0% 183 bps Other Expenses 3,110 2,539 23% % of sales 10.1% 9.6% 53 bps EBITDA 3,185 2,814 13% EBITDA margins (%) 10.4% 10.6% -27 bps Depreciation 367 309 19% EBIT 2,818 2,505 12% EBIT margins (%) 9.2% 9.5% -30 bps Interest 811 857 -5% Other Income 21 36 -42% PBT 2,028 1,684 20% Tax 579 575 1% Effective tax rate (%) 28.5% 34.1% -558 bps Recurring PAT 1,449 1,109 31% PAT Margin (%) 4.7% 4.2% 53 bps Discontinued operations PAT - 15 na Exceptional - - na Reported PAT 1,449 1,124 29% Recurring EPS (Rs) 5.6 4.3 31%
KEC (Standalone) - quarterly results Rs mn Q3FY20 Q3FY19 Change yoy
Net Sales 26,469 24,685 7% Cost of goods & services 18,738 18,117 3% % of sales 70.8% 73.4% -260 bps Gross profit 7,731 6,568 18% Gross margin 29.2% 26.6% 260 bps Employee cost 1,958 1,620 21% % of sales 7.4% 6.6% 83 bps Other Expenses 2,741 2,208 24% % of sales 10.4% 8.9% 141 bps EBITDA 3,032 2,739 11% EBITDA margins (%) 11.5% 11.1% 36 bps Depreciation 293 263 11% EBIT 2,739 2,476 11% EBIT margins (%) 10.3% 10.0% 32 bps Interest 746 794 -6% Other Income 22 46 -52% PBT 2,015 1,727 17% Tax 559 582 -4% Effective tax rate (%) 27.7% 33.7% -596 bps Recurring PAT 1,456 1,145 27% PAT Margin (%) 5.5% 4.6% 86 bps Discontinued Operations PAT - - na Exceptional - - na Reported PAT 1,456 1,145 27% Recurring EPS (Rs) 5.7 4.5 27%
Source: Company, PhillipCapital India Research Estimates
KEC (Consolidated) - Segment‐wise analysis Rs mn Q3FY20 Q3FY19 Change yoy
Segment-wise order inflows Transmission 21,698 29,984 -28%
SAE 1,415 3,111 -55% Cables 3,054 3,028 1% Railways 21,134 8,694 143% Solar & smart city (42) (74) -43% Civil & Water 18,791 326 5664% Order inflows 66,050 45,070 47% Segment-wise order book Transmission 1,06,753 1,14,552 -7% SAE 13,427 19,312 -30% Cables 4,182 2,678 56% Railways 68,454 44,752 53% Solar & smart city 2,421 618 292% Civil & Water 24,872 2,958 741% Order book 2,20,110 1,84,870 19% Segment-wise revenue Transmission 17,030 15,630 9% SAE 4,320 1,950 122% Cables 2,490 3,100 -20% Railways 6,010 5,510 9% Solar & smart city 420 160 163% Civil & Water 870 1,100 -21% Less: Inter SBU (410) (980) -58% Revenue 30,730 26,470 16%
KEC (subsidiaries – derived) - quarterly results Rs mn Q3FY20 Q3FY19 Change yoy
Net Sales* 4,320 1,950 122% Cost of goods & services* 2,742 1,054 160% % of sales 63.5% 54.1% 942 bps Gross profit 1,578 896 76% Gross margin 36.5% 45.9% -942 bps Employee cost 1,056 491 115% % of sales 24.4% 25.2% -73 bps Other Expenses 369 330 12% % of sales 8.5% 16.9% -840 bps EBITDA 153 75 105% EBITDA margins (%) 3.5% 3.8% -29 bps Depreciation 74 45 62% EBIT 79 29 170% EBIT margins (%) 1.8% 1.5% 33 bps Interest 65 63 3% Other Income (2) (10) -85% PBT 13 (44) -129% Tax 20 (7) -368% Effective tax rate (%) 156% 17% 13869 bps Recurring PAT (7) (36) -80% PAT Margin (%) -0.2% -1.9% 169 bps Discontinued Operations PAT - 15 -100% Exceptional - - na Reported PAT (7) (22) -67% Recurring EPS (Rs) (0.0) (0.1) -80%
Source: Company, PhillipCapital India Research Estimates
Page | 3 | PHILLIPCAPITAL INDIA RESEARCH
KEC INTERNATIONAL QUARTERLY UPDATE
KEC (Consolidated) - Net debt including acceptances
Source: Company, PhillipCapital India Research Estimates
Stock trades below long-term average one-year forward earnings...
Source: Company, PhillipCapital India Research Estimates
...as growth slowed in FY19. We believe this will pick up ahead
FY15-18 FY19 FY19-21E
Order inflows 22% -7% 10%
Order book 22% 17% 7%
Sales 6% 9% 12%
EBITDA 21% -4% 22%
Recurring PAT 57% -21% 40%
Reported PAT 42% 8% 21%
RoE (%) 9.7-26.3% 16.8% 16.8- 22.4%
Source: Company, PhillipCapital India Research Estimates
20
.6
23
.5
25
.0
13
.7
28
.8
31
.5
30
.8
15
.7
22
.8
24
.6
24
.2
9.7
8.9
7.7
13
.6
7.4
7.3
9.5
12
.0
12
.3
10
.2
9.2
0
5
10
15
20
25
30
35
40
45
1Q
FY1
8
2Q
FY1
8
3Q
FY1
8
4Q
FY1
8
1Q
FY1
9
2Q
FY1
9
3Q
FY1
9
4Q
FY1
9
1Q
FY2
0
2Q
FY2
0
3Q
FY2
0
(Rs bn) Net debt Acceptances
0
5
10
15
20
25
30
35
Ap
r-0
6
Oct
-06
Ap
r-0
7
Oct
-07
Ap
r-0
8
Oct
-08
Ap
r-0
9
Oct
-09
Ap
r-1
0
Oct
-10
Ap
r-1
1
Oct
-11
Ap
r-1
2
Oct
-12
Ap
r-1
3
Oct
-13
Ap
r-1
4
Oct
-14
Ap
r-1
5
Oct
-15
Ap
r-1
6
Oct
-16
Ap
r-1
7
Oct
-17
Ap
r-1
8
Oct
-18
Ap
r-1
9
Oct
-19
KEC PE (x) Avg +1 SD -1 SD
Page | 4 | PHILLIPCAPITAL INDIA RESEARCH
KEC INTERNATIONAL QUARTERLY UPDATE
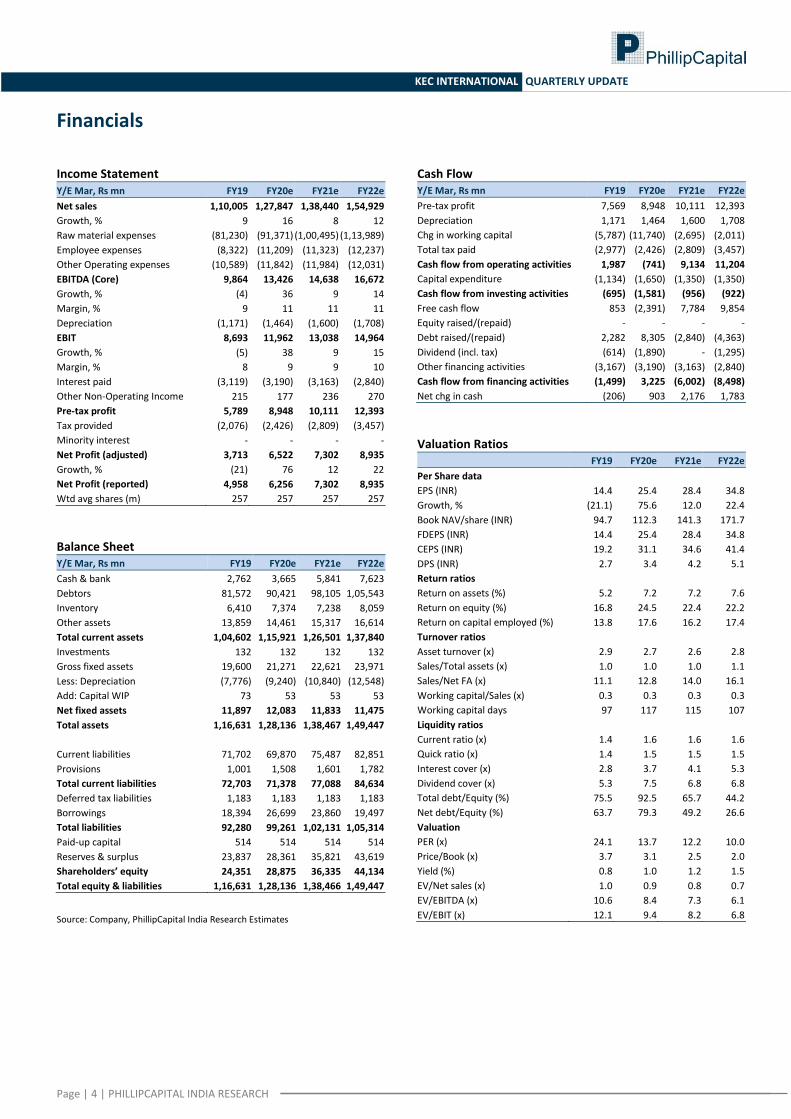
Financials
Income Statement Y/E Mar, Rs mn FY19 FY20e FY21e FY22e
Net sales 1,10,005 1,27,847 1,38,440 1,54,929
Growth, % 9 16 8 12
Raw material expenses (81,230) (91,371) (1,00,495) (1,13,989)
Employee expenses (8,322) (11,209) (11,323) (12,237)
Other Operating expenses (10,589) (11,842) (11,984) (12,031)
EBITDA (Core) 9,864 13,426 14,638 16,672
Growth, % (4) 36 9 14
Margin, % 9 11 11 11
Depreciation (1,171) (1,464) (1,600) (1,708)
EBIT 8,693 11,962 13,038 14,964
Growth, % (5) 38 9 15
Margin, % 8 9 9 10
Interest paid (3,119) (3,190) (3,163) (2,840)
Other Non-Operating Income 215 177 236 270
Pre-tax profit 5,789 8,948 10,111 12,393
Tax provided (2,076) (2,426) (2,809) (3,457)
Minority interest - - - -
Net Profit (adjusted) 3,713 6,522 7,302 8,935
Growth, % (21) 76 12 22
Net Profit (reported) 4,958 6,256 7,302 8,935
Wtd avg shares (m) 257 257 257 257
Balance Sheet Y/E Mar, Rs mn FY19 FY20e FY21e FY22e
Cash & bank 2,762 3,665 5,841 7,623
Debtors 81,572 90,421 98,105 1,05,543
Inventory 6,410 7,374 7,238 8,059
Other assets 13,859 14,461 15,317 16,614
Total current assets 1,04,602 1,15,921 1,26,501 1,37,840
Investments 132 132 132 132
Gross fixed assets 19,600 21,271 22,621 23,971
Less: Depreciation (7,776) (9,240) (10,840) (12,548)
Add: Capital WIP 73 53 53 53
Net fixed assets 11,897 12,083 11,833 11,475
Total assets 1,16,631 1,28,136 1,38,467 1,49,447
Current liabilities 71,702 69,870 75,487 82,851
Provisions 1,001 1,508 1,601 1,782
Total current liabilities 72,703 71,378 77,088 84,634
Deferred tax liabilities 1,183 1,183 1,183 1,183
Borrowings 18,394 26,699 23,860 19,497
Total liabilities 92,280 99,261 1,02,131 1,05,314
Paid-up capital 514 514 514 514
Reserves & surplus 23,837 28,361 35,821 43,619
Shareholders’ equity 24,351 28,875 36,335 44,134
Total equity & liabilities 1,16,631 1,28,136 1,38,466 1,49,447
Source: Company, PhillipCapital India Research Estimates
Cash Flow Y/E Mar, Rs mn FY19 FY20e FY21e FY22e
Pre-tax profit 7,569 8,948 10,111 12,393
Depreciation 1,171 1,464 1,600 1,708
Chg in working capital (5,787) (11,740) (2,695) (2,011)
Total tax paid (2,977) (2,426) (2,809) (3,457)
Cash flow from operating activities 1,987 (741) 9,134 11,204
Capital expenditure (1,134) (1,650) (1,350) (1,350)
Cash flow from investing activities (695) (1,581) (956) (922)
Free cash flow 853 (2,391) 7,784 9,854
Equity raised/(repaid) - - - -
Debt raised/(repaid) 2,282 8,305 (2,840) (4,363)
Dividend (incl. tax) (614) (1,890) - (1,295)
Other financing activities (3,167) (3,190) (3,163) (2,840)
Cash flow from financing activities (1,499) 3,225 (6,002) (8,498)
Net chg in cash (206) 903 2,176 1,783
Valuation Ratios
FY19 FY20e FY21e FY22e
Per Share data
EPS (INR) 14.4 25.4 28.4 34.8
Growth, % (21.1) 75.6 12.0 22.4
Book NAV/share (INR) 94.7 112.3 141.3 171.7
FDEPS (INR) 14.4 25.4 28.4 34.8
CEPS (INR) 19.2 31.1 34.6 41.4
DPS (INR) 2.7 3.4 4.2 5.1
Return ratios Return on assets (%) 5.2 7.2 7.2 7.6
Return on equity (%) 16.8 24.5 22.4 22.2
Return on capital employed (%) 13.8 17.6 16.2 17.4
Turnover ratios Asset turnover (x) 2.9 2.7 2.6 2.8
Sales/Total assets (x) 1.0 1.0 1.0 1.1
Sales/Net FA (x) 11.1 12.8 14.0 16.1
Working capital/Sales (x) 0.3 0.3 0.3 0.3
Working capital days 97 117 115 107
Liquidity ratios
Current ratio (x) 1.4 1.6 1.6 1.6
Quick ratio (x) 1.4 1.5 1.5 1.5
Interest cover (x) 2.8 3.7 4.1 5.3
Dividend cover (x) 5.3 7.5 6.8 6.8
Total debt/Equity (%) 75.5 92.5 65.7 44.2
Net debt/Equity (%) 63.7 79.3 49.2 26.6
Valuation
PER (x) 24.1 13.7 12.2 10.0
Price/Book (x) 3.7 3.1 2.5 2.0
Yield (%) 0.8 1.0 1.2 1.5
EV/Net sales (x) 1.0 0.9 0.8 0.7
EV/EBITDA (x) 10.6 8.4 7.3 6.1
EV/EBIT (x) 12.1 9.4 8.2 6.8
Page | 5 | PHILLIPCAPITAL INDIA RESEARCH
KEC INTERNATIONAL QUARTERLY UPDATE
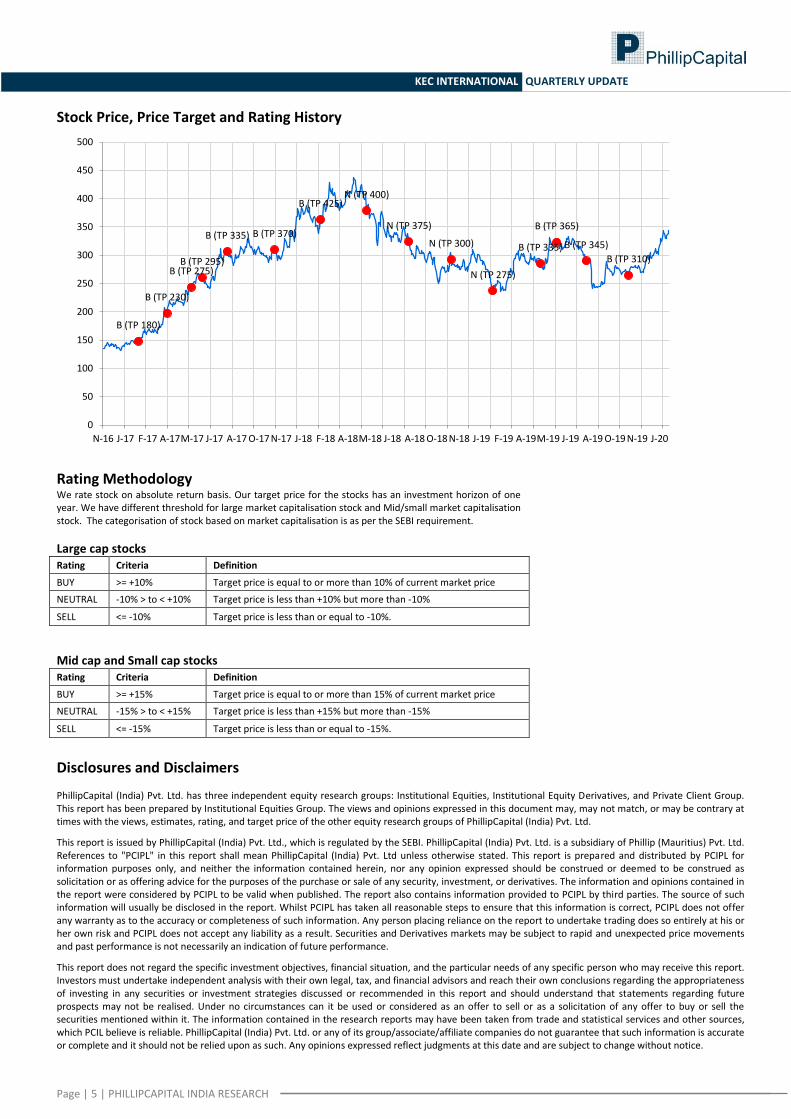
Stock Price, Price Target and Rating History
Rating Methodology We rate stock on absolute return basis. Our target price for the stocks has an investment horizon of one year. We have different threshold for large market capitalisation stock and Mid/small market capitalisation stock. The categorisation of stock based on market capitalisation is as per the SEBI requirement.
Large cap stocks Rating Criteria Definition
BUY >= +10% Target price is equal to or more than 10% of current market price
NEUTRAL -10% > to < +10% Target price is less than +10% but more than -10%
SELL <= -10% Target price is less than or equal to -10%.
Mid cap and Small cap stocks Rating Criteria Definition
BUY >= +15% Target price is equal to or more than 15% of current market price
NEUTRAL -15% > to < +15% Target price is less than +15% but more than -15%
SELL <= -15% Target price is less than or equal to -15%.
Disclosures and Disclaimers PhillipCapital (India) Pvt. Ltd. has three independent equity research groups: Institutional Equities, Institutional Equity Derivatives, and Private Client Group. This report has been prepared by Institutional Equities Group. The views and opinions expressed in this document may, may not match, or may be contrary at times with the views, estimates, rating, and target price of the other equity research groups of PhillipCapital (India) Pvt. Ltd.
This report is issued by PhillipCapital (India) Pvt. Ltd., which is regulated by the SEBI. PhillipCapital (India) Pvt. Ltd. is a subsidiary of Phillip (Mauritius) Pvt. Ltd. References to "PCIPL" in this report shall mean PhillipCapital (India) Pvt. Ltd unless otherwise stated. This report is prepared and distributed by PCIPL for information purposes only, and neither the information contained herein, nor any opinion expressed should be construed or deemed to be construed as solicitation or as offering advice for the purposes of the purchase or sale of any security, investment, or derivatives. The information and opinions contained in the report were considered by PCIPL to be valid when published. The report also contains information provided to PCIPL by third parties. The source of such information will usually be disclosed in the report. Whilst PCIPL has taken all reasonable steps to ensure that this information is correct, PCIPL does not offer any warranty as to the accuracy or completeness of such information. Any person placing reliance on the report to undertake trading does so entirely at his or her own risk and PCIPL does not accept any liability as a result. Securities and Derivatives markets may be subject to rapid and unexpected price movements and past performance is not necessarily an indication of future performance.
This report does not regard the specific investment objectives, financial situation, and the particular needs of any specific person who may receive this report. Investors must undertake independent analysis with their own legal, tax, and financial advisors and reach their own conclusions regarding the appropriateness of investing in any securities or investment strategies discussed or recommended in this report and should understand that statements regarding future prospects may not be realised. Under no circumstances can it be used or considered as an offer to sell or as a solicitation of any offer to buy or sell the securities mentioned within it. The information contained in the research reports may have been taken from trade and statistical services and other sources, which PCIL believe is reliable. PhillipCapital (India) Pvt. Ltd. or any of its group/associate/affiliate companies do not guarantee that such information is accurate or complete and it should not be relied upon as such. Any opinions expressed reflect judgments at this date and are subject to change without notice.
B (TP 180)
B (TP 230)
B (TP 275) B (TP 295)
B (TP 335) B (TP 370)
B (TP 425) N (TP 400)
N (TP 375)
N (TP 300)
N (TP 275)
B (TP 335)
B (TP 365)
B (TP 345)
B (TP 310)
0
50
100
150
200
250
300
350
400
450
500
N-16 J-17 F-17 A-17M-17 J-17 A-17 O-17 N-17 J-18 F-18 A-18M-18 J-18 A-18 O-18 N-18 J-19 F-19 A-19M-19 J-19 A-19 O-19 N-19 J-20
Page | 6 | PHILLIPCAPITAL INDIA RESEARCH
KEC INTERNATIONAL QUARTERLY UPDATE
Important: These disclosures and disclaimers must be read in conjunction with the research report of which it forms part. Receipt and use of the research report is subject to all aspects of these disclosures and disclaimers. Additional information about the issuers and securities discussed in this research report is available on request.
Certifications: The research analyst(s) who prepared this research report hereby certifies that the views expressed in this research report accurately reflect the research analyst’s personal views about all of the subject issuers and/or securities, that the analyst(s) have no known conflict of interest and no part of the research analyst’s compensation was, is, or will be, directly or indirectly, related to the specific views or recommendations contained in this research report.
Additional Disclosures of Interest: Unless specifically mentioned in Point No. 9 below: 1. The Research Analyst(s), PCIL, or its associates or relatives of the Research Analyst does not have any financial interest in the company(ies) covered in
this report. 2. The Research Analyst, PCIL or its associates or relatives of the Research Analyst affiliates collectively do not hold more than 1% of the securities of the
company (ies)covered in this report as of the end of the month immediately preceding the distribution of the research report. 3. The Research Analyst, his/her associate, his/her relative, and PCIL, do not have any other material conflict of interest at the time of publication of this
research report. 4. The Research Analyst, PCIL, and its associates have not received compensation for investment banking or merchant banking or brokerage services or for
any other products or services from the company(ies) covered in this report, in the past twelve months. 5. The Research Analyst, PCIL or its associates have not managed or co-managed in the previous twelve months, a private or public offering of securities for
the company (ies) covered in this report. 6. PCIL or its associates have not received compensation or other benefits from the company(ies) covered in this report or from any third party, in
connection with the research report. 7. The Research Analyst has not served as an Officer, Director, or employee of the company (ies) covered in the Research report. 8. The Research Analyst and PCIL has not been engaged in market making activity for the company(ies) covered in the Research report. 9. Details of PCIL, Research Analyst and its associates pertaining to the companies covered in the Research report:
Sr. no. Particulars Yes/No
1 Whether compensation has been received from the company(ies) covered in the Research report in the past 12 months for investment banking transaction by PCIL
No
2 Whether Research Analyst, PCIL or its associates or relatives of the Research Analyst affiliates collectively hold more than 1% of the company(ies) covered in the Research report
No
3 Whether compensation has been received by PCIL or its associates from the company(ies) covered in the Research report No
4 PCIL or its affiliates have managed or co-managed in the previous twelve months a private or public offering of securities for the company(ies) covered in the Research report
No
5 Research Analyst, his associate, PCIL or its associates have received compensation for investment banking or merchant banking or brokerage services or for any other products or services from the company(ies) covered in the Research report, in the last twelve months
No
Independence: PhillipCapital (India) Pvt. Ltd. has not had an investment banking relationship with, and has not received any compensation for investment banking services from, the subject issuers in the past twelve (12) months, and PhillipCapital (India) Pvt. Ltd does not anticipate receiving or intend to seek compensation for investment banking services from the subject issuers in the next three (3) months. PhillipCapital (India) Pvt. Ltd is not a market maker in the securities mentioned in this research report, although it, or its affiliates/employees, may have positions in, purchase or sell, or be materially interested in any of the securities covered in the report.
Suitability and Risks: This research report is for informational purposes only and is not tailored to the specific investment objectives, financial situation or particular requirements of any individual recipient hereof. Certain securities may give rise to substantial risks and may not be suitable for certain investors. Each investor must make its own determination as to the appropriateness of any securities referred to in this research report based upon the legal, tax and accounting considerations applicable to such investor and its own investment objectives or strategy, its financial situation and its investing experience. The value of any security may be positively or adversely affected by changes in foreign exchange or interest rates, as well as by other financial, economic, or political factors. Past performance is not necessarily indicative of future performance or results.
Sources, Completeness and Accuracy: The material herein is based upon information obtained from sources that PCIPL and the research analyst believe to be reliable, but neither PCIPL nor the research analyst represents or guarantees that the information contained herein is accurate or complete and it should not be relied upon as such. Opinions expressed herein are current opinions as of the date appearing on this material, and are subject to change without notice. Furthermore, PCIPL is under no obligation to update or keep the information current. Without limiting any of the foregoing, in no event shall PCIL, any of its affiliates/employees or any third party involved in, or related to computing or compiling the information have any liability for any damages of any kind including but not limited to any direct or consequential loss or damage, however arising, from the use of this document.
Copyright: The copyright in this research report belongs exclusively to PCIPL. All rights are reserved. Any unauthorised use or disclosure is prohibited. No reprinting or reproduction, in whole or in part, is permitted without the PCIPL’s prior consent, except that a recipient may reprint it for internal circulation only and only if it is reprinted in its entirety.
Caution: Risk of loss in trading/investment can be substantial and even more than the amount / margin given by you. Investment in securities market are subject to market risks, you are requested to read all the related documents carefully before investing. You should carefully consider whether trading/investment is appropriate for you in light of your experience, objectives, financial resources and other relevant circumstances. PhillipCapital and any of its employees, directors, associates, group entities, or affiliates shall not be liable for losses, if any, incurred by you. You are further cautioned that trading/investments in financial markets are subject to market risks and are advised to seek independent third party trading/investment advice outside PhillipCapital/group/associates/affiliates/directors/employees before and during your trading/investment. There is no guarantee/assurance as to returns or profits or capital protection or appreciation. PhillipCapital and any of its employees, directors, associates, and/or employees, directors, associates of PhillipCapital’s group entities or affiliates is not inducing you for trading/investing in the financial market(s). Trading/Investment decision is your sole responsibility. You must also read the Risk Disclosure Document and Do’s and Don’ts before investing.
Kindly note that past performance is not necessarily a guide to future performance.
For Detailed Disclaimer: Please visit our website www.phillipcapital.in

Page | 7 | PHILLIPCAPITAL INDIA RESEARCH
KEC INTERNATIONAL QUARTERLY UPDATE
IMPORTANT DISCLOSURES FOR U.S. PERSONS This research report is a product of PhillipCapital (India) Pvt. Ltd. which is the employer of the research analyst(s) who has prepared the research report. PhillipCapital (India) Pvt Ltd. is authorized to engage in securities activities in India. PHILLIPCAP is not a registered broker-dealer in the United States and, therefore, is not subject to U.S. rules regarding the preparation of research reports and the independence of research analysts. This research report is provided for distribution to “major U.S. institutional investors” in reliance on the exemption from registration provided by Rule 15a-6 of the U.S. Securities Exchange Act of 1934, as amended (the “Exchange Act”). If the recipient of this report is not a Major Institutional Investor as specified above, then it should not act upon this report and return the same to the sender. Further, this report may not be copied, duplicated and/or transmitted onward to any U.S. person, which is not a Major Institutional Investor.
Any U.S. recipient of this research report wishing to effect any transaction to buy or sell securities or related financial instruments based on the information provided in this research report should do so only through Rosenblatt Securities Inc, 40 Wall Street 59th Floor, New York NY 10005, a registered broker dealer in the United States. Under no circumstances should any recipient of this research report effect any transaction to buy or sell securities or related financial instruments through PHILLIPCAP. Rosenblatt Securities Inc. accepts responsibility for the contents of this research report, subject to the terms set out below, to the extent that it is delivered to a U.S. person other than a major U.S. institutional investor.
The analyst whose name appears in this research report is not registered or qualified as a research analyst with the Financial Industry Regulatory Authority (“FINRA”) and may not be an associated person of Rosenblatt Securities Inc. and, therefore, may not be subject to applicable restrictions under FINRA Rules on communications with a subject company, public appearances and trading securities held by a research analyst account. Ownership and Material Conflicts of Interest Rosenblatt Securities Inc. or its affiliates does not ‘beneficially own,’ as determined in accordance with Section 13(d) of the Exchange Act, 1% or more of any of the equity securities mentioned in the report. Rosenblatt Securities Inc, its affiliates and/or their respective officers, directors or employees may have interests, or long or short positions, and may at any time make purchases or sales as a principal or agent of the securities referred to herein. Rosenblatt Securities Inc. is not aware of any material conflict of interest as of the date of this publication Compensation and Investment Banking Activities Rosenblatt Securities Inc. or any affiliate has not managed or co-managed a public offering of securities for the subject company in the past 12 months, nor received compensation for investment banking services from the subject company in the past 12 months, neither does it or any affiliate expect to receive, or intends to seek compensation for investment banking services from the subject company in the next 3 months. Additional Disclosures This research report is for distribution only under such circumstances as may be permitted by applicable law. This research report has no regard to the specific investment objectives, financial situation or particular needs of any specific recipient, even if sent only to a single recipient. This research report is not guaranteed to be a complete statement or summary of any securities, markets, reports or developments referred to in this research report. Neither PHILLIPCAP nor any of its directors, officers, employees or agents shall have any liability, however arising, for any error, inaccuracy or incompleteness of fact or opinion in this research report or lack of care in this research report’s preparation or publication, or any losses or damages which may arise from the use of this research report.
PHILLIPCAP may rely on information barriers, such as “Chinese Walls” to control the flow of information within the areas, units, divisions, groups, or affiliates of PHILLIPCAP.
Investing in any non-U.S. securities or related financial instruments (including ADRs) discussed in this research report may present certain risks. The securities of non-U.S. issuers may not be registered with, or be subject to the regulations of, the U.S. Securities and Exchange Commission. Information on such non-U.S. securities or related financial instruments may be limited. Foreign companies may not be subject to audit and reporting standards and regulatory requirements comparable to those in effect within the United States.
The value of any investment or income from any securities or related financial instruments discussed in this research report denominated in a currency other than U.S. dollars is subject to exchange rate fluctuations that may have a positive or adverse effect on the value of or income from such securities or related financial instruments.
Past performance is not necessarily a guide to future performance and no representation or warranty, express or implied, is made by PHILLIPCAP with respect to future performance. Income from investments may fluctuate. The price or value of the investments to which this research report relates, either directly or indirectly, may fall or rise against the interest of investors. Any recommendation or opinion contained in this research report may become outdated as a consequence of changes in the environment in which the issuer of the securities under analysis operates, in addition to changes in the estimates and forecasts, assumptions and valuation methodology used herein.
No part of the content of this research report may be copied, forwarded or duplicated in any form or by any means without the prior written consent of PHILLIPCAP and PHILLIPCAP accepts no liability whatsoever for the actions of third parties in this respect.
PhillipCapital (India) Pvt. Ltd. Registered office: 18th floor, Urmi Estate, Ganpatrao Kadam Marg, Lower Parel (West), Mumbai – 400013, India.