Embed Size (px)
Citation preview

Institute of Plant Production and Agroecology in the Tropics and Subtropics
University of Hohenheim
Department of Agroecology in the Tropics and Subtropics
Prof. Dr. Joachim Sauerborn
Human urine as a crop fertilizer under saline conditions
Dissertation
Submitted in fulfillment of the requirements for the degree “Doktor der
Agrarwissenschaften” (Dr. sc. agr./PhD in Agricultural Sciences)
to the
Faculty of Agricultural Sciences
Presented by
Michael Yongha BOH, MSc
Stuttgart, 2013
Urine as a fertilizer under saline conditions
This thesis was accepted as a doctoral dissertation in fulfillment of the requirements for the
degree “Doktor der Agrarwissenschaften” (Dr. sc. agr. / PhD in Agricultural Sciences) by the
Faculty of Agricultural Sciences at the University of Hohenheim on October 16th, 2013.
Date of oral examination: December 16th, 2013.
Examination Committee:
Chairperson: Prof. Dr. Jens Wünsche
Supervisor and Reviewer: Prof. Dr. Joachim Sauerborn
Co-reviewer: Prof. Dr. Torsten Müller
Third Examiner: Prof. Dr. Joachim Müller

The aim (of education) must be the training of independently
acting and thinking individuals who, however, can see in the service to the
community their highest life achievement.
[Albert Einstein 1879 – 1955]

Urine as a fertilizer under saline conditions
i
Table of contents
Author’s Declaration ........................................................................................................................... iv
Acknowledgement ................................................................................................................................. v
Overview of publications ................................................................................................................. vii
1 General introduction .................................................................................................................... 1
1.1 The problem ................................................................................................................ 1
1.2 State-of-the-art............................................................................................................ 2
1.2.1 Use of human excreta in agriculture – Historical background ............................ 2
1.2.2 Content of human urine ....................................................................................... 3
1.2.3 Urine collection and treatment............................................................................ 3
1.2.4 User and crop consumer acceptance ................................................................... 4
1.2.5 Salinity of human urine ........................................................................................ 5
1.3 Objectives .................................................................................................................... 5
1.4 Outline of thesis .......................................................................................................... 5
1.5 References ................................................................................................................... 7
2 Comparative effect of human urine and ammonium nitrate application on maize
(Zea mays L.) grown under various salt (NaCl) concentrations ................................ 11
2.1 Introduction ............................................................................................................... 13
2.2 Material and methods ............................................................................................... 14
2.2.1 Data analyses ..................................................................................................... 17
2.3 Results ....................................................................................................................... 17
2.3.1 Soil chemical composition.................................................................................. 17
a. Electrical conductivity (EC) ................................................................................. 17
b. Exchangeable cations in the substrate .............................................................. 18
c. pH ....................................................................................................................... 18
2.3.2 Biomass yield ...................................................................................................... 19
2.3.3 Leaf nutrient concentrations ............................................................................. 20
2.3.4 Plant height ........................................................................................................ 22
2.3.5 Green leaf area ................................................................................................... 22
2.4 Discussion .................................................................................................................. 23
2.5 Conclusion ................................................................................................................. 25
2.6 Acknowledgments ..................................................................................................... 26
2.7 References ................................................................................................................. 26
3 Interacting effect of urine, ammonium nitrate and NaCl salinity on sorghum
growth and shoot nutrient concentrations ......................................................................... 30
3.1 Introduction ............................................................................................................... 32
3.2 Materials and methods ............................................................................................. 34
3.2.1 Data collection and analyses .............................................................................. 35
3.3 Results ....................................................................................................................... 36
3.3.1 Substrate pHKCl and electrical conductivity (ECe) ............................................... 36

Urine as a fertilizer under saline conditions
ii
3.3.2 Biomass yield and root:shoot ratio .................................................................... 37
3.3.3 Shoot nutrient concentrations ........................................................................... 39
3.4 Discussion .................................................................................................................. 42
3.5 Conclusion ................................................................................................................. 45
3.6 Acknowledgement ..................................................................................................... 46
3.7 References ................................................................................................................. 46
4 Effect of NaCl-induced salinity and human urine fertilization on substrate
chemical properties ....................................................................................................................... 51
4.1 Introduction ............................................................................................................... 53
4.2 Materials and methods ............................................................................................. 54
4.2.1 Exchangeable cations and cation exchange capacity (CECp) ............................. 56
4.2.2 Data analyses ..................................................................................................... 57
4.3 Results ....................................................................................................................... 57
4.3.1 Effect of crop cycle, salinity and urine treatment on substrate pHKCl ............... 57
4.3.2 Effect of crop cycle, salinity and urine fertilization on exchangeable cations, ECe,
CECp and ESP ..................................................................................................................... 57
4.3.3 Effect of crop cycle, salinity and urine fertilization on water extractable
cations.... ........................................................................................................................... 62
4.3.4 Effect of crop cycle, salinity and urine fertilization on water extractable
anions..... ........................................................................................................................... 63
4.4 Discussion .................................................................................................................. 64
4.5 Conclusion ................................................................................................................. 67
4.6 Acknowledgement ..................................................................................................... 67
4.7 References ................................................................................................................. 67
5 Maize (Zea mays L.) response to urine and wood ash fertilization under saline
(NaCl) soil conditions ................................................................................................................... 71
5.1 Introduction ............................................................................................................... 73
5.2 Materials and methods ........................................................................................ 74
5.2.1 Data collection ................................................................................................... 76
5.2.2 Data analysis ...................................................................................................... 77
5.3 Results ....................................................................................................................... 77
5.3.1 pHw and ECe ........................................................................................................ 77
5.3.2 Maize seedling growth ....................................................................................... 78
5.3.3 Shoot K, P, Na, Ca and Mg concentrations ........................................................ 79
5.3.4 Shoot micronutrient content ............................................................................. 81
5.4 Discussion .................................................................................................................. 82
5.4.1 Salinity-fertilizer interaction effect on nutrient concentration ......................... 83
5.5 Conclusion ................................................................................................................. 85
5.6 Acknowledgement ..................................................................................................... 85
5.7 References ................................................................................................................. 85
6 General discussion ..................................................................................................................... 90
6.1 Limitations of this study and implication for future research .................................. 94

Urine as a fertilizer under saline conditions
iii
6.2 References ................................................................................................................. 94
Summary................................................................................................................................................. 97
Zusammenfassung.............................................................................................................................. 99
Résumé..................................................................................................................................................101
Curriculum vitae ............................................................................................................................... 103

Urine as a fertilizer under saline conditions
iv
Author’s Declaration
I, Michael Yongha BOH, hereby declare that this thesis entitled “Human urine as a crop
fertilizer under saline conditions” was written independently as my dissertation for a doctoral
degree at the Faculty of Agricultural Sciences in the University of Hohenheim, Stuttgart –
Germany.
The works of other authors used in this dissertation have been duly credited. This thesis has
not in part or wholly been presented to any other examination board for the award of an
academic degree.
Stuttgart, 2nd October 2013 Michael Yongha Boh

Urine as a fertilizer under saline conditions
v
Acknowledgement
I would like to express my profound gratitude to the Katholische Akademische Ausländer
Dienst (KAAD) Board for providing scholarship funding which made it possible for me to
undertake this doctoral research project. My deepest appreciation goes to my supervisor
Prof. Dr. Joachim Sauerborn who was very supportive of my motivation to pursue research
for a terminal degree and gave me the opportunity to do so under his mentorship. Your very
professional academic guidance, encouragement and fatherly support were invaluable for the
successful realization of this project.
I am thankful to Prof. Dr. Torsten Müller who provided helpful insights on the design of some
of my experiments. He allowed me to use the laboratory of his institute and I found his critical
comments on my manuscripts very useful. I will always remain grateful to Dr. Jörn Germer,
who first introduced me to the concept of recycling human excreta in 2007 and with whom I
exchanged very exciting ideas that culminated to undertaking this doctoral study.
The laboratory support of Frau Böttcher Annerose, Frau Beate Podtschaske, Frau Elke
Feiertag and Frau Helene Ochott are deeply appreciated. Coming from a Geography and
Economics background, these women were the first to introduce me to chemical lab
procedures and were very patient; spending longer-than-usual hours that allowed me finish
my often lengthy laboratory analyses.
I also wish to thank Prof. Dr. Piepho, Dr. Victor Ayala and Dr. Juan Carlos Laso for their helpful
statistical advice.
The Michaelis family, Klaus, Astrid Rosina and Klara will forever be remembered for making
an initial commitment to support my studies in Germany without which I would not have
even started this fruitful journey. I am also deeply indebted to our chaplain, Mr. Odilo Metzler
and the entire ÖHG community for providing accommodation and an enabling environment
for my studies.
I am most grateful to my friends; the Mbengs, Kumas, Nikangs, Ayalas, Auntie Uli, Bobe Ntam
Charles, Dr. Vivian Fien Kimeng, Sr. Chiara Mbom, Rev. (Dr.) Fr. Jum Joseph Awoh, Fr. Aquiline
M’rema and all whose names I cannot mention here for their moral and spiritual support
during the entire period spanning my PhD studies.

Urine as a fertilizer under saline conditions
vi
I am particularly thankful to my parents Bobe John Timngum Boh and Nawayn Theodora
Nsang for their endless support through every rung of the academic ladder. From very little
resources but with a lot of love and inspiration I was able to endure the challenges I
encountered during my studies. To all my brothers and sisters; Timngum, Nange, Yimbum,
Les+, Yuh and Akfua, I appreciate the sacrifices you all made so that I could further my
education. I am grateful for the love and tireless support of my wife Dr. Esther Eneckeh
Yongha-Boh and our daughter, my best friend ever, Afû’ambom A. Yongha-Boh.
To all my colleagues of the Agroecology working group, I appreciate your comments on my
work progress reports during our scientific meetings. The dinner outings, your smiles and
‘Hallos’ provided a relaxed and conducive environment for work. Special thanks to Dr. Anna
Treyte for proof-reading some of my draft manuscripts and to Dr. Marc Cotter for some
useful ideas on my urine-wood ash experiment and for translating to German the summary of
this dissertation.
And to God be All Glory and Honour and Praise for ever, Ameyn!

Urine as a fertilizer under saline conditions
vii
Overview of publications
In compliance with the requirements for a cumulative PhD thesis by the Faculty of
Agricultural Sciences, University of Hohenheim, this thesis is based on publications and
manuscripts resulting from the PhD research project. Each publication has been compiled and
edited according to the requirements of the different publishers. Therefore, the methods for
citation and bibliographic style vary between chapters.
Chapter 2:
Michael Yongha Boh, Jörn Germer, Torsten Müller and Joachim Sauerborn (2013).
Comparative effect of human urine and ammonium nitrate application on maize (Zea mays L.)
grown under various salt (NaCl) concentrations. Journal of Plant Nutrition and Soil Science,
176:703-711.
Chapter 3:
Michael Yongha Boh, Torsten Müller and Joachim Sauerborn (Expected 2013). Interacting
effect of urine, ammonium nitrate and NaCl salinity on sorghum growth and shoot nutrients
concentrations. Journal of Soil Science and Plant Nutrition. Current status: in review.
Chapter 4:
Michael Yongha Boh and Joachim Sauerborn (expected 2014). Effect of NaCl-induced salinity
and human urine fertilization on cultivation substrate chemical properties. Open Journal of
Soil Science. Current status: accepted.
Chapter 5:
Michael Yongha Boh, Torsten Müller and Joachim Sauerborn (2013). Maize (Zea mays L.)
response to urine and wood ash fertilization under saline (NaCl) soil concentrations.
International Journal of AgriScience, Vol. 3(4): 333-345.

Urine as a fertilizer under saline conditions
1
1 General introduction
1.1 The problem
Worldwide, salinity and low soil fertility limit the potential harvest of crops in agricultural
systems. As the world’s population continues to grow rapidly, overcoming these constraints is
mandatory if the demand for biobased products (food, feed, fibre, fuel) from agriculture
should be secured. Salt affected (saline and sodic) soils which constitute more than 6% of the
earth’s land surface are common in semiarid and arid areas where precipitation is often
insufficient to flush salts from the root zone. Salts cause to decrease crop yields through
specific ion toxicity, osmotic pressure and nutrient imbalances (Robbins and Gavlak, 1989;
Yadav et al., 2011). Though soluble salts and exchangeable cations in the soil are natural
products of rocks and mineral weathering (Bui, 2013) the use of saline irrigation water and
poor fertilizer management practices are the main causes of increased soil salinity worldwide
(Epstein et al., 1980). An estimated 20% of irrigated land and 2% of rain-fed agriculture areas
of the earth’s land surface are salt affected (Yildirim et al., 2006). This is expected to increase
with an increase in the number of mouths to feed (Munns and Tester, 2008).
Whereas much research has already been carried out on irrigation-induced salinity and crop
yields (Grattan and Grieve, 1998), only little is known of the effect of fertilizer application on
soil salinity (Jacobs and Timmer, 2005; Mortvedt, 2001). The interactive effects of salts and
exchangeable sodium with fertilizer nutrients on crop yields is complex and often depends on
the degree of salinity/sodicity, soil nutrients concentrations and availability, the type and
amount of fertilizer applied and salt tolerant behaviour of the crop (Feigin, 1985; Flores et al.,
2001; Grattan and Grieve, 1998). In salinity-fertility interaction studies, it has been shown
that up to a certain level of salinity, the application of fertilizers can mitigate the deleterious
effect of salinity on crop growth (Bernstein et al., 1974; Villa-Castorena et al., 2003).
Ironically, most fertilizers are salts or can easily become salts through decomposition (e.g.
urea to ammonium ions) or oxidation (e.g. elemental sulphur to sulphate). Moreover,
commercial inorganic fertilizers are either inaccessible or often too expensive for most
farmers in the south (Morris et al., 2007). Poor farmers therefore, often resort to alternative
fertilizer sources which necessitate research on how using these alternatives can maximize
crop yields under existing saline soil conditions.

Urine as a fertilizer under saline conditions
2
The use of human excreta is an age-old practice, but in the last two decades, farmers both in
the developed and developing countries have shown a heightened interest in human urine as
a source of plant fertilizer (Lienert and Larsen, 2010; Richert et al., 2010; Roma et al., 2013).
According to Vinnerås et al. (2006) an adult human being excretes 1.5 l of urine per day which
is equivalent to 550 litres per annum. It has been estimated that if harvested and recycled in
agriculture, urine can offset the current pressure on fertilizers demand by replacing about 20-
25% of commercial fertilizers currently in use for food production globally (Jönsson, 1994;
Lind et al., 2001).
There is ample evidence from extensive research both at greenhouse and field scale that
urine can substitute commercial inorganic fertilizers (Kirchmann and Pettersson, 1995;
Mnkeni et al., 2008; Morghan, 2007; Pradhan et al., 2007). Although urine is a multi-
component fertilizer, users of urine often target N as the main nutrient (Lind et al., 2001;
Münch and Winker, 2009). Unfortunately, the concentrations of Na+ and Cl- salts in urine are
often too high, placing an additional risk if used on salt affected soils. On this premise, the
World Health Organization has recommended only a restricted use of urine under saline
conditions (World Health Organization, 2006). However, there is limited knowledge on the
interactive effect of urine and salinity on plant nutrition, growth and changes in soil chemical
properties. This thesis seeks to answer the following question: Can urine be used as fertilizer
under saline (here NaCl) soil conditions and if yes, to what extent?
1.2 State-of-the-art
1.2.1 Use of human excreta in agriculture – Historical background
The use of human excreta as a source of plant nutrients has existed since ancient times. For
thousands of years Chinese farmers collected mixed excreta and applied it onto their farms
untreated (Krepp, 1867). This practice became popular among Japanese farmers in the 12th
century who started trading in urine and faeces from urban dwellers. They also placed
buckets at street corners of villages and towns from whence they collected free human
excreta while simultaneously providing public toilets to pedestrians (Matsui, 1997). Today,
even with the availability of mineral fertilizers, about 50% of the excreta in Japanese
municipalities are collected and returned to agricultural land (Drangert, 1998).
By the second half of the 19th century it was already known that the plant nitrogen fraction of
urine was six times higher than that of faeces (Krepp, 1867). However, it was not until the last

Urine as a fertilizer under saline conditions
3
two decades that human urine was first used as a fertilizer in scientific experiments (Karak
and Bhattacharyya, 2011). Since then there has been a growing interest in urine fertilizer
research. Sweden, Germany, Switzerland and Austria are among the leading countries in
Europe where urine is promoted as an alternative to mineral fertilizer (Lienert and Larsen,
2010). In some African countries like Republic of South Africa, Ghana, Mali, Burkina Faso and
Senegal, human excreta is currently gaining more attention as an agricultural input
(Müllegger et al., 2010). Large scale systems for collection and recycling human excreta are in
use in Chinese eco-villages from where collected urine is used in fields (Kvarnström et al.,
2006).
1.2.2 Content of human urine
Urine is a liquid waste product excreted by the kidney and eliminated from the body in the
process of urination. Urine is made up of 95% water and 5% organic solutes and inorganic
ions. The main organic solutes in urine are urea, uric acid, creatinine, trace amounts of
enzymes, carbohydrates and fatty acids meanwhile inorganic ions are sodium (Na+),
potassium (K+), chloride (Cl-), calcium (Ca2+), magnesium (Mg2+), ammonium (NH4+), sulphate
(SO42-) and phosphates (PO4
3-). The concentration of nutrients in urine varies with sex, age,
diet, drinking water consumption and region which are the reasons for variations in reports
from different researchers (Karak and Bhattacharyya, 2011). Though urine accounts only for
1% of the domestic wastewater by volume, it contains 80% nitrogen (N), 55% phosphorus (P)
and 60% potassium (K), which are the major plant nutrients (Jönsson et al. 1997; Jönsson et
al., 2000). It is therefore, apt to collect urine separately from domestic wastewater sources.
1.2.3 Urine collection and treatment
Three main principles characterize the handling of human excreta today, namely, “flush-and-
discharge”, “drop-and-store” and “sanitize-and-use” (Drangert, 1998). The flush-and-
discharge is a water-born sewage system, which involves flushing excreta from toilets to a
centralized treatment plant where it is treated and discharged into open water bodies. The
high piping costs involved and the demand made on water resources especially for water-
scarce regions makes this system expensive and unaffordable to inhabitants in most countries
in the southern hemisphere (Ganrot, 2005). According to the World Bank (1992, cited in
Drangert, (1998)), less than 5% of sewage in developing countries undergo any form of
treatment. Open defecation, pit latrines and their variations represent the drop-and-store
systems, which are mainly waterless safe for anal cleansing systems. Experts have blamed

Urine as a fertilizer under saline conditions
4
today’s sanitation crisis on the improper handling of human excreta, which became a priority
issue during the United Nations Millennium Development Summit in the year 2000 (United
Nations General Assembly, 2000).
The concept of ecological sanitation (ECOSAN) considers human excreta as a resource rather
than a waste. It promotes the safe collection, treatment and recycling of human excreta in
agriculture (Esrey et al., 1998; Esrey et al., 2001). Because of the relatively high nutrients and
low pathogen content of urine compared to faeces, various systems for source separation
and collection of human excreta have been developed and are in use around the world
(Kvarnström et al., 2006). These “no-mix” systems differ both in design and sophistication and
can be adapted to suit local sanitation requirements. For example, using locally available
materials Morghan (2007) suggested models for the construction of low-cost “no-mix”
systems that are suitable for rural communities. Urine can be collected pure or diluted with
little flush water but for a rapid sanitization process, it is recommended to collect urine
undiluted (Maurer et al., 2006).
Unlike faeces, urine from a healthy person is generally sterile and can be used as a plant
fertilizer without recourse to any further hygienization. However, even sterile urine can get
contaminated from faeces during collection due to dysfunctional collection systems or
improper use of urine diversion toilets. It is therefore recommended to sanitize urine before
use for crop fertilization (Schönning et al., 2002; Vinnerås et al., 2008). According to Vinnerås
et al. (2008) storage periods up to 6 months at about 4 °C or 3 month at temperatures above
20 °C are necessary for a safe handling of urine. A review by Maurer et al. (2006) appraising
different treatment processes for collected urine observed that apart from storage,
acidification, evaporation at high temperatures, membrane separation and biological
processes such as nitrification and anaerobic ammonium oxidation can significantly improve
the hygienic status of contaminated urine.
1.2.4 User and crop consumer acceptance
The use of urine based fertilizer and consumption of crops fertilized with human excreta in
general is influenced by cultural perception, religious believes and hygienic concerns.
However, where the concept of recycling nutrients in human excreta for agricultural purposes
has been well comprehended, most farmers prefer urine to faeces; the common argument
being that the former is less repulsive and much easier to handle (Duncker et al., 2007; World

Urine as a fertilizer under saline conditions
5
Health Organization, 2006). A survey conducted for seven European countries by Lienert and
Larsen (2010) showed that over 85% of 900 respondents liked the idea of using urine as a
fertilizer and about 70% were willing to purchase food grown with it. In the developing
countries most excreta recycling projects have recorded success. This can be explained by the
fact that recycling of human excreta is not an entirely new concept (Müllegger et al., 2010).
1.2.5 Salinity of human urine
A potential problem associated with the use of urine based fertilizer is salinity and sodicity.
The perceived risk of urine-fertilized soils becoming saline and/or sodic is related to the
content of soluble salts especially Na+ and Cl- inherently in urine. Germer et al., (2011) have
reported a slight increase in soil Na+ and Cl- concentration resulting from urine application in
a field study with sorghum (Sorghum bicolor) in Ghana. The application of 200 mg urine-N
significantly increased the concentration of Na+ in maize plant tissues and of soluble salts in
the soil-substrate during a pot experiment in South Africa (Mnkeni et al., 2008). However, it is
not clear how urine as a fertilizer would interact with salinity and high exchangeable sodium
in a growing medium.
1.3 Objectives
The objectives of this thesis were to a) determine whether urine can be used as a fertilizer
under NaCl-saline conditions b) compare the effect of urine and ammonium nitrate
fertilization on maize (Zea mays) and sorghum growth under different levels of NaCl salinity
treatments c) assess the effect of urine fertilization on cultivation substrate chemical
composition and as influenced by NaCl treatment d) determine whether supplementary wood
ash fertilization can enhance salt and Na+ tolerance of urine fertilized maize seedlings. To
realize these objectives four experiments were conducted and are reported in chapters 2 to
5.
1.4 Outline of thesis
Chapter 1 is an introductory chapter than states the problem under investigation followed by
a review of the state-of-the-art knowledge in urine fertilizer use. In chapter 2, the vegetative
response of maize to urine compared to ammonium nitrate treatments under different NaCl
substrate concentrations is reported. In this study it was hypothesized that i) compared to
ammonium nitrate, urine fertilizer will increase substrate salinity and ii) both fertilizers will

Urine as a fertilizer under saline conditions
6
enhance maize growth until salinity limits growth and development. Using two amounts of N
applications (180 and 360 mg N kg-1 substrate) and three NaCl imitated salinity treatments
(ECe 1.3, 4.6 and 7.6 dS m-1), the effects of both N fertilizer sources on substrate electrical
conductivity, pH, biomass yield, leaf nutrients concentration, plant height and green leaf area
were studied.
The goal of the second study reported in chapter 3 was to evaluate the cumulative effect of
urine fertilization and its interaction with NaCl treatment on sorghum growth. In this study
sorghum was grown on a substrate previously cultivated with maize and fertilized with either
urine or ammonium nitrate to mimic a maize-sorghum rotation system. Sorghum was chosen
as a second crop as it is generally more tolerant to salinity than maize. Here, it was
hypothesized that i) urine-induced increase in substrate salinity reduces growth of urine-
treated sorghum plants compared to those treated with ammonium nitrate, ii) the effect of
urine and ammonium nitrate on sorghum growth depends on the level of NaCl salinity.
Growth indices measured in this study were total yield, root/shoot ratio and shoot nutrients
concentration. Nitrogen use efficiency (NUE) for both fertilizers was compared and the
relationship between shoot nutrient concentration and biomass accumulation was evaluated.
In chapter 4, the effect of successive urine application on changes in the chemical properties
of the cultivation substrate from two cycles of maize cultivation (cycle I and II) was assessed.
The soil properties investigated were exchangeable cations, cation exchange capacity (CECp),
electrical conductivity, water soluble cations and anions and substrate pHKCl. In this study, it
was proposed that i) due to their content in urine, exchangeable cations, water extractable
cations and anions in the cultivation substrate will increase with higher urine fertilizer
application and from cycle I to cycle II, ii) urine imposes a risk on sodicity which might
increase under NaCl-imitated salinity.
The objective of chapter 5 was to test whether the fertilizing effect of urine under NaCl
salinity can be improved by addition of wood ash. It was hypothesized that i) supplementary
wood ash application would enhance the salt and sodium tolerance of urine-fertilized maize
plants ii) regardless of salinity level, combined urine and wood ash fertilization optimizes
plant nutrition and improves plant growth compared to urine- or wood ash stand-alone
treatments. The growth factors investigated in this study were plant height, SPAD values as
an indicator of leaf chlorophyll concentration, shoot dry weight as a determinant of plant

Urine as a fertilizer under saline conditions
7
vigour and shoot nutrients concentration. General discussions on the main finding,
conclusions and limitations of this study are given in chapter 6.
1.5 References
Bernstein, L., L.E. Francois and R.A. Clark. 1974. Interactive effects of salinity and fertility on yields of grains and vegetables. Agronomy Journal 66:412-421.
Bui, E.N. 2013. Soil salinity: A neglected factor in plant ecology and biogeography. Journal of Arid Environments 92:14-25.
Drangert , J.O. 1998. Fighting the urine blindness to provide more sanitation options. Water SA 24:157-164.
Duncker, L.C., G.N. Matsebe, N. Moilwa and Water Research Commission. 2007. The socialcultural acceptability of using human excreta (faeces and urine) for food production in rural settlements in South Africa : Report to the water research commission. Water Research Commission, Gezina, Pretoria, RSA.
Epstein, E., J.D. Norlyn, D.W. Rush, R.W. Kingsbury, D.B. Kelley, G.A. Cunningham and A.F. Wrona. 1980. Saline culture of crops: A genetic approach. Science 210:399-404.
Esrey, S., I. Andersson, A. Hillers and R. Sawyer (eds.) 2001. Closing the loop: Ecological sanitation for food security. Swedish International Development Corperation Agency (SIDA), Stockholm, Sweden.
Esrey, S.A., J. Gough, D. Rapaport, R. Sawyer, M. Simpson-Hébert, J. Vargas and U. Winblad (eds.) 1998. Ecological sanitation. First ed. Swedish Interantional Development Cooperation Agency (SIDA), Stockholm, Sweden.
Feigin, A. 1985. Fertilization management of crops irrigated with saline water. Plant and Soil 89:285-299.
Flores, P., M. Carvajal, A. Cerdá and V. Martínez. 2001. Salinity and ammonium/nitrate interactions on tomato plant development, nutrition and metabolites. Journal of Plant Nutrition 24:1561-1573.
Ganrot, Z. 2005. Urine processing for efficient nutrient recovery and reuse in agriculture. PhD thesis, Department of Environmental Science and Conservation. Faculty of Science, University of Göteborg, Sweden. ISBN 91 88376 29 X.
Germer, J., S. Addai and J. Sauerborn. 2011. Response of grain sorghum to fertilisation with human urine. Field Crops Research 122:234-241.
Grattan, S.R. and C.M. Grieve. 1998. Salinity–mineral nutrient relations in horticultural crops. Scientia Horticulturae 78:127-157.
Urine as a fertilizer under saline conditions
8
Jacobs, D.F. and V.R. Timmer. 2005. Fertilizer-induced changes in rhizosphere electrical conductivity: Relation to forest tress seedling root system growth and function. New Forests 147-166.
Jönsson, H. 1994. Källsortering av humanurin-mot ett uthålligt samhälle. Rep. 3. Sveriges Lantbruksuniversitet, Sweden.
Jönsson, H., B. Vinnerås, C. Höglund, T.A. Stenström, G. Dalhammar and H. Kirchmann. 2000. Recycling source separated human urine. (källsorterad humanurin). Rep. 1. VA-Forsk, VAV AB, Stockholm, Sweden. (In Swedish, English summary).
Jönsson, H., T. Stenström, J. Svensson and A. Sundin. 1997. Source separated urine-nutrient and heavy metal content, water saving and faecal contamination. Water Science and Technology 35:145-152.
Karak, T. and P. Bhattacharyya. 2011. Human urine as a source of alternative natural fertilizer in agriculture: A flight of fancy or an achievable reality. Resource Conservation and Recycling 55:400-408.
Kirchmann, H. and S. Pettersson. 1995. Human urine - chemical composition and fertilizer use efficiency. Fertilizer Research 40:149-154.
Krepp, F.C. 1867. The sewage question. Longmans, Green & Co., London, UK.
Kvarnström, E., K. Emilsson, A.R. Stintzing, M. Johansson, H. Jönsson, E. af Petersens, C. Schönning, J. Christensen, D. Hellström, L. Qvarnström, P. Ridderstolpe and J.O. Drangert . 2006. Urine diversion: One step towards sustainable sanitation. Stockholm Environmental Institute, Stockholm, Sweden.
Lienert, J. and T.A. Larsen. 2010. High acceptance of urine source separation in seven european countries: A review. Environmental Science and Technology 44:556-566.
Lind, B., Z. Ban and S. Bydén. 2001. Volume reduction and concentration of nutrients in human urine. Ecological Engineering 16:561-566.
Matsui, S. 1997. Night soil collection and treatment, Japanese practice and suggestion for sanitation of other areas of the globe. paper presented at the sida sanitation workshop, August 6-9, balingsholm. Rep. Sida Report N° 9. Swedish International Development Agency (SIDA), Stockholm, Sweden.
Maurer, M., W. Pronk and T.A. Larsen. 2006. Treatment processes for source-separated urine. Water Research 40:3151-3166.
Mnkeni, P.N.S., F.R. Kutu, P. Muchaonyerwa and L.M. Austin. 2008. Evaluation of human urine as a source of nutrients for selected vegetables and maize under tunnel house conditions in the Eastern Cape, South Africa. Waste Management Research 26:132-139.
Morghan, P. 2007. Toilets that make compost: Low costs, sanitary toiletsthat produce valuable compost for crops in an african context. Stockholm Environmental Institute, Stockholm, Sweden.

Urine as a fertilizer under saline conditions
9
Morris, M., V.A. Kelly, R.J. Kopicki and D. Byerlee. 2007. Fertilizer use in african agriculture: Lessons learned and good practice guidelines. The World Bank, Washington, DC, USA.
Mortvedt, J.J. 2001. Calculating salt index. Fluid Journal 9:1-3.
Müllegger, E., G. Langergraber and M. Lechner. 2010. Use of urine. Sustainable Sanitation Practice 3:1-31.
Münch, E. and M. Winker. 2009. Technology review, urine diversion components overview of urine diversion components such as waterless urinals, urine diversion toilets, urine storage and reuse systems. Publisher ?? Eschborn, Germany.
Munns, R. and M. Tester. 2008. Mechanism of salt tolerance. Annual Review of Plant Biology 59:651-681.
Pradhan, S.K., A.M. Nerg, A. Sjöblom, J.K. Holopainen and H. Heinonen-Tanski. 2007. Use of human urine fertilizer in cultivation of cabbage (brassica oleracea) - impacts on chemical, microbial, and flavor quality. Journal of Agriculture and Food Chemistry 55:8657-8663.
Richert, A., R. Gensch, H. Jönsson, T.A. Stenström and L. Dagerskog. 2010. Practical guidance on the use of urine in crop production. Stockholm Environmental Institute, Stockholm, Sweden.
Robbins, C.W. and R.G. Gavlak. 1989. Salt- and sodium affected soils. Rep. Bulleting No. 703. USDA, Cooperative Extension Service - University of Idaho, Idaho, USA.
Roma, E., N. Benoit, C. Buckley and S. Bell. 2013. Using the receptivity model to uncover ‘urine blindness’: Perceptions on the re-use of urine. Waste Management and Research 31:648-654.
Schönning, C., R. Leeming and T.A. Stenström. 2002. Faecal contamination of source-separated human urine based on the content of faecal sterols. Water Research 36:1965-1972.
United Nations General Assembly, 2000. United Nations Millennium Declaration. Resolution A/RES/55/2. New York, NY, United Nations. (http://www.preventionweb.net/files/13539_13539ARES552ResolutiononUNMillenniu.pdf)
Villa-Castorena, M., A.L. Ulery, E.A. Catalán-Valencia and M.D. Remmenga. 2003. Salinity and nitrogen rate effects on the growth and yield of chile pepper plants. Soil Science Society of America Journal 67:1781-1789.
Vinnerås, B., A. Nordin, C. Niwagaba and K. Nyberg. 2008. Inactivation of bacteria and viruses in human urine depending on temperature and dilution rate. Water Research 42:4067-4074.
Vinnerås, B., H. Palmquist, P. Balmer, and H. Jönsson. 2006. The characteristics of household wastewater and biodegradable solid waste—A proposal for new Swedish design values. Urban Water, 3:3-11.

Urine as a fertilizer under saline conditions
10
World Health Organization. 2006. WHO guidelines for the safe use of wastewater, excreta and greywater. Geneva, Switzerland.
Yadav, S., M. Irfan, A. Ahmad and S. Hayat. 2011. Causes of salinity and plant manifestations to salt stress: A review. Journal of Environmental Biology 32:667-685.
Yildirim, E., A. G. Taylor, and T. D. Spittler. 2006. Ameliorative effects of biological treatments on growth of squash plants under salt stress, Scientia Horticulturae 111:1–6.

Urine as a fertilizer under saline conditions
11
2 Comparative effect of human urine and ammonium nitrate application
on maize (Zea mays L.) grown under various salt (NaCl) concentrations
This is the pre-peer reviewed version of the following article:
Journal of Plant Nutrition and Soil Science 176:703-711, 2013
Michael Yongha Boh1*, Jörn Germer1, Torsten Müller2, and Joachim Sauerborn1
1Institute of Plant Production and Agroecology in the Tropics and Subtropics, University of
Hohenheim, Garbenstr. 13, 70593 Stuttgart, Germany
2Institute of Crop Science, Fertilization and Soil Matter Dynamics, University of Hohenheim,
Fruwirthstr. 20, 70593 Suttgart, Germany
*Correspondence: Michael Yongha Boh; e-mail: [email protected]
http://onlinelibrary.wiley.com/doi/10.1002/jpln.201200486/abstract

Urine as a fertilizer under saline conditions
12
Abstract
The present study investigates the effect of urine and ammonium nitrate on maize (Zea mays
L.) vegetative growth, leaf nutrient concentration, soil electrical conductivity and
exchangeable cations contents under various concentrations of NaCl in a soil substrate. The
experiment was arranged in a completely randomized block design with eight replications
under greenhouse conditions. The experimental soil substrate was made from a 1 : 1 : 1
volume ratio mixture of compost, quartz sand and silty-loam soil. Salinity was induced by
adding 0, 15 and 30 ml of 1 M NaCl solution per kg of substrate to achieve electrical
conductivities (EC) of 1.3 (S0), 4.6 (S1) and 7.6 (S2) dS m-1, respectively. Nitrogen sources
were urine and ammonium nitrate applied at 180 and 360 mg N (kg soil substrate)-1. Basal P
and K were added as mono potassium phosphate in amounts equivalent to 39 mg P and 47
mg K (kg substrate)-1, respectively. In the S0 treatment, a 3-fold increase in EC was measured
after urine application compared to an insignificant change in ammonium nitrate-fertilized
substrates 62 d after sowing. Under saline conditions application of 360 mg N (kg soil)-1 as
urine significantly decreased soil pH and maize shoot dry weight. At the highest salt and N
dose (S2, N360) 50% of urine-fertilized plants died. Regardless of salinity there was no
significant difference between the two fertilizers for investigated growth factors when N was
supplied at 180 mg (kg soil)-1. Leaf N and Ca contents were higher after urine application than
in ammonium nitrate-fertilized plants. At an application rate of 180 mg N (kg soil)-1, urine was
a suitable fertilizer for maize under saline conditions. Higher urine-N dosages and/or soil
salinity exceeding 7.6 dS m-1 may have a deleterious effect on maize growth.
Keywords: Ammonium nitrate / electrical conductivity / fertilization effect of urine / sodium
toxicity / soil salinity
Urine as a fertilizer under saline conditions
13
2.1 Introduction
Soil salinity is a worldwide threat to crop production (Läuchli and Lüttge, 2002), as it affects
plants through osmotic stress, ion toxicity and nutritional imbalances. Soil sodicity caused by
excessive soil exchangeable sodium and high pH can further compromise plant vigor by
destroying soil aggregates and decreasing permeability (Pascale et al., 2005). Saline soils
originate naturally from weathering of salt-bearing rocks (Richards, 1954) though the use of
saline irrigation water and fertilizers with high salt indexes also frequently and significantly
increase root-zone salinity and/or sodicity (Bunt, 1988). Mortvedt (2001) has cautioned that
the addition of salt should be considered in irrigation and fertilization planning. This is
particularly important in semiarid and arid environments where precipitation amounts are
usually too low to leach salts from the top soil. In low-income countries, subsistence farmers
often tend to use the most affordable fertilizers without considering their salt effect (Penov et
al., 2011). Even so, under intrinsically saline conditions and where nutrients are limiting,
proper use of fertilizer may ameliorate the detrimental effect of salinity (Villa-Castorena et
al., 2003; Grattan and Grieve, 1998).
Nitrogen is an important nutrient often needed in large amounts by plants. The form and rate
at which N is supplied to plants under saline conditions is important. Elgharably et al. (2010)
reported a beneficial effect on wheat growth following the addition of 100 mg N (kg soil)-1 as
NH4-N or NH4NO3-N, whereas NO3-N caused depression in saline soils. Increasing N rates and
soil salinity levels interacted to reduce pod yields of Chile pepper (Villa-Castorena et al.,
2003), leaf area, dry weight and P concentration of Ficus benjamina L. (Cokuysal et al., 2006)
and shoot and root dry weights of sorghum (Elgharably et al., 2010).
Human urine is a rich source of plant-available N with appreciable amounts of P, K, Mg, Ca,
Zn, and Fe. Therefore, it can substitute commercial inorganic fertilizers (Kirchmann and
Pettersson, 1995; Ganrot et al., 2007) especially in developing countries where fertilizers are
often too costly for subsistence farmers. Except from faecal cross-contamination, urine from
a healthy person poses no hygienic risks to users (Schönning et al., 2002). For a safe and
unrestricted use of human urine in agriculture, storage at temperatures above 20°C for 6
months and/or acidification is recommended (Maurer et al., 2006; World Health
Organization, 2006; Vinnerås et al., 2008). The efficacy of human urine fertilizer to enhance
crop production has been validated by trials with maize in Zimbabwe (Morghan, 2007),

Urine as a fertilizer under saline conditions
14
sorghum (Sorghum bicolour (L.) Moench) in Ghana (Germer et al., 2011), maize and
vegetables in South Africa (Mnkeni et al., 2008), and pumpkins (Cucurbita maxima L.) in
Finland (Pradhan et al., 2009). In the aforementioned studies, urine was primarily a source of
N while supplemental P and K were added. So far, negligible attention has been paid to the
effect of other plant nutrients in urine on plant performance and soil cation status. Urine is
inherently saline and its use as fertilizer may increase soil Na and Cl concentrations (Germer
et al., 2011). Haynes and Williams (1992) have reported that the concentration of
exchangeable cations in the soil solution can be influenced by urine deposition on pasture
land. Therefore, the salinity and sodicity status of soil and irrigation water should be
considered to determine if and when urine can be used as a fertilizer.
In spite of the existing studies on crop fertilization with human urine, little is known about its
effect on soil salinity. Our study aimed to compare the effect of N supplied as urine or
ammonium nitrate on changes in soil substrate EC and exchangeable cations and on the
growth of maize under saline and non-saline conditions. We hypothesized that 1) compared
to ammonium nitrate, urine fertilization will increase soil salinity and 2) both urine and
ammonium nitrate fertilizers will enhance maize growth until salinity limits plant growth and
development. This study should serve as an important basis for future considerations when
determining the levels of soil salinity and urine application on maize production.
2.2 Material and methods
The experiment was conducted in a greenhouse at the University of Hohenheim in Stuttgart,
Germany, and constituted a completely randomized block design with three soil substrate salt
concentrations, two fertilizer types and two fertilizer amounts with eight replicates for each
treatment (Tab. 2.1). The substrate was composed of quartz sand, silty-loam and bio waste
compost mixed in a 1 : 1 : 1 volume ratio to mimic arable soil. The components were air-
dried, passed through a 2 mm sieve and homogenized with a concrete mixer. Total N and C in
the final substrates were measured by infrared absorption using an elemental analyser (Vario
EL, Elementar, Hanau, Germany). Plant-available P was determined using the Bray-II method
(Bray and Kurtz, 1945). P in the extracts was measured with inductively coupled plasma
optical emission spectrometry (ICP-OES) using a Varian Vista Pro instrument. Exchangeable
K+, Na+, Ca2+, and Mg2+ in the soil were extracted with 1 M NH4Cl (1 : 10; soil to solution ratio)
for 1 h at room temperature using a mechanical shaker and filter paper (Whatman No. 1). The

Urine as a fertilizer under saline conditions
15
concentrations in the extracts were measured with ICP-OES (VDLUFA, 2009). Substrate
electrical conductivity (EC) was measured from a saturated extract and pH in 1 M KCl, 1 : 2.5
(soil to solution) suspensions. Salinity was induced by adding 0, 15 and 30 mL of 1 M NaCl
solution per kg of substrate during homogenization with a concrete mixer to achieve EC
values of 1.3 (S0), 4.6 (S1) and 7.6 (S2) dS m-1. Nitrogen fertilization was 180 and 360 mg N (kg
soil substrate)-1, supplied either as urine or ammonium nitrate (Sigma-Aldrich Chemie GmbH,
Germany). Due to their low content in the prepared soil substrate, basal P and K were added
as mono potassium phosphate in amounts equivalent to 39 mg P and 47 mg K (kg soil
substrate)-1 during homogenization. Twelve kg of prepared substrate were filled into each of
the 10 L Mitscherlich pots.
Table 2.1: Experimental design (n = 8). Substrate electrical conductivity (EC) /dS m
-1
Nitrogen dosages /mg (kg soil substrate)
-1
Urine Ammonium nitrate
1.3 (S0)
180 360
180 360
4.6 (S1) 180 360
180 360
7.6 (S2) 180 360
180 360
Urine was collected from eight students over several weeks and subsequently stored in an
air-tight plastic container in the greenhouse for three months, at a daily mean temperature of
25 ± 2°C for sanitization. Chemical analyses of the same elements as in soils were carried out
for urine samples taken just before the first dose of application (Tab. 2.2). Additionally, the
nitrogen concentration of the added urine was measured prior to each application to detect
potential losses that might have resulted from volatilization. Less than 5% of N content was
lost from urine between the first and final urine application. At the time of first application,
over 95% of N in urine was in the form of ammonium. One third of the targeted N was
applied a week before sowing and the remainder in two dosages 21 and 55 d after sowing
(DAS), respectively.
Urine as a fertilizer under saline conditions
16
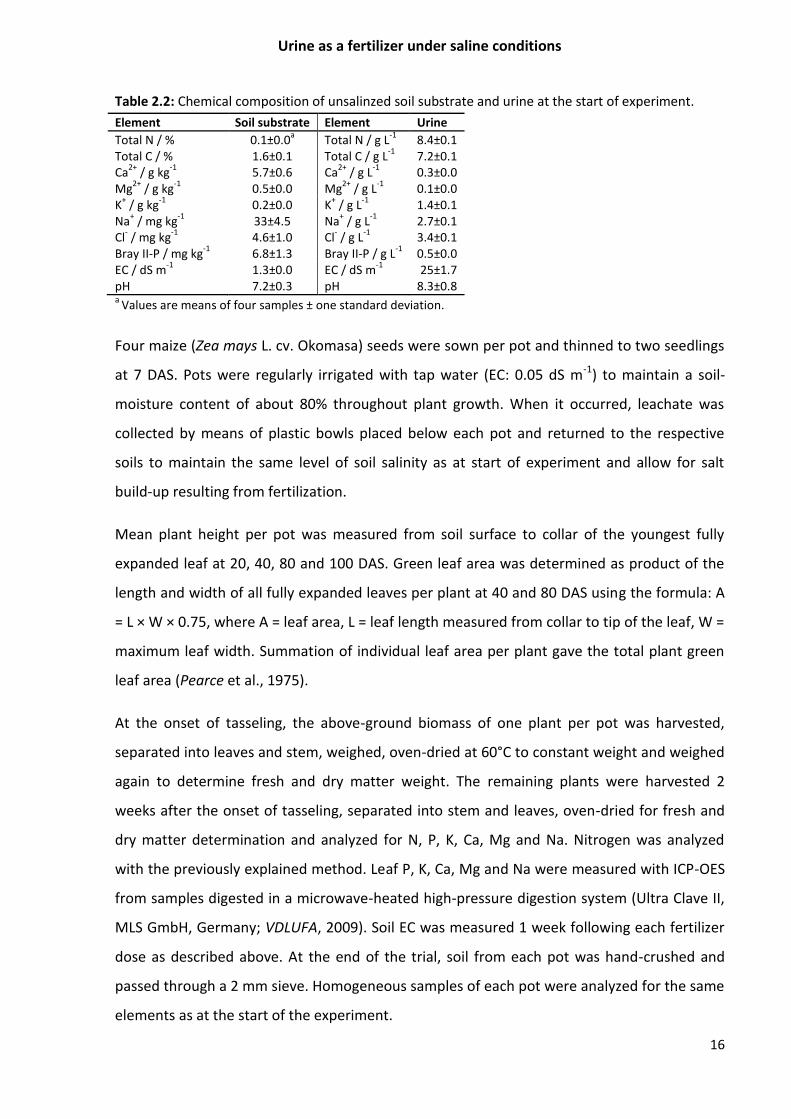
Table 2.2: Chemical composition of unsalinzed soil substrate and urine at the start of experiment.
Element Soil substrate Element Urine
Total N / % 0.1±0.0a Total N / g L
-1 8.4±0.1
Total C / % 1.6±0.1 Total C / g L-1
7.2±0.1 Ca
2+ / g kg
-1 5.7±0.6 Ca
2+ / g L
-1 0.3±0.0
Mg2+
/ g kg-1
0.5±0.0 Mg2+
/ g L-1
0.1±0.0 K
+ / g kg
-1 0.2±0.0 K
+ / g L
-1 1.4±0.1
Na+ / mg kg
-1 33±4.5 Na
+ / g L
-1 2.7±0.1
Cl- / mg kg
-1 4.6±1.0 Cl
- / g L
-1 3.4±0.1
Bray II-P / mg kg-1
6.8±1.3 Bray II-P / g L-1
0.5±0.0 EC / dS m
-1 1.3±0.0 EC / dS m
-1 25±1.7
pH 7.2±0.3 pH 8.3±0.8 a
Values are means of four samples ± one standard deviation.
Four maize (Zea mays L. cv. Okomasa) seeds were sown per pot and thinned to two seedlings
at 7 DAS. Pots were regularly irrigated with tap water (EC: 0.05 dS m-1) to maintain a soil-
moisture content of about 80% throughout plant growth. When it occurred, leachate was
collected by means of plastic bowls placed below each pot and returned to the respective
soils to maintain the same level of soil salinity as at start of experiment and allow for salt
build-up resulting from fertilization.
Mean plant height per pot was measured from soil surface to collar of the youngest fully
expanded leaf at 20, 40, 80 and 100 DAS. Green leaf area was determined as product of the
length and width of all fully expanded leaves per plant at 40 and 80 DAS using the formula: A
= L × W × 0.75, where A = leaf area, L = leaf length measured from collar to tip of the leaf, W =
maximum leaf width. Summation of individual leaf area per plant gave the total plant green
leaf area (Pearce et al., 1975).
At the onset of tasseling, the above-ground biomass of one plant per pot was harvested,
separated into leaves and stem, weighed, oven-dried at 60°C to constant weight and weighed
again to determine fresh and dry matter weight. The remaining plants were harvested 2
weeks after the onset of tasseling, separated into stem and leaves, oven-dried for fresh and
dry matter determination and analyzed for N, P, K, Ca, Mg and Na. Nitrogen was analyzed
with the previously explained method. Leaf P, K, Ca, Mg and Na were measured with ICP-OES
from samples digested in a microwave-heated high-pressure digestion system (Ultra Clave II,
MLS GmbH, Germany; VDLUFA, 2009). Soil EC was measured 1 week following each fertilizer
dose as described above. At the end of the trial, soil from each pot was hand-crushed and
passed through a 2 mm sieve. Homogeneous samples of each pot were analyzed for the same
elements as at the start of the experiment.

Urine as a fertilizer under saline conditions
17
2.2.1 Data analyses
Data were subjected to two- and three-way ANOVA using SAS statistics (SAS Institute, version
9.2) with substrate salinity (S), nitrogen source (NS) and nitrogen fertilization amount (NR) as
fixed factors and their interactions (S × NS, S × NR, NS × NR and S × NS × NR) are shown.
Dependent factors were above-ground fresh and dry matter yield, leaf nutrient
concentration, plant height, green leaf area, substrate EC, pH and exchangeable cation level.
A square root transformation of data for leaf P and Na and log transformation of leaf Ca data
was carried out to fulfil the conditions for normality. Tukey’s tests were carried out to detect
significant differences of means at P ≤ 5%. As half the urine-fertilized plants in the S2
treatment that received 360 mg N (kg substrate)-1 were dead at 60 DAS (that is, after the
second urine dose), statistical analyses for this variant were performed on n = 4.
2.3 Results
2.3.1 Soil chemical composition
a. Electrical conductivity (EC)
In the S0 treatment, no significant difference in EC between urine and ammonium nitrate-
fertilized soils was measured at 7 DAS. However, a significantly higher EC was measured in
urine than ammonium nitrate-fertilized soils in the S1 and S2 treatments (Fig. 2.1). Electrical
conductivity increased with subsequent applications of both urine and ammonium nitrate at
all substrate salinities as measured at 28 and 62 DAS. In the S0 treatment, application of urine
resulted in an approximately 3-fold increase in EC at 62 DAS compared to an insignificant
change due to ammonium nitrate application.

Urine as a fertilizer under saline conditions
18
Figure 2.1: Effect of urine and ammonium nitrate application at different substrate salinity levels (S0, S1 and S2) on substrate electrical conductivity (EC) during pot trial. Significant differences between fertilizer types at different substrate EC were determined separately for each sampling day. Values represent means ± SE; n = 12. Bars with different letters are significantly different at P ≤ 5%.
b. Exchangeable cations in the substrate
Exchangeable Na+ increased as salinity rose, but there was no significant effect of fertilizer
type or amount (Tab. 2.3). Substrate exchangeable K+ was significantly affected by salinity × N
source × N amount interactions. Following an increase in urine application, exchangeable K+
increased by 18% and 20% in the S1 and S2 treatments, respectively (Tab. 2.3). Furthermore,
exchangeable K+ was 25% and 32% higher in urine than ammonium nitrate-fertilized soil
substrates at S1 and S2, respectively. Compared to ammonium nitrate treatments, substrate
exchangeable Mg2+ and Ca2+ were higher in urine treatments at S2 level and with the
application of 360 mg N (kg substrate)-1. A significant increase in soil exchangeable Ca2+ was
also observed at S2 level following an increase in urine application (Tab. 2.3).
c. pH
There were significant salinity × N source, salinity × N amount and N source × N amount
interaction effects on substrate pH (Tab. 2.3). In the S1 and S2 treatments, significant
reductions by 0.2 and 0.3 pH units, respectively, were measured for urine-fertilized substrates
that received 360 mg N (kg substrate)-1 compared to those that received 180 mg N (kg soil
substrate)-1. Compared to 180 mg N (kg substrate)-1, the application of 360 mg urine-N (kg

Urine as a fertilizer under saline conditions
19
substrate)-1 significantly reduced substrate pH by 0.2 and 0.3 units in the S1 and S2 salt
treatments, respectively. Furthermore, soil substrates fertilized with 360 mg urine-N (kg
substrate)-1 were by 0.2 and 0.4 pH units significantly lower than those fertilized with the
same amount of N in the form of ammonium nitrate in the S1 and S2 treatments,
respectively.
Table 2.3: Effect of substrate salinity level (S0, S1, S2), nitrogen source (urine, U; ammonium nitrate, AN) and nitrogen amount on exchangeable cations and pH Substrate salinity level (EC)/ dS m
-1
N Source/amount /mg (kg soil substrate)
-1
Na+
/g kg-1
K
+
/g kg-1
Mg
2+
/g kg-1
Ca
2+
/g kg-1
pH
1.3 (S0) U1 (180) 0.11±0.08f 0.17±0.01ed 0.39±0.01b 5.4±0.16ab 6.8±0.07ab U2 (360) 0.25±0.05def 0.18±0.02ed 0.43±0.02ab 5.7±0.16a 6.7±0.07bc AN1 (180) 0.15±0.20ef 0.16±0.00e 0.39±0.02b 5.5±0.11ab 6.8±0.04ab AN2 (360) 0.08±0.09f 0.16±0.02e 0.39±0.02b 5.5±0.13ab 6.7±0.08ab
4.6 (S1) U1 (180) 0.49±0.30bcd 0.19±0.02ed 0.40±0.02b 5.4±0.20b 6.8±0.06ab
U2 (360) 0.48±0.07bcd 0.24±0.02b 0.42±0.02ab 5.6±0.12ab 6.6±0.06c AN1 (180) 0.36±0.04cd 0.17±0.02ed 0.40±0.01b 5.4±0.11b 6.8±0.04a AN2 (360) 0.40±0.06de 0.18±0.02ed 0.40±0.01b 5.5±0.12ab 6.8±0.08a
7.6 (S2) U1 (180) 0.83±0.25a 0.23±0.04bc 0.42±0.02ab 5.4±0.14b 6.7±0.11abc
U2 (360) 0.82±0.10a 0.28±0.04a 0.45±0.04a 5.7±0.16a 6.4±0.10d AN1 (180) 0.72±0.15ab 0.19±0.02cd 0.41±0.02b 5.3±0.10b 6.8±0.07a AN2 (360) 0.67±0.14abc 0.19±0.02ed 0.40±0.01b 5.4±0.10b 6.8±0.08ab
S *** *** * ns * NS ns *** *** *** *** S × NS ns *** ns * *** NR ns *** * *** *** S × NR ns * ns ns ns NS × NR ns *** *** *** *** S × NS × NR ns * ns ns ns
Values are means ± SD; n = 8. Means within columns followed by different lower-case letters are significantly different at P ≤ 5% according to Tukey test. The results of a two and three-way ANOVA with substrate salinity (S), nitrogen source (NS) and nitrogen fertilization amount (NR) as fixed factors and their interaction; S × NS, S × NR, NS × NR and S × NS × NR are shown:
***P < 0.1;
**P < 1%;
*P < 5%; ns, not significant. This applies to all subsequent
tables.
2.3.2 Biomass yield
Leaf, stem and shoot fresh and dry weights were significantly reduced by increasing substrate
salinity (Tab. 2.4). At an application rate of 360 mg N (kg substrate)-1 in the S1 treatment, the
fresh weights of leaf, stem, shoot and shoot dry weight were 64%, 66%, 67% and 28% lower
in urine than in ammonium nitrate-fertilized plants, respectively. Except for stem fresh
weight, a similar pattern of biomass reduction was observed in the S2 treatment at the same
N application rate. Here, shoot dry weight was 37% lower in the urine than in the ammonium
nitrate treatment (Tab. 2.4).

Urine as a fertilizer under saline conditions
20
Table 2.4: Effect of substrate salinity (S0, S1 S2), urine (U) and ammonium nitrate (AN) fertilization amounts on fresh and dry matter yield of maize leaf, stem and shoota Substrate salinity /dS m-1
N source amount /mg (kg soil substrate)-1
Leaf Stem Shoot (Leaf + Stem)
Fresh weight /g plant-1
Dry weight /g plant-1
Fresh weight /g plant-1
Dry weight /g plant-1
Fresh weight /g plant-1
Dry weight /g plant-1
1.3 (S0) U1 (180) 63.6±12.4ab§ 20.7±3.0abc 83.6±22.6ab 7.9±1.2a 147.2±34.4ab 28.6±3.7a U2 (360) 61.5±14.5ab 22.0±3.1a 88.7±10.6ab 7.5±1.5ab 150.2±23.4ab 29.5±3.6a AN1 (180) 75.8±13.3a 20.5±4.1abc 96.0±18.1a 9.0±1.0a 171.8±29.5a 28.3±2.8ab AN2 (360) 67.5±11.5a 21.1±6.3ab 76.1±12.6abcd 7.5±1.2ab 143.6±22.6ab 28.6±6.2a 4.6 (S1) U1 (180) 58.7±10.8ab 15.2±3.4bcde 80.2±17.1abc 6.9±1.2abc 140.0±26.3abc 22.2±2.7bcd U2 (360) 22.4±14.9de 13.3±5.1de 32.2±18.1e 5.2±1.1c 50.6±33.6ef 19.3±5.3de AN1 (180) 63.1±04.8ab 18.3±3.1abcd 93.6±11.9a 7.7±1.2ab 156.7±15.6ab 26.1±2.9abc AN2 (360) 61.6±09.1ab 19.5±2.6abcd 93.4±15.6ab 7.2±1.8abc 155.1±29.4ab 26.7±2.4abc 7.6 (S2) U1 (180) 33.7±16.2cde 11.2±3.6e 51.9±15.4cde 5.1±1.0c 72.7±43.1def 17.0±4.3de U2 (360) † 18.9±07.9e 08.9±3.3e 30.3±11.2e 4.0±1.0c 30.1±23.9f 12.6±1.2e AN1 (180) 43.6±14.9bc 13.9±2.5cde 50.0±17.3de 5.0±1.0c 93.6±24.8bcd 18.8±2.3de AN2 (360) 45.1±16.0bc 14.1±2.8de 63.1±22.5bcde 5.7±1.6bc 108.3±36.1cde 20.1±3.0cd S *** *** *** *** *** *** NS *** *** *** ** ** *** S × NS ns ** *** ns ** ** NR *** ns ** ns ns ns S × NR ns ns ns ns ** ns NS× NR ** ns ** ns ** ns S × NS × NR * ns *** ns ** ns aValues are means ± SD (n = 8). †Signifies n = 4 due to death plants after second urine dose. §Means within columns followed by different
lowercase letters differed significantly at P < 5% according to Tukey test.
2.3.3 Leaf nutrient concentrations
Substrate salinity significantly affected total leaf N, P, K, Ca and Na concentrations (Fig. 2.2A-
E). Leaf N was higher in urine than in ammonium nitrate-fertilized plants in the S0 and S2
treatments. The highest N concentration (approximately 3%) was measured in leaves of
maize plants fertilized with urine in the S2 treatment. Leaf P concentration rose with an
increase in substrate salinity level from S1 to S2 for both fertilizers (Fig. 2.2B). While salinity
increased leaf Na, it decreased leaf K concentrations (Fig. 2.2C and D). N source did not affect
leaf concentrations of both elements though there was a tendency towards higher Na
concentrations with urine fertilization. Higher leaf Ca concentrations were measured in urine
compared to ammonium nitrate-treated plants at all substrate salinity levels (Fig. 2.2E). In the
S2 treatment, leaf Mg was significantly higher in urine than in the ammonium nitrate-
fertilized plants (Fig. 2.2F).

Urine as a fertilizer under saline conditions
21
Figure 2.2: Effect of urine (U), ammonium nitrate (AN) and substrate electrical conductivity on maize leaf concentrations of N, P, K, Na, Ca and Mg at the end of pot trial. Values are averages of two N amounts and 8 replications (i.e. n = 16; ± SE). Different lower-case letters indicate significant differences (P ≤ 5%) between U and AN application within one salt level. Different upper case letters indicate significant differences between salt concentrations at P ≤ 5%.

Urine as a fertilizer under saline conditions
22
Figure 2.3: Effect of ammonium nitrate (AN) and urine (U) application amount on maize plant height measured during growth. Mean differences between fertilizer type and application amounts were determined separately for each respective number of days after sowing. Histograms represent means ± SE (n = 24). Bars with different letters are significantly different at P ≤ 5%.
2.3.4 Plant height
Regardless of salinity, an increase in urine application from 180 to 360 mg N (kg substrate)-1
significantly reduced maize height (P < 5%) at 40 DAS; ammonium nitrate-fertilized plants at
the two application levels were not significantly different (Fig. 2.3). Nitrogen amount had no
significant effect on maize height at 20, 80 and 100 DAS. With the application of 360 mg N (kg
substrate)-1, urine-fertilized maize plants were significantly shorter than those fertilized with
ammonium nitrate 40, 80 and 100 DAS. An increase in substrate salinity significantly reduced
maize height in all measurements (F = 72, df = 2, P < 0.01%; data not shown). In the S2
treatment, half of the urine-fertilized plants receiving 360 mg N (kg substrate)-1 died one
week after the application of the final dose.
2.3.5 Green leaf area
At S2 and 40 DAS, green leaf area of urine-fertilized plants was significantly reduced by 43%
compared to S0, while ammonium nitrate-fertilized plants were not significantly different
(Tab. 2.5). A similar trend was observed at 80 DAS, when the green leaf area of urine-
fertilized plants receiving 360 mg N (kg substrate)-1 was lower in S2 than S0 by 28 %.

Urine as a fertilizer under saline conditions
23
Table 2.5: Effect of urine (U) and ammonium nitrate (AN) fertilization and substrate salinity level (S0, S1, S2) on mean leaf area of maize 40 and 80 d after sowing (DAS). Substrate salinity (dS m
-1)
N source/amount (mg kg
-1 soil substrate)
Leaf Area (cm
2 plant
-1)
40 DAS
Leaf Area (cm
2 plant
-1)
80 DAS
1.3 (S0) U1 (180) 178±77a 128±26ab U2 (360) 159±66abc 95±38ab AN1 (180) 182±92a 118±21ab AN2 (360) 168±66ab 146±25a Mean (n = 32) 172A 128A 4.6 (S1) U1 (180) 121±49abcd 96±28bc U2 (360) 111±55bcd 87±18bc AN1 (180) 137±52abcd 95±33bc AN2 (360) 126±46abcd 93±17bc Mean (n = 32) 123B 93B 7.6 (S2) U1 (180) 101±53cd 95±30bc U2 (360) 91±57d 68±38c
§
AN1 (180) 120±59abcd 81±37bc AN2 (360) 135±62abcd 101±26abc Mean (n = 32) 112B 86B S *** *** NS * ns S × NS ns ns NR ns ns S × NR ns ns NS× NR ns * S × NS × NR ns ns
Values are means ± SD; n = 8. §n = 4 due to death plants resulting after second dose of urine. Means with
different lower-case letters within the same column are significantly different at P ≤ 5%. Different upper-case letters within the same column indicate significant differences between salinity at P ≤ 5% according to Tukey test.
2.4 Discussion
Maize is a field crop and is seldom grown in containers except for the purpose of
experimentation. Under field conditions, the effect of fertilization on soil properties is hardly
noticeable in the short term due to weather dynamics and the small quantities of fertilizer
applied per season (Ray and Sinclair, 1998; Haynes and Naidu, 1998). It is anticipated that in
the long term salt accumulation from urine fertilization may occur. We therefore conducted
an investigation on the potential effect of urine fertilization on soil salinity and maize growth
under controlled conditions.
Generally, fertilizer application increases the content of soluble salts in the soil and the World
Health Organization has cautioned against the use of urine fertilizer in saline soils (Jacobs and
Timmer, 2005; WHO, 2006). However, it is not clear at what dosage and/or soil salinity level
urine fertilizer application becomes problematic. Our results showed that substrate EC was

Urine as a fertilizer under saline conditions
24
higher in urine than ammonium nitrate-fertilized soils. An increase EC of urine-fertilized
substrates was expected as urine is inherently saline. Mnkeni et al. (2008) reported an
increase in soil EC of up to 13.35 dS m-1 resulting from fertilization of carrot (Daucus carota
subsp. Sativus L.) with human urine. The comparatively high EC measured in that experiment
can be explained by the extremely high urine dosages used. When used as the main source of
N, the contribution of urine to soil salinity depends mainly on the proportion of N to Na and
Cl in the urine. A relatively low N concentration of applied urine entails higher Na and Cl
which may result in soil salinity.
At the end of our experiment we observed an average reduction of the initial soil pH by 0.4
and 0.5 units in the S1 and S2 treatments respectively. These reductions were generally
higher in the urine than ammonium nitrate-treated substrates. Though soil pH was not
measured shortly after each urine dose, it is likely that the relatively high pH of urine (8.3)
initially increased that of the soil substrate, which eventually decreased due to nitrification
(Van Miegroet and Cole, 1984; Ball et al., 1979). Ritchey et al. (2008) reported a decrease in
soil pH resulting from goat urine fertilization on grasslands.
In general, the application of fertilizers can increase exchangeable levels of cations in the soil
and has been corroborated by Lombin (1981), who has shown that the application of K+ and
Mg2+ fertilizers increased their exchangeable levels in soil. The comparatively higher
exchangeable K+, Mg2+ and Ca2+ observed at the highest salt and N level (S2, N360) in urine-
fertilized substrates was expected because of their higher concentrations in urine. At the
application of 360 mg N kg-1 of substrate as urine, 60 mg K, 12 mg Ca and 4 mg Mg (kg
substrate)-1 were simultaneously added. Haynes and Williams (1992) also measured increases
in soil exchangeable K+ and Na+ on urine-treated pasture lands. However, they did not find
any significant effect of urine on exchangeable Ca2+ and Mg2+ as revealed by our findings,
which was probably due to leaching in the field, which was not the case in our experiment as
leachate was collected and returned to the respective pots.
The observed reduction in leaf K as substrate salinity rose may be explained in terms of
antagonistic effects of Na+ uptake. This is common under saline-sodic and sodic conditions
(Neto et al., 2006). Besides, elevated tissue Na may cause a disruption in membrane integrity
and thus enhance K+ efflux from the plant tissue into the growth medium (Cramer et al.,
1985). Studies have shown that NaCl salinity induces tissue Ca2+ deficiency (Rengel, 1992;

Urine as a fertilizer under saline conditions
25
Fortmeier and Schubert, 1995). Contrarily, we measured an increase in leaf Ca2+ as substrate
salinity rose, which could be due to higher solution Ca2+ that is being displaced by Na+ on the
cation exchange sites. We further observed higher Ca2+ and a tendency towards elevated
Mg2+ concentrations in the leaves of urine-fertilized maize plants, probably due to their
inherent concentration in urine. However, additional Ca2+ and other nutrients supplied
through urine did not enhance maize plant growth as was hypothesized.
Our study reveals that increasing NaCl concentrations reduced fresh and dry matter
production of leaves and stems. Accordingly, Turan et al. (2009) have shown that soil salinity
reduced maize dry matter accumulation. Reduced dry matter accumulation in sodic and
saline sodic soils can be associated with toxicities in plants caused by high concentrations of
Na+. An important toxicity component of Na+ is its ability to inhibit K+ uptake by plants
especially when the former is present in relatively high concentrations in the soil solution
(Luan et al., 2009). Assuming that symptoms were stronger with increasing salt concentration
and independent of the fertilizer high Na+ and reduced K+ uptake, leaf-tip burning, early leaf
senescence and death of plants indicate the occurrence of Na toxicity in our study. Lower
shoot fresh and dry matter yields in urine compared to ammonium nitrate-fertilized plants at
the highest N application under saline conditions was due to stress or toxicity resulting from
increased salt concentration in the substrate solution added with urine application.
Although leaf N concentration was higher in urine- than ammonium nitrate-treated plants,
this effect did not translate to shoot biomass yield due to increased salinity induced by urine
application. Reduction in leaf area expansion is an early response to salinity stress. Plant
leaves may expand up to a certain threshold and cease as salinity intensifies (Taleisnik et al.,
2009; Parida and Das, 2005). The smaller leaf area of urine-fertilized maize plants measured
at S2 compared to S0 at the highest N application rate (N360) can be explained by nutritional
disorders resulting from higher Na uptake over K, the latter being an important nutrient for
leaf cell expansion (Jordan-Meille and Pellerin, 2004). Fricke et al. (2006) have also reported a
reduction in barley (Hordeum vulgare L.) leaf elongation resulting from NaCl-induced stress.
2.5 Conclusion
Urine can substitute ammonium nitrate fertilizer under saline (here NaCl) conditions. The
application of 180 mg urine-N (kg soil substrate)-1 was suitable for maize fertilization at soil

Urine as a fertilizer under saline conditions
26
salinity up to (EC) 7.6 dS m-1. It was shown that application of 360 mg N (kg soil substrate)-1 at
this salinity exceeds the critical threshold for using urine as a fertilizer for maize. Our results
emphasize the need for a customized urine fertilizer management system that takes into
account N content, application amount and soil salinity level. This can be achieved by
constructing a model that assists in predicting the effects of urine fertilization on a wide
range of soil types and crops in semiarid and arid areas where salinity is often a problem.
2.6 Acknowledgments
The authors wish to acknowledge funding by the Katholischer Akademischer Ausländer-Dienst
(KAAD), Germany, as well as the assistance of Ms Ngongang Yonkio Simone Calone in the
greenhouse.
2.7 References
Bray, R. H., Kurtz, L. T. (1945): Determination of total, organic and available forms of
phosphorus in soils. Soil Sci. 59, 39-45.
Ball, R., Keeney, D. R., Theobald, P. W., Nes, P. (1979): Nitrogen balance in urine-affected
areas of a New Zealand pasture. Agron. J. 71, 309-314.
Bunt, A. C. (1988): Media and mixes for container-grown plants. (A manual on the preparation
and use of growing media for pot plants). In 2nd edition of Modern potting composts.
edition ed. Unwin Hyman, London and Boston, p. 309.
Cokuysal, B., Cakici, H., Erbas, E. (2006): The effect of salinity and fertilizer applications on leaf
nutrient status and some quality characteristics of Ficus benjamina. Int. J. Bot. 2, 107-
112.
Cramer, G. R., Läuchli, A., Polito, V. S. (1985): Displacement of Ca2+ by Na+ from the
plasmalemma of root cells: A primary response to salt stress? Plant Physiol. 79, 207-
211.
Elgharably, A., Marschner, P., Rengasamy, P. (2010): Wheat growth in a saline sandy loam soil
as affected by N form and application rate. Plant Soil 328, 303-312.
Fortmeier, R., Schubert, S. (1995): Salt tolerance of maize (Zea mays L.): The role of sodium
exclusion. Plant Cell Environ. 18, 1041-1047.
Fricke, W., Akhiyarova, G., Wei, W., Alexandersson, E., Miller, A., Kjellbom, P. O., Richardson,
A., Wojciechowski, T., Schreiber, L., Veselov, D., Kudoyarova, G., Volkov, V. (2006): The

Urine as a fertilizer under saline conditions
27
short-term growth response to salt of the developing barley leaf. J. Exp. Bot. 57, 1079-
1095.
Ganrot, Z., Dave, G., Nilsson, E., Li, B. (2007): Plant availability of nutrients recovered as solids
from human urine tested in climate chamber on Triticum aestivum L. Bioresour.
Technol. 98, 3122-3129.
Germer, J., Addai, S., Sauerborn, J. (2011): Response of grain sorghum to fertilisation with
human urine. Field Crops Res. 122, 234-241.
Grattan, S. R., Grieve, C.M. (1998): Salinity–mineral nutrient relations in horticultural crops.
Scientia Hort. 78, 127-157.
Haynes, R. J., Naidu, R. (1998): Influence of lime, fertilizer and manure applications on soil
organic matter content and soil physical conditions: a review. Nutr. Cycl. Agroecosyst.
51, 123-137.
Haynes, R. J., Williams, P. H. (1992): Changes in soil solution composition and pH in urine-
affected areas of pasture. J. Soil Sci. 43, 323-334.
Jacobs, D. F., Timmer, V. R. (2005): Fertilizer-induced changes in rhizosphere electrical
conductivity: relation to forest tress seedling root system growth and function. New
Forest 30, 147-166.
Jordan-Meille, L., Pellerin, S. (2004): Leaf area establishment of a maize (Zea mays L.) field
crop under potassium deficiency. Plant Soil 265, 75-92.
Kirchmann, H., Pettersson, S. (1995): Human urine - Chemical composition and fertilizer use
efficiency. Fert. Res. 40, 149-154.
Läuchli, A., Lüttge, U. (2002): Salinity: Environment - Plants - Molecules. Kluwer Academic
Publisher, Dordrecht, The Netherlands.
Lombin, G. (1981): The effects of continuous fertilization on nutrients balance and crop yield
in Northern Nigeria: A preliminary assessment. Can. J. Soil Sci. 61, 55-65.
Luan, S., Lan, W., Chul Lee, S. (2009): Potassium nutrition, sodium toxicity, and calcium
signaling: connections through the CBL–CIPK network. Curr. Opin. Plant Biol. 12, 339-
346.
Maurer, M., Pronk, W., Larsen, T.A. (2006): Treatment processes for source-separated urine.
Water Res. 40, 3151-3166.

Urine as a fertilizer under saline conditions
28
Mnkeni, P. N. S., Kutu, F. R., Muchaonyerwa, P., Austin, L. M. (2008): Evaluation of human
urine as a source of nutrients for selected vegetables and maize under tunnel house
conditions in the Eastern Cape, South Africa. Waste Manage Res. 26, 132-139.
Morghan, P. (2007): Toilets that make compost: low costs, sanitary toilets that produce
valuable compost for crops in an African context. Stockholm Environmental Institute,
Sweden.
Mortvedt, J. J. (2001): Calculating salt index. Fluid Journal, 9, 1-3.
Neto, A. D. A., Prisco, J. T., Enéas-Filho, J., Abreu, C. E. B., Gomes-Filho, E. (2006): Effect of salt
stress on antioxidative enzymes and lipid peroxidation in leaves and roots of salt-
tolerant and salt-sensitive maize genotypes. Environ. Exp. Bot. 56, 87-94.
Parida, A. K., Das, A. B. (2005): Salt tolerance and salinity effects on plants: a review.
Ecotoxicol. Environ. Saf. 60, 324-349.
Pascale, S. D., Maggio, A., Barbieri, G. (2005): Soil salinization affects growth, yield and
mineral composition of cauliflower and broccoli. Eur. J. Agron. 23, 254-264.
Pearce, R. B., Mock, J. H., Bailey, T. B. (1975): Rapid method for estimating leaf area per plant
in maize. Crop Sci. 15, 691-694.
Pradhan, S. K., Pitkänen, S., Heinonen-Tanski, H. (2009): Fertilizer value of urine in pumpkin
(Cucurbita maxima L.) cultivation. Agric. Food Sci. 18, 57-68.
Penov, I., Manolov, I., Alexiev, A., Kavardziev, Y. (2011): Salinisation in Bulgaria: Institutional
settings for soil conservation (a case study of Belozem village). Land Degrad. Dev. 22,
134-143.
Ray, J. D., Sinclair, T. R. (1998): The effect of pot size on growth and transpiration of maize
and soybeans during water deficit stress. J. Exp Bot. 29, 1381-1386.
Rengel, Z. (1992): The role of calcium in salt toxicity. Plant Cell Environ. 15, 625-632.
Richards, L. A. (1954): Diagnosis and Improvement of Saline and Alkali Soils. Agricultural
Handbook No. 60. USDA-ARS. Available at http://www.ars.usda.gov/sp2userFiles/
place/53102000/hb60_pdf/hb60complete.pdf (accessed 15 May 2011).
Ritchey, K. D., Boyer, D. G., Turner, K. E., Snuffer, J. D. (2008): Goat urine and limestone affect
nitrogen and cation distribution in an acidic grassland. Soil Sci. Soc. Am. J. 72, 626-633.
Schönning, C., Leeming, R., Stenström, T.A. (2002): Faecal contamination of source-separated
human urine based on the content of faecal sterols. Water Res. 36, 1965-1972.
Urine as a fertilizer under saline conditions
29
Taleisnik, E., Rodríguez, A. A., Bustos, D., Erdei, L., Ortega, L., Senn, M. E. (2009): Leaf
expansion in grasses under salt stress. J. Plant Physiol. 166, 1123-1140.
Turan, M. A., Abdelkarim Hassan Awad Elkarim, A. H. A., Taban, N., Taban, S. (2009): Effect of
salt stress on growth, stomatal resistance, proline and chlorophyll concentrations on
maize plant. Afric. J. Agric. Res. 4, 893-897.
Van Miegroet, H., Cole, D. W. (1984): The impact of nitrification on soil acidification and
cation leaching in a red alder ecosystem. J. Environ. Qual. 13, 586-590.
VDLUFA (2009): Handbuch der landwirtschaftlichen Versuchs- und Untersuchungsmethodik
(VDLUFA-Methodenbuch), Band VII Umweltanalytik, Methode 2.2.2.6: Bestimmung von
ausgewählten Elementen in pflanzlichem Material und Futtermitteln mit ICP-OES.
VDLUFA Verlag, Darmstadt, Germany.
Villa-Castorena, M., Ulery, A. L., Catalán-Valencia, E. A., Remmenga, M. D. (2003): Salinity and
Nitrogen Rate Effects on the Growth and Yield of Chile Pepper Plants. Soil Sci. Soc. Am.
J. 67, 1781-1789.
Vinnerås, B., Nordin, A., Niwagaba, C., Nyberg, K. (2008): Inactivation of bacteria and viruses
in human urine depending on temperature and dilution rate. Water Res. 42, 4067-
4074.
World Health Organization (2006): WHO Guidelines for the safe use of wastewater, excreta
and greywater, Geneva.

Urine as a fertilizer under saline conditions
30
3 Interacting effect of urine, ammonium nitrate and NaCl salinity on
sorghum growth and shoot nutrient concentrations
Journal of Soil Science and Plant Nutrition (submitted: July 25 th, 2013)
Michael Yongha Boh1*, Torsten Müller2, and Joachim Sauerborn1
1Institute of Plant Production and Agroecology in the Tropics and Subtropics, University of
Hohenheim, Garbenstr. 13, 70593 Stuttgart, Germany
2Institute of Crop Science, Fertilization and Soil Matter Dynamics, University of Hohenheim,
Fruwirthstr. 20, 70593 Suttgart, Germany
*Correspondence: Michael Yongha Boh; e-mail: [email protected]

Urine as a fertilizer under saline conditions
31
Abstract
In a greenhouse pot experiment, we compared the influence of urine- and ammonium
nitrate-N fertilization on sorghum [Sorghum bicolor (Moench) L.] shoot nutrient
concentrations, biomass yield and root:shoot ratio under different levels of NaCl addition.
The two nitrogen application levels were 90 and 180 mg N kg-1 soil substrate. Cultivation
substrate used was a mixture (1:1:1 v/v/v) of bio-waste compost, quartz sand and silty-loam
soil; with addition of NaCl solution to achieve target ECe of 1.3 (no salt added – Low), 4.6
(Medium) and 7.6 (High) dS m-1, imitating different levels of salinity and sodicity. Sorghum
was grown as a second crop after maize (Zea mays L.). Shoot and root biomass were
harvested 12 weeks after sowing and oven-dried for dry matter determination. Shoot
nutrients concentrations were assessed from ashed samples. Salinity significantly decreased
biomass yield regardless of N source. At an application rate of 90 mg N kg-1 substrate, total
biomass (shoot and root) was by 49, 34 and 40 % higher in plants treated with urine
compared to ammonium nitrate in the low, medium and high salinity treatments,
respectively. In the NaCl-treated substrates, application of 180 mg urine-N kg-1 raised soil
salinity and caused a significant decrease in shoot biomass yield. Correlation analyses showed
a relatively weak relationship between shoot N concentration and shoot biomass yield in
urine (r = 0.34; p > 0.05) if compared to ammonium nitrate (r = 0.91, p< 0.0001). In the high
salinity treatment nitrogen use efficiency (NUE) was by 33 % significantly lower in the urine
compared to ammonium nitrate treatments. We conclude that urine fertilization restricts
sorghum growth under NaCl salinity of ECe 7.6 dS m-1. However, where urine fertilization is
under consideration, lower dosaging (90 mg N kg-1 soil) and/or conductivity ECe ≤ 4.6 dS m-1 is
recommended.
Keywords: Nitrogen use efficiency, root:shoot ratio, salinity, sodicity, urine nitrogen
Urine as a fertilizer under saline conditions
32
3.1 Introduction
Salt accumulation in soils is an important growth-limiting factor in crop production
worldwide. Salinity affects plant growth by reducing the osmotic potential of the soil, causing
nutritional imbalances and specific ion toxicity in plants (Yadav et al. 2011). The relationship
between salinity and bioavailability of nutrients is complex and variable, and often depends
on plant species, level of salinity and soil nutrient status (Grattan and Grieve 1999). Sorghum
[Sorghum bicolour (Moench) L.] is a major food and fodder crop in most semiarid and arid
regions where salinity is a threat, and is moderately salt tolerant (Reddy et al. 2010). Some
studies have shown that up to a certain level of salinity, yields increase with the application of
N fertilizer to an optimum especially when nitrogen supply is growth-limiting (Esmaili et al.
2008; Nathawat et al. 2007). However, in poorer countries commercial fertilizers are either
too costly or unavailable for most farmers which partly accounts for the low and declining
yields of agricultural products in these areas (Morris et al. 2007).
Human urine which is available at little cost is increasingly gaining attention as an alternative
liquid N fertilizer. Different models of urine diversion toilets aimed at separately collecting,
sanitizing and using human urine in agriculture have been developed and are in use around
the world today (Kvarnström et al. 2006). When excreted, N in urine is in the form of urea but
rapidly hydrolyzes to ammonia and ammonium after storage; a process recommended for
urine sanitization prior to use as fertilizer (Kirchmann and Pettersson 1995; Vinnerås et al.
2008). The potential of urine as a fertilizer has been well proven (Germer et al. 2011;
Morghan 2007; Pradhan et al. 2009). Despite this, salinity and sodicity concerns have always
been raised whenever urine is under consideration for use as fertilizer due to its inherent
content of Na and Cl salts which is highly related to intake (World Health Organization 2006).
Salinity-mineral nutrition interaction effect on plant nutrients uptake and yields has been
extensively studied (Bernstein et al. 1974; Grattan and Grieve 1992; Irshad et al. 2008). In
these studies, it has been well noted that plant response to N fertilizers depends on initial soil
fertility, severity of the salt stress and N form. Accordingly, Tshivhandekano and Lewis (1993)
reported that maize (Zea mays) and wheat (Triticum aestivum) plants grown in an ammonium
solution were more sensitive to salinity than nitrate-fed plants. Meanwhile, Irshad et al.
(2002) observed that mixed applications of ammonium and nitrate were more favourable for
wheat plants in salt-affected soils. Silberbush and Lips (1988) however, did not find any

Urine as a fertilizer under saline conditions
33
relationship between salinity and the sensitivity of peanut (Arachis hypogaea) plants treated
with different ammonium/nitrate ratios.
Once applied to the soil ammonium is rapidly converted to nitrates but the process of
nitrification can be significantly delayed by salinity (McClung and Frankenberger 1985). In an
alfafa (Medicago sativa) amended sandy loam soil study, McCormick and Wolf (1980)
reported a significant reduction in nitrification following the application of 6 mg NaCl g-1 and a
complete inhibition at 10 mg NaCl g-1 soil. It has been argued that chloride salts are more
toxic to nitrification than sulphate salts (McClung and Frankenberger 1985; Sindhu and
Cornfield 1967) but in a calcareous soil treated with cow urine Monaghan and Barraclough
(1992) found that urinary chloride concentration up to 7.4 g l-1 did not affect nitrification
whereas at an osmotic pressure of -0.2 MPa nitrification was completely inhibited. Delayed
nitrification due to salinity and/or osmotic pressure may affect the form in which plants take
up and eventually assimilate nitrogen.
Generally, plants require up to 4 times more energy to assimilate nitrate than ammonium.
This energy demand on plants has been implicated for the comparatively low dry matter
accumulation in nitrate-fed plants (Huffman 1989). According to Irshad et al. (2008), this
effect could be more severe under saline conditions due to competition with other anions like
chloride.
In spite of the advancement in urine fertilizer research, we did not find any published
information on the interaction between NaCl salinity and urine fertilization on sorghum
growth. Therefore, a maize-sorghum crop sequence was carried out which aimed to evaluate
the cumulative effect of urine fertilization and its interaction with salinity on biomass yield
and nutrient concentration in sorghum. The specific objectives of our experiment were to 1)
compare the effect of urine and ammonium nitrate nitrogen sources on sorghum growth,
measured as biomass yield and 2) determine the relationship between shoot biomass yields
and shoot nutrient concentration under different levels of NaCl salinities. We hypothesized
that i) urine-induced increase in soil salinity reduces sorghum growth of urine-treated plants
compared to those treated with ammonium nitrate ii) the effects of urine and ammonium
nitrate fertilization on sorghum growth depend on the level of NaCl salinity. Information thus
gathered would enhance understanding of NaCl salinity and urine fertilizer interaction which
is relevant for urine fertilizer management in salt vulnerable areas.

Urine as a fertilizer under saline conditions
34
3.2 Materials and methods
A greenhouse experiment was conducted at the University of Hohenheim, Stuttgart –
Germany (48.7114°N 9.2095°E) on a NaCl-treated cultivation substrate previously cropped
with maize as a first crop and fertilized with urine or ammonium nitrate as N sources as
described in Boh et al. (2013). Briefly, the cultivation substrate was made of a mixture of bio-
waste compost, quartz sand, and silty loam soil in a 1:1:1 volume ratio. The experimental
treatments consisted of 3 levels of NaCl addition, 2 N sources (urine and ammonium nitrate)
and 2 N amounts (180 and 360 mg N kg-1 soil). Salinity was imitated by adding predetermined
amounts of NaCl solutions to a known soil substrate weight following a laboratory calibration
study to achieve targeted conductivities of ECe 1.3 (Low – no salt added), 4.6 (Medium) and
7.6 (High) dS m-1.
Mitscherlich pots were used in these experiments for a cropping sequence. At the end of the
first maize cropping cycle, root and shoot biomass were harvested and the soil substrate from
each pot was emptied, hand-crushed and homogenized. 11 kg were refilled in the same 10 l
Mitscherlich pots at the start of the experiment. As a second crop, six sorghum seeds were
sown in each pot, thinned to two healthy seedlings two weeks after emergence and fertilized
with urine- (U) or ammonium nitrate-N (AN) 1 week later. The experimental treatments
(Table 3.1) were the same as for the preceding maize trial briefly described above except that
N supply was 90 and 180 mg kg-1 soil substrate. Experimental setup was a completely
randomized block design.
Table 3.1 Experimental treatments (n=4). Electrical conductivity (ECe dS m-1) and fertilizer addition to the cultivation substrate (mg kg-1).
Salinity level (ECe) Ammonium nitrate mg kg
-1
Urine mg kg
-1
(AN1) (AN2) (U1) (U2)
Low - no NaCl added (1.3 dS m-1
) 90 180 90 180
Medium (4.6 dS m-1
) 90 180 90 180 High (7.6 dS m
-1) 90 180 90 180
U1 and U2 = 90 and 180 mg urine-N kg-1
substrate respectively; AN1 and AN2 = 90 and 180 mg ammonium nitrate-N kg
-1substrate respectively.
Urine collected from students in a hostel of the University of Hohenheim was stored at mean
daily temperatures of 25±2 °C for 12 months and hence, was considered hygienically safe for
unrestricted use as a fertilizer (Vinnerås et al., 2008). Prior to application, the urine container
was thoroughly shaken and samples were taken for chemical analyses. Urine contained 6.0 g

Urine as a fertilizer under saline conditions
35
total N (mainly NH4), 1.42 g K (as K2O), 0.41 g P (as P2O5), 0.32 mg Ca, 0.43 mg Mg, 2.3 g Na
and 3.2 g Cl l-1. A 25 % reduction in total urine N compared to its content shortly after
collection was observed. This can be attributed to loss of ammonia through volatilization.
Ammonium nitrate ≥ 98 % (Sigma-Aldrich Chemie GmbH, Germany) was applied as a solution
prepared by dissolving the salt in deionised water to contain an equivalent amount of N as 1 l
of the urine used.
Day and night temperatures in the greenhouse were set at 30 and 18 °C with 12 hours
photoperiods throughout the growing period. To maintain an adequate water supply to the
plants throughout the growing period, pots were irrigated regularly with tap water and when
leachate accumulated in the plastic bowls placed below each pot it was returned to prevent
nutrient losses and salinity changes.
3.2.1 Data collection and analyses
Sorghum plants were harvested 12 weeks after sowing and separated into roots and shoots.
Roots were washed with tap water to remove soil and both plant parts were oven-dried at 70
°C to constant weight. Dried shoot tissues were ashed at 500 °C for 5 hours and digested with
1:3 (solution: de-ionized water) concentrated HCl. In the ash solution, P, K, Ca, Mg, Na
concentrations were measured. P concentration was measured colorimetrically (Ryan et al.,
2001). K and Na were measured by flame photometry while the concentrations of Ca and Mg
were measured by atomic absorption spectrometry (AAS). Chloride was extracted from the
samples by boiling water and measured by ion chromatography with conductivity detection
(VDLUFA 2009). Nitrogen use efficiency (NUE) was calculated as described by (Maranville et
al. 1980): NUE = SDW/SN, where SDW is shoot dry weight (g pot-1) and SN is total shoot
nitrogen (g pot-1). Substrate electrical conductivity and pH were measured from samples
taken from each pot at the end of the trial. Electrical conductivity was measured from a
saturated paste according to Richards (1954) while pH was measured in a 1:2.5 (soil:solution)
suspension of 1 M KCl.
A three-factor (salinity, N source and N amount) factorial statistical analysis with four
replications was carried out using the SAS statistical software package (SAS Institute version
9.3). ANOVA was conducted using PROC GLM procedure and Fisher’s LSD (α = 0.05) and
Tukey-Kramer adjusted post hoc analyses were used to compare statistical significance
between means at p ≤ 0.05. Where ANOVA results did not show significant interactions, data

Urine as a fertilizer under saline conditions
36
were pooled and further analyses carried out. Data for shoot P concentration were square
root-transformed for statistical calculations. Regression (PROC REG) and correlation (PROC
CORR) analyses were carried out to assess the relationship between shoot nutrient
concentration and biomass accumulation.
3.3 Results
3.3.1 Substrate pHKCl and electrical conductivity (ECe)
Substrate pHKCl was significantly affected by salinity x N source x N amount interactions (df =
2; F = 7.05; p = 0.003) (Table 3.2). Compared to the low salinity treatment, the pHKCl of urine-
treated cultivation substrate which received 90 mg N kg-1 substrate was by 0.2 units
significantly higher than those in the high salinity treatment (Table 3.3). Cultivation substrate
pHKCl significantly decreased from 7.2 to 6.9 pHKCl units when the amount of urine applied
was raised from 90 to 180 mg N kg-1 substrate in the high salinity treatment whereas
ammonium nitrate-fertilized substrates were not significantly affected. Furthermore, in the
high salinity treatment the pHKCl of substrates fertilized with 180 mg ammonium nitrate-N kg-1
was 0.3 units significantly higher than those which received the same amount of N in the
form of urine.
Table 3.2 Summary of F-values from three-way ANOVA of sorghum biomass and nutrient concentration as influenced by salinity (S), nitrogen source (NS) and nitrogen amount (NA).
Variables S NS S x NS NA S x NA NS x NA S x NS x NA
Root:shoot ratio 1.5 ns 2.0 ns 16.6 *** 0.0 ns 1.2 ns 15.4 *** 10.8 ***
Total biomass 16.1 *** 72.2 *** 2.3 ns 2.5 ns 6.7 ** 15.6 *** 0.3 ns
N 2.5 ns 44.3 *** 3.2 ns 9.2 ** 1.7 ns 0.1 ns 0.8 ns
P 30.1 *** 12.4 ** 14.0 *** 0.6 ns 13.2 *** 20.1 *** 5.9 **
K 24.7 *** 16.6 *** 0.8 ns 3.2 ns 0.1 ns 1.4 ns 3.9 *
Ca 3.9 * 15.8 *** 0.1 ns 6.8 * 0.5 ns 0.0 ns 4.7 *
Mg 1.9 ns 81.7 *** 3.4 * 0.2 ns 2.3 ns 10.7 ** 8.3 **
Na 423.4 *** 415.2 *** 218.8 *** 147.4 *** 47.8 *** 144.3 *** 55.2 ***
Cl 47.1 *** 9.2 ** 1.5 ns 15.9 *** 4.1 * 4.5 * 7.4 **
K/Na 61.1 *** 40.5 *** 2.5 ns 14.5 ** 3.4 * 11.4 ** 0.7 ns
Ca/Na 97.5 *** 32.5 *** 2.0 ns 11.6 ** 4.1 * 11.8 *** 1.5 ns
Mg/Na 91.1 *** 13.8 *** 2.9 ns 16.1 *** 3.7 * 14.7 *** 0.7 ns
For this and subsequent tables, *, ** and *** indicate level of significance at P < 0.05, 0.01 and 0.001 respectively; ns = not significant.

Urine as a fertilizer under saline conditions
37
Table 3.3 Effect of urine and ammonium nitrate application on cultivation substrate pHKCl and electrical conductivity (ECe) measured at the end of the experiment.
Salinity level (ECe) Fertilizer treatment pHKCl ECe (dS m-1
)
U1 7.0±0.03bcd 3.1±0.09ef
Low U2 7.1±0.03abc 4.9±0.25ed
(1.3 dS m-1
) AN1 6.9±0.04cd 2.9±0.02ef
AN2 7.1±0.01abc 2.6±0.04f
U1 7.1±0.04ab 5.8±0.23cd
Medium U2 7.1±0.03abc 8.9±0.20b
(4.6 dS m-1
) AN1 7.1±0.01ab 5.1±0.19ed
AN2 7.1±0.04ab 5.3±0.25ed
U1 7.2±0.01a 8.5±0.18b
High U2 6.9±0.07d 11.9±0.88a
(7.6 dS m-1
) AN1 7.1±0.02ab 8.2±0.48b
AN2 7.2±0.02a 7.8±0.25bc
Values represent means ± standard error (n = 4). U1 and U2 represent 90 and 180 mg urine-N kg-1
substrate
respectively; AN1 and AN2 represent 90 and 180 mg ammonium nitrate-N kg-1
substrate respectively. Different
lowercase letters represent significant difference between treatments (p ≤ 0.05); Tukey-Kramer adjusted test.
There was a significant interaction effect (p = 0.03) of salinity x N source x N amount on
substrate ECe (Table 3.2). It is important to note that the values of ECe shown here in Table
3.3 are cumulative. With the exception of low salinity treatment, an increase in urine
application from 90 to 180 mg N kg-1 substrate significantly raised substrate ECe. Meanwhile
the same increase in N application in the form of ammonium nitrate had no significant effect
on ECe regardless of salinity treatment (Table 3.3). Our data further revealed that while
substrate ECe was not different between the two fertilizers at application of 90 mg N kg-1
substrate, the ECe of urine-fertilized substrates was comparatively higher at 180 mg N kg-1
substrate.
3.3.2 Biomass yield and root:shoot ratio
Total biomass (shoot and root) yield was significantly influenced by salinity x N source and N
source x N amount interactions (Table 3.2). In the low and medium salinity treatments, total
biomass yield was significantly higher in urine than ammonium nitrate-fertilized treatments.
With an increase in salinity from ECe 4.6 to 7.6 dS m-1, total biomass yield significantly
reduced for both fertilizer sources. Total biomass yield was by 49, 34 and 40 % higher in
treatments fertilized with U1 compared to AN1 in the low, medium and high salinity
treatments, respectively (Table 3.4). At higher N applications (U2 and AN2) in the low and
medium salinity treatments, total biomass yield was by 22 and 17 % higher in urine than
ammonium nitrate-fertilized treatments, respectively. With the exception of low salinity
treatment, total biomass yield significantly decreased when the amount of N supplied
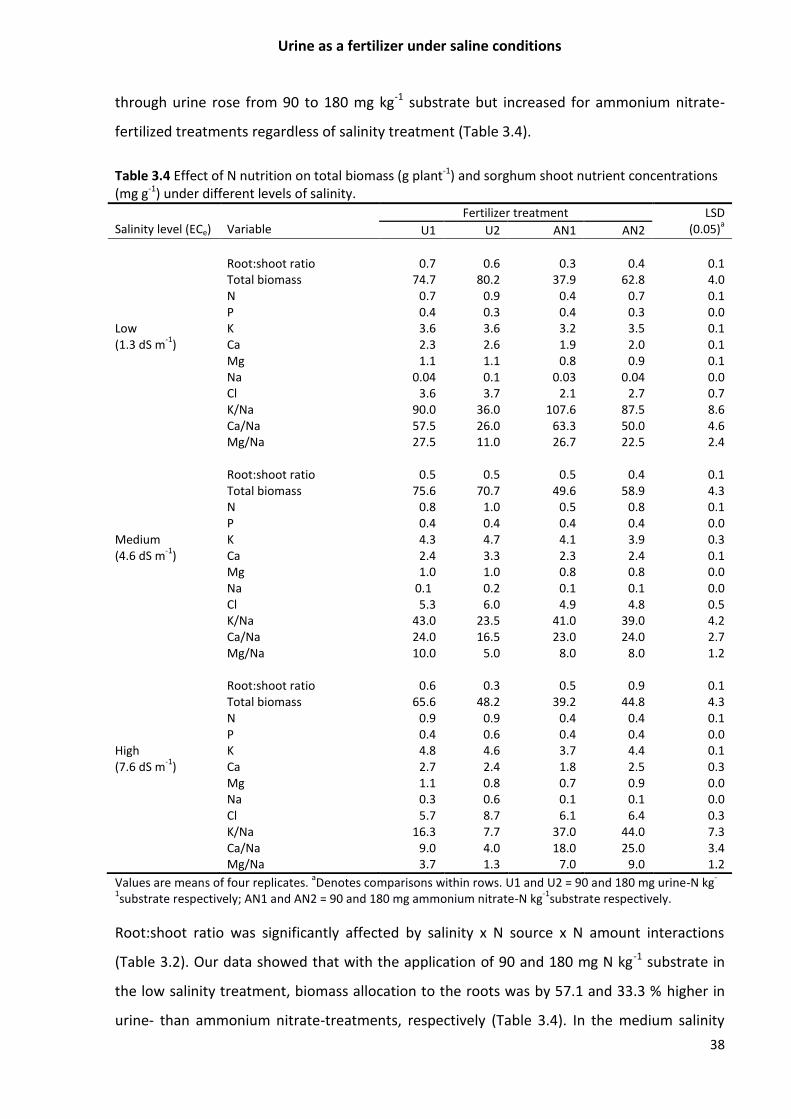
Urine as a fertilizer under saline conditions
38
through urine rose from 90 to 180 mg kg-1 substrate but increased for ammonium nitrate-
fertilized treatments regardless of salinity treatment (Table 3.4).
Table 3.4 Effect of N nutrition on total biomass (g plant-1) and sorghum shoot nutrient concentrations (mg g-1) under different levels of salinity.
Values are means of four replicates. aDenotes comparisons within rows. U1 and U2 = 90 and 180 mg urine-N kg
-
1substrate respectively; AN1 and AN2 = 90 and 180 mg ammonium nitrate-N kg
-1substrate respectively.
Root:shoot ratio was significantly affected by salinity x N source x N amount interactions
(Table 3.2). Our data showed that with the application of 90 and 180 mg N kg-1 substrate in
the low salinity treatment, biomass allocation to the roots was by 57.1 and 33.3 % higher in
urine- than ammonium nitrate-treatments, respectively (Table 3.4). In the medium salinity
Salinity level (ECe)
Variable
Fertilizer treatment LSD (0.05)
a U1 U2 AN1 AN2
Root:shoot ratio 0.7 0.6 0.3 0.4 0.1 Total biomass 74.7 80.2 37.9 62.8 4.0 N 0.7 0.9 0.4 0.7 0.1 P 0.4 0.3 0.4 0.3 0.0 Low K 3.6 3.6 3.2 3.5 0.1 (1.3 dS m
-1) Ca 2.3 2.6 1.9 2.0 0.1
Mg 1.1 1.1 0.8 0.9 0.1 Na 0.04 0.1 0.03 0.04 0.0 Cl 3.6 3.7 2.1 2.7 0.7 K/Na 90.0 36.0 107.6 87.5 8.6 Ca/Na 57.5 26.0 63.3 50.0 4.6 Mg/Na 27.5 11.0 26.7 22.5 2.4 Root:shoot ratio 0.5 0.5 0.5 0.4 0.1 Total biomass 75.6 70.7 49.6 58.9 4.3 N 0.8 1.0 0.5 0.8 0.1 P 0.4 0.4 0.4 0.4 0.0 Medium K 4.3 4.7 4.1 3.9 0.3 (4.6 dS m
-1) Ca 2.4 3.3 2.3 2.4 0.1
Mg 1.0 1.0 0.8 0.8 0.0 Na 0.1 0.2 0.1 0.1 0.0 Cl 5.3 6.0 4.9 4.8 0.5 K/Na 43.0 23.5 41.0 39.0 4.2 Ca/Na 24.0 16.5 23.0 24.0 2.7 Mg/Na 10.0 5.0 8.0 8.0 1.2 Root:shoot ratio 0.6 0.3 0.5 0.9 0.1 Total biomass 65.6 48.2 39.2 44.8 4.3 N 0.9 0.9 0.4 0.4 0.1 P 0.4 0.6 0.4 0.4 0.0 High K 4.8 4.6 3.7 4.4 0.1 (7.6 dS m
-1) Ca 2.7 2.4 1.8 2.5 0.3
Mg 1.1 0.8 0.7 0.9 0.0 Na 0.3 0.6 0.1 0.1 0.0 Cl 5.7 8.7 6.1 6.4 0.3 K/Na 16.3 7.7 37.0 44.0 7.3 Ca/Na 9.0 4.0 18.0 25.0 3.4 Mg/Na 3.7 1.3 7.0 9.0 1.2

Urine as a fertilizer under saline conditions
39
treatment, root and shoot biomass was equitably distributed in the U1, U2 and AN1 fertilized
plants but root biomass allocation in the U2 treatment was 20 % higher than in the AN2
treatment. In the high salinity treatment, biomass partitioning to the roots was decreased by
50 % as the amount of urine was raised from U1 to U2 and increased by 44 % following an
increase in ammonium nitrate amount from AN1 to AN2. It was further observed that with
the application of 180 mg N kg-1 substrate in the high salinity treatment, root biomass
allocation was by 67 % higher in ammonium nitrate- compared to urine-fertilized treatments.
3.3.3 Shoot nutrient concentrations
Analyses of variance results showed that shoot N concentration in sorghum was significantly
influenced by N source and N amount (Table 3.2). Shoot N concentration was significantly
higher in urine- than ammonium nitrate-fertilized treatments at all levels of salinity (Table
3.4). With the exception of high salinity treatment, shoot N concentration significantly rose
with an increase in N amount for both fertilizer sources. Statistical analyses revealed that
shoot N concentration was significantly related to shoot biomass yield regardless of salinity
level (Table 3.4). However, a significant positive correlation (r = 0.91; p < 0.0001) between
shoot biomass yield and shoot nitrogen concentration was observed only for ammonium
nitrate-fertilized treatments (Figure 3.1). Our data further indicated that nitrogen use
efficiency (NUE) was significantly influenced by the interaction between salinity and N source
(df = 2; F = 3.86; p = 0.03). There was no significant difference (p > 0.05) in NUE between both
fertilizers in the low and medium salinity treatments whereas NUE was by 33 % lower in urine
than ammonium nitrate treatments under high salinity (Table 3.5).
Table 3.5 Effect of NaCl salinity level (ECe) and nitrogen source on nitrogen use efficiency (NUE).
Salinity level (ECe) Nitrogen source NUE
Low (1.3 dS m-1
) Urine 59.0±2.0ab Ammonium nitrate 67.8±4.1a Medium (4.6 dS m
-1) Urine 54.7±4.8ab
Ammonium nitrate 59.2±2.4ab High (7.6 dS m
-1) Urine 44.8±3.4b
Ammonium nitrate 67.9±4.1a
Values represent means of four replicates ± S.E. Different lowercase letters indicate significant differences between treatments at p ≤ 0.05; Tukey-Kramer adjusted test.

Urine as a fertilizer under saline conditions
40
Figure 3.1: Relationship between shoot N concentrations and shoot dry weight of sorghum plants fertilized with urine- or ammonium nitrate-N.
The concentrations of shoot P, K, Ca, Mg, Na and Cl were significantly influenced by salinity x
N source x N amount interactions (Table 3.2). Our data in Table 6 showed a significant
relationship between shoot biomass yield and shoot concentration of Mg, Na and Cl in the
low salinity and P and Na in the high salinity treatments. In the low salinity treatment, shoot P
concentration decreased as the amount of N added through both fertilizers rose, but
increased significantly under high salinity for urine- while ammonium nitrate-fertilized
treatments remained unaffected (Table 3.4). Shoot K concentration was significantly higher in
urine than ammonium nitrate-fertilized treatments in the low and high salinity treatments
irrespective N amount.
In the low and medium salinity treatments, shoot Ca and Mg concentrations were
significantly higher in the urine than ammonium nitrate-fertilized treatments. In urine-
fertilized treatments that received 90 mg N kg-1 substrate shoot Ca concentration was by 17.4
and 33.3 % significantly higher than in treatments that received an equivalent amount in the
form of ammonium nitrate in the low and high salinities, respectively (Table 3.4). At a higher
N dose (180 mg N kg-1 substrate); shoot Ca concentration was by 23.1 and 27.3 % significantly
higher in urine than in the ammonium nitrate treatments at low and medium salinity,
meanwhile in the high salinity treatment, there was no significant N source effect. We further
observed a significant 27.3 % increase in shoot Ca concentration following an increase in

Urine as a fertilizer under saline conditions
41
urine application from U1 to U2 in the medium salinity treatment. A significant 28 % increase
in shoot Ca concentration was measured in the high salinity treatment following an increase
in ammonium nitrate dosage from 90 to 180 mg N kg-1 substrate.
Table 3.6 Regression models, determinants (R2) and correlation coefficient (r) and shoot biomass yields (Y) at different salinity levels.
Salinity level (ECe) Variable Regression equation R2 r
N Y=14.8+39.36N 0.84*** 0.92 P Y=42.7-2.78P ns 0.01 Low K Y=-10.3+14.91K ns 0.43 (1.3 dS m
-1) Mg Y=44.5+43.21Mg 62*** 0.79
Ca Y=11.7+13.60Ca ns 0.48 Na Y=61.7-0.82Na 0.46** 0.68 Cl Y=28.9+3.95Cl 0.30* 0.54 N Y=21.5+27.56N 0.44** 0.66 P Y=54.6-28.79P ns 0.11 K Y=49.3-1.47K ns 0.09 Medium Mg Y=46.4+30.76Mg ns 0.48 (4.6 dS m
-1) Ca Y=38.9+1.58Ca ns 0.08
Na Y=39.4+0.26Na ns 0.14 Cl Y=24.2+3.61Cl ns 0.35 N Y=16.8+23.81N 0.77*** 0.87 P Y=10.8+46.25P 0.25* 0.50 K Y=-7.00+8.99K ns 0.50 High Mg Y=35.3+26.30Mg ns 0.48 (7.6 dS m
-1) Ca Y=21.6+4.51Ca ns 0.27
Na Y=39.5-1.06Na 0.42*** 0.64 Cl Y=29.1+0.46Cl ns 0.07
With the application of 90 mg N kg-1 substrate in the low, medium and high salinity
treatments, shoot Mg concentration was by 27.3, 20.0 and 36.4 % significantly higher in urine
than ammonium nitrate-fertilized treatments. Our data also showed that with the application
of 180 mg N kg-1 substrate in the low and medium salinity shoot Mg concentration in urine-
fertilized treatments was by 18.2 and 20.0 % significantly higher than those fertilized with
ammonium nitrate. There was no significant effect on shoot Mg concentration following an
increase in N application from 90 to 180 mg N kg-1 substrate in the low and medium salinity
treatments for both fertilizers. Whereas in the high salinity treatments, shoot Mg
concentration significantly decreased by 18.2 and increased by 22.2 % for urine and
ammonium nitrate-fertilized treatments, respectively.
As expected, the concentration of Na in the shoots of sorghum plants significantly increased
as salinity rose for all urine treatments but did not change for ammonium nitrate-fertilized
treatments as salinity rose from medium to high (Table 3.4). With the exception of U1 in the

Urine as a fertilizer under saline conditions
42
medium salinity treatment, shoot Na concentration was higher in urine compared to
ammonium nitrate-fertilized treatments and increased as the amount of N applied through
urine rose from 90 mg to 180 mg N kg-1 substrate (Table 3.4). Like Na, shoot Cl concentration
also increased as salinity level rose. Compared to AN1 treatment, shoot Cl concentration was
by 44 % higher in U1 in the low salinity treatment. Our data also revealed that with the
application of 180 mg N kg-1 substrate, shoot Cl concentration was higher by 27, 20 and 26 %
in urine-fertilized treatments under low, medium and high salinity treatments, respectively,
compared to those fertilized with ammonium nitrate. In the medium and high salinity
treatments, shoot Cl concentrations significantly increased by 11.7 and 34.5 %, respectively,
when urine-N application was raised from 90 (U1) to 180 (U2) mg kg-1 of substrate.
Shoot K/Na, Ca/Na and Mg/Na concentration ratios were significantly affected by salinity x N
amount and N source x N amount interactions (Table 3.2). Shoot K/Na, Ca/Na and Mg/Na
ratios significantly decreased as salinity level rose and were higher in ammonium nitrate than
urine-fertilized treatments in the low and high salinity treatments (Table 4). An increase in
urine application from 90 (U1) to 180 (U2) mg N kg-1 substrate significantly reduced shoot
K/Na ratio by 60, 44.8 and 52.8 % in the low, medium and high salinity treatments,
respectively. For ammonium nitrate-fertilized treatments under low salinity, shoot K/Na ratio
significantly reduced by 18.7 %. Shoot Ca/Na ratio decreased by 54.8, 31.3 and 55.6 in the
low, medium and high salinities following an increase in urine-N application. An increase in
the supply of N in the form ammonium nitrate (AN1 to AN2) lowered shoot Ca/Na ratio by 21
% in the low salinity treatments but significantly increased it by 28 % in the high salinity
treatment. In the low, medium and high salinity treatments, shoot Mg/Na ratio was lower by
60, 50 and 64.9 %, respectively, following an increase in urine application from U1 to U2.
Comparatively, a proportionate increase in N supply as ammonium nitrate significantly
reduced shoot Mg/Na ratio by 15.7 % in the low salinity treatments but increased it by 22.2 %
on the high salinity treatment.
3.4 Discussion
Fertilizer application often modifies soil chemical and biological properties. How the applied
fertilizer affects the soil solution characteristics and the ultimate availability of nutrients to
plants depends on the chemical composition of the fertilizer type. The use of ammonium-
based N fertilizers has been shown to have a pH-reducing effect on soils mainly due to the
Urine as a fertilizer under saline conditions
43
biological conversion of ammonium to nitrate (Zhang and Raun 2006). Though higher
nitrification was expected in the urine-fertilized treatment, it is clear from our study that
nitrification was not an important determinant of substrate pHKCl. In the urine fertilized
treatment (U2), the decrease in substrate pHKCl at salinity treatment ECe 7.6 dS m-1 can be
attributed to Na-induced displacement of hydrogen ions from the cation exchange sites
considering that Na concentration was higher at this salinity level and urine treatment (Green
et al. 2008). When plants take up positively charged ions, they excrete positively charged
hydrogen ions to maintain a soil electrical balance. Increased concentration of hydrogen ions
in the soil has an acidifying effect (Gazey and Davis 2009).
Although application of N fertilizers have been proven to alleviate the deteriorating effect of
salinity on crops, over fertilization is known to exacerbate the problem of salinity (Chen et al.
2010; Villa-Castorena et al. 2003). Apart from nitrogen, urine contains dissolved salts of Na
and Cl which explains the increase in substrate salinity at a higher application dosage. This
result is consistent with our earlier findings and emphasizes the need to consider the
salinizing effect of urine when deciding the amount of urine to be applied to crops in a saline
soil (Boh et al. 2013).
In this study, we also tested whether compared to ammonium nitrate, urine-N could improve
sorghum growth measured as biomass yield at given levels of substrate salt (NaCl)
concentrations. It was our expectation that urine salinity would impose a limit on the growth
of urine-fertilized treatments. Our results indicated that urine improved the nutrition of
sorghum plants shown in higher biomass yield than ammonium nitrate. This can only partly
be explained by the addition of K, Mg and Ca alongside urine N though the contents of these
nutrients in urine were generally low. Furthermore, apart from Mg in the low salinity
treatment, our results (Table 3.3) did not show any significant correlation between the
concentration of these nutrients and sorghum shoot biomass yield. However, it is conceivable
that synergism between two or more of these nutrients can have a growth-improving effect
on sorghum plants. According to Zhong and Lauchli (1994), supplemental external Ca can
improve plant tolerance to NaCl salinity by maintaining plasma-membrane selectivity of K
over Na. This agrees with the findings of Jafari et al. (2009) who observed improved sorghum
growth under saline conditions resulting from a combined application of Ca and K.
Urine as a fertilizer under saline conditions
44
Increased biomass yield in ammonium compared to nitrate-fed plants has been related to
energetic savings (Kant et al. 2007). Compared to nitrate, the energy requirement for the
assimilation of one molecule of ammonium is 4 times lower. Therefore, reduced biomass
yield in ammonium nitrate-treated plants can be related to expended energy involved in
nitrate assimilation. Under high salinity the observed decrease in sorghum biomass yield
when the amount of applied urine was raised from U1 to U2 can be attributed to the increase
in soil salinity induced by urine fertilization. This is in conformity with our previous
investigation which showed that under saline conditions higher doses of urine fertilization
increased soil salinity and stress in maize plants resulting in lower biomass yield (Boh et al.
2013).
According to Bonifas et al. (2005), root:shoot ratio which is an important component in crop
yields can be affected by N supply. Our results showed that the effect of salinity, N source and
N amount on biomass partitioning between roots and shoots was interactive. Reduced
root:shoot ratio of urine-fertilized treatments following an increase in application amount
under high salinity treatment can be associated with urine-induced increase in soil Na and Cl
concentrations which can have synergistic toxic effects on root growth (Martin and Koebner
1995). However, in this study, the critical level at which toxicity sets is not certain. Frechilla et
al. (2001) found that under NaCl saline conditions root growth inhibition of ammonium-fed
pea (Pisum sativum) plants was related to increased sodium accumulation in the roots and
decreased root organic nitrogen content. Although Kudoyarova et al. (1997) have associated
higher root:shoot ratios with auxin concentration common in nitrate fed plants, in our study it
remains unclear why root:shoot ratio was significantly higher in ammonium nitrate-fed plants
in the high salinity treatment. This would require further investigation.
Delayed nitrification due to toxicity and/or osmotic stress caused by urinary salts explains
why urine-treated plants are more likely to take up nitrogen in the form of ammonium than
nitrate. This however, depends on the time of application (McClung and Frankenberger 1985;
Monaghan and Barraclough 1992). The lag phase required by nitrifying bacteria to adjust to
salt or osmotic stress is 18 to 20 days after which rapid nitrification will take place following
an exponential growth in nitrifying bacteria (Helder and De Vries 1983; Monaghan and
Barraclough 1992).

Urine as a fertilizer under saline conditions
45
The higher shoot N concentration in urine compared to ammonium nitrate-fed plants can be
related to cation:anion balance effect caused by the relatively higher shoot Cl concentration
in urine-fed plants. Cation:anion balance effect on plant nutrition has also been reported by
Irshad et al. (2002) who related high concentrations of P and Cl in the tissues of ammonium-
fed wheat plants to a response in ammonium uptake. In the high salinity treatment, reduced
shoot N concentration in ammonium nitrate-fed plants could be additionally related to
nitrate-chloride antagonism. At high external Cl concentration competition and the toxic
effect of Cl salts can cause to reduce NO3 uptake in plants (Debouba et al. 2007).
Even though there was a strong positive correlation between shoot N concentration and
shoot biomass yield, when this relationship was compared between the two N forms, urine
treated plants showed a weak relationship which suggests that other nutrients in urine could
have contributed to increase shoot biomass yield as already mentioned above. Our results
further revealed that in spite of the high shoot N concentration, NUE was significantly lower
in urine compared to ammonium nitrate-fed plants under high salinity. This can be attributed
to growth-inhibitory effects resulting from additional salts applied through urine. In an earlier
study, Pessarakli and Tucker (1985) found that NaCl salinity can inhibit ammonium
metabolism and protein synthesis in cotton (Gossypium hirsutum) plants without affecting its
uptake. In a wire-house experiment, Perveen et al. (2012) have also shown that salinity can
adversely affect nutrient use efficiency in wheat plants.
Leaf K/Na ratio is often used as an indicator of sorghum tolerance to salt stress (Vasilakoglou
et al. 2011). The observed decrease in shoot K/Na, Ca/Na and Mg/Na ratio as salinity rose was
due to an increase in Na uptake which negatively affected plant metabolism and growth
(Irshad et al. 2008). The lower K/Na, Ca/Na and Mg/Na ratios in urine compared to
ammonium nitrate-fertilized treatments was due to the addition of Na through urine.
However, the added Na was not enough to cause a growth-reducing effect on sorghum plants
treated with urine except when the urine dose was raised to 180 mg N kg-1 substrate in the
medium and high salinity treatments.
3.5 Conclusion
With biomass production as a growth indicator, our results illustrated that compared to
ammonium nitrate, sorghum growth improved under urine-fertilized treatment. Sorghum

Urine as a fertilizer under saline conditions
46
growth was inhibited under high salinity treatment. It was shown that in the NaCl-treated
cultivation substrate, the application of 180 mg urine-N kg-1 substrate increased soil salinity
and thus reduced biomass yield. It is apparent that N and other nutrients added through
urine interacted to cause an increase in shoot biomass yield of urine-fertilized treatments but
this requires further investigation. NUE of urine-fertilized treatments was reduced by 33 %
compared to those treated with ammonium nitrate under high NaCl salinity level, suggesting
that at NaCl salinity level exceeding 7.6 dS m-1 urine fertilization should be restricted for
sorghum plants. As sorghum is a field crop and seldom grown in pots, field trials to determine
the critical salinity level and urine dosage would be necessary. This study helps to understand
the interaction between salinity and urine fertilizer on sorghum growth and stresses the need
to keep urine-N application doses low on saline soils.
3.6 Acknowledgement
The authors are grateful for the financial support of the Katholischer Akademischer Ausländer
Dienst (KAAD), Germany as well as the laboratory assistance of Frau Helene Ochott. We thank
Dr. Jörn Germer for his useful comments on an earlier version of this manuscript.
3.7 References
Bernstein L, Francois LE, Clark RA 1974: Interactive effects of salinity and fertility on yields of
grains and vegetables. Agron. J., 66, 412-421.
Boh MY, J. Germer, T. Müller and J. Sauerborn. 2013. Comparative effect of human urine and
ammonium nitrate application on maize (Zea mays L.) grown under various salt (NaCl)
concentrations. J. Plant Nutr. Soil Sci., DOI: 10.1002/jpln.201200486.
Bonifas KD, Walters D T, Cassman GK, Lindquist JL 2005: Nitrogen supply affects root:Shoot
ratio in corn and velvetleaf (Abutilon theophrasti). Weed Sci., 53, 670-675.
Chen W, Hou Z, Wu L, Liang Y, Wei C 2010: Effects of salinity and nitrogen on cotton growth in
arid environment. Plant Soil, 326, 61-73.
Debouba M, Maaroufi-Dghimi H, Suzuki A, Ghorbel MH, Gouia H 2007: Changes in growth and
activity of enzymes involved in nitrate reduction and ammonium assimilation in tomato
seedlings in response to NaCl stress. Ann. Bot., 99, 1143-1151.

Urine as a fertilizer under saline conditions
47
Esmaili E, Kapourchal SA, Malakouti MJ, Homaee M 2008: Interactive effect of salinity and
two nitrogen fertilizers on growth and composition of sorghum. Plant Soil Environ., 54,
537-546.
Frechilla S, Lasa B, Ibarretxe L, Lamsfus C, Aparicio-Tejo P 2001: Pea responses to saline stress
is affected by the source of nitrogen nutrition (ammonium or nitrate). Plant Growth
Regul., 35, 171-179.
Gazey C, Davis S 2009: Soil acidity: A guide for WA farmers and consultants. Department of
Agriculture and Food, Bulletin 4784,
http://www.agric.wa.gov.au/objtwr/imported_assets/content/lwe/land/acid/liming/bn_
soil_acidity_guide.pdf [Accessed July 2013].
Germer J, Addai S, Sauerborn J 2011: Response of grain sorghum to fertilisation with human
urine. Field Crops Res., 122, 234-241.
Grattan SR, Grieve CM 1999: Salinity - mineral nutrients relations in horticultural crops. Sci.
Hort., 78, 127-157.
Grattan SR, Grieve CM 1992: Mineral element acquisition and growth response of plants
grown in saline environments. Agric. Ecosyst. Environ., 38, 275-300.
Green SM, Machin R, Cresser MS 2008: Effect of long-term changes in soil chemistry induced
by road salt applications on N transformations in roadside soils. Environ. Pollut., 152, 20-
31.
Helder W, De Vries RTP 1983: Estuarine nitrite maxima and nitrifying bacteria (ems-dollard
estuary). Neth. J. Sea Res., 17, 1-18.
Huffman JR 1989: Effects of enhanced ammonium nitrogen availability for corn. J. Agron.
Educ., 18, 93-97.
Irshad M, Yamamoto S, Eneji AE, Endo T, Honna T 2002: Urea and manure effect on growth
and mineral contents of maize under saline conditions. J. Plant Nutr., 25, 189–200.
Irshad M, Eneji AE, Yasuda H 2008: Comparative effect of nitrogen sources on maize under
saline and non-saline conditions. J. Agron. Crop Sci., 194, 256-261.
Jafari MSH, Kafi M, Asteraie A 2009: Interactive effects of NaCl induced salinity calcium and
potassium on physiomorphologic traits of sorghum (Sorghum bicolor L.) Pak. J. Bot., 41,
3053-3063.

Urine as a fertilizer under saline conditions
48
Kant S, Kant P, Lips H, Barak S 2007: Partial substitution of NO3− by NH4+ fertilization
increases ammonium assimilating enzyme activities and reduces the deleterious effects
of salinity on the growth of barley. J. Plant Physiol., 164, 303-311.
Kirchmann H, Pettersson S 1995: Human urine - chemical composition and fertilizer use
efficiency. Fert. Res., 40, 149-154.
Kudoyarova GR, Farkhutdinov RG, Veselov SY 1997: Comparison of the effects of nitrate and
ammonium forms of nitrogen on auxin content in roots and the growth of plants under
different temperature conditions. Plant Growth Regul., 2, 207-208.
Kvarnström E, Emilsson K, Stintzing AR, Johansson M, Jönsson H, Petersens E, Schönning C,
Christensen J, Hellström D, Qvarnström L, Ridderstolpe P, Drangert JO 2006: Urine
diversion: One step towards sustainable sanitation. Stockholm Environmental Institute,
Stockholm, Sweden.
Maranville JW, Clark RB, Ross WM 1980: Nitrogen efficiency in grain sorghum. J. Plant Nutr.,
2, 577-589.
McClung G, Frankenberger WT 1985: Soil nitrogen transformation as affected by salinity. Soil
Sci., 139:405-411.
McCormick RW, Wolf DC 1980: Effect of sodium chloride on CO2 evolution, ammonification,
and nitrification in a sassafras sandy loam. Soil Biol. Biochem., 12, 153-157.
Monaghan RM, Barraclough D 1992: Soil chemical and physical factors affecting the rate and
dynamics of nitrification in urine-affected soil. Plant Soil, 143, 11-18.
Morghan P 2007: Toilets that make compost: Low costs, sanitary toiletsthat produce valuable
compost for crops in an african context. Stockholm Environmental Institute, Sweden.
Morris M, Kelly VA, Kopicki RJ, Byerlee D 2007: Fertilizer use in african agriculture: Lessons
learned and good practice guidelines. The World Bank, Washington, DC.
Nathawat NS, Kuhad MS, Goswami CL, Patel AL, Kumar R 2007: Interactive effects of nitrogen
source and salinity on growth indices and ion content of indian mustard. J. Plant Nutr.,
30, 569-598.
Perveen H, Shahbaz M, Ashraf M 2012: Changes in mineral composition, uptake and use
efficiency of salt stressed wheat (Triticum aestivum L.) plants raised from seed treated
with triacontanol. Pak. J. Bot., 44, 27-35.
Pessarakli M, Tucker TC 1985: Ammonium (15N) metabolism in cotton under salt stress. J.
Plant Nutr., 8:1025-1045.

Urine as a fertilizer under saline conditions
49
Pradhan SK, Holopainen JK, Heinonen-Tanski H 2009: Stored human urine supplemented with
wood ash as fertilizer in tomato (Solanum lycopersicum) cultivation and its impacts on
fruit yield and quality. J. Agric. Food Chem., 57, 7612-7617.
Reddy BVS, Kumar AA, Reddy PS, Ibrahim M, Ramaiah B, Dakheel AJ, Ramesh S,
Krishnamurthy L 2010: Cultivar options for salinity tolerance in sorghum. J. SAT Agric. Res.
8, 1-5, http://ejournal.icrisat.org/volume8/Sorghum_Millets/Cultivar_options.pdf
[Accessed July 2013].
Richards, L.A. (ed.) 1954. Diagnosis and improvement of saline and alkali soils. United States
Department of Agriculture, USDA Handbook, 60. US Government Printing Office,
Washington, DC.
Ryan J, Estefan G, Rashid A (eds.) 2001: Soil and plant analysis laboratory manual. 2nd Edition
ed. International Center for Agricultural Research in the Dry Areas (ICARDA) and the
National Agricultural Research Center (NARC), Aleppo, Syrial.
Silberbush M, Lips SH 1988: Nitrogen concentration, ammonium/nitrate ratio and NaCl
interaction in vegetative and reproductive growth of peanuts. Physiol. Plant., 74, 493-
498.
Sindhu MA, Cornfield AH 1967: Comparative effect of varying levels of chloride and sulphate
sodium, potassium, calcium and magnesium on ammonification and nitrification during
incubation of soil. Plant Soil, 27, 468-472.
Tshivhandekano TR, Lewis OAM 1993: Interactive effect of salinity and two nitrogen fertilizers
on growth and composition of sorghum. S. Afri. J. Bot., 59, 597-601.
Vasilakoglou I, Dhima K, Karagiannidis N, Gatsis T 2011: Sweet sorghum productivity for
biofuels under increased soil salinity and reduced irrigation. Field Crops Res., 120, 38-46.
VDLUFA (ed.) 2009: Handbuch der landwirtschaftlichen Versuchs- und Untersuchungs-
methodik (VDLUF-Methodenbuch), Band VII Umweltanalytik, Methode 2.2.2.6:
Bestimmung von ausgewählten Elementen in pflanzlichem Material und Futtermitteln mit
ICP-OES. VDLUF Verlag, Darmstadt.
Villa-Castorena M, Ulery AL, Catalán-Valencia EA, Remmenga MD 2003: Salinity and nitrogen
rate effects on the growth and yield of chile pepper plants. Soil Sci. Soc. Am. J., 67, 1781-
1789.
Vinnerås B, Nordin A, Niwagaba C, Nyberg K 2008: Inactivation of bacteria and viruses in
human urine depending on temperature and dilution rate. Water Res., 42, 4067-4074.

Urine as a fertilizer under saline conditions
50
World Health Organization 2006: WHO guidelines for the safe use of wastewater, excreta and
greywater. Geneva, Switzerland.
Yadav S, Irfan M, Ahmad A, Hayat S 2011: Causes of salinity and plant manifestations to salt
stress: A review. J. Environ Biol., 32, 667-685.
Zhang H, Raun B (eds.) 2006: Oklahoma soil fertility handbook. 6th ed. Department of Plant
and Soil Sciences, Oklahoma State University, Stillwater, OK, USA.
Zhong H, Lauchli A 1994: Spatial distribution of solutes, K, Na, Ca and their deposition rates in
the growth zone of primary cotton roots: Effect of NaCl and CaCl2. Planta, 195, 34-41.

Urine as a fertilizer under saline conditions
51
4 Effect of NaCl-induced salinity and human urine fertilization on substrate
chemical properties
Open Journal of Soil Science (Accepted: November, 2013)
Michael Yongha Boh1* and Joachim Sauerborn1
1Institute of Plant Production and Agroecology in the Tropics and Subtropics, University of Hohenheim, Garbenstr. 13, 70593 Stuttgart, Germany
*E-mail: [email protected]

Urine as a fertilizer under saline conditions
52
Abstract
We evaluated the effect of NaCl-induced salinity and successive urine fertilization on changes
in cultivation substrate chemical properties in a greenhouse study. The substrate was
composed of an equal volume ratio mixture of bio-waste compost, quartz sand and silty loam
soil. Salinity was imitated by adding NaCl solutions to a known substrate weight achieving
three target salinity treatments of ECe 1.3 (S0 – no NaCl), 4.6 (S1) and 7.6 (S2) dS m-1.
Cultivation substrate had been cropped with two cycles of maize (Zea mays L.) (crop cycles I
and II) and fertilized with human urine at N amounts of 0 (U0 – no urine), 180 (U1) and 360
(U2) mg kg-1 substrate in the first cycle and half of the urine-N dosages in cycle II. Substrate
samples collected at the end of each cycle were analyzed for pHKCl, ECe, exchangeable and
water extractable cations (Na+, K+, Ca2+, Mg2+), cation exchange capacity, water extractable
anions (Cl-, NO3-, SO4
2-, PO43-) and exchangeable sodium percentage (ESP).
Exchangeable Na+, K+ and Ca2+ were significantly (p < 0.05) affected by salinity x urine
interaction. Following an increase in urine application from U0 to U2, ECe significantly
increased by 7.3, 5.3 and 7.6 dS m-1 in the S0, S1 and S2 treatments, respectively, ESP
increased in the order U0 < U1 < U2. Extractable NO3- and Cl- were significantly affected by
crop cycle, salinity and urine interactions (p < 0.05) whereas the effect of urine fertilizer on
extractable SO4- and PO4
3- depended on crop cycle alone. There was a tendency towards
increasing soil sodicity with mounting urine fertilization. The level of NaCl salinity and the
amount of urine applied are important determinants of substrate chemical properties.
Adoption of appropriate management techniques to avoid salinity/sodicity build up should be
included in urine fertilization planning.
Keywords: Soil sodicity, electrical conductivity, urine nitrogen, nutrient recycling

Urine as a fertilizer under saline conditions
53
4.1 Introduction
Soil salt accumulation constitutes a major problem in agricultural production worldwide
(Lobell et al., 2007). Salt affected soils are generally low in available plant nutrients and would
require adequate fertilizer application and management to achieve optimal yields (Hague,
2006; Agarwal and Gupta, 1968). However, for farmers in low income countries, commercial
inorganic fertilizers are too expensive and unaffordable (Morris et al., 2007). The ecological
sanitation (ECOSAN) concept promotes the use of human urine as an alternative plant
fertilizer due to its rich content in readily available plant nutrients (Kirchmann and Pettersson,
1995). Human urine is a multi-component fertilizer containing N, P, K+, S, Ca2+, Mg2+, Na+, Cl-
and other micronutrients in amounts that vary depending on the diet (Münch and Winker,
2009).
Research has shown that by applying human urine as a fertilizer, plant growth and crop yields
were improved (Boh et al., 2013; Morghan, 2007; Pradhan et al., 2010). Concerns regarding
hygienic safety, pharmaceutical residues and hormones have been addressed and guidelines
for a safe use of urine in agriculture are well documented (Jonsson et al., 2004; World Health
Organization, 2006). Na+, Cl- and SO42- are among the most salt-bearing ions in fresh urine and
after storage urine salinity can rise three-fold due to urea degradation (Beler-Baykal et al.,
2011). For this reason, restrictive use of human urine as a fertilizer under saline conditions
has been recommended (World Health Organization, 2006).
Indeed, some researchers have reported an increase in soil salinity resulting from human
urine fertilization and have related a decline in crop growth to urine-induced salinity (Boh et
al., 2013; Mnkeni et al., 2008). In these studies, soil ECe as an index of salinity and pH were
among the main investigated soil parameters. So far, very little attention has been accorded
the effect of human urine fertilizer application on soil chemical properties and it is not clear
how NaCl salinity and urine fertilizer application interaction will affect soil chemical
properties. While salinity is commonly thought of as a problem, Na+ applied with urine can
increase the risk of soil sodicity especially under NaCl saline conditions.
The objective of this study was to assess the effect of NaCl-induced salinity and fertilization
using urine on cultivation substrate cation exchange capacity (CECp), electrical conductivity
(ECe), exchangeable cations, water soluble cations and anions, pHKCl and exchangeable
Urine as a fertilizer under saline conditions
54
sodium percentage (ESP). We hypothesized that i) due to their contents in urine, water
extractable anions and cations and substrate exchangeable cations will increase with
mounting dosages of urine and ii) urine fertilization imposes a risk on soil sodicity which
might increase under NaCl-induced saline conditions. Results from this study should enhance
urine fertilizer management to improve crop yields while being conscious of the risk of soil
degradation.
4.2 Materials and methods
We conducted our investigations on cultivation substrate from two pot experiments carried
out in a greenhouse at the University of Hohenheim, Stuttgart – Germany (48.7114 °N 9.2095
°E). Cultivation substrates had been sown twice with maize (Zea mays L.) and fertilized with
human urine in 2010 and 2011, hereafter, referred to as crop cycle I and crop cycle II,
respectively. The substrate constituted of bio-waste compost, quartz sand and silty loam soil,
homogeneously mixed in a 1:1:1 volume ratio to improve organic matter content and to
enhance nutrients availability (Boh et al. 2013). Substrate samples from the homogenous
mixture were taken and analyzed for chemical properties (Table 4.1). For both crop cycles,
the experimental factors were salinity and nitrogen applied as urine. Salinity was imitated by
adding NaCl solutions to the cultivation substrate. The amount of salt solution to be added
was determined in a calibration study whereby different volumes of NaCl solution were
added to known weights of cultivation substrate, incubated for 72 hours and their electrical
conductivities measured from a saturated paste extract (ECe) according to Richards (1954).
Targeted NaCl-salinity treatments achieved were ECe 1.3 (S0 – no NaCl added), 4.6 (S1) and
7.6 (S2) dS m-1.
Table 4.1 Chemical composition of untreated substrate at the beginning of the experiment
Element Soil substrate
Total N (%) 0.1±0.0§
Total Corg (%) 1.6±0.1 Exchangeable Ca
2+ (cmolc kg
-1) 13.7±0.6
Exchangeable Mg2+
(cmolc kg-1
) 1.9±0.0 Exchangeable K
+ (cmolc kg
-1) 0.9±0.0
Exchangeable Na+ (cmolc kg
-1) 0.5±0.0
CECp (cmolc kg-1
) 14.1±1.3 ESP (%) 0.1±0.0 Water extractable SO4
2- (mg kg
-1) 112.3±9.5
Cl- (mg kg
-1) 25.2±3.0
Bray II-P (mg kg-1
) 58.6±1.3 ECe (dS m
-1) 1.3±0.4
pHKCl 7.2±0.3 §Values are means ± standard deviation (n = 4)
Urine as a fertilizer under saline conditions
55
Urine was collected from male and female students in a hostel of the University of
Hohenheim, Stuttgart in April 2009 and stored in an air-tight container at mean daily
temperatures of 25±2 °C for 12 months before usage. This duration and temperature were
according to Vinnerås et al. (2008) sufficient for inactivation of bacteria and viruses. Prior to
application, the urine container was thoroughly shaken and samples taken for chemical
analyses. At first crop fertilization (crop cycle I), urine contained 8.4 g total N (mainly NH4+
and NH3), 1.42 g K (as K2O), 0.49 g P (as P2O5), 0.35 g Ca2+, 0.53 g Mg2+, 2.70 g Na+, 3.37 g Cl-
and 2.3 g S (as SO4) l-1. Total nitrogen content in urine decreased by 29 % before the start of
crop cycle II in 2011 assumingly due to volatilization losses.
For crop cycle I, 12 kg of the prepared soil substrate was filled into 10 l Mitscherlich pots,
sown with maize (cv. Okomasa) seeds and fertilized with urine. Urine treatments were 0 (U0)
180 (U1) and 360 (U2) mg urine-N kg-1 substrate. P and K in the substrate were augmented by
adding mono potassium phosphate in amounts equivalent to 39 mg PO43- and 47 mg K2O kg-1
substrate. Eight replications of the 3 x 3 salinity urine-N factorial combinations were arranged
in a completely randomized block design. This experiment was terminated at the onset of
tasseling. Plant biomass (root and shoot) was harvested, substrate from each pot was hand-
crushed and samples collected for chemical analyses.
Eleven kilograms of the homogenized cultivation substrate was refilled into the Mitscherlich
pots for the second crop (crop cycle II). Cultivation substrates were not treated with NaCl any
further and salinity remained at levels induced initially or as influenced by urine fertilization
at the end of crop cycle I. Maize was sown as a second crop and substrates fertilized with half
as much urine-N as used in crop cycle I. Urine dosages were 0 (U0), 90 (U1) and 180 (U2) mg
N kg-1 substrate. Experimental design was the same as in crop cycle I except that there were 4
replications per treatment. Whole plant (root and shoot) biomass was harvested at tasseling
and substrates from each pot was hand-crushed, homogeneously mixed and samples also
taken for chemical analyses.
Substrate samples collected at the end of both trials were air-dried and sieved through a 2
mm merge. Water soluble cations (Na+, K+, Ca2+, Mg2+) and anions (Cl-, NO3-, SO4
2-, PO43-) were
measured from a 1:5 substrate:water extract after shaking 4 g of air-dried soil substrate end-
over-end in 20 ml deionized water for 1 hour and centrifuged for 10 minutes at 2500 rpm.
The concentrations of soluble Na+, K+ and Ca2+ in the extract were measured by flame

Urine as a fertilizer under saline conditions
56
photometry while Mg2+ was measured by atomic absorption spectrophotometry (AAS). Water
soluble anions were measured by ion chromatography [861 Advanced Compact IC with
Metrohm Suppressor Module II (MSM II) and 853 Metrohm CO2 Suppressor (MCS), Metrohm
Ltd, Switzerland]. Substrate pH was measured in 1 M KCl with a glass electrode using a 1:5
substrate:solution suspension according to standard procedure. Electrical conductivity (ECe)
was measured by same method as mentioned above.
4.2.1 Exchangeable cations and cation exchange capacity (CECp)
Exchangeable cations and potential cation exchange capacity (CECp) were measured using a
modified BaCl2 and MgCl2 method described in Hendershot and Duquette (1986). Five grams
of air-dried substrate samples were weighed into 50 ml centrifuge tubes. Three centrifuge-
washing steps were carried out as follows: 25 ml of 0.1 M BaCl2-triethanolamine solution was
added to the substrate in the centrifuge and tubes were shaken on an orbital shaker for 10
min and centrifuged at 2500 rpm for 10 min. The clear supernatant solution was filled into
100 ml volumetric flask after each washing step. After the last washing, the volumetric flask
was filled to exactly 100 ml with deionised water, hand-shaken and filtered through ash-free
Whatman filter paper N° 42 (Macherey-Nagel GmbH & Co., Germany). The solution was
collected in PE-bottles for measurement of exchangeable Na+, K+, Ca2+ and Mg2+.
Substrates were washed twice with deionised water and decant discarded. Three centrifuge-
washing steps with 25 ml of 0.15 M MgCl2 solution was carried out following the same
procedure as described for BaCl2 above. At the end, the filtrate was collected in PE-bottles for
measurement of exchangeable Ba2+. CECp was calculated after accounting for the dilution
caused by entrained BaCl2 solution using the formula:
CECp = [C (Ba2+)*z*VExtr.] / [W*M (Ba)];
Where, CECp is potential cation exchange capacity (mmolc kg-1), C(Ba2+) is Ba2+ concentration
in the extract (mg l-1), z is the valence of Ba2+ (2), VExtr. is the volume of the extraction solution
(ml), W is the weight of the soil and M(Ba) is the molar mass of Ba2+ (g mol-1).
Exchangeable Na+, K+, Ca2+ and Ba2+ were measured by flame photometry and Mg by AAS. As
an index of sodicity, exchangeable sodium percentage (ESP) was calculated according to
Seilsepour et al. (2009) using the formula:
ESP = (Na+/CECp)*100;

Urine as a fertilizer under saline conditions
57
Where, Na+ is the measured exchangeable sodium in cmolc kg-1 and CECp is cation exchange
capacity in cmolc kg-1.
4.2.2 Data analyses
Data were analysed using the SAS statistical software (SAS Institute version 9.3). The effect of
crop cycle, salinity and urine fertilization on pHKCl, ECe, water extractable and exchangeable
Na+, K+, Ca2+ and Mg2+, water soluble anions, CECp and ESP were assessed using the GLM
procedure for analysis of variance (ANOVA). The three main factors crop cycle, salinity, urine
fertilization and their interactions were considered statistically significant at p ≤ 0.05 level of
probability. When the three-way interactions were not statistically significant, data were
pooled for two- or one-way ANOVA. The data for water extractable cations, anions and CECp
were log-transformed while the data for exchangeable Na+ was square root-transformed for
statistical calculations. Where ANOVA indicated significant differences, mean differences
between treatments were compared using the adjusted Tukey-Kramer post-hoc test.
4.3 Results
4.3.1 Effect of crop cycle, salinity and urine treatment on substrate pHKCl
Substrate pHKCl was significantly affected by crop cycle x salinity (F = 3.54; p = 0.034), crop
cycle x urine fertilization (F = 8.47; p = 0.0005) and salinity x urine fertilization (F = 12.28; p <
0.0001) interactions. Though substrate pHKCl was generally higher at the end of the crop cycle
II, there was no significant salinity or urine application effect. At the end of crop cycle I,
substrate pHKCl units significantly decreased from 6.8 (U0) to 6.6 (U2) in the S1 and from 6.8
(U0) to 6.4 (U2) in the S2 treatments (Table 4.2).
4.3.2 Effect of crop cycle, salinity and urine fertilization on exchangeable cations, ECe,
CECp and ESP
There was no significant crop cycle, salinity and urine interaction effect on exchangeable
cations, CECp and ESP (p > 0.05). Exchangeable Na+, K+ and Ca2+ were significantly affected by
urine x salinity interactions (Figure 4.1A, B and C). Compared to the unfertilized treatment
(U0), average substrate exchangeable Na+ increased by 33.6 (U1) and 76.6% (U2) in the S0
treatment (Figure 4.1A). Furthermore, a 62% increase in average exchangeable Na+ was
measured as urine fertilization amount was raised from U1 to U2. In the S1 treatment, an
11.3% significant increase in mean exchangeable Na+ content was measured following the
application of U2 compared to U0. Though there was a tendency towards an increase in mean

Urine as a fertilizer under saline conditions
58
exchangeable Na+ in the S2 treatment as the amount of applied urine rose, the effect was not
statistically significant.
Table 4.2 Effect of crop cycle (cycle I and II), NaCl salinity level (S0, S1 and S2) and urine fertilization (U0, U1 and U2) on selected water extractable ions
Crop cycle
NaCl Salinity level
Urine treatment
Water extractable ions
logK+
(mg kg-1
) logMg
2+
(mg kg-1
) logCa
2+
(mg kg-1
) logCl
-
(mg kg-1
) logNO3
-
(mg kg-1
)
pHKCl
S0 U0 3.4±0.05de 3.2±0.04fg 4.8±0.14hij 2.3±0.10j 2.7±0.13h 6.7efg U1 3.3±0.02de 3.4±0.06ef 5.0±0.14fgh 3.7±0.07h 5.1±0.14f 6.8c-g U2 3.4±0.04de 3.8±0.03cd 5.40±12de 4.8±0.06g 6.4±0.08bc 6.7g S1 U0 3.3±0.04de 3.3±0.03f 5.0±0.12hi 6.1±0.03ef 4.2±0.09g 6.8b-e Cycle I U1 3.5±0.06de 3.6±0.06de 5.2±0.17efg 6.3±0.05de 5.7±0.18de 6.8c-g U2 3.9±0.03b 4.0±0.04ab 5.8±0.14bc 6.5±0.03cd 6.8±0.07ab 6.6g S2 U0 3.5±0.06dc 3.6±0.05d 5.3±0.21de 7.0±0.06ab 5.3±0.11ef 6.8b-f U1 3.8±0.03bc 3.9±0.06bc 5.6±0.18cd 7.0±0.05ab 6.2±0.12cd 6.7d-g U2 4.2±0.06a 4.3±0.07a 6.0±0.15a 7.2±0.06a 7.2±0.10a 6.4h S0 U0 3.1±0.11ef 3.0±0.01gh 4.7±0.03hij 2.9±0.10i 2.4±0.07h 6.9a-d U1 2.7±0.05g 2.9±0.02h 4.7±0.06j 3.1±0.06i 2.3±0.09h 6.9abc U2 2.9±0.09fg 2.9±0.08h 4.9±0.07hij 4.4±0.11g 4.8±0.04fg 7.0ab Cycle II S1 U0 2.8±0.09fg 2.9±0.07gh 4.6±0.11j 5.8±0.03f 2.5±0.21h 7.0a U1 2.8±0.06fg 3.0±0.03gh 4.7±0.09hij 6.1±0.03ef 2.3±0.00h 7.1a U2 2.9±0.09fg 3.1±0.05fgh 5.0±0.10fgh 6.1±0.02def 2.5±0.06h 7.1a S2 U0 2.8±0.11fg 3.3±0.01fg 5.0±0.03ghi 6.9±0.01ab 2.3±0.00h 7.1a U1 2.7±0.12g 3.1±0.06gh 4.8±0.18hij 6.7±0.10bc 2.1±0.14h 7.1a U2 4.0±0.07ab 4.1±0.10abc 6.0±0.23ab 7.0±0.05ab 7.0±0.13ab 6.8b-g
Different lowercase letters within the same column indicate significant differences at p ≤ 0.05, according to Tukey-Kramer adjusted test.
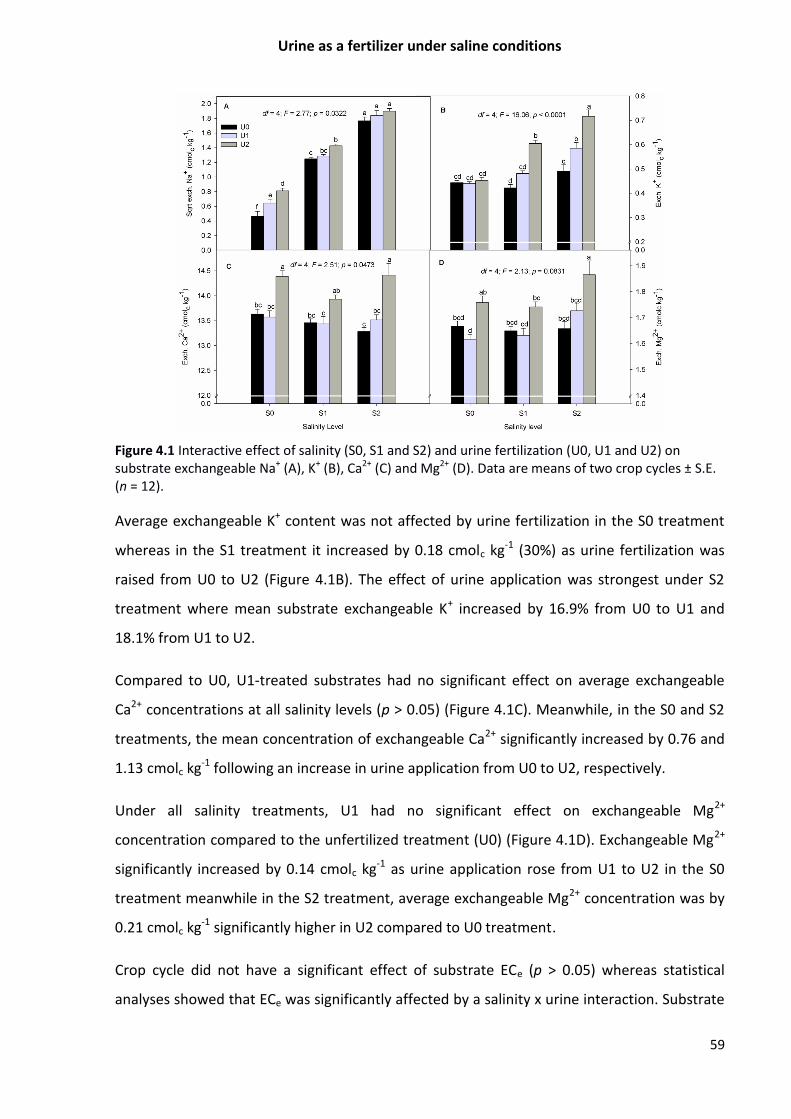
Urine as a fertilizer under saline conditions
59
Figure 4.1 Interactive effect of salinity (S0, S1 and S2) and urine fertilization (U0, U1 and U2) on substrate exchangeable Na+ (A), K+ (B), Ca2+ (C) and Mg2+ (D). Data are means of two crop cycles ± S.E. (n = 12).
Average exchangeable K+ content was not affected by urine fertilization in the S0 treatment
whereas in the S1 treatment it increased by 0.18 cmolc kg-1 (30%) as urine fertilization was
raised from U0 to U2 (Figure 4.1B). The effect of urine application was strongest under S2
treatment where mean substrate exchangeable K+ increased by 16.9% from U0 to U1 and
18.1% from U1 to U2.
Compared to U0, U1-treated substrates had no significant effect on average exchangeable
Ca2+ concentrations at all salinity levels (p > 0.05) (Figure 4.1C). Meanwhile, in the S0 and S2
treatments, the mean concentration of exchangeable Ca2+ significantly increased by 0.76 and
1.13 cmolc kg-1 following an increase in urine application from U0 to U2, respectively.
Under all salinity treatments, U1 had no significant effect on exchangeable Mg2+
concentration compared to the unfertilized treatment (U0) (Figure 4.1D). Exchangeable Mg2+
significantly increased by 0.14 cmolc kg-1 as urine application rose from U1 to U2 in the S0
treatment meanwhile in the S2 treatment, average exchangeable Mg2+ concentration was by
0.21 cmolc kg-1 significantly higher in U2 compared to U0 treatment.
Crop cycle did not have a significant effect of substrate ECe (p > 0.05) whereas statistical
analyses showed that ECe was significantly affected by a salinity x urine interaction. Substrate

Urine as a fertilizer under saline conditions
60
ECe significantly increased by 7.3 (83%), 5.3 (52%) and 7.6 (49%) dS m-1 as urine fertilization
rose from U0 to U2 in the S0, S1 and S2 salinity levels, respectively (Table 4.3).
Table 4.3 Interactive effect of NaCl salinity (S0, S1, S2) and urine fertilizer treatment (U0, U1, U2) on substrate electrical conductivity (ECe)
NaCl-salinity treatment Urine treatment ECe (dS m-1
)
U0 1.5±0.2f S0 U1 4.9±0.3e U2 8.8±0.5bc U0 4.8±0.1e S1 U1 7.9±0.1cd U2 10.1±0.2b U0 7.8±0.3cd S2 U1 9.8±0.1b U2 15.4±0.7a
Values are means ± S.E. (n = 12). Different lowercase letters indicate significant differences at p ≤ 0.05 (Tukey-Kramer adjusted test)
There was a tendency towards an increase in CECp with mounting urine application at all NaCl
treatment levels (Figure 4.2A). However, the effect of urine fertilization was only significant
with the application of U2 which resulted in an increase in CECp from 15.9 (U0) to 17.8 (U2)
cmolc kg-1 in the S0 and from 18.6 (U0) to 20.6 (U2) cmolc kg-1 in the S2 treatment.
Additionally, CECp was by 1.4 cmolc kg-1 significantly higher in the U2 compared to U1-
fertilized soils in the S2 treatment.

Urine as a fertilizer under saline conditions
61
Figure 4.2 Interactive effect of salinity (S0, S1 and S2) and urine fertilization (U0, U1 and U2) on substrate A) cation exchange capacity, B) Exchangeable sodium percentage and C) water extractable Na+. Data are means of two crop cycle ± S.E. (n = 12).
As expected, ESP increased as salinity level rose but the effect of urine fertilization on ESP was
significant only in the untreated substrate (Figure 4.2B). Compared to U0 in the S0 treatment,
ESP rose by 1.6 (U1) and 6.9 (U2) representing a 46 and 78% increase.

Urine as a fertilizer under saline conditions
62
4.3.3 Effect of crop cycle, salinity and urine fertilization on water extractable cations
There was no significant interaction effect of crop cycle x salinity treatment x urine
fertilization on water extractable Na+. Meanwhile, the interaction effect of NaCl treatment
and urine application on mean water extractable Na+ was significant (Figure 4.2C) (p < 0.05).
Our data showed that the effect of urine fertilization was strongest in the S0 treatment where
extractable Na+ rose by 59.3 (U1) and 66.8% (U2) compared to U0 treatment. In the S1 and S2
treatments, the application of U2 increased mean extractable Na+ by 25.7 and 19.2%
compared to the U0 treatment.
ANOVA results showed that water extractable K+, Mg2+ and Ca2+ were significantly affected by
crop cycle, salinity treatment and urine fertilization interactions (p < 0.05) (Table 4.2). With
the exception of S0:U0 and S2:U2 treatment variants extractable K+ was higher in cycle I than
in cycle II (Table 4.2). In cycle I, urine application significantly raised extractable K+ from 26.2
mg kg-1 (U0) to 47.5 mg kg-1 substrate (U2) and from 33.8 (U0) to 66.6 mg kg-1 substrate (U2)
in the S1 and S2 treatments, respectively. Meanwhile, in cycle II average extractable K+
decreased by 22.9% from 23.1 (U0) to 17.8 mg kg-1 substrate (U1) in the S0 treatment. At the
end of cycle II, there was no significant urine fertilization effect on extractable K+ content in
S1 whereas in the S2 treatment it was higher by 69.9% in U0 compared to U2 treatment.
Average water extractable Mg2+ content was significantly affected by crop cycle x salinity
treatment x urine interaction (F = 3.41; p = 0.0123). Extractable Mg2+ was generally higher in
crop cycle I compared to cycle II and increased with mounting urine application at all salinity
levels (Table 4.2). In cycle I, compared to U0 mean extractable Mg2+ content under U2
fertilization rose by 48.3, 50.1 and 46.0% in the S0, S1 and S2 treatments, respectively. In
cycle II, whereas urine fertilization did not affect extractable Mg2+ concentration in the S0 and
S2 treatments, extractable Mg2+ concentration more than doubled in the S2 treatment as
urine fertilization was raised from U0 to U2 and U1 to U2.
Similarly, water extractable Ca2+ increased as urine application amount rose in crop cycle I
with significantly higher mean values for U2 compared to U0 under all salinity treatments
(Table 4.2). Mean extractable Ca2+ was by 107.6, 176.8 and 220.3 mg kg-1 substrate higher in
U2 than U0 in the S0, S1 and S2 treatments, respectively. Meanwhile, at the end of cycle II the
effect of urine application was only significant with U2 application in the S2 treatment.

Urine as a fertilizer under saline conditions
63
4.3.4 Effect of crop cycle, salinity and urine fertilization on water extractable anions
Our data further showed that water extractable Cl- and NO3- were significantly affected by
crop cycle, salinity and urine interactions (p < 0.05). At the end of cycle I, water extractable Cl-
increased by 87.9 and 28.9% as urine application rose from U0 to U2 in the S0 and S1
treatments, respectively. Extractable Cl- also increased from 17.6 (U0) to 86.1 mg kg-1 of
substrate (U2) in the S0 treatment at the end of crop cycle II. No significant changes due to
urine application were observed in the S1 and S2 treatments at the end of cycle II.
There was a significant crop cycle x salinity x urine interaction effect on water extractable
NO3- (F = 6.35; p = 0.0002). Soil nitrate was generally lower at the end of cycle II compared to
cycle I and the effect of urine application on extractable NO3- was stronger at the end of cycle
I compared to cycle II (Table 4.2). At the end of cycle I, extractable NO3- increased in the order
of U0 < U1 < U2 regardless of salinity level. Meanwhile in cycle II, the effect of urine
application was significant only at highest urine application (U2) in the S0 and S2 treatments.
As shown by our data in Figure 4.3A, mean water extractable SO42- was not affected by any
interactions but the main factors (crop cycle and urine application) were significant.
Compared to the unfertilized treatments (U0), SO42- content increased by 19.5 (U1) and 32.5%
(U2) in cycle I. Like in cycle I, SO42- content tended to increase with mounting urine
application in cycle II though the effect became significant (19.9% increase) only with the
application of U2 compared to the unfertilized treatment.
Figure 4.3 Effect of crop cycle (cycle I, II) and urine fertilization (U0, U1 and U2) on substrate extractable A) SO4
2- and B) PO43-. Data are means ± S.E. (n = 12: cycle I; n = 24: cycle II). Significant
differences (p < 0.05) between treatments are indicated by small case letters.
A significant crop cycle x urine fertilizer interaction affected average water extractable PO43-
content (Figure 4.3B). In cycle II, water extractable PO43- significantly increased from 48.9

Urine as a fertilizer under saline conditions
64
(U0) to 53.0 mg kg-1 substrate (U1) but a higher dose of urine did not have a significant effect
on PO43-. In contrast, PO4
3- was not affected by urine rates in the cycle I.
4.4 Discussion
This paper reports the interactive effect of urine fertilization and NaCl-induced salinity on
changes in substrate chemical properties under controlled greenhouse conditions. Of the
changes that affect soil chemical properties, pH is considered very important as it influences
the availability of plant nutrients (Bagayoko et al., 2000). At the end of cycle I, a slight
decrease in substrate pHKCl at higher urine application in S1 and S2 treatments can be
associated with nitrification and the release of H+. This effect was only temporal and by the
end of cycle II substrate pHKCl increased and the effect of urine fertilization was no longer
significant. Fluctuating pH resulting from urine deposition in pasture lands has also been
reported by Haynes and Williams (1992) while Hoglund (2001) has argued that the net effect
of urine fertilizer on soil pH is small due to the release of hydroxides when plants take up the
supplied N in the form of nitrate ions.
Our results showed that substrate ECe rose as urine fertilizer amount increased in agreement
with earlier research findings (Beler-Baykal et al., 2011; Boh et al., 2013; Mnkeni et al., 2008).
As urine is inherently saline, high dosages of urine entailed higher amount of salts added to
the cultivation substrate. Although under field conditions leaching of salts from the soil may
occur due to precipitation, the high electrical conductivities resulting from the application of
urine in our experiments suggests that in the long term salt build up may occur even in fields.
To prevent soils degradation due to urine-induced salinity, salinity management measures
should be included in urine fertilization programs. Mnkeni et al. (2008) have suggested that a
well-adapted crop rotation system with salt-tolerant varieties and halophytic vegetables
might reduce the potential risk of an eventual salt build resulting from urine fertilization.
The application of ammoniacal N fertilizer has been shown to cause a decrease in soil
exchangeable Ca2+, Mg2+ and cation exchange capacity due to leaching losses (Barak et al.,
1997). Increased exchangeable Ca2+, Mg2+ and K+ observed in our study resulted from their
addition through urine and were expected as leachate was returned to the substrate
throughout the experiments. An increase in soil cations due to urine fertilization has also
been reported in field trials (AdeOluwa and Cofie, 2012; Germer et al., 2011). The high

Urine as a fertilizer under saline conditions
65
content of water extractable Ca2+ and Mg2+ in the substrate at the end of crop cycle I due to
urine fertilization represent the portion of these cations that can potentially be leached from
the soil profile. However, if they are not leached as was the case in our experiments these
nutrient cations can become available to the second crop or next season. Reduction in water
soluble Ca2+ and Mg2+ at the end of crop cycle II can partly be explained by their precipitation
in the soil solution in agreement with Miyazawa et al. (2001).
Generally, the concentration of Na+ in urine is manifold higher than that of Ca2+ and Mg2+ and
therefore, requires attention in urine fertilizer planning especially under saline conditions.
Although Na+ is noted for its functional role as a plant nutrient, high concentrations in the
growing medium promotes competition with K+, Ca2+ and Mg2+ that can result in toxic
concentrations in plant tissue (Brown et al., 2006; Grattan and Grieve, 1999; Subarao et al.,
2003). The N to Na+ mass-ratio of the urine used in this study was 3.1:1 but decreased to
2.2:1 following N losses from urine prior to the start of crop cycle II. The risk of raising Na+
supply through urine application increases with N losses and should be prevented. This is
because more urine will have to be applied if the N content is lowered. Lower N to NaCl mass
ratio for urine collected in Ghana has been reported by Germer et al. (2011). Therefore, the
increase in exchangeable and water extractable Na+ with mounting urine application was no
surprise. Haynes and Williams (1992) reported an increase in the concentrations of
exchangeable K+ and Na+ in pasture land due to sheep urine application. It was notable that in
the S2 treatment, the effect of urine fertilization on exchangeable Na+ concentration was
masked by the high content of Na+ in the soil substrate solution which is related to the use of
NaCl to induce salinity. This suggests that there is a critical limit to the effect of Na+ supplied
through urine on the concentration of exchangeable Na+ in a NaCl-dominated soil substrate.
However, this critical limit cannot be determined from our study and would require further
investigation.
In this study, it was also expected that due to the high concentration of Na+ compared to Ca2+
and Mg2+, urine fertilization will increase sodicity with a more severe effect in the NaCl-
treated substrates. According to Abrol et al. (1988) an ESP of 15% and a pH greater than 8.5
are critical for soils to be classified as sodic or saline-sodic if in addition ECe is greater than 4
dS m-1. Our results showed that though in the S0 treatment ESP increased as the amount of
urine fertilizer rose, the effect of urine fertilization became less important in the S1 (ECe 4.6

Urine as a fertilizer under saline conditions
66
dS m-1) and S2 (ECe 7.6 dS m-1) treatments due to the dominating effect of Na+ added through
NaCl. Besides, as noted above, overall substrate pHKCl remained below 8.5. In spite of the
amount of Na+ added through urine it is clear from our results that salinity is of greater
concern than sodicity.
Results of this study suggest that Cl- content of urine fertilizer is an important factor in
determining the concentration of Cl- in the soil. Chloride is generally considered as an
essential micronutrient; however, excessive supply of Cl- can have a toxic effect on plant
growth (White and Broadley, 2001). Therefore regulations for the application of urine
fertilizers should consider the risk of elevated chloride levels that may cause toxicity in plants
(Tavakkoli et al., 2010).
The increase in substrate SO42- with mounting urine application was expected due to the high
concentration of SO42- in urine. Of the secondary nutrients contained in urine, SO4
2- had the
highest concentration and can therefore be used to correct S deficiency. However, in areas
where precipitation is high, the leaching of SO42- supplied through urine can become an
important concern and should be considered in urine fertilization planning.
Phosphate concentration was not affected by urine application in crop cycle I probably due to
the basal application. The significant decrease in substrate PO43- at the end of crop cycle II is
due to plant uptake and precipitation (Wandruzska, 2006). Meanwhile, higher concentration
of PO43- in urine treated substrate is related to addition through urine.
Our results showed an increase in substrate NO3- as urine application amount rose which is in
agreement with the findings of Decau et al. (2004) and Williams et al. (1998) who measured
high concentrations of soil NO3- in grasslands following urine deposition from cattle. Once
applied to the soil urine-N undergoes different changes. Ammonium which is the major form
of N in stored urine is either taken up directly by plants or nitrified to NO3- which is also an
available form for plant uptake. Some of the NO3- can be taken up by microorganisms
(immobilization) or microbially reduced (de-nitrification) to produce gaseous nitrogen that is
eventually lost from the soil through volatilization. In a lysimeter study, Di and Cameron
(2007) measured significant NO3--N leaching losses as the amount of urine-N application
increased. No N losses in our experiment can be attributed to leaching as leachate was
returned to the respective pots. Therefore, lower substrate NO3- concentration measured in

Urine as a fertilizer under saline conditions
67
our substrates at the end of the cycle II can be explained by immobilization or volatilization
losses. The significantly high substrate NO3- concentration in the S2:U2 treatment variant in
both cropping cycles can be attributed to the plant’s inability to take up supplied nitrogen
due to high salinity (Bowman et al., 2006; Ward et al., 1986).
As pot sizes and the artificial environment under which these investigations were carried out
are limiting, our results are meant to present a snapshot of the changes in soil chemical
properties that may result from urine fertilization at different level of NaCl salinity. An
understanding of the changes imposed by urine fertilization on soil chemical properties under
saline conditions is important for urine fertilization planning and management.
4.5 Conclusion
The potential of urine to cause an increase in exchangeable Ca2+ and Mg2+ depends on the
amount of urine applied regardless of NaCl concentration level. An average urine dosage of
270 mg kg-1 substrate over two crop cycles can increase soil ECe by up to 3.5-folds
representing a severe salinity risk if urine is used to fertilize potted plants. In confirmation
with our hypothesis, urine fertilization induced an increase in substrate exchangeable Na+
content and ESP under non-saline conditions (ECe 1.3 dS m-1) but the perceived effect under
NaCl treatments was minimal. However, regularly monitoring salinity and/or sodicity build up
and adopting appropriate management strategies must also be thought of during urine
fertilizer planning. To develop a guideline for urine use under saline conditions, a long term
investigation on urine x salinity interaction under field conditions would be necessary.
4.6 Acknowledgement
This study was partly supported by a scholarship from the Catholic Academic Exchange
Service (KAAD), Germany. The authors are also grateful for the laboratory support of Mrs.
Beate Podtschaske and Mrs. Helene Ochott.
4.7 References
Abrol, I.P., J.S.P. Yadav and F.I. Massoud (eds.) 1988. Salt-affected soils and their
management. Soil Bulletin 39 ed. Food and Agricultural Organization of the United
Nations, Rome. Italy.
Urine as a fertilizer under saline conditions
68
AdeOluwa, O.O. and O. Cofie. 2012. Urine as an alternative fertilizer in agriculture: Effects in
amaranths (Amaranthus caudatus) production. Renewable Agriculture and Food Systems
27:287-294.
Agarwal, R.R. and Gupta, R.N. 1968. Saline-alkali soils in India. Technical Bulletin 15
(Agricultural Series), Indian Council of Agricultural Research, New Delhi. India.
Bagayoko, M., S. Alvey, G. Neumann and A. Buerkert. 2000. Root-induced increases in soil pH
and nutrient availability to field-grown cereals and legumes on acid sandy soils of
sudano-sahelian west africa. Plant and Soil 225:117-127.
Barak, P., B.O. Jobe, A.R. Krueger, L.A. Peterson and D.A. Laird. 1997. Effect of long-term soil
acidification due to nitrogen fertilizer inputs. Plant and Soil 197:61-69.
Beler-Baykal, B., A.D. Allar and S. Bayram. 2011. Nitrogen recovery from source-separated
human urine using clinoptilolite and preliminary results of its use as fertilizer. Water
Science and Technology 63:811-817.
Boh, M.Y., T. Müller and J. Sauerborn. 2013. Maize (Zea mays L.) response to urine and wood
ash fertilization under saline (NaCl) soil conditions. International Journal of AgriScience
3:333-345.
Bowman, D.C., G.R. Cramer and D.A. Devitte. 2006. Effect of salinity and nitrogen status on
nitrogen uptake on tall fescue turf. Journal of Plant Nutrition 29:1481-1490.
Brown, C.E., S.R. Pezeshki and R.D. DeLaune. 2006. The effects of salinity and soil drying on
nutrient uptake and growth of Spartina alterniflora in a simulated tidal system.
Environmental Experimental Botany 58:140-148.
Decau, M.L., J.C. Simon and A. Jacquet. 2004. Nitrate leaching under grassland as affected by
mineral nitrogen fertilization and cattle urine. Journal of Environmental Quality 33:637-
644.
Di, H.J. and K.C. Cameron. 2007. Nitrate leaching losses and pasture yields as affected by
different rates of animal urine nitrogen returns and application of a nitrification inhibitor
– a lysimeter study. Nutrient Cycling in Agroecosystems 79:281-290.
Fox, T.R. 2004. Nitrogen mineralization following fertilization of douglas-fir forests with urea
in western washington. Soil Science Society of America Journal 64:1720-1728.
Germer, J., S. Addai and J. Sauerborn. 2011. Response of grain sorghum to fertilisation with
human urine. Field Crops Research 122:234-241.

Urine as a fertilizer under saline conditions
69
Grattan, S.R. and C.M. Grieve. 1999. Salinity - mineral nutrients relations in horticultural
crops. Scientia Horticulturae 78:127-157.
Hague, S.A. 2006. Salinity problems and crop production in coastal regions of Bangladesh
Pakistan Journal of Botany 38:1359-1365.
Haynes, R.J. and P.H. Williams. 1992. Changes in soil solution composition and pH in urine-
affected areas of pasture. Journal of Soil Science 43:323-334.
Hendershot, W.H. and M. Duquette. 1986. A simple barium chloride method for determining
cation exchange capacity and exchangeable cations. Soil Science Society of America
Journal 50:605-608.
Hoglund, C. 2001. Evaluation of microbial health risks associated with reuse of source
separated human urine. PhD thesis. Royal Institute of Technology, Stockholm, Sweden.
Jonsson, H., A.R. Stintzing, B. Vinnerås and E. Salomon. 2004. Guidelines on the use of urine
and feaces in crop production. Stockholm Environmental Institute (SEI), Stockholm,
Sweden.
Kirchmann, H. and S. Pettersson. 1995. Human urine - chemical composition and fertilizer use
efficiency. Fertilizer Research 40:149-154.
Lobell, D.B., J.I. Ortiz-Monsterio, F.C. Gurrola and L. Valenzuuela. 2007. Identification of saline
soils with multiyear remote sensing of crop yields. Soil Science Society of America Journal
71:777-783.
Miyazawa, M., M.A. Pavan, C.O. Ziglio and J.C. Franchini. 2001. Reduction of exchangeable
calcium and magnesium in soil with increasing pH. Brazilian Archives of Biology and
Technology 44:149-153.
Mnkeni, P.N.S., F.R. Kutu, P. Muchaonyerwa and L.M. Austin. 2008. Evaluation of human urine
as a source of nutrients for selected vegetables and maize under tunnel house conditions
in the eastern cape, south africa. Waste Management Research 26:132-139.
Morghan, P. 2007. Toilets that make compost: Low costs, sanitary toiletsthat produce
valuable compost for crops in an african context. Stockholm Environmental Institute,
Sweden.
Morris, M., V.A. Kelly, R.J. Kopicki and D. Byerlee. 2007. Fertilizer use in african agriculture:
Lessons learned and good practice guidelines. The World Bank, Washington DC. USA
Münch, E. and M. Winker. 2009. Technology review, urine diversion components overview of
urine diversion components such as waterless urinals, urine diversion toilets, urine

Urine as a fertilizer under saline conditions
70
storage and reuse systems. Deutsche Gesellschaft für Internationale Zusammenarbeit
(GIZ) GmbH Eschborn, Germany.
Pradhan, S., J.K. Holopainen, J. Weisell and H. Heinonen-Tanski. 2010. Human urine and wood
ash as plant nutrients for red beet (Beta vulgaris) cultivation: Impacts on yield quality.
Journal of Agricultural and Food Chemistry 58:2034-2039.
Richards, L.A. (ed.) 1954. Diagnosis and improvement of saline and alkali soils. United States
Department of Agriculture, Washington DC. USDA Agricultural Handbook, 60.
Ritchey , K.D., D.G. Boyer, K.E. Turner and J.D. Snuffer. 2008. Goat urine and limestone affect
nitrogen and cation distributions in an acidic grassland. Soil Science Society of America
Journal 72:626-633.
Seilsepour, M., M. Rashidi and B.G. Khabbaz. 2009. Prediction of soil exchangeable sodium
percentage based on soil sodium adsorption ratio. American-Eurasian Journal of
Agriculture and Environmental Science 5:1-4.
Subarao, G.V., O. Ito, W.L. Berry and R.M. Wheeler. 2003. Sodium - A functional plant
nutrient. Critical Reviews in Plant Sciences 22:391-416.
Tavakkoli, E., P. Rengasamy and G.K. McDonald. 2010. High concentrations of Na+ and Cl– ions
in soil solution have simultaneous detrimental effects on growth of faba bean under
salinity stress. Journal of Experimental Botany 61:4449-4459.
Vinnerås, B., A. Nordin, C. Niwagaba and K. Nyberg. 2008. Inactivation of bacteria and viruses
in human urine depending on temperature and dilution rate. Water Research 42:4067-
4074.
Wandruzska, R. 2006. Phosphorus retention in calcareous soils and its effect on organic
matter and its mobility. Geochemical Transactions 7:1-8.
Ward, M.R., M. Aslam and R.C. Huffaker. 1986. Enhancement of nitrate uptake and growth of
barley seedlings by calcium under saline conditions. Plant Physiology 80:520-524.
White, P.J. and M.R. Broadley. 2001. Chloride in soils and its uptake and movement within the
plant: A review. Annals of Botany 88:967-988.
Williams, P.H., S.C. Jarvis and E. Dixon. 1998. Emission of nitric oxide and nitrous oxide from
soil under field and laboratory conditions. Soil Biology and Biochemistry 30:1885-1893.
World Health Organization. 2006. WHO guidelines for the safe use of wastewater, excreta
and greywater. Geneva. Switzerland.

Urine as a fertilizer under saline conditions
71
5 Maize (Zea mays L.) response to urine and wood ash fertilization under
saline (NaCl) soil conditions
International Journal of AgriScience 3 (4): 333-345, 2013
Michael Yongha Boh1*, Torsten Müller2, Joachim Sauerborn1
1Institute of Plant Production and Agroecology in the Tropics and Subtropics,
University of Hohenheim, 70593 Stuttgart, Germany.
2Institute of Crop Science, Fertilization and Soil Matter Dynamics, University of Hohenheim, 70593 Stuttgart, Germany
*Author for correspondence (email: [email protected]; [email protected])

Urine as a fertilizer under saline conditions
72
Abstract
An experiment was conducted under controlled environmental conditions to test whether
supplementary wood ash application could improve the fertilizing effect of urine on maize
(Zea mays L.) under saline conditions. The study consisted of three salinity levels (ECe) 0.6
(S0), 4.2 (S1), 9.6 (S2) dS m-1, three nitrogen (given as urine) treatments 0 (no urine), 75 (U1)
and 150 mg urine-N kg-1 soil (U2) and two wood ash treatments; 0 (no wood ash) and 150 mg
(WA) kg-1 soil. In total, six fertilizer treatments F0 (no urine, no wood ash), U1, U2, WA,
U1+WA and U2+WA were tested at each salinity level. Maize height and SPAD-values were
measured 35 days after sowing. Dry weights and shoot concentrations of K, P, Na, Mg, Ca,
Mn, Cu and Zn of treated plants were measured 45 days after sowing. Results showed that
salinity stress significantly decreased plant height and shoot dry weight. At salinity level (S1),
the combined application of wood ash and 75 mg urine-N kg-1 soil (U1) increased shoot dry
weight 1.8-fold compared to F0. No beneficial effect of wood ash was observed under 150 mg
urine-N kg-1 soil and/or at salinity level S2 (9.6 dS m-1). The results also revealed that under
salinity level S1 (4.2 dS m-1), application of WA or U1+WA increased shoot concentrations of
K, Mg and Ca. In conclusion, application of wood ash alone or of 75 mg urine-N kg-1 soil (U1)
plus wood ash proved suitable to foster Na and salt tolerance of maize plants when salinity
does not exceed 4.2 dS m-1.
Keywords: urine fertilizer; NaCl salinity; urine salinity interaction; K and Na antagonism;
maize

Urine as a fertilizer under saline conditions
73
5.1 Introduction
Soil salinity is a severe abiotic stress factor limiting agricultural production worldwide (Yadav
et al., 2011). Salinity offsets nutritional balance in plants, reducing nutrient uptake in less
tolerant crops with a consequent decrease in plant growth (Nandy et al., 2007). Saline soils
are inherently poor in nutrients (Hague, 2006); hence, most salinity-fertility interaction
studies concluded that fertilizer application can alleviate the deleterious effect on plants
caused by salinity (Villa-Castorena et al., 2003; Esmaili et al., 2008). Paradoxically, most
mineral fertilizer materials are salts and their use often contributes to salinity in the growing
medium (Jacobs and Timmer, 2005) and this should be considered in fertilizer planning under
saline soil conditions (Bunt, 1988; Mortvedt, 2001).
In coastal, semiarid and arid areas of developing countries where soil salinity is common and
commercial fertilizers are unaffordable, increasing crop yields remains a great challenge
(Irshad et al., 2002). In many regions, human urine and wood ash, which are available to
households as waste, present a valuable alternative fertilizer for crop production (Pradhan et
al., 2009). Urine fertilizer has gained an increased attention during the last two decades and
its agronomic importance has been validated both by field trials (Germer et al., 2011;
Morghan, 2007; Pradhan et al., 2010) and under controlled conditions (Mnkeni et al., 2008).
Urine collected from healthy persons is a hygienically safe fertilizer (Schönning et al., 2002).
However, in case of contamination, urine can be sanitized by acidification and/or storage
prior to use as fertilizer for food crops (WHO, 2006; Maurer et al., 2006; Vinnerås et al.,
2008). The simultaneous presence of macronutrients (NPK) and Na and Cl salts in human
urine could be a limitation to its use in crop production under saline conditions. Therefore,
where crop fertilization with human urine under saline conditions is envisaged, strategies to
improve salinity and Na tolerance should be considered. It has been suggested that by
improving the soil cationic balance especially K/Na and/or Ca/Na, crop Na and salinity
tolerance may be enhanced (Hague, 2006; Bar-Tal et al., 1991).
Wood ash, produced by combustion of woody vegetation is low in N but comprise cations
such as K, Ca and Mg (Awodun et al., 2007; Nieminen et al., 2005) and has a pH-increasing
effect (Adekayode and Olojugba, 2010; Ojeniyi et al., 2010; Saarsalmi et al., 2012). Wood ash
application can significantly affect N mineralisation process by altering the activity and
changing the composition and population of soil microbes through changes in soil chemical

Urine as a fertilizer under saline conditions
74
properties (Saarsalmi et al., 2010). In South-West Nigeria, Owolabi et al. (2003) found that the
application of wood ash from sawdust alone significantly increased yield of tomato (Solanum
lycopersicum L.) and okra (Abelmoschus esculentus (L.) Moench) and their leaf nutrient
content. Wood ash has also been used in combination with urine as fertilizers in Finland with
significantly beneficial results. For example, Pradhan et al. (2009) have reported a significantly
higher root biomass production for red beet (Beta vulgaris L.) fertilized with urine and ash
compared to stand-alone treatments with urine or mineral fertilizer.
To date, there is no published information on the effect of urine in conjunction with wood ash
under saline soil conditions. Hence, the objective of this study was to test whether the
fertilizing effect of urine on shoot nutrient concentration and maize growth under saline
conditions could be improved by addition of wood ash. We hypothesized that 1) the salt and
Na tolerance of urine fertilized maize can be enhanced by supplementary wood ash
application, and 2) regardless of salinity; combined urine and wood ash fertilization optimizes
plant nutrition and improves plant growth compared to urine- or wood ash stand-alone
treatments.
The results from this study should serve as important bases for future research on urine-
wood ash fertilization under saline soil conditions and should be a useful guide to potential
users of urine and wood ash in saline soils.
5.2 Materials and methods
A pot experiment was conducted in growth chambers (EA 75HIL Emersacker, Germany) using
a silty loam soil derived from Loess collected from the uppermost 30 cm at Stuttgart-
Echterdingen, Germany (48°40” N, 9°13” W). The soil was air-dried and passed through a 2
mm sieve. Chemical analyses from a representative sample of the bulk soil were carried out
before the beginning of the experiment (Tab. 5.1). Soil total N was measured by infrared
absorption using an elemental analyzer (vario EL, Elementar, Hanau, Germany). Plant
available P was extracted as described by Bray and Kurtz (1945) and P in the extract was
measured by inductively coupled plasma optical emission spectrometry (ICP-OES) using a
Varian Vista Pro instrument. Exchangeable cations in the soil (K+, Na+, Ca2+, Mg2+) were
extracted with 1 M NH4Cl and measured by ICP-OES (VDLUFA, 2009). Soil electrical

Urine as a fertilizer under saline conditions
75
conductivity was measured from a saturated paste extract (ECe) according to Richards (1954)
while soil pH was measured in a 1:2.5 soil: water suspension (pHw).
Table 5.1 Chemical and physical properties of soil, urine and wood ash used in this study
Element Soil (mg kg-1
) Wood ash (mg kg-1
) Urine (mg l-1
)
Total N 1.1 0.06 6325 Total P 7.2 <1 492 K
+ 28 59156 1418
Ca2+
ND 19317 53 Mg
2+ ND 6781 347
Na+ ND 1333 2702
Cl- ND 544 3370
Zn 0.64 437 70a
Cu 0.46 63 98a
Mn 5.0 1204 BDL pHw 6.2 12.8 11.8 ECe (dS m
-1) 0.6 1.7 47.6
a values are in µg kg
-1; BDL = below detection limit; ND = not determined
The experiment was arranged in a completely randomized block design with three factors and
four replications. As a first experimental factor, three soil salinity levels: S0 (no salt added), S1
and S2 were established by adding pre-determined amounts of NaCl solution to known soil
weights, achieving target salinities of (ECe) 0.6 (S0), 4.2 (S1) and 9.6 (S2) dS m-1, respectively.
Briefly, to determine the amount of salt to be added to the soil, NaCl was dissolved in distilled
water and different amounts applied to known soil weights. Treated soils were incubated for
3 days and the electrical conductivities of saturated paste extracts were measured. Two kg
each of the salinized soil were filled in 2 l non free-draining plastic pots.
The second and third experimental factors were urine (U) and wood ash fertilization (WA).
Urine for fertilizer application was collected from male and female students of the University
of Hohenheim, Stuttgart, Germany in April 2009, stored in an air-tight plastic container at a
mean daily temperature of 25±2 °C as recommended by Vinnerås et al. (2008). Prior to
application, the urine container was thoroughly agitated and samples were taken for
chemical analyses (Tab. 5.1). Wood ash derived from burning twigs and branches of apple
(Malus domestica, Borkh.) and spruces (Picea spp.) was collected from the furnace of a
household in Stuttgart-Möhringen during the winter of 2010. The ash was passed through a 2
mm sieve and samples from the bulk were analyzed for chemical content by aforementioned
methods (Tab. 5.1). Urine was supplied as an N fertilizer assuming that the effect of other
macronutrients was negligible (Mnkeni et al., 2008). Treatments corresponded to 0 (no urine
added), 75 mg N (U1) and 150 mg N kg-1 soil (U2). Wood ash treatments were 0 (no wood ash

Urine as a fertilizer under saline conditions
76
added) and 150 mg wood ash (WA) kg-1 soil. The entire experimental setup constituted 18
treatments (3 salinities x 3 urine-N x 2 wood ash) with 6 fertilizer treatments per salinity level,
viz, F0 (no fertilizer added), U1, U2, WA, U1+WA and U2+WA. 1/3 of the targeted N dosage
was applied seven days before sowing and the remainder 14 days after sowing (DAS). Wood
ash was incorporated into the upper 5 cm layer of the soil in each pot a day before sowing.
Maize seeds (Zea mays L. cv. Ronaldinio) were surface sterilized by soaking for 10 minutes in
6 % sodium hypo-chloride solution, washed with de-ionized water to remove detergent and
soaked overnight in distilled water to stimulate germination prior to sowing (Janmohammadi
et al., 2008). Six seeds were sown per pot to a depth of 2 cm and later thinned to three
healthy seedlings 8 days after onset of emergence. Soil moisture was maintained at 80 %
max. water holding capacity throughout the experiment by adjusting the weight of the pot
daily with de-ionized water. Day (12 hours) and night temperatures in the growth chambers
were set to 30°C and 22°C, respectively, to resemble growing conditions in tropical climate.
5.2.1 Data collection
Investigated growth factors were maize plant height, SPAD values as indicators of leaf
chlorophyll content and shoot dry weight, as determinants of plant vigour. Seedling height
and SPAD values were measured 35 days after sowing with a ruler and SPAD-502 chlorophyll
meter (Konica Minolta, Japan) respectively. The SPAD-502 meter was used according to
Schlemmer et al. (2005). Briefly, measurements were taken from the youngest fully
developed leaf, halfway from the leaf base to tip and halfway from the midrib to the leaf
margin. Three measurements were taken per pot, that is, one measurement each on all three
plants growing in each pot. The results were averaged to achieve a single value that
represents the pot.
Plant shoots were harvested from 0.5 cm above the ground 45 days after sowing and then
oven-dried at 70°C to constant weight. Dried shoots were milled and ashed at 500°C, digested
with 1:3 concentrated HCl and analyzed for K, Ca, Na, Mg, Cu, Zn, Mn and Zn content. K, Ca,
Na in the ash solution were measured with a flame photometer while Mg, Cu, Zn, Mn and Zn
were measured by atomic absorption spectrometry (AAS). P was measured colorimetrically
according to the method of Ryan et al. (2001). Soil ECe and pHw were measured from samples
taken from each pot at the end of the experiment that had been processed according to the
methods already described above.

Urine as a fertilizer under saline conditions
77
5.2.2 Data analysis
The data were analyzed with the SAS statistical software (SAS Institute, version 9.2) using the
GLM procedure for ANOVA. The three main factors salinity (S), urine (U), wood ash (WA) and
their interactions were considered statistically significant at p ≤ 0.05 level of probability. Data
for shoot dry weight was log transformed prior to statistical analyses to fulfil the conditions of
normality. Where significant differences were found, the differences of means across
treatments were further compared using the post-hoc Tukey test.
5.3 Results
5.3.1 pHw and ECe
Analysis of variance showed that soil pHw measured at the end of the trial was significantly
affected by urine x wood ash interaction while soil ECe was affected by urine fertilization
alone (Tab. 5.2). In the salinity level S0, wood ash stand-alone fertilizer raised soil pHw by 20 %
compared to U1 treatment. Meanwhile an increase of 21 % in soil pHw was observed under
salinity level S1 in the WA and U1+WA treatments compared to the unfertilized soil (Tab. 5.3).
Compared to the unfertilized soils, application of 150 mg urine-N kg-1 soil significantly
increased soil EC across salinity levels (Tab. 5.3).
Table 5.2 P-Values for the ANOVA conducted to determine the interactive effects of salinity (S), urine
(U) and wood ash (WA) application on ion content in shoots of maize plants grown in a growth
chamber. P-values for soil pHw and ECe at the end of the experiment are also shown.
Source K P Na Mg Ca Mn Cu Zn pHw ECe
P-values model <0.0001 <0.0001 <0.0001 0.0012 <0.0001 <0.0001 <0.0001 <0.0001 <0.0003 0.0003 Single factors S <0.0001 <0.0001 <0.0001 <0.0001 <0.0001 <0.0001 <0.0001 <0.0001 0.0922 <0.0001 U 0.0588 0.0133 0.0030 0.0167 0.1201 0.0952 0.8042 0.0986 0.9280 <0.0001 S x U 0.0004 0.0087 <0.0001 0.0394 0.0058 <0.0001 0.0743 <0.0001 0.3109 0.7299 WA <0.0001 <0.0001 0.0519 0.0111 0.0002 0.2560 0.0027 0.0005 <0.0001 0.9152 S x WA <0.0001 0.0001 <0.0001 0.0425 0.0003 0.0031 0.0428 0.0358 0.2684 0.9391 U x WA 0.0383 0.0007 0.1551 0.2326 0.0121 0.0836 0.3765 0.1784 0.0002 0.6380 S x U x WA 0.9883 0.3041 0.5329 0.1017 0.2701 0.0393 0.4550 0.5489 0.4483 0.6263

Urine as a fertilizer under saline conditions
78
Table 5.3 Salinity and fertilizer effects on SPAD values, plant height, shoot dry weight, soil pHw and soil
ECe
Salinity Fertilizer treatment
SPAD values
Plant height (cm plant
-1)
Shoot dw (g plant
-1)
pHw ECe dS m
-1
S0 F0 15.5±0.6d 113±10ab 1.5±0.0bc 6.2±0.1bc 0.7h U1 30.4±0.9ab 124±16a 1.6±0.1bc 6.0±0.6c 1.0gh U2 35.7±1.4a 114±06ab 1.7±0.1ab 6.9±0.2abc 1.8g WA 24.7±0.6bc 119±10a 1.9±0.1a 7.5±0.2ab 0.8h U1+WA 30.5±1.3ab 100±03abc 1.9±0.0a 7.2±0.1abc 1.1gh U2+WA 29.8±1.6ab 116±01ab 1.7±0.0ab 6.8±0.1abc 1.5gh Mean (n = 24) 27.7C 114A 1.7A 6.8A 1.1C S1 F0 21.1±1.0cd 100±10abc 0.8±0.0fgh 5.9±0.5c 4.9f U1 32.7±1.2a 92±03abc 1.0±0.1fgh 6.8±0.3abc 5.3def U2 35.5±2.5a 84±05bcd 0.9±0.0fgh 7.1±0.0abc 6.0de WA 23.9±2.2bc 94±09abc 1.2±0.1de 7.4±0.1ab 5.0f U1+WA 35.5±1.4a 80±01cde 1.4±0.3dc 7.4±0.3ab 5.2ef U2+WA 30.3±2.9ab 68±03cdef 1.0±0.1ef 7.0±0.1abc 6.1de Mean (n = 24) 29.8B 86B 1.0B 6.9A 5.4B S2 F0 31.0±1.5ab 74±02cdef 0.7±0.0gh 6.7±0.1abc 9.8bc U1 33.0±1.1a 67±02cdef 0.7±0.1hi 7.2±0.2abc 10.1abc U2 32.5±1.0a 49±03ef 0.5±0.0ij 7.0±0.2abc 10.7a WA 34.3±1.4a 74±04cdef 0.8±0.1fgh 7.7±0.3a 9.7c U1+WA 35.3±0.8a 57±03def 0.7±0.1hi 7.1±0.1abc 10.2abc U2+WA 33.0±0.7a 44±04f 0.3±0.1j 6.9±0.2abc 10.6ab Mean (n = 24) 33.2A 60C 0.6C 7.1A 10.2A
Different letters within one row indicate significant difference at P ≤ 0.05 according to Tukey test. S0, S1 and S2
are soil salt levels. F0 – no fertilizer treatment; WA – wood ash treatment, U1 and U2 – urine-N level 1 and 2,
and their combined application with wood ash – U1+WA and U2+WA are fertilizer treatments.
5.3.2 Maize seedling growth
Plant height and shoot dry weight decreased as salinity rose whereas SPAD values increased
(Tab. 5.3). Compared to the S0 treatment (no salt added), plant height decreased by 25 and
47 % in the S1 and S2 treatments, respectively. Similarly, a significant decrease of 41 and 65 %
in shoot dry matter accumulation was observed in the S1 and S2 treatments (Tab. 5.3).
However, mean shoot dry weight was 1.5 and 1.8 times higher in WA and U1+WA treatments
compared to the unfertilized control (F0) in the S1 treatments. But, this effect diminished at
salinity level S2.
While mean SPAD values generally increased as salinity rose, application of urine and wood
ash either as stand-alone fertilizers or in combination significantly further increased leaf SPAD
values in the S0 and S1 treatments. The only exception was with WA stand-alone fertilization
in the S1 treatment where leaf SPAD values were more or less the same compared with the

Urine as a fertilizer under saline conditions
79
unfertilized treatment. Furthermore, SPAD values were twice as high in F0 under S2
compared to S0 (Tab. 5.3).
5.3.3 Shoot K, P, Na, Ca and Mg concentrations
a) Potassium
Maize shoot K concentration was significantly affected by interactions between salinity x
urine, salinity x wood ash and urine x wood ash fertilizations (Tab. 5.2). Salinity reduced shoot
K concentration in the order S2 < S1 < S0. Comparative analyses showed that shoot K
concentration in the U1+WA treatment was 57 and 55 % higher than in the unfertilized
control (F0) under S0 and S1 salinity levels, respectively (Tab. 5.4). Additionally, shoot K
concentration was significantly higher in U1+WA treatment compared to urine stand-alone
(U1) fertilization under S0 and S1 treatments. A higher urine fertilizer application (U2)
supplemented with wood ash led to a more than 2.4-fold decrease in shoot K concentration
compared to the WA and U1+WA treatments under S1 salinity.
Table 5.4 Effect of salinity and fertilizer treatment on the concentration of nutrients in maize shoots
Salinity Fertilizer treatment
Shoot nutrient concentration (mg g-1
dw)
K P Na Mg Ca S0 F0 14.6±3.4cdef 0.7±0.2bc 0.1±0.0e 2.2±0.3abc 2.9±0.5bcdef U1 15.8±3.5cde 0.6±0.1cd 0.2±0.0e 3.0±0.4ab 3.7±0.6abcde U2 22.5±3.1abc 0.7±0.1bc 0.3±0.0e 3.0±0.4ab 4.8±0.7abc WA 25.3±2.5abc 0.9±0.1abc 0.3±0.0e 3.3±0.4a 4.5±0.6abcd U1+WA 33.8±3.9a 1.1±0.1a 0.4±0.1e 3.4±0.4a 5.7±0.7a U2+WA 30.6±1.1ab 1.0±0.0ab 0.2±0.0e 2.9±0.2ab 5.2±0.3ab Mean (n = 24) 23.8A 0.9A 0.3B 3.0A 4.5A S1 F0 9.8±1.4defg 0.3±0.0def 1.4±0.3cde 1.5±0.3cdef 2.6±0.5cdef U1 9.3±0.4defg 0.2±0.0def 1.5±0.1bcde 0.7±0.0defg 2.0±0.1def U2 6.6±0.3efg 0.2±0.0ef 1.8±0.2bcde 0.5±0.0efg 2.0±0.4def WA 18.4±3.8dc 0.5±0.1cde 2.7±0.5abcd 1.7±0.3bcde 3.7±0.7abcde U1+WA 21.8±2.3bc 0.8±0.1abc 4.7±0.7a 2.1±0.2abcd 5.9±0.8a U2+WA 9.0±0.8defg 0.4±0.0def 3.4±0.4abc 1.0±0.1cdefg 2.9±0.6bcdef Mean (n = 24) 12.5B 0.4B 2.6A 1.3B 3.2B S2 F0 6.9±0.9efg 0.3±0.1def 4.3±0.5a 0.8±0.1defg 2.0±0.2def U1 4.5±0.4efg 0.2±0.0f 3.6±0.9ab 0.3±0.1fg 1.3±0.3ef U2 1.3±0.2g 0.1±0.0f 1.8±0.4bcde 0.2±0.0g 0.9±0.3f WA 7.0 ±0.8defg 0.3±0.0def 3.1±0.6abc 0.5±0.1efg 1.3±0.3ef U1+WA 3.9±0.7fg 0.2±0.0ef 2.9±0.6abc 0.4±0.1efg 1.2±0.3ef U2+WA 0.7±0.3g 0.1±0.0f 0.8±0.2de 0.1±0.0g 0.4±0.1f Mean (n = 24) 4.1C 0.2C 2.7A 0.4C 1.2C
Different letters within one row indicate significant difference at P ≤ 0.05 according to Tukey test. S0, S1 and S2
are soil salt levels. F0 – no fertilizer treatment; WA – wood ash treatment, U1 and U2 – urine-N level 1 and 2,
and their combined application with wood ash – U1+WA and U2+WA are fertilizer treatments. dw = dry weight.
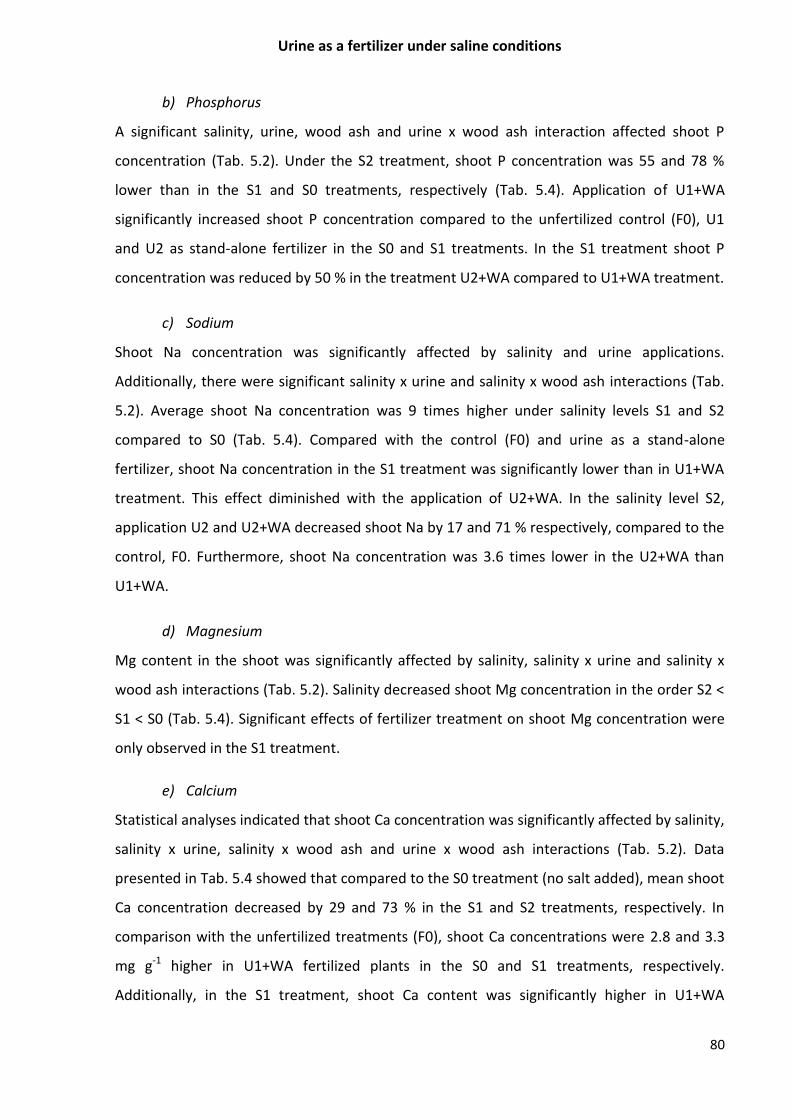
Urine as a fertilizer under saline conditions
80
b) Phosphorus
A significant salinity, urine, wood ash and urine x wood ash interaction affected shoot P
concentration (Tab. 5.2). Under the S2 treatment, shoot P concentration was 55 and 78 %
lower than in the S1 and S0 treatments, respectively (Tab. 5.4). Application of U1+WA
significantly increased shoot P concentration compared to the unfertilized control (F0), U1
and U2 as stand-alone fertilizer in the S0 and S1 treatments. In the S1 treatment shoot P
concentration was reduced by 50 % in the treatment U2+WA compared to U1+WA treatment.
c) Sodium
Shoot Na concentration was significantly affected by salinity and urine applications.
Additionally, there were significant salinity x urine and salinity x wood ash interactions (Tab.
5.2). Average shoot Na concentration was 9 times higher under salinity levels S1 and S2
compared to S0 (Tab. 5.4). Compared with the control (F0) and urine as a stand-alone
fertilizer, shoot Na concentration in the S1 treatment was significantly lower than in U1+WA
treatment. This effect diminished with the application of U2+WA. In the salinity level S2,
application U2 and U2+WA decreased shoot Na by 17 and 71 % respectively, compared to the
control, F0. Furthermore, shoot Na concentration was 3.6 times lower in the U2+WA than
U1+WA.
d) Magnesium
Mg content in the shoot was significantly affected by salinity, salinity x urine and salinity x
wood ash interactions (Tab. 5.2). Salinity decreased shoot Mg concentration in the order S2 <
S1 < S0 (Tab. 5.4). Significant effects of fertilizer treatment on shoot Mg concentration were
only observed in the S1 treatment.
e) Calcium
Statistical analyses indicated that shoot Ca concentration was significantly affected by salinity,
salinity x urine, salinity x wood ash and urine x wood ash interactions (Tab. 5.2). Data
presented in Tab. 5.4 showed that compared to the S0 treatment (no salt added), mean shoot
Ca concentration decreased by 29 and 73 % in the S1 and S2 treatments, respectively. In
comparison with the unfertilized treatments (F0), shoot Ca concentrations were 2.8 and 3.3
mg g-1 higher in U1+WA fertilized plants in the S0 and S1 treatments, respectively.
Additionally, in the S1 treatment, shoot Ca content was significantly higher in U1+WA

Urine as a fertilizer under saline conditions
81
treatment than in urine stand-alone and U2+WA treatments. There was no significant
fertilization effect on shoot Ca content under S2 treatment (Tab. 5.4).
5.3.4 Shoot micronutrient content
Mean shoot content of Cu, Zn, and Mn significantly decreased as salinity rose (Tab. 5.5). With
regard to shoot Cu content, no significant differences were observed between fertilizer
treatments within the respective salinity levels. The content of Zn in maize shoots increased
by 9.4 µg g-1 plant dw in plants fertilized with 150 mg urine-N kg-1 soil (U2) compared with
unfertilized plants (F0), in the S0 treatment. Whereas in the S1 treatment, highest shoot Zn
concentration was measured in the U1+WA fertilized plants and was 3.2-, 2.1- and 2.5 times
higher than in the F0, U1 and U2 fertilized treatments, respectively. Analyses of variance
indicated that shoot Mn concentration was significantly affected by salinity, urine and wood
ash interactions (p = 0.0393; Tab. 5.2). Compared to the U2 treatment at salinity level S0,
shoot Mn concentrations were by 62, 43 and 46 % higher than in the F0, U1 and WA
treatments, respectively. Meanwhile in the S1 treatment, Mn concentration was highest in
the U1+WA fertilized plants but significantly different only from U2 treatment. There was no
significant fertilizer effect on shoot Mn concentration in the S2 treatment.
Table 5.5 Effect of salinity and fertilizer treatments on maize shoots contents of Cu, Zn and Mn. Salinity Fertilizer
treatment Shoot nutrient concentration (µg g
-1 dw)
Cu Zn Mn
S0 F0 1.4±0.5abcd 8.5±2.1bcd 19.5±3.4bcdefg U1 2.5±0.6ab 11.6±1.8abc 29.3±3.9bcde U2 3.0±0.4a 17.9±2.5a 51.2±6.3a WA 2.9±0.4a 12.1±1.7abc 27.9±4.0bcde U1+WA 2.9±0.7a 16.3±1.9ab 35.7±5.1abc U2+WA 2.9±0.3a 18.7±1.0a 37.4±2.3ab Mean (n = 24) 2.6A 14.2A 33.5A S1 F0 1.3±0.2abcd 4.9±0.7cd 18.3±3.0cdefg U1 1.0±0.1abcd 7.4±0.5cd 17.5±1.1defg U2 1.0±0.1abcd 6.3±0.7cd 14.3±1.1efg WA 2.2±0.4abc 8.9±1.8bcd 21.2±4.1bcdef U1+WA 2.4±0.3ab 15.8±2.3ab 32.9±4.3bcd U2+WA 1.9±0.3abcd 9.1±1.2bcd 25.7±5.5bcdef Mean (n = 24) 1.7B 8.7B 21.7B S2 F0 1.1±0.2abcd 5.5±1.0cd 16.2±2.2defg U1 0.7±0.1bcd 4.8±0.8cd 11.4±2.1efg U2 0.4±0.1cd 2.1±0.2d 7.6±1.4fg WA 1.0±0.1abcd 8.0±3.9bcd 9.9±0.7efg U1+WA 0.8±0.1bcd 4.1±0.7cd 9.2±1.7fg U2+WA 0.3±0.1d 1.0±0.3d 2.1±0.7g Mean (n = 24) 0.7C 4.3C 9.5C
Different letters within one row indicate significant difference at P ≤ 0.05 according to Tukey test. S0, S1 and S2 are soil salt
levels. F0 – no fertilizer treatment; WA – wood ash treatment, U1 and U2 – urine-N level 1 and 2, and their combined
application with wood ash – U1+WA and U2+WA are fertilizer treatments. dw = dry weight.

Urine as a fertilizer under saline conditions
82
5.4 Discussion
This study emphasized the need to adopt appropriate management practices when urine is
considered for use as fertilizer under saline (NaCl) soil conditions. Soil salinity may cause
diminished plant growth by reducing the plant’s ability to take up water and nutrients (Yadav
et al., 2011). Results of our study showed that salinity-induced stress reduced plant height
and maize shoot dry weight. In addition, an increase in soil salinity induced by urine
fertilization was expected due to its high concentration in Na and Cl. The contribution of
human urine fertilizer to soil salinity has also been reported by Mnkeni et al. (2008).
Our results further indicated that wood ash application increased soil pH. Soil pH is an
important property that affects crop performance and may affect nutrient availability to
plants by controlling microbial immobilization rates, de-nitrification and P solubility (Chapin et
al., 2004). The increase in soil pH after wood ash application is due to its alkaline nature.
Wood ash is rich in oxides, hydroxides and carbonates of Ca and K which and when used as a
soil additive may contribute to raise pH. In incubation experiments to determine the effect of
wood ash application on soil solution chemistry, Nkana et al. (2002) found that soil solution
pH rose with increasing amounts of wood ash. Ojeniyi et al. (2010) have also reported an
increase in soil pH from maize fertilization with wood ash.
At salinity level S1, increased shoot dry weight of maize seedlings in the U1+WA treatment
compared to the control is an indication that the deleterious effect of salinity can be
overcome by a combined application of urine and wood ash. It also suggests an improved salt
tolerance of maize plants and better utilization of nutrients in confirmation of our hypothesis.
By combining urine and wood ash application, soil content of N, K and Ca and their availability
increased due to increased pH (Nottidge et al., 2007; Saarsalmi et al., 2010). However,
reduced dry matter yield in the U2+WA treatment indicate that, in this treatment, urine
amount exceeded the critical limit beneficial for combined urine and wood ash fertilization of
young maize seedlings at S1 salinity. It is apparent that at a higher urine-N application the
supplementary effect of wood ash fertilization becomes dominated by increased urine-
induced salinity, suggesting that higher dosages of wood ash may be required to improve
maize seedling growth. This requires further investigation.
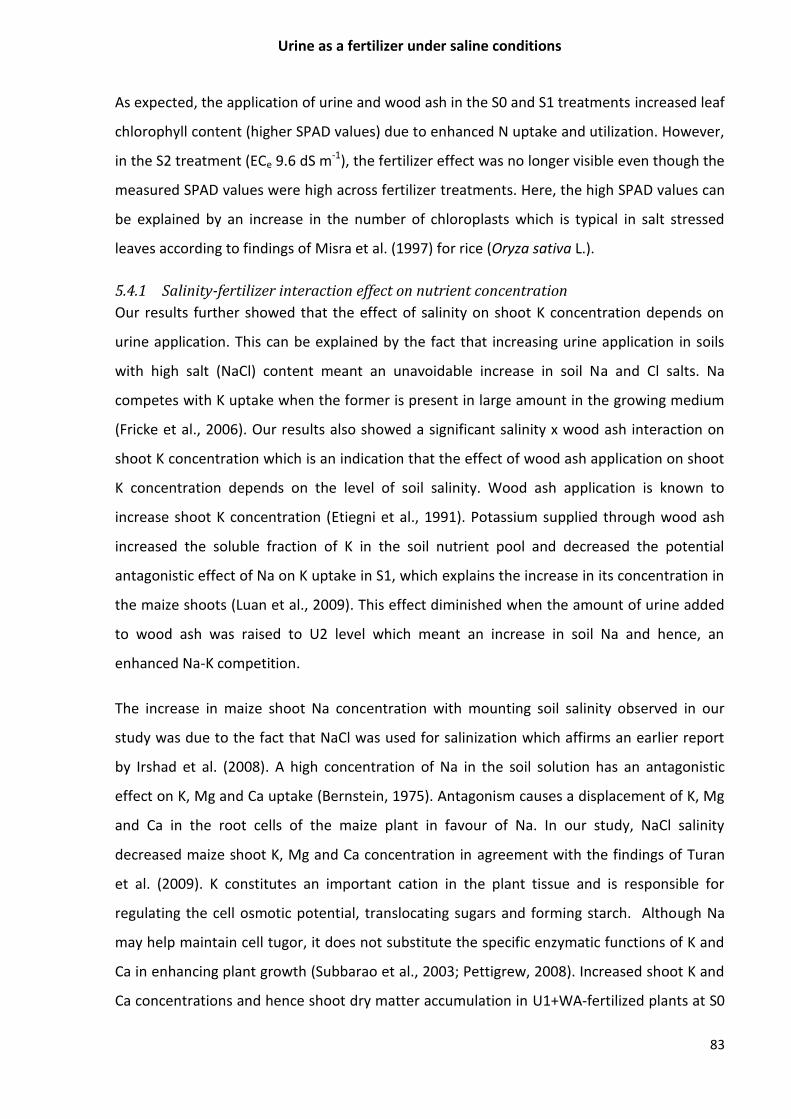
Urine as a fertilizer under saline conditions
83
As expected, the application of urine and wood ash in the S0 and S1 treatments increased leaf
chlorophyll content (higher SPAD values) due to enhanced N uptake and utilization. However,
in the S2 treatment (ECe 9.6 dS m-1), the fertilizer effect was no longer visible even though the
measured SPAD values were high across fertilizer treatments. Here, the high SPAD values can
be explained by an increase in the number of chloroplasts which is typical in salt stressed
leaves according to findings of Misra et al. (1997) for rice (Oryza sativa L.).
5.4.1 Salinity-fertilizer interaction effect on nutrient concentration
Our results further showed that the effect of salinity on shoot K concentration depends on
urine application. This can be explained by the fact that increasing urine application in soils
with high salt (NaCl) content meant an unavoidable increase in soil Na and Cl salts. Na
competes with K uptake when the former is present in large amount in the growing medium
(Fricke et al., 2006). Our results also showed a significant salinity x wood ash interaction on
shoot K concentration which is an indication that the effect of wood ash application on shoot
K concentration depends on the level of soil salinity. Wood ash application is known to
increase shoot K concentration (Etiegni et al., 1991). Potassium supplied through wood ash
increased the soluble fraction of K in the soil nutrient pool and decreased the potential
antagonistic effect of Na on K uptake in S1, which explains the increase in its concentration in
the maize shoots (Luan et al., 2009). This effect diminished when the amount of urine added
to wood ash was raised to U2 level which meant an increase in soil Na and hence, an
enhanced Na-K competition.
The increase in maize shoot Na concentration with mounting soil salinity observed in our
study was due to the fact that NaCl was used for salinization which affirms an earlier report
by Irshad et al. (2008). A high concentration of Na in the soil solution has an antagonistic
effect on K, Mg and Ca uptake (Bernstein, 1975). Antagonism causes a displacement of K, Mg
and Ca in the root cells of the maize plant in favour of Na. In our study, NaCl salinity
decreased maize shoot K, Mg and Ca concentration in agreement with the findings of Turan
et al. (2009). K constitutes an important cation in the plant tissue and is responsible for
regulating the cell osmotic potential, translocating sugars and forming starch. Although Na
may help maintain cell tugor, it does not substitute the specific enzymatic functions of K and
Ca in enhancing plant growth (Subbarao et al., 2003; Pettigrew, 2008). Increased shoot K and
Ca concentrations and hence shoot dry matter accumulation in U1+WA-fertilized plants at S0

Urine as a fertilizer under saline conditions
84
and S1 can be attributed to their addition through both fertilizers; K, Mg and Ca being higher
in the wood ash than in urine. This confirms the findings of Adekayode and Olojugba (2010)
who also observed an increase in maize shoot Mg and Ca from wood ash fertilization.
Furthermore, in the S1 treatment the substantial increase in shoot Na concentration in the
U1+WA compared to the unfertilized treatment can be attributed to its content in the
fertilizer sources combined. Under NaCl salinity, an increase in shoot Na concentration could
lead to toxicity and reduce plant growth (Fortmeier and Schubert, 1995). In our study, there
was an increase in shoot biomass accumulation in spite of the significant increase in shoot Na
concentration in the U1+WA treatment. This can be explained by the dilution effect of K and
Ca in the plant tissues considering that the shoot content of these cations also increased in
this variant. Supplemental Ca and K added to the soil through wood ash enhanced shoot
concentrations. Rengel (1992) has attributed the salt tolerance of plants to their ability to
maintain high concentrations of K and Ca and avoid Na toxicity.
In our study shoot P concentration increased in the U1+WA treatment under S0 and S1
salinities in spite of the increase in soil pH. According to Erich and Ohno (1992), wood ash-
amended soils can cause an increase or a decrease in plant available P depending on the pH
of the soil prior to wood ash application. P availability also tends to be higher in slightly acidic
soils; therefore, where soil pH is low, micro doses of wood ash can enhance P availability. For
example, Etiegni et al. (1991) reported that wood ash application at rates below 20 g kg-1 soil
increased P uptake in wheat (Triticum aestivum L.). The reason for an increase in shoot P
concentration in spite of raised pH following wood ash application remains unclear and would
require further investigation.
Proper application of micronutrients can enhance maize growth as they are responsible for
vital plant processes such as photosynthesis, respiration and protein synthesis (Salem and El-
Gizawy, 2012). However, the solubility of micronutrients under saline conditions is generally
low which explains the low concentrations of Cu, Zn and Mn in maize shoots observed in our
study. This is in agreement with the findings of Abou El-Nour (2002) who has reported a
decrease in concentrations of Cu, Zn and Mn in maize shoots when subjected to saline
irrigation water.

Urine as a fertilizer under saline conditions
85
Furthermore, micronutrient availability tends to decrease in wood ash-fertilized soils due to
increased pH as has been proven under forest soil conditions (Naylor and Schmidt, 1986;
Demeyer et al., 2001). Krejsl and Scanlon (1996) also found that Mn and Cu concentrations in
bean (Phaseolus vulgaris L.) plants decreased following the application of wood ash. In our
study, wood ash application had no significant effect on shoot Cu concentration due to the
very low content of Cu in the wood ash. However, it increased shoot Mn concentration in the
U1+WA compared to the S1:U2 treatment variant. Though it was expected that increased pHw
would reduce Mn availability and hence, its concentration in the shoots of maize seedlings, it
is apparent that due to the high content of Mn in the wood ash used, the increase in pHw had
a negligible effect.
5.5 Conclusion
The results of this study revealed that the application of wood ash alone or a combined
application of urine and wood ash is beneficial to young maize plants when soil salinity is 4 dS
m-1 or lower. An improvement in salinity and Na tolerance shown by the ability of maize
seedlings to accumulate more biomass can be related to increased K and Ca availability due to
wood ash application. No benefit of fertilization was observed under salinity level S2 (9.6 dS
m-1). Field trials are recommended to determine the optimum urine and wood ash
combination for maize growth under saline soil conditions. Even so, soils should be regularly
monitored to avoid any potential salt build up.
5.6 Acknowledgement
The authors acknowledge financial support from the Catholic Academic Exchange Service
(KAAD), Germany and the laboratory support of Frau Helene Ochott.
5.7 References
Abou El-Nour EAA (2002) Growth and nutrients content response of maize to foliar nutrients
with micronutrients under irrigation saline water. J Biol Sci 2: 92-97
Adekayode FO, Olojugba MR (2010) The utilization of wood ash as manure to reduce the use
of mineral fertilizer for improved performance of maize (Zea mays L.) as measured in
the chlorophyll content and grain yield. J Soil Sci Environ Manag 1:40-45
Awodun MA, Otaru MS, Ojeniyi SO (2007) Effect of sawdust ash plus urea on maize
performance and nutrient status. Asian J Agr Res 1:27-30

Urine as a fertilizer under saline conditions
86
Bar-Tal A, Feigenbaum S, Sparks DL (1991) Potassium-salinity interactions in irrigated corn.
Irrig Sci 12:27-35
Bernstein L (1975) Effect of salinity and sodicity on plant growth. Ann Rev Phytopathol
13:295-312
Bray RH, Kurtz LT (1945) Determination of total, organic and available forms of phosphorus in
soils. Soil Sci 59:39-45
Bunt AC (1988) Media and mixes for container-grown plants. (A manual on the preparation
and use of growing media for pot plants), In Anonymous, 2nd edition of Modern
potting composts. Unwin Hyman, London and Boston, pp. 309
Chapin CT, Bridgham SD, Pastor J (2004) pH and nutrient effects on above-ground net primary
production in a Minnesota, USA Bog and Fen. Wetlands 24:186-201
Demeyer A, Voundi Nkana, JC, Verloo MG (2001) Characteristics of wood ash and influence on
soil properties and nutrient uptake: an overview. Bioresource Technol 77:287-295
Erich MS, Ohno T (1992) Phosphorus availability to corn from wood ash-amended soils. Water
Air Soil Pollut 64: 475-485
Esmaili E, Kapourchal SA, Malakouti MJ, Homaee M (2008) Interactive effect of salinity and
two nitrogen fertilizers on growth and composition of sorghum. Plant Soil Environ
54:537-546
Etiegni L, Campbell AG, Mahler RL (1991) Evaluation of wood ash disposal on agricultural land.
I. Potential as a soil additive and liming agent. Commun Soil Sci Plant 22:1243-256
Fortmeier R, Schubert S (1995) Salt tolerance of maize (Zea mays L.): the role of sodium
exclusion. Plant Cell Environ 18: 1041-1047
Fricke W, Akhiyarova G, Wei W, Alexandersson E, Miller A, Kjellbom PO, Richardson A,
Wojciechowski T, Schreiber L, Veselov D, Kudoyarova G, Volkov, V (2006) The short-
term growth response to salt of the developing barley leaf. J Exp Bot 57:1079-1095
Germer J, Addai S, Sauerborn J (2011) Response of grain sorghum to fertilisation with human
urine. Field Crop Res 122:234-241
Hague SA (2006) Salinity problems and crop production in coastal regions of Bangladesh. Pak J
Bot 38:1359-1365
Irshad M, Yamamoto S, Eneji AE, Endo T, Honna T (2002) Urea and manure effect on growth
and mineral contents of maize under saline conditions. J Plant Nutr 25:189–200
Irshad M, Eneji AE, Yasuda H (2008) Comparative effect of nitrogen sources on maize under
saline and non-saline conditions. J Agron Crop Sci 194:256- 261

Urine as a fertilizer under saline conditions
87
Jacobs DF, Timmer VR (2005) Fertilizer-induced changes in rhizosphere electrical conductivity:
relation to forest tress seedling root system growth and function. New Forests 30:147-
166
Janmohammadi M, Moradi Dezfuli P, Sharifzadeh F (2008). Seed invigoration techniques to
improve germination and early growth of inbred line of maize under salinity and
drought stress. Gene App Plant Physiol 34:215-226
Krejsl JA, Scanlon TM (1996) Evaluation of beneficial use of wood-fired boiler ash on oat and
bean growth. J Environ Qual 25:950-954
Luan S, Lan W, Chul Lee S (2009) Potassium nutrition, sodium toxicity, and calcium signaling:
connections through the CBL–CIPK network. Curr Opin Plant Biol 12:339-346
Maurer M, Pronk W, Larsen TA (2006) Treatment processes for source-separated urine.
Water Res 40:3151-3166
Misra AN, Sahu SM, Misra M, Singh P, Meera I, Das N, Kar M, Sahu P (1997) Sodium chloride
induced changes in leaf growth, and pigment and pigment and protein content in two
rice cultivars. Biol Plantarium 39:257-262
Mnkeni PNS, Kutu FR, Muchaonyerwa P, Austin LM (2008) Evaluation of human urine as a
source of nutrients for selected vegetables and maize under tunnel house conditions
in the Eastern Cape, South Africa. Waste Manag Res 26:132-139
Morghan P (2007) Toilets that make compost: Low costs, sanitary toilets that produce
valuable compost for crops in an African context. SEI, Sweden.
Mortvedt JJ (2001) Calculating salt index. Fluid J 9:1-3
Nandy P, Das S, Ghose M, Spooner-Hart R (2007) Effects of salinity on photosynthesis, leaf
anatomy, ion accumulation and photosynthetic nitrogen use efficiency in five Indian
mangroves. Wetl Ecol Manag 15:347-357
Naylor ML, Schmidt EJ (1986) Agricultural use of wood ash as a fertilizer and liming material.
Tappi J 69:114-119
Nieminen M, Piirainen S, Moilanen M (2005) Release of mineral nutrients and heavy metals
from wood and peat ash fertilizers: Field studies in Finnish forest soils. Scand J Forest
Res 20:147-153
Nkana JCV, Demeyer A, Verloo MG (2002) Effect of wood ash application on soil solution
chemistry of tropical acid soils: incubation study. Bioresour Technol 85:323-325
Nottidge DO, Ojeniyi SO, Asawalam DO (2007) Effect of different levels of wood ash on
nutrient contents of maize (Zea mays L.) and grain yield in an acid Ultisol of Southeast
Nigeria. Nig J Soil Sci 17:98-103

Urine as a fertilizer under saline conditions
88
Ojeniyi SO, Awanlemhen BE, Adejoro SA (2010) Soil plant nutrients and maize performance as
influenced by oil palm bunch ash plus NPK fertilizer. J Am Sci 6:456-460
Owolabi O, Ojeniyi SO, Amodu OA, Hazzan K (2003) Response of cowpea, okra and tomato
sawdust ash manure. J Agr Res 4:178-182
Pettigrew WT (2008) Potassium influences on yield and quality production for maize, wheat,
soybean and cotton. Physiol Plantarum 133: 670–681
Pradhan SK, Jarmo K, Holopainen JK, Heinonen-Tanski H (2009) Stored human urine
supplemented with wood ash as fertilizer in tomato (Solanum lycopersicum)
cultivation and its impacts on fruit yield and quality. J Agr Food Chem 57:7612-7617
Pradhan S, Holopainen JK, Weisell J, Heinonen-Tanski, H (2010) Human urine and wood ash as
plant nutrients for red beet (Beta vulgaris) cultivation: Impacts on yield quality. J Agr
Food Chem 58:2034-2039
Rengel Z (1992) The role of calcium in salt toxicity. Plant Cell Environ 15:625-632
Richards LA (1954) Diagnosis and improvement of saline and alkali soils. Washington: US
Department of Agriculture. USDA Agricultural Handbook, 60
Ryan J, Estefan G, Rashid A (2001) Soil and plant analysis laboratory manual. 2nd Edition.
International Center for Agricultural Research in the Dry Areas (ICARDA) and the
National Agricultural Research Center (NARC), Aleppo, Syria.
Saarsalmi A, Smolander A, Kukkola M, Arola M (2010) Effect of wood ash and nitrogen
fertilization on soil chemical properties, soil microbial processes, and stand growth in
two coniferous stands in Finland. Plant Soil 331:329-340
Saarsalmi A, Smolander A, Kukkola M, Moilanen M, Saramäki J (2012) 30-Year effects of wood
ash and nitrogen fertilization on soil chemical properties, soil microbial processes and
stand growth in a Scots pine stand. Forest Ecol Manag 278:63-70
Salem HM, El-Gizawy KB (2012) Importance of micronutrients and its application methods for
improving maize (Zea mays L.) yield grown in clayey soil. American-Eurasian J Agric &
Environ Sci 12: 954-959
Schlemmer MR, Francis DD, Shanahan JF, Schepers JS (2005) Remotely measuring chlorophyll
content in corn leaves with differing nitrogen levels and relative water content. Agron
J 97:106-112
Schönning C, Leeming R, Stenström TA (2002) Faecal contamination of source-separated
human urine based on the content of faecal sterols. Water Res 36:1965-1972
Subbarao GV, Ito O, Berry WL, Wheeler RM (2003) Sodium—A Functional Plant Nutrient. Crit
Rev Plant Sci 22:391-416

Urine as a fertilizer under saline conditions
89
Turan MA, Elkarim AHA, Taban N, Taban S (2009) Effect of salt stress on growth, stomatal
resistance, proline and chlorophyll concentrations on maize plant. Afr J Agric Res
4:893-897
VDLUFA (2009) Handbuch der landwirtschaftlichen Versuchs-und Untersuchungsmethodik
(VDLUF-Methodenbuch), Band VII Umweltanalytik, Methode 2.2.2.6: Bestimmung von
ausgewählten Elementen in pflanzlichem Material und Futtermitteln mit mit ICP-OES.
Villa-Castorena M, Ulery AL, Catalán-Valencia EA, Remmenga MD (2003) Salinity and nitrogen
rate effects on the growth and yield of chile pepper plants. Soil Sci Am J 67:1781-1789
Vinnerås B, Nordin A, Niwagaba C, Nyberg K (2008) Inactivation of bacteria and viruses in
human urine depending on temperature and dilution rate. Water Res 42:4067-4074
WHO (2006) WHO Guidelines for the safe use of wastewater, excreta and greywater. Volume
4. World Health Organization, Geneva.
Yadav S, Irfan M, Ahmad A, Hayat S (2011) Causes of salinity and plant manifestations to salt
stress: A review. J Environ Biol 32:667-685

Urine as a fertilizer under saline conditions
90
6 General discussion
The decision to apply fertilizer to saline soils depends on whether or not this would lead to an
improvement in crop yields. According to Bernstein et al. (1974) three types of salinity-
fertility relationships can be distinguished; an independent effect of salinity and fertility on
crop yields under sub-optimal and optimal fertility conditions, a decrease in salinity tolerance
under sub-optimal fertility conditions and an increase in salt tolerance under low fertility (Fig
6.1). With regards to soil fertility management, nitrogen is one of the most important
fertilizers used in crop production and is often the first nutrient to be deficient in poor soils
(Irshad et al., 2002). The application of nitrogen fertilizer does not only improve plant growth
but may also mitigate the inhibitory effect of salinity (Feigin, 1985; Flores et al., 2001; Villa-
Castorena et al., 2003). Plants can take up nitrogen either in the form of NH4+ or NO3
-.
Figure 6.1: Types of salinity-fertility relationships (Adapted from Bernstein et al., 1974). (A) Independent effect of salinity and fertility. (B) Decreased salt tolerance and (C) increased salt tolerance, respectively, at a given level of fertility represented by the broken lines of each graph.
It has been argued that growth response of plant to nitrogen application under saline soil
conditions depends on whether nitrogen is supplied as NH4+ or NO3
- (Bybordi et al., 2009;
Esmaili et al., 2008; Nathawat et al., 2007). Growth inhibition can occur if plants are fed only
with NH4+ while NO3
- uptake can be reduced by high concentrations of Cl- in the growing
medium due to antagonism which may result in toxic accumulation of Cl- in plant tissues (Bar
et al., 1997; Iglesias et al., 2004). One of the objectives of this study was to compare the
effect of urine and NH4+NO3
- on maize and sorghum growth (see chapters 2 and 3). It was
expected that both fertilizers would have the same effect on plant growth until salinity
becomes limiting. No difference in dry matter accumulation between urine and ammonium
nitrate treated maize plants was measured following the application 180 mg N kg-1 substrate
whereas, the application of 380 mg urine-N kg-1 substrate proved to be comparably
unsuitable for maize (see chapter 2). On the other hand, sorghum plants treated with urine
Optimal
Sub optimal
Salinity
Ab
solu
te y
ield
A B C

Urine as a fertilizer under saline conditions
91
produced comparatively more biomass regardless of salinity level (see chapter 3); even
though the two-crop sequence and fertilization with urine increased salinity of urine-treated
substrate. The difference in results can be attributed to the fact that sorghum plants are more
tolerant to soil salinity than maize (Reddy et al., 2010). Biomass yield of urine-treated plants
was not related to additional P, K, Ca and Mg in urine as was expected. However, synergism
between two or more of these nutrients could have played a beneficial role (see chapter 3).
Concerns about soil salinization and sodicification issuing from crop fertilization with urine
have been raised whenever urine is under consideration. Human urine has a water:nutrient
ratio of aprroximately 19:1 with a salinity range between EC 18 – 45 dS m-1 depending on
whether it is fresh or stored urine (Beler-Baykal et al., 2011). This salinity range, according to
Pescod (1992) is 6 to 15 times higher than the maximum EC level for a severe restriction of
irrigation water use. Therefore, even with targeted fertilizer nutrient dosages applied, salinity
of the growing medium is bound to occur.
In this study it was hypothesized that urine fertilization would increase the risk of soil salinity
and sodicity and that the effect on the latter would be severe under NaCl-dominated
conditions. Although urine application in moderate amounts was shown to be as good as
ammonium nitrate, high dosages of urine increased substrate electrical conductivity and set
up extremely adverse conditions for plant growth. Leaf tips burning, stunted growth and dead
of urine-fed plants was observed (see chapter 2). The 2 to 3-fold increase electrical
conductivity of the saturation extract, measured in urine fertilized substrate can be related to
the high contents of soluble salt especially Na+, Cl- and SO43- added through urine.
The urine used at the beginning of this study had an N to NaCl mass ratio of 1:0.7 but
increased to 1:0.9 due to a decrease in N probably from volatilization losses. Germer et al.
(2011) reported a 1:1.4 N to NaCl mass ratio in Ghana while in Nepal it was estimated at 1:1.6
(Etter et al., 2011). This implies that with the application of 50 kg of urine-N ha-1 of the urine
used in this study will result in the addition of 45 kg of NaCl which is lower than the 70 kg and
80 kg in Ghana or Nepal respectively if the same amount of urine N were to be applied as
fertilizer. Therefore, the risk of soils turning saline and/or sodic due to urine fertilization
depends largely on the N to NaCl ratio and should be considered in urine fertilization
planning.

Urine as a fertilizer under saline conditions
92
The idea of urine fertilized soils becoming saline or sodic is inseparable due to the fact that
while salinity is the concentration of soluble salts, sodicity is a measure of the concentration
of Na+ relative to Ca2+ and Mg2+ (van de Graaf and Petterson, 2001). Sodic soils generally have
lower soluble salt concentration (ECe < 4 dS m-1) than saline soils (Table 6.1) and have a
characteristic particles dispersion which often results in a poor structure of sodic soils making
it difficult for water to infiltrate and plant roots to penetrate the soil (Robbins and Gavlak,
1989). Unlike most commercial fertilizer formulations, urine has a high concentration of Na+.
In spite of the high amount of Na+ added with urine to the cultivation substrate in this study,
exchangeable Na+ concentration was not affected by urine fertilization when compared with
NH4+NO3
- (chapter 2). However, it increased during two cycles of urine application (chapter 4)
indicating that the effect is additive. Most of the applied N remained in the soil substrate in a
water soluble form and represents the fraction that is susceptible to leaching during high
rainfall under field conditions. This represents an environmental threat especially during a
long dry period in semiarid and arid areas when Na+ salts could be drawn back to the surface
through capillary rise (Kielen et al., 1996).
Table 6.1: Chemical parameters defining salt- and sodium-affected soils (Adapted from van de Graaf
and Petterson 2001)
Salinity class ECe dS m-1
ESP SAR pH
Normal soil < 4.0 < 15 < 13 < 8.3 Saline soil > 4.0 < 15 < 13 < 8.3 Saline-sodic soil > 4.0 > 15 > 13 < 8.3 Sodic soil < 4.0 > 15 > 13 > 8.3
ECe = electrical conductivity, ESP = exchangeable sodium percentage, SAR = sodium adsorption ratio
The concentration of Na+ in urine is many times higher than that of Ca2+ and Mg2+. However,
though in small amounts the content of Ca2+ and Mg2+ can contribute to offset the potential
risk of soils becoming sodic as was assumingly the case in this study. Furthermore, the high
concentration of Ca2+ in the cultivation substrate used diluted the effect of sodicity issuing
from urine fertilization. The addition of SO43- through urine fertilization induced the release of
tied up Ca2+ in the substrate, increasing its solubility and reducing any potential sodicity build
up due to urine application (McCauley and Jones, 2005). The pH values remained within the
neutral range which is below the benchmark of 8.3 units necessary for soils to be classified as
sodic (Abrol et al., 1988; Robbins and Gavlak, 1989). Therefore, under the conditions of the
current study, salinity proved to be a greater threat than sodicity.
Urine as a fertilizer under saline conditions
93
There was a strong positive correlation between N fertilization and biomass yield regardless
of NaCl salinity treatment. However, compared to ammonium nitrate, there was a weak
relationship between tissue nitrogen concentration and biomass accumulation of urine-
treated sorghum plants (chapter 3). No evidence of additional nutrients through urine was
found that should justify higher biomass accumulation in sorghum plants suggesting a synergy
between two or more nutrients (e. g. Ca and K) other than nitrogen as reported by Jafari et al.
(2009). It was further shown in this study that the effect of N source on use efficiency
depends on the level of salinity (chapter 3). The critical limit for an efficient use of urine-
supplied nitrogen was exceeded at NaCl salinity of 7.6 dS m-1 indicating that it will be unwise
to fertilize with urine at this level of salinity.
For urine to become a more desirable fertilizer option in saline conditions, measures must be
introduced to reduce salinity resulting from urine application. Beler-Baykal et al. (2011) have
suggested that by using clinoptilolite, ammonium can be removed from stored urine and the
product used as a fertilizer. The weakness with this approach is the loss of other nutrients
contents of urine. In this study, it was opined that the salinity and Na tolerance of crops
under urine fertilization can be enhanced by improving soil K+/Na+, Ca2+/Na+ and Mg2+/Na+
balance in the soil through wood ash application. Results showed that wood ash (150 mg kg-1
soil) with or without urine improved Na+ and salinity tolerance of young maize plants which
was related to the increase in K+ and Ca2+ availability (chapter 5). This effect was not evident
at NaCl treatment of ECe 9.6 dS m-1 and when the amount of urine-N added to wood ash rose
from 75 to 150 mg kg-1 soil which could be related to an increase in salinity induced by urine
application. This suggests that the tolerance enhancing effect of wood ash which was
proposed as a temporal measure can also be limited by urine salinity.
All in all, urine is a highly salty fertilizer and it is not wise to apply high amounts under saline
(NaCl) conditions. Under such conditions the local recommendation for N fertilizer especially
NH4+NO3
- cannot be adopted for urine. Rather, the decision to use urine and in what amounts
should be determined from an evaluation of the risk and benefits that will accrue and urine
should be applied only when it reasonably increases yields. The nutrient requirement of the
crop to be fertilized, its salt tolerance behaviour and the salt supply power of urine should be
taken into consideration. This research stresses the need to develop a urine management
system apt for crop, climate and soil salinity and exchangeable sodium conditions. This can be

Urine as a fertilizer under saline conditions
94
achieved constructing a model that assists in the prediction of urine fertilizer effect under
different salinity levels, climate and crop type.
6.1 Limitations of this study and implication for future research
The conclusions drawn from this study should be interpreted within the following limitations.
Firstly, NaCl was used as the only salt for salinization meanwhile in the natural environment
though Na+ is usually the dominant cation and Cl- the dominant anion, soils contain a mixture
of salts and vary depending on the parent rock from which they are formed. Secondly, due to
limited time and other resources maize and sorghum which are field crops were grown in
pots. Though pot sizes were considerably large, root-bounding was observed in pots where
plant growth was more vigorous. Thirdly, regular water supply was assumed in this study
which can be obtained only under irrigated systems. This notwithstanding, the water used
was portable water which is very costly in semiarid and arid countries of the world where salt
affected soil abound.
6.2 References
Abrol, I.P., J.S.P. Yadav and F.I. Massoud (eds.) 1988. Salt-affected soils and their
management. Soil Bulletin 39 ed. Food and Agricultural Organization of the United
Nations, Rome, Italy.
Bar, Y., A. Apelbaum, U. Kafkafi and R. Goren. 1997. Relationship between chloride and
nitrate and its effect on growth and mineral composition of avocado and citrus plants.
Journal of Plant Nutrition 20:715-731.
Beler-Baykal, B., A.D. Allar and S. Bayram. 2011. Nitrogen recovery from source-separated
human urine using clinoptilolite and preliminary results of its use as fertilizer. Water
Science and Technology 63:811-817.
Bernstein, L., L.E. Francois and R.A. Clark. 1974. Interactive effects of salinity and fertility on
yields of grains and vegetables. Agronomy Journal 66:412-421.
Bybordi, A., J. Tabatabaei and A. Ahmadov. 2009. Effects of salinity and NO3:NH4 ratio on yield
and quality in canola (Brassica napus L.). Notulae Scientia Biologicae 1:67-72.
Esmaili, E., S.A. Kapourchal, M.J. Malakouti and M. Homaee. 2008. Interactive effect of
salinity and two nitrogen fertilizers on growth and composition of sorghum. Plant Soil
and Environment 54:537-546.
Urine as a fertilizer under saline conditions
95
Etter, B., E. Tilley, R. Khadka and K.M. Udert. 2011. Low-cost struvite production using source-
separated urine in Nepal. Water Research 45:852-862.
Feigin, A. 1985. Fertilization management of crops irrigated with saline water. Plant and Soil
89:285-299.
Flores, P., M. Carvajal, A. Cerdá and V. Martínez. 2001. Salinity and ammonium/nitrate
interactions on tomato plant development, nutrition and metabolites. Journal of Plant
Nutrition 24:1561-1573.
Germer, J., S. Addai and J. Sauerborn. 2011. Response of grain sorghum to fertilisation with
human urine. Field Crops Research 122:234-241.
Iglesias, D.J., Y. Levy, A. Gómez-Cadenas, F.R. Tadeo, E. Primo-Millo and M. Talon. 2004.
Nitrate improves growth in salt-stressed citrus seedlings through effects on
photosynthetic activity and chloride accumulation. Tree Physiology 24:1027-1034.
Irshad, M., S. Yamamoto, A. Eneji, T. Endo and T. Honna. 2002. Urea and manure effect on
growth and mineral contents of maize under saline conditions. Journal of Plant Nutrition
25:189-200.
Jafari, M. S. H., M. Kafi and A. Asteraie 2009. Interactive effects of NaCl induced salinity
calcium and potassium on physiomorphologic traits of sorghum (Sorghum bicolor L.)
Pakistan Journal of Botany 41:3053-3063.
Kielen, N.C., M. Aslam, R. Khan and M. Kuper. 1996. Salinity and sodicity effects on soils and
crops in the chistian sub-division: Documentation of a restitution process. Report N° 07.
International Irrigation Management Institute, Lahore, Pakistan.
McCauley, A. and C. Jones. 2005. Salinity and sodicity management. Soil and Water
Management Module 2. Montana State University, Extension Service. Montana, USA. Pp
1-16.
Nathawat, N.S., M.S. Kuhad, C.L. Goswami, A.L. Patel and R. Kumar. 2007. Interactive effects
of nitrogen source and salinity on growth indices and ion content of indian mustard.
Journal of Plant Nutrition 30:569-598.
Pescod, M.B. 1992. Wastewater treatment and use in agriculture - FAO irrgation and drainage
paper 47. Rep. 47. Food and Agricultural Organisation of the United Nations (FAO),
Rome, Italy.
Reddy, B.V.S., A. Ashok Kumar, P. Sanjana Reddy, M. Ibrahim, B. Ramaiah and Dakheel, A. J.,
Ramesh S and Krishnamurthy L. 2010. Cultivar options for salinity tolerance in sorghum.
Journal of SAT Agricultural Research 8:1-5.

Urine as a fertilizer under saline conditions
96
Robbins, C.W. and R.G. Gavlak. 1989. Salt- and sodium affected soils. Rep. Bulleting No. 703.
USDA, Cooperative Extension Service - University of Idaho, Idaho, USA.
van de Graaf, R. and R.A. Petterson. 2001. Explaining the mysteries of salinity, sodicity, SAR
and ESP in on-site practice. p. 361-368. In R.A. Patterson and M.J. Jones (eds.)
Proceedings of on-site '01 conference: Advancing on.site wastewater systems. Lanfax
laboratories Armidale NSW Australia, Armidale NSW Australia.
Villa-Castorena, M., A.L. Ulery, E.A. Catalán-Valencia and M.D. Remmenga. 2003. Salinity and
nitrogen rate effects on the growth and yield of chile pepper plants. Soil Science Society
of America Journal 67:1781-1789.
Urine as a fertilizer under saline conditions
97
Summary
Soil salinity and nutrients deficiency are jointly responsible for low agricultural production in
many parts of the world. With a still growing world population and a continuing pressure on
arable land, there is need to increase the productivity of salt affected soils. It is known that
the application of N fertilizer can mitigate the deleterious effects of salinity on crop growth
but this beneficial effect depends on the source of nitrogen and the extent of soil salinity.
Whereas commercial inorganic fertilizers are expensive and often inaccessible to poor
farmers especially in developing countries, human urine is an alternative low-cost fertilizer
which, if collected and used, can replace up to 20% of current world fertilizer consumption.
Its efficacy to increase crop productivity has been validated in scientific experiments.
However, the high concentration of soluble salts (especially Na and Cl) in urine may impose a
restriction on its use under saline and/or sodic conditions.
The research presented in this thesis investigates the extent to which urine can be used as a
fertilizer under saline/sodic conditions. It compares the effect of urine and ammonium
nitrate-N sources on nutrients accumulation and growth of maize and sorghum plants in
NaCl-saline substrate under controlled environmental conditions. Additionally, the effect of
urine fertilization on changes in substrate chemical composition was investigated. Due to the
high content of K, Ca and Mg in wood ash which can improve the soil cationic balance in salt
affected soils, it was further investigated whether or not supplemental wood ash application
can enhance salt- and Na-tolerance of urine-fertilized maize plants.
Regardless of NaCl salinity treatment, no significant difference in investigated growth factors
(height, leaf area and shoot biomass accumulation) of maize plants was measured when N
was supplied at 180 mg kg-1 cultivation substrate as urine or ammonium nitrate. Meanwhile,
urine treated maize plants produced comparatively less shoot biomass following the
application of 380 mg N kg-1 of cultivation substrate and at NaCl salinities of 4.6 and 7.6 dS m-
1. As expected, sorghum plants were more tolerant to salinity than maize and produced more
biomass under urine than ammonium nitrate fertilization. Though there was a positive
relationship between biomass yield and tissue nitrogen concentration regardless of salinity
treatment level, this relationship was stronger for ammonium nitrate than urine treatments.
Ca and Mg concentration in the tissue of urine-fed maize and sorghum plants was higher than

Urine as a fertilizer under saline conditions
98
those treated with ammonium nitrate which can be explained by the inherent content of
these nutrients in urine. However, there was no direct relationship with biomass yield of
maize plants of either nutrient.
Additionally, urine fertilization significantly increased substrate salinity by 2 to 3-fold.
Substrate sodium concentration and a tendency towards mounting sodicity with an increase
in urine fertilization were also observed. At a NaCl-salinity of ECe 4.2 dS m-1, the application of
wood ash (150 mg kg-1 soil) alone or in combination with 75 mg urine-N kg-1 soil fostered Na
and salinity tolerance of maize which can be explained by the dilution effect of K and Ca
supplied through wood ash. However, at a higher urine-N dosage (150 mg kg-1 soil) with or
without wood ash enrichment growth inhibition occurred indicating that the tolerance
threshold had been exceeded assumingly due to urine-induced increase in Na and salinity.
It was demonstrated that urine can substitute ammonium nitrate as a source of nitrogen for
maize and sorghum and can be considered for fertilization if salinity does not exceed ECe 4.0
dS m-1. Due to urine-induced increase in salinity and Na concentration in the growing
medium, regular monitoring for salt build up and the use of salt-tolerant crop varieties should
be included in urine fertilizer planning. It was further demonstrated that supplemental wood
ash enhances Na and salinity tolerance and where necessary should be incorporated in urine-
fertilizer programs.

Urine as a fertilizer under saline conditions
99
Zusammenfassung
In weiten Teilen der Erde sind sowohl der hohe Salzgehalt des Bodens als auch die mangelnde
Versorgung mit Nährstoffen mitverantwortlich für niedrige Erträge aus der
landwirtschaftlichen Produktion. Eine weiter zunehmende Weltbevölkerung und der damit
verbundenen steigenden Nachfrage nach biobasierten Produkten aus der Landwirtschaft
verlangt nach einer Erhöhung der Produktivität auch von salzhaltigen Böden.
Stickstoffdüngung kann bekanntermaßen die negativen Effekte einer Bodenversalzung auf
das Wachstum von Nutzpflanzen verringern. Dies wiederum ist stark abhängig von der
Stickstoffform und dem Ausmaß der Bodenversalzung.
Eine kostengünstige Alternative zu den mineralischen Düngern, die für Landwirte in vielen
Entwicklungsländern oft schwer zugänglich und teuer sind bietet Urin menschlicher Herkunft.
Dieser könnte bis zu 20% des weltweiten Düngemittelbedarfs decken. Die Wirksamkeit von
Urin zur Steigerung der Produktivität von Nutzpflanzen wurde in verschiedenen
wissenschaftlichen Experimenten belegt. Die hohe Konzentration von löslichen Salzen im
Urin, insbesondere von Natrium und Chlor, kann eine Einschränkung bei der Nutzung
menschlichen Urins unter salzhaltigen und/oder natriumhaltigen Bedingungen darstellen.
Die hier vorgestellte Forschungsarbeit beschäftigt sich mit der Fragestellung in welchem
Ausmaß Urin als Düngemittel auf versalzten und/oder natriumhaltigen Böden genutzt werden
kann. Die Auswirkungen von Urin im Vergleich zur Ammonium-Nitrat-Düngung werden im
Hinblick auf die Nährstoffakkumulation und das Wachstum von Mais und Sorghum auf
salzhaltigem (NaCl) Substrat unter kontrollierten Umweltbedingungen untersucht. Zusätzlich
dazu wird der Einfluss von Urindüngung auf die chemische Zusammensetzung des
Bodensubstrats erfasst. Ein weiterer Schwerpunkt dieser Arbeit liegt in der Untersuchung des
Einsatzes von Holzasche zur Verbesserung der Salz- und Natriumtoleranz von Maispflanzen
unter Bedingungen einer Urindüngung. Durch den hohen Gehalt an Kalium, Calcium und
Magnesium kann diese das Kationengleichgewicht in salzhaltigen Böden verbessern.
Bei einer Stickstoffgabe von 180 mg kg-1 Kultursubstrat konnte weder bei Urin noch bei
Ammonium-Nitrat als Stickstoffquelle ein signifikanter Unterschied der untersuchten
Parameter (Wuchshöhe, Blattfläche und Sprossbiomasse) bei unterschiedlichen
Salzkonzentrationen im Boden festgestellt werden. Bei Stickstoffgaben von 380 mg kg-1

Urine as a fertilizer under saline conditions
100
Substrat und einer NaCl-Salinität von 4,6-7,6 dS m-1 wurde vergleichsweise weniger
Sprossbiomasse bei urinbehandelten Maispflanzen erzielt. Wie erwartet zeigten
Sorghumpflanzen eine höhere Salztoleranz als Mais und produzierten unter Urinbehandlung
mehr Biomasse als unter Ammonium-Nitrat-Düngung. Es konnte eine positive Beziehung von
Biomasseertrag und Stickstoffkonzentration im Gewebe festgestellt werden und dies
unabhängig von der Salinitätsbehandlung. Dieser Effekt war jedoch deutlicher ausgeprägt
unter Ammonium-Nitrat-Düngung. Die Gehalte an Calcium und Magnesium waren im
Gewebe von urinbehandeltem Mais und Sorghum höher als bei den Behandlungen mit
Ammonium-Nitrat. Dies lässt sich über den naturgegebenen Gehalt dieser Nährstoffe im Urin
erklären. Allerdings ließ sich keine direkte Beziehung zwischen dem Biomasseertrag von
Maispflanzen und einem der beiden Nährstoffe zeigen.
Die Düngung mit Urin erhöhte die Salinität des Kultursubstrats um das zwei- bis dreifache.
Zusätzlich konnte eine Anreicherung des Substrats mit Natrium und eine Tendenz zur
Natrium-Übersättigung bei steigender Urinkonzentration beobachtet werden. Bei einer durch
NaCl bedingten Salinität von ECe 4,2 dS m-1 führte die Beimengung von Holzasche (150 mg pro
kg Boden), allein oder in Kombination mit 75mg Urin-Stickstoff pro kg Boden zu einer
verstärkten Toleranz von Mais gegenüber Natrium und Salinität. Dies kann durch den
Verdünnungseffekt erklärt werden, der durch die in der Holzasche enthaltenen Kalium- und
Calcium-Ionen eintritt. Nichtsdestotrotz konnte ab einer Stickstoffgabe aus Urin (150 mg kg-1
Boden) eine Wachstumshemmung festgestellt werden, unabhängig von erfolgter oder nicht
erfolgter Holzaschebeimengung. Dies deutet auf die Überschreitung eines Grenzwertes bei
der Toleranz gegenüber Natriumkonzentration und Salinität im Boden hin.
Mit dieser Arbeit konnte gezeigt werden, dass Urin Ammonium-Nitrat als Stickstoffquelle bei
der Düngung von Mais und Sorghum substituieren kann, insbesondere solange die
Salinitätsbedingungen ECe 4,0 dS m-1 nicht überschreiten. Aufgrund der urininduzierten
Zunahme an Na-Konzentration und Salinität des Bodens sollten diese Standorte regelmäßig
auf ihren Salzgehalt hin untersucht werden. Auch sollten salztolerante Kulturpflanzen in einen
Bewirtschaftungsplan mit Urindüngung eingebunden werden. Es wurde außerdem gezeigt
dass die Beimengung von Holzasche die Toleranz von Nutzpflanzen gegenüber Natrium und
Salinität verbessern kann. Bei Bedarf sollte die Ausbringung von Holzasche in urinbasierte
Düngungsprogramme integriert werden.

Urine as a fertilizer under saline conditions
101
Résumé
La salinité du sol et la carence d'éléments nutritifs sont conjointement responsables de la
faible production agricole dans de nombreuses régions du monde. Avec une population
mondiale toujours croissante et une pression continue sur les terres arables, il est nécessaire
d’augmenter la productivité des sols salins. L’application d'engrais azoté peut atténuer les
effets néfastes de la salinité sur la croissance des cultures. Toutefois, cet effet bénéfique
dépend de la source d'azote et de l'étendue de la salinité des sols.
Alors que les engrais inorganiques commerciaux sont coûteux et souvent inaccessibles aux
agriculteurs pauvres en particulier dans les pays en développement, l'urine humaine est un
engrais alternatif à faible coût. En effet, recueillie et utilisée, l’urine humaine peut remplacer
jusqu'à 20% de la consommation actuelle mondiale d’engrais. Son efficacité à augmenter la
productivité des cultures a été validée par des expériences scientifiques. Cependant, la forte
concentration de sels solubles (surtout Na et Cl) dans les urines peut imposer une restriction
sur son utilisation dans des conditions salines et/ou sodiques.
La recherche présentée dans cette thèse examine l’étude de l’utilisation de l'urine comme
engrais dans des conditions salines et/ou sodiques. Il compare l'effet d'urine et du nitrate
d'ammonium (sources d’azote) sur l’accumulation des nutriments et sur la croissance des
plants de maïs et de sorgho dans un substrat saline NaCl. Les conditions environnementales
de cette étude ont été contrôlées. En outre, l’effet de la fertilisation de l'urine sur les
changements dans la composition chimique du substrat a été étudié. En raison de la forte
teneur en K, Ca et Mg dans la cendre de bois qui peut améliorer l'équilibre cationique dans les
sols salins, il a été aussi examiné si l'application supplémentaire de la cendre de bois peut
améliorer la tolérance en sel et Na des plants de maïs traités à l'urine.
Indépendamment du traitement de la salinité NaCl, aucune différence significative en
facteurs de croissance étudiés (hauteur, surface foliaire, accumulation de la biomasse des
pousses) des plants de maïs a été mesurée lorsque N a été fournie à 180 mg kg-1 de substrat
de culture sous forme d'urine ou du nitrate d’ammonium. Pendant ce temps, les plants de
maïs traités à l’urine produisent relativement moins de biomasse des pousses après
l'application de 380 mg N kg-1 de substrat de culture et à des salinités de NaCl 4,6 et 7,6 dS m-
1. Comme prévu, les plants de sorgho étaient plus tolérants à la salinité que les plants de

Urine as a fertilizer under saline conditions
102
maïs. En outre, les plants de sorgho produisaient plus de biomasse lorsqu’elles étaient
traitées à l'urine qu’au nitrate d’ammonium. Bien qu'il y ait une relation positive entre le
rendement de la biomasse et de la concentration en azote des tissus indépendamment du
niveau de traitement de la salinité, cette relation a été plus forte pour le nitrate d'ammonium
que pour les traitements à l'urine. La concentration en Ca et Mg dans le tissus de plants de
sorgho et de maïs traité avec l’urine était plus élevée que celle des tissus traités avec du
nitrate d’ammonium. Ce qui peut s'expliquer par le contenu intrinsèque de ces nutriments
dans l'urine. Cependant, il n'y avait pas de relation directe entre le rendement en biomasse
des plants de maïs avec un autre nutriment.
En outre, la fertilisation à l’urine a significativement augmenté la salinité du substrat de deux
à trois fois. On a également observé une concentration de sodium de substrat et une
tendance croissante de la teneur en sodium avec une augmentation de la fertilisation à
l'urine. Lors d'une salinité NaCl de ECe 4.2 dS m-1, l'application de la cendre de bois (150 mg
kg-1), seul ou en combinaison avec 75 mg d'urine-N kg-1 de sol favorise la tolérance en Na et à
la salinité du maïs qui peut être expliquée par l'effet de dilution de K et Ca fourni par la
cendre de bois. Cependant, avec un dosage d'urine N supérieur (150 mg kg -1 de sol) avec ou
sans cendre de bois, l’inhibition de la croissance a eu lieu indiquant que le seuil de tolérance
de l'enrichissement a été dépassé probablement dû à l'augmentation de la salinité et Na
induites par l’urine.
Il a été démontré que l'urine peut se substituer au nitrate d'ammonium comme source
d'azote pour le maïs et le sorgho et peut être considérée pour la fertilisation des sols si la
salinité ne dépasse pas ECe 4.0 dS m-1. En raison de l'augmentation de la salinité et la
concentration de Na dans le milieu de culture grâce à l’urine, un suivi régulier de
l’accumulation en sel et de l'utilisation de variétés tolérantes au sel devrait être inclus dans le
projet d’utilisation d’urine comme engrais. Il a également été démontré que l’emploi
supplémentaire de la cendre de bois améliore la tolérance en Na et en salinité et le cas
échéant, devrait être intégré dans les programmes d'urine comme engrais.
Urine as a fertilizer under saline conditions
103
PERSONAL DATA
Date/Place of Birth : March 18th, 1975/Buea – Cameroon
Civil status : Married
Spouse : Esther Eneckeh Enowashu
Daughter : Afû’ambom Akongenow Yongha-Boh
Current address : Paracelsusstr. 87a; D-70599 Stuttgart
Tel.: +49 176 8847 3869
E-mail: [email protected]
RESEARCH INTERESTS
Nutrients recycling, composting, sanitizing human excreta, soil salinity, urine fertilizer
management, ecological sanitation, human excreta and wastewater use in agriculture.
EDUCATION
04/2009 – Doctoral fellow. Institute of Plant Production and Agroecology in the Tropics and Subtropics. Faculty of Agricultural Sciences, University of Hohenheim, Germany.
10/2005 – 01/ 2008 Graduate student. University of Hohenheim, Germany. MSc. thesis title: Optimising faecal sludge co-composting in semiarid Tropics. Agroecology in the Tropics and Subtropics Funded by Eiselen Foundation, Ulm and BMZ, Germany.
10/1998 – 07/2001 Undergraduate student. Department of Geography, University of Buea, Cameroon. BSc. dissertation title: Upland farming in Njinikom Subdivision, Department of Geography.
10/1991 – 06/1993 High school Student. Government High School (GHS), Mbengwi, Cameroon. Certificate obtained: GCE Advanced Level.
09/1986 – 06/1991 Secondary school studies. Kom Secondary Grammar School (KSGS), Njinikom, Cameroon. Certificate Obtained: GCE Ordinary Level.
TRAINING AND EMPLOYMENT
08/2012 – present Scientific assistant/graduate instructor. Institute of Plant Production and Agroecology in the Tropics and Subtropics. University of Hohenheim, Germany.
CURRICULUM VITAE
Michael Yongha BOH, M.Sc.

Urine as a fertilizer under saline conditions
104
08/2008 – 03/2009 Research associate. Project: Efficiency of different sanitization methods on nutrients preservation and pathogen destruction in faecal matter. Agroecology in the Tropics and Subtropics, University of Hohenheim, Germany. Funded by BMZ.
01/2007 – 05/2008 Trainee. Advanced International Training course on Ecological Alternatives to Sanitation, Phase I, II & III: Sweden, Hohenheim (Germany), Durban & Kimberley, South Africa. Sponsor: Swedish International Development Agency (SIDA) and Stockholm Environmental Institute (SEI).
09/2001 – 09/2005 Teaching associate. Geography Department, Saint Joseph’s College, Sasse. Diocese of Buea, Cameroon.
09/1996 – 09/1998 Teacher of primary 4 and 5 at Saint Anthony’s Catholic School Buea Town. Diocese of Buea, Cameroon.
07/1993 – 07/1994 Marketing agent for Growth Product Enterprise (GPE). Dealer in Soya bean products. Bamenda Commercial Avenue, Cameroon.
PUBLICATIONS
Boh, M. Y., Germer, J., Torsten, M. & Sauerborn, J. (2013). Comparative effect of human urine and ammonium nitrate application on maize (Zea mays L.) grown under various salt (NaCl) concentrations. Journal of Plant Nutrition and Soil Science. DOI: 10.1002/jpln.201200486.
Boh, M. Y., Müller, T. & Sauerborn, J. (2013). Maize (Zea mays L.) response to urine and wood ash fertilization under saline (NaCl) soil concentrations. International Journal of AgriScience 3(4): 333-345.
Boh, M. Y., Ngongang Yonkio, S. C., Müller, T. & Sauerborn, J. (2011). Effect of urine and ammonium nitrate rate on maize (Zea mays L.) grown on saline and non-saline soils. Proceedings of the Conference of International Research on Food Security, Natural resource Management and Rural Development. “Development on the Margins” – Bonn, Germany Oct. 5 – 7, 2011.
Germer, J., Boh, M. Y., Schoeffler, M. & Amoah, P. (2010). Temperature and deactivation of microbial faecal indicators during small scale co-composting of faecal matter. Waste Management 30(2): 185-191.
Germer, J., Boh, M. Y. & Sauerborn, J. (2008). Efficiency of different sanitization methods on nutrient preservation and pathogen destruction in faecal matter: Report on ongoing research in Ghana. Proceedings of the International Symposium on Sustainable Sanitation and Groundwater Protection, Hannover, Germany, 14 – 17 October, 2008.
Germer, J., Boh, M. Y. & Sauerborn, J. (2007). Co-composting as a disposal solution for faecal sludge from innovative pit latrines. Proceedings of the Conference of International Research on Food Security, Natural resource Management and Rural Development. Witzenhausen, Germany Oct. 9 – 11, 2007.

Urine as a fertilizer under saline conditions
105
ADDITIONAL SKILLS Languages : Fluent in spoken and written English : Working knowledge in French : Basic German knowledge : Fluent in spoken and written Itanghikom Computer : Good knowledge of MS word, excel and PowerPoint
SOCIAL AFFILIATION Cameroonians’ Student Union Hohenheim (CASUH) e. V KomGermany e. V Veterans Football Club (VFC) Stuttgart e. V
Stuttgart, 30th September 2013 Michael Yongha BOH