Embed Size (px)
Citation preview

SANDIA REPORT SAND2007-3580 Unlimited Release Printed June 2007
Installation of the First Distributed Energy Storage System (DESS) at American Electric Power (AEP) A Study for the DOE Energy Storage Systems Program Ali Nourai Prepared by Sandia National Laboratories Albuquerque, New Mexico 87185 and Livermore, California 94550 Sandia is a multiprogram laboratory operated by Sandia Corporation, a Lockheed Martin Company, for the United States Department of Energy’s National Nuclear Security Administration under Contract DE-AC04-94AL85000. Approved for public release; further dissemination unlimited.

2
Issued by Sandia National Laboratories, operated for the United States Department of Energy by Sandia Corporation. NOTICE: This report was prepared as an account of work sponsored by an agency of the United States Government. Neither the United States Government, nor any agency thereof, nor any of their employees, nor any of their contractors, subcontractors, or their employees, make any warranty, express or implied, or assume any legal liability or responsibility for the accuracy, completeness, or usefulness of any information, apparatus, product, or process disclosed, or represent that its use would not infringe privately owned rights. Reference herein to any specific commercial product, process, or service by trade name, trademark, manufacturer, or otherwise, does not necessarily constitute or imply its endorsement, recommendation, or favoring by the United States Government, any agency thereof, or any of their contractors or subcontractors. The views and opinions expressed herein do not necessarily state or reflect those of the United States Government, any agency thereof, or any of their contractors. Printed in the United States of America. This report has been reproduced directly from the best available copy. Available to DOE and DOE contractors from U.S. Department of Energy Office of Scientific and Technical Information P.O. Box 62 Oak Ridge, TN 37831 Telephone: (865) 576-8401 Facsimile: (865) 576-5728 E-Mail: [email protected] Online ordering: http://www.osti.gov/bridge Available to the public from U.S. Department of Commerce National Technical Information Service 5285 Port Royal Rd. Springfield, VA 22161 Telephone: (800) 553-6847 Facsimile: (703) 605-6900 E-Mail: [email protected] Online order: http://www.ntis.gov/help/ordermethods.asp?loc=7-4-0#online

3
SAND2007-3580
Unlimited Release Printed June 2007
Installation Of The First Distributed Energy
Storage System (DESS) At American Electric Power (AEP)
A Study for the DOE Energy Storage Systems Program
Ali Nourai, Technology Consultant Distribution Engineering
American Electric Power Company 1 Riverside Plaza
Columbus, OH 43215
Abstract AEP studied the direct and indirect benefits, strengths, and weaknesses of distributed energy storage systems (DESS) and chose to transform its entire utility grid into a system that achieves optimal integration of both central and distributed energy assets. To that end, AEP installed the first NAS battery-based, energy storage system in North America. After one year of operation and testing, AEP has concluded that, although the initial costs of DESS are greater than conventional power solutions, the net benefits justify the AEP decision to create a grid of DESS with intelligent monitoring, communications, and control, in order to enable the utility grid of the future. This report details the site selection, construction, benefits and lessons learned of the first installation, at Chemical Station in North Charleston, WV.

4
Acknowledgements This project could not have succeeded without the diligent support of many individuals, a great number of whom worked through weekends and even holidays to assure a successful project. The number of individuals is too great to enumerate, but they are recognized in the following groups: Employees of American Electric Power and Appalachian Electric Power, its subsidiary in West Virginia, for team support at all levels of management, planning, engineering, and field support. Employees of NGK Insulators LTD, for providing the batteries and technical support. Employees of Technology Insight, Inc. for representing NGK and providing support at all levels of the project. Employees of S&C Electric Co. for providing PCS and overall system integration. Employees of Kanawha Manufacturing Co. for providing the battery enclosures. Employees of the US DOE Energy Research Program and SANDIA National Laboratories for providing partial funding to offset non-repeat expenses of this project.

5
Table of Contents INTRODUCTION ....................................................................................................... 7 BACKGROUND....................................................................................................... 11
DESS and the AEP Vision of a Future Grid .....................................................................................11 Long-Term and Short-Term Benefits of Energy Storage .................................................................12 Values of Energy Storage ................................................................................................................14 Value of a Readily Available Solution (RAS) ...................................................................................15 Energy Storage Requirements and Options ....................................................................................17
SITE SELECTION ................................................................................................... 21 Chemical Station, Charleston, W. Virginia .......................................................................................22 Site Acceptance Tests for the DESS ...............................................................................................26
NAS BATTERIES.................................................................................................... 29 Battery Description, Packaging and Transportation.........................................................................29 Battery Enclosures ...........................................................................................................................30 Site Preparation................................................................................................................................32 Installation of the Batteries...............................................................................................................33
POWER CONVERSION SYSTEM (PCS) FOR THE DESS .................................... 37 DESS TESTING PROCEDURES ............................................................................ 41 COSTS OF INSTALLATION ................................................................................... 43 PERFORMANCE & ANALYSIS: FIRST YEAR....................................................... 45 LESSONS LEARNED / CONCLUSIONS ................................................................ 49
Operations / Construction / Deployment ..........................................................................................49 Contractual Partnerships .................................................................................................................49 Shipping...........................................................................................................................................49 Battery Enclosures...........................................................................................................................49 Energy Savings ................................................................................................................................50
REFERENCES ........................................................................................................ 51 List of Figures Figure 1 – Contractual relationships among entities during deployment. ................................ 8 Figure 2 – AEP vision of a future, U.S. power system with integrated.................................. 11 Figure 3 – Impact of energy storage on DG rating. ................................................................ 12 Figure 4 – Summer daily load factors - AEP & US average. [6]............................................ 13 Figure 5 – Multiple benefits of energy storage on long feeder lines, ..................................... 13 Figure 6 – Short-term & long-term benefits of DESS from a power utility perspective........ 14 Figure 7 – Preferred locations of distributed energy storage units on a utility grid. .............. 14 Figure 8 – Size of distribution upgrade projects at different RAS values. ............................. 17 Figure 9 – Relative feasibility scores of high-energy storage technologies ........................... 19 Figure 10 – AEP's 100kW, 7.2 hr / 300kW, 30s NAS battery with 500kVA PCS installed in Gahanna, OH........................................................................................................................... 20 Figure 11 – One-line diagram of the Chemical Distribution Substation in Charleston WV, with a photo of its overloaded voltage regulator and transformer. ......................................... 23 Figure 12 – Annual load pattern at W. Washington St. of one of the 12 kV feeders supplied by the stressed transformer ..................................................................................................... 23 Figure 13 – Top View diagram of the N.E. Corner of Chemical Station; showing the.......... 24 Figure 14 – Photographs of AEP's Chemical Substation before & after installation ............. 25

6
Figure 15 – Load profile of W. Washington St. feeder during summer 2005 ........................ 25 Figure 16 – Predefined discharge profiles based on different power levels & capacity......... 26 Figure 17 – A 50 kW, 360 kWh NAS Battery Module .......................................................... 29 Figure 18 – NAS battery modules were wrapped and protected in a wooden crate. Four such crates were located and secured inside each 40’ long shipping container. ............................. 29 Figure 19 – Ground transportation & delivery of shipping containers on air-ride flatbed trucks....................................................................................................................................... 30 Figure 20– Sketch of NAS battery Enclosures with battery controller enclosure on the side 31 Figure 21 – Manufacturing the battery enclosures at the Kanawha facility in Charleston (courtesy of KMC).................................................................................................................. 31 Figure 22 – Preparation of DESS foundation with conduits for all cable connections .......... 32 Figure 23 – Installation of the steel base under NAS battery enclosures ............................... 32 Figure 24 – Erection and setup of NAS battery enclosure on site .......................................... 33 Figure 25 – Installation of the battery control cabinet that contains the battery controller, battery data logger and disconnect switches........................................................................... 33 Figure 26– Delivery of NAS batteries to Chemical Station & their removal from containers34 Figure 27 – Installation of the NAS batteries with a specially constructed tool.................... 35 Figure 28 – Twenty NAS Batteries installed in four enclosures ............................................ 35 Figure 29 – Battery system enclosure at Chemical Station .................................................... 36 Figure 30 – Installation of PCS between the NAS battery and the step-up transformer ........ 37 Figure 31 – The 1.25 MVA, PureWave DESS PCS, and its key components ....................... 37 Figure 32 – Layout of a 1.2 MW, 7.2 MWh DESS at Chemical Station in Charleston ......... 38 Figure 33 – Connection of the DESS to a 12 kV feeder........................................................ 38 Figure 34– Layout of DESS and its PCS Master Controller with different data.................... 39 Figure 35 – Location of Antennas on PCS and in Control House for connection to SCADA40 Figure 36 – Display of charge/discharge profiles on the 12kV West Washington feeder during seven days of testing prior to scheduling DESS for automatic charge and discharge. 42 Figure 37 – First operational day; leveling the load of a distribution transformer ................ 42 Figure 38 – Major cost components for an installed NAS-based DESS ................................ 43 Figure 39 – Connection of Storage to a 12kV feeder at Chemical Station............................. 45 Figure 40 – Load leveling effect on three worst days............................................................. 45 Figure 41– Effect of load leveling on reducing transformer hotspot & top-oil temps .......... 46 Figure 42 – Impact of energy storage on flattening of the feeder load................................... 46 Figure 43– Feeder daily peaks with and without the (DESS)................................................. 47 Figure 44– Feeder load factor with and without the (DESS).................................................. 47 Figure 45 – Double discharge and its impact on the transformer load profile (Feb 6th,2007) 48 Figure 46 – Sample of daily PJM energy market value of the DESS at Chemical Station ... 50 Figure 47 – Monthly PJM energy market value of the DESS at Chemical Station................ 50 List of Tables Table 1 – Selected Values of Energy Storage on Distribution System................................... 15 Table 2 – AEP Specifications for Utility-Scale Distributed Energy Storage Systems ........... 18 Table 3 – Relative Feasibility Scores for Energy Storage Technologies................................ 19 Table 4 – AEP Stations Considered for Capacity Upgrade in 2006 ....................................... 21 Table 5 – Unscheduled Down Time of the DESS for the First Year of Operation ................ 48
7
INTRODUCTION AEP believes firmly that widely distributed energy storage systems (DESS) with intelligent monitoring, communications, and control will enable the power grid of the future. Therefore, in summer 2005, AEP chose to install the first 1.2 MW, NAS-based energy storage unit in the AEP power system (and in the US) at Chemical Station in North Charleston, WV. The Charleston Energy Storage Project that this report introduces is the initial step of an overall strategy to transform the AEP power system to meet energy demands of the future. It represents the genesis of a distributed energy storage initiative that is integral to AEP’s long-term vision of the electricity grid of the future:
A grid of distributed energy resources (DER) that achieves optimal integration of both central and distributed energy assets, thereby allowing unprecedented levels of control, utilization, efficiency, and reliability.
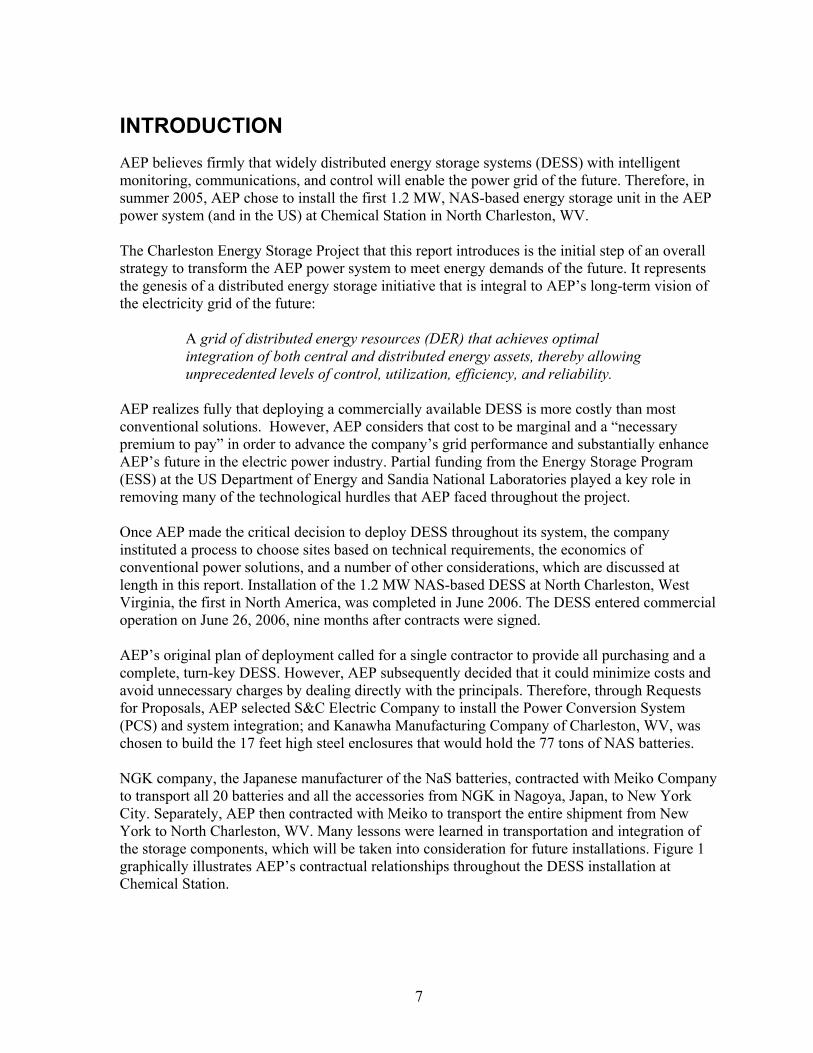
AEP realizes fully that deploying a commercially available DESS is more costly than most conventional solutions. However, AEP considers that cost to be marginal and a “necessary premium to pay” in order to advance the company’s grid performance and substantially enhance AEP’s future in the electric power industry. Partial funding from the Energy Storage Program (ESS) at the US Department of Energy and Sandia National Laboratories played a key role in removing many of the technological hurdles that AEP faced throughout the project. Once AEP made the critical decision to deploy DESS throughout its system, the company instituted a process to choose sites based on technical requirements, the economics of conventional power solutions, and a number of other considerations, which are discussed at length in this report. Installation of the 1.2 MW NAS-based DESS at North Charleston, West Virginia, the first in North America, was completed in June 2006. The DESS entered commercial operation on June 26, 2006, nine months after contracts were signed. AEP’s original plan of deployment called for a single contractor to provide all purchasing and a complete, turn-key DESS. However, AEP subsequently decided that it could minimize costs and avoid unnecessary charges by dealing directly with the principals. Therefore, through Requests for Proposals, AEP selected S&C Electric Company to install the Power Conversion System (PCS) and system integration; and Kanawha Manufacturing Company of Charleston, WV, was chosen to build the 17 feet high steel enclosures that would hold the 77 tons of NAS batteries. NGK company, the Japanese manufacturer of the NaS batteries, contracted with Meiko Company to transport all 20 batteries and all the accessories from NGK in Nagoya, Japan, to New York City. Separately, AEP then contracted with Meiko to transport the entire shipment from New York to North Charleston, WV. Many lessons were learned in transportation and integration of the storage components, which will be taken into consideration for future installations. Figure 1 graphically illustrates AEP’s contractual relationships throughout the DESS installation at Chemical Station.
8
Figure 1 – Contractual relationships among entities during deployment. The Charleston project offered unique opportunities for shaping a trilateral cooperation among AEP, NGK and S&C; and it became obvious to AEP during the installation that future installations would require the close collaboration of all parties during all phases of the project to ensure a successful deployment. Over the short term, the purpose of the Charleston Energy Storage Project is to mitigate current local capacity constraints and service reliability issues. The long term objective is to bring AEP one step closer to it’s vision of a storage-buffered grid of the future.
Kanawha Mfg Build & Deliver Battery
Enclosures
S&C Electric Co. • Design & build PCS• System integration
Meiko Battery Transportation
NGK Insulators • NAS Battery Mfg• Delivery to NY Port• On- site supervision
DOE/SANDIA Partial Funding • Owner/operator of Installation
• Overall project mgmt/supervision

9
Acronyms AEO Annual Energy Outlook Report AEP American Electric Power Company CAES Compressed Air Energy Storage DER Distributed Energy Resources DESS Distributed Energy Storage System DG Distributed Generation DOE Department of Energy EPRI Electric Power Research Institute ES Energy Storage KMC Kanawha Manufacturing Company L/A Lead Acid battery NAS Sodium (Na) sulfur (S) battery NGK NGK Insulators Ltd. NPV Net Present Value PCS Power Conversion System PQ Power Quality PS Peak Shaving PV Present Value RAS Readily Available Solution S&C S&C Electric Company T&D Transmission and Distribution VAR Volt Amp Reactive (Reactive Power) VRB Vanadium Redox Battery WV West Virginia ZnBr Zinc Bromine

10

11
BACKGROUND
DESS and the AEP Vision of a Future Grid
Customer-owned distributed generation (DG), both renewable and fossil-based, has already begun to appear on utility grids, and the forecast is that a much broader range of DG options will be available within the next five years [1,2]. The key drivers behind DG penetration are regulatory pressures (e.g. renewable portfolio standards), energy security, relatively short deployment lead times, and overall reduced risks. A grid with significant customer-owned DG penetration faces many operational challenges, including:
• Non-optimized location of generation, • Uncertain availability of generation, • Low reliability of available generation, • Inadequate dispatching or scheduling control over generation, and • Safety concerns with energy back feed.
A distributed energy storage system (DESS) optimally located on the utility grid can mitigate many of these issues through heavy penetration of customer-owned DG (Figure 2). AEP reasons that energy storage would allow grid operators to maintain control over the grid, improve the service reliability, and actually benefit from the presence of the customer-owned DG on the grid.
Figure 2 – AEP vision of a future, U.S. power system with integrated central & distributed energy resources.
Since 2001, AEP has experienced exponential growth in the number of requests for DG connection to its grid. Therefore, AEP believes that energy storage is a strategic component to the future power grid of the United States [3,4,5].

12
Long-Term and Short-Term Benefits of Energy Storage
Due to the evolutionary status of widespread energy storage deployment on a grid, strategic decisions must be made with consideration for the long-term and short-term impacts. The long-term benefits of well-penetrated distributed energy storage include:
1. Improved system control and reliability to cope with the adverse impacts of widespread and uncontrolled customer-owned DG;
2. Enhancement of DG penetration by reducing its required size (Figure 3);
3. Improved system reliability due to intentional islanding, which can negate brownouts, even blackouts;
4. A base-loaded power system (Figure 4)
a. Improving asset management and extending useful equipment life by reducing the peak loads at all system levels,
b. Reducing equipment cost by lowering required power ratings (lowered peaks)
5. Improved asset management, including extension of useful equipment life, by reduction of the peak loads at all system levels;
6. Reduced equipment costs due to lower required power ratings (lowered peaks);
7. An opportunity to offer energy arbitrage in deregulated environments; and
8. Provide voltage and frequency regulation benefits.
Figure 3 – Impact of energy storage on DG rating.

13
Figure 4 – Summer daily load factors - AEP & US average. [6]
The most important short-term benefits of distributed energy storage for utilities involve “buying time” (Figure 5):
• Deferring upgrade capital by reduction of load peaks;
• Improving service reliability where conventional solutions (construction of new power lines or substations) might not be readily available or would take several years to implement; and
• Allowing more time for service restoration during scheduled or accidental power interruptions due to the ability to provide interim power to customers.
Maintenance
Future Line
Time
Load
Future Substation
Maintenance
Future Line
Time
Load
Maintenance
Future Line
Maintenancee
Future Line
Time
Load
Time
Load
Future Substation
Maintenance
Future Line
Time
Load
Maintenance
Future Line
Maintenance
Future Line
Time
Load
Time
Load
Future Substation
Maintenance
Future Line
Maintenance
Future Line
Time
Load
Time
Load
Maintenance
Future Line
Maintenancee
Future Line
Time
Load
Time
Load
Future Substation
Figure 5 – Multiple benefits of energy storage on long feeder lines, including load-leveling & improved service reliability (less/no outage).
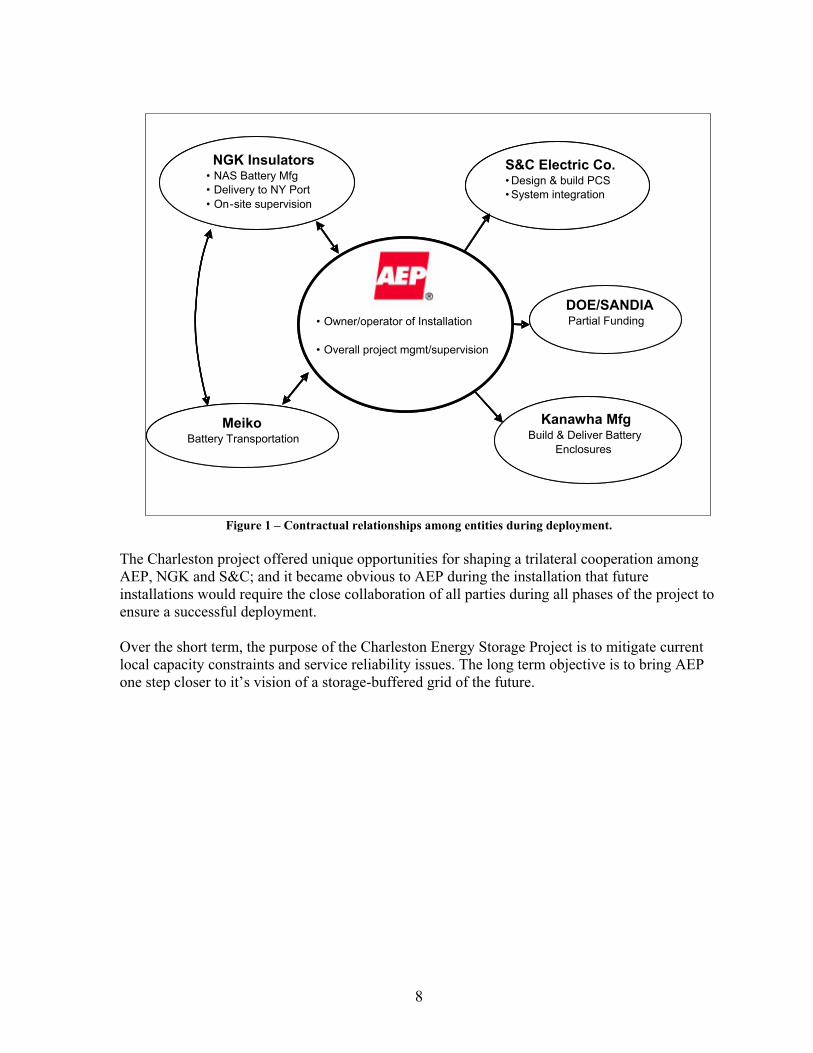
Whereas the long-term benefits of DESS are the motivation for development of a future grid, it is actually the short-term benefits that help devise a starting strategy for achieving that goal.1 Figure 6 illustrates the key short-term and long-term benefits of distributed energy storage from a utility perspective. As clearly shown, improved service reliability dominates in both the short-term and long-term.
1 Note that the lists of short-term and long-term energy storage benefits are a reflection of the benefits that AEP considered before launching its energy storage program and, by no means, represent all storage benefits.
Summer Daily Load Factors
0.0 20.0 40.0 60.0 80.0 100.0
Residential
Small Commercial
large Commercial
Large Industrial
Percent
USA AEP
14
Figure 6 – Short-term & long-term benefits of DESS from a power utility perspective
In order to realize as many benefits as possible, a utility should choose locations for energy storage devices on a distribution line that are as close to the load as possible. Figure 7 depicts this concept in a simple chart.
Bulk
Generation Transmission Grid
Distribution Grid
Distributed Generation
1 – 10 MVAEnergy Storage Units
Utility Owned or Controlled
Bulk
Generation Transmission Grid
Distribution Grid
Distributed Generation
1 – 10 MVAEnergy Storage Units
Utility Owned or Controlled
Figure 7 – Preferred locations of distributed energy storage units on a utility grid.
Values of Energy Storage
The distinguishing point about AEP’s energy storage initiative is that it is driven by a long-term vision and strategy to place AEP where it needs to be a decade from now, as opposed to short-term economic gains. AEP realizes that deployment of distributed energy storage is currently costing the company more than some alternative, conventional solutions; however, AEP regards the marginally higher cost as a “premium” that it is willing to pay to advance the company’s grid performance and enhance AEP’s future in the electric power industry. Although the short-term economics of energy storage were not the driver for the company’s storage initiative, AEP made an effort to quantify storage benefits in order to help sort and choose among potential deployment sites. The company reviewed many reports on the evaluation

15
methods and quantitative values of energy storage benefits; but could not find any reference or method that would satisfactorily capture all the short and long-term benefits of distributed energy storage that applied to AEP applications [6,7,8,9,10]. One of the most dominant AEP criteria for site selection is improved electric service reliability for the end-user, including several hours of islanding that are not completely quantified in other studies. Another important, unquantifiable selection criteria is the value of “time.” A conventional solution might simply not be available on short notice; due to required land purchase and permit requirements, for example. In contrast, energy storage can be deployed in a relatively short time to address needs. Using AEP parameters, Table I lists some published energy storage values that the company found to be relatively close to it’s calculations. Table 1 – Selected Values of Energy Storage on Distribution System
Storage Benefit Value $/kW Reference
Energy Value (with 75% storage efficiency) 500 [7]
Generation Capacity Avoided Value 215 [8]
Distribution Capital Deferral (limited sites) 666 [8] Improved Service Reliability (w/o islanding) 359 [8]
Improved Service Reliability (islanding) High (not quantified)
Value of a Readily Available Solution (RAS)
High
In a report at the 16th annual meeting of the Electricity Storage Association (ESA), Technology Insights quantified the value of energy storage at $600/kW for peak shaving (in California) and $2300/kW for regulation control [11].
Value of a Readily Available Solution (RAS) A temporary “band-aid” solution to the capacity gap problem would be of great value to utilities. This would allow them to defer an upgrade to a high-capacity, conventional solution for several years. Note that capital deferral is not always a “choice” for utilities, because some conventional solutions might not be available for a few years, regardless of the cost; i.e., building a new substation or power line requires certain permitting processes, land acquisition, and construction that can take several years. A common practice when making investment decisions is to compare the net present values (NPV) of each option – the “winner” is simply the option with the highest NPV. While this approach is fairly straightforward, the difficulty is the assignment of an accurate ‘value’ to each opportunity. For example, in one-off situations, the full expense of a “band-aid” technology would be used in the valuation calculations. However, in systematic (i.e., repetitive) situations,

16
the technology might be redeployed several times during its useful life, thus reducing the cost allocated to any single situation. A more realistic evaluation is to calculate the value of a deferred investment for the entire useful life of a battery – for NAS batteries, it is expected to be 15 years or more. In addition, considering that the present value of any deferred capital beyond the first 15-20 years is of diminishing value, it is not unreasonable to consider the “effective life” for the energy storage option and its conventional alternatives to be comparable, if not equal. Therefore, a first approximation to the deferral value of such an energy storage system is the full amount that is deferred. Hence, the last column of table IV shows the storage value as
Factors dismissed in this simplification are:
• Present Value (PV) of capital deferral beyond 15-20 years; • PV of the battery disposal after 15-20 years; • PV of one or two storage relocation costs during the next 15-20 years; and • PV of the difference between maintenance costs of different mitigations (+/-).
These approximations are reasonable only for those readily available solutions that can be redeployed and have a total useful life of 15 years or more, with minimal or no maintenance. It should be noted that, while the cost of a conventional solution might not depend greatly on the deferral period, the value of an RAS is very sensitive to the deferral period. The shorter the deferral, the sooner a conventional solution is needed and, therefore, the higher the value of an RAS. Figure 8 depicts the size of AEP’s 2006 distribution upgrade projects, grouped in different ranges of RAS values from Table IV. This figure also shows that, if deferrals are limited to only four years (i.e., a conventional solution is needed sooner), the values of readily available solutions increase for the listed projects. The chart shows that, if an RAS that costs between $1000/kVA to $1500/kVA can be identified, then 4-14MVA worth of upgrade projects is available for deferral.
Estimated Value of a Readily Available Solution
Full cost of Conventional Solution Capacity Gap (kVA)=Estimated Value of a
Readily Available SolutionFull cost of Conventional Solution
Capacity Gap (kVA)Estimated Value of a
Readily Available SolutionFull cost of Conventional Solution
Capacity Gap (kVA)=Estimated Value of a Readily Available Solution
Full cost of Conventional Solution Capacity Gap (kVA)

17
Figure 8 – Size of distribution upgrade projects at different RAS values.
Most AEP distribution upgrade projects have an RAS value under $1000/kVA. At that value, not many readily available solutions exist that would cost less, with the exception of some peaking generators that burn fossil fuel. Relocating high-energy storage devices like NAS from one site to another can be accomplished as quickly as setting up a peaking generator; even though the system cost is higher than a generator. Energy storage has many other advantages that qualify it as a strategic component of future grids. The ability to relocate NAS batteries quickly to replace peaking generators with energy storage is a key advantage of DESS, for which AEP is willing to pay a premium price.
Energy Storage Requirements and Options
In order to realize both long and short-term benefits, a multi-MW utility requires a multi-hour energy storage system that can be located at a site for several years and then relocated, as needed, at reasonable cost. The preferred location is on utility feeders located near customers; therefore, it is difficult to define a specific voltage, because feeder voltages vary among utilities and even within a multi-state company like AEP. Therefore, AEP decided to standardize its system at 480V, 3-phase, 4-wire, which can be used directly by commercial customers or easily stepped up to feeder voltages. Table 2 is a summary of AEP’s recommended specifications for distributed energy storage systems in utility load-leveling applications.
2006 Capacity Upgrade Projects
0
10
20
30
40
50
60
0-500 500-1000 1000-1500 1500-2000 2000-2500
Value of Readily Available Solution - $/kVA
Size
of A
ll Q
ualif
ying
Pro
ject
s -
MVA
7 yr deferral
4 yr deferral

18
Table 2 – AEP Specifications for Utility-Scale Distributed Energy Storage Systems
Voltage 480/277 V, 3 phase, 4-wire (grounded-wye)
Power rating 1-10 MVA per site
Energy Adequate for 4-10 hours of discharge at its rated power
Energy Efficiency > 75% on AC side
Reactive Power Dynamic VAR support available at all times
Planned Islanding Improve Reliability Indices (such as SAIDI, CAIDI & SAIFI) by supporting some load during a power outage and smooth transfer to the grid after electric service is restored.
Power Quality At rated power
Total Installed Cost Within 20% over conventional alternatives
Maintenance Less than 0.5% of installed cost per year
Calendar Life 15 years
Cycle Life 3000 cycles at rated power
Relocation cost Less than 10% of the installed cost of a new system.
Installed Footprint < 500 square ft per MVA (including PCS)
Disposal Cost Less than 3% of installed cost.
Besides the parameters listed in Table 2, other important factors, such as the maturity of the technology and the financial strength of the manufacturer/provider, impact the business risk; and are, therefore, considered in selecting equipment. Although a single storage technology does not exist that can satisfy all of the above requirements, these are the four closest options among high-energy storage devices:
• Sodium Sulfur (NAS) battery • Lead Acid Batteries (L/A) • Vanadium Redox Battery (VRB) • Zinc Bromine Battery (ZnBr)
For a variety of reasons, other existing storage technologies are not listed. For example, compressed air energy storage (CAES) is still too large to be placed on a distribution feeder and then be relocated every 3-5 years. In addition, lithium ion (Li-ion), Nickel Cadmium (NiCd) and Nickel metal hydride (NiMH) batteries are not available in large energy scales, and flywheels are not yet cost effective at 4-10 hour applications (whereas NaS is cost effective).

19
In order to determine a rough overview of the relative strengths and weaknesses of each of the viable energy storage technologies considered by AEP, the ratings listed in Table 3 illustrate AEP’s assessment of a subjective, relative scoring system (with “10” being meets fully the AEP-expected requirements shown in Table 1). Table 3 – Relative Feasibility Scores for Energy Storage Technologies
Required Features NAS L/A ZnBr VRB
Adequate Power Rating 10 10 6 4
High Energy Efficiency 10 6 7 8
Low Disposal Cost 7 10 7 7
4 to 10 hrs of Energy at Rated Power 8 6 5 10
Low Total Installed Cost (per MWh) 9 10 7 6
Low Relocation Cost 9 7 10 4
Commercial Maturity 7 10 3 3
Adequate Cycle Life 10 1 6 9
Adequate Calendar Life 10 3 5 6
Financial Strength of Supplier 9 10 1 1
Low Maintenance Cost 10 1 5 5
Low Installed Footprint 10 1 6 3
Total Feasibility Score 108 75 68 66 As illustrated in Figure 9, NAS batteries score the highest ratings; therefore, that technology is the most feasible for the type of distributed energy storage system that AEP is planning to deploy on its grid.
Figure 9 – Relative feasibility scores of high-energy storage technologies
for distributed energy storage application.

20
AEP had another reason to choose NAS as the battery of choice. In September 2002, AEP installed a 100kW NAS battery to support the electrical load in one of its office buildings in Gahanna, Ohio (Figure 10). Besides peak shaving at 100kW, this unit has a power quality mitigation capacity of up to 500kW for 30 seconds. AEP is satisfied with the performance of NAS in this prototype application [12].
Two 50kW NAS Modules
PCSTwo 50kW
NAS ModulesPCSTwo 50kW
NAS Modules
PCSTwo 50kW
NAS ModulesPCS
Figure 10 – AEP's 100kW, 7.2 hr / 300kW, 30s NAS battery with 500kVA PCS installed in Gahanna, OH.

21
SITE SELECTION Once AEP made the decision to deploy DESS and a preferred technology was identified, the AEP Distribution Asset Management group reviewed system needs in all eleven states of the AEP service territory to determine sites where deployment would be the most reasonable. The attributes considered were:
• Infrastructure improvements needed for increased capacity or improved reliability; • Slow load growth; • Less cost than conventional technologies; • Significant planning uncertainty (such as securing permits for new lines or stations); • Manageable operational risk deploying the new technology; and • Convenience of technical support for the new technology.
Table 4 is a partial list of distribution sites that were selected for upgrade in 2006. For clarity, many smaller project sites were excluded, because their power concerns could be easily handled with a very low-cost conventional technology. Table 4 – AEP Stations Considered for Capacity Upgrade in 2006
Substation Location Est. Cap. Gap
(MVA)
Est. Load
Growth (MVA/yr)
Est. Cap.
Gap in 7 years (MVA)
Conventional Mitigation**
Est. Required Capital
($million)
Est. Value of
RAS ($/KVA)
Carrollton Carrolton, OH 0.3 0.1 1.0 1+3 1.64 1,640
Chemical Charleston, WV 0.58 0.13 1.49 4 2.00 1,340
Amsterdam Canton, OH 0.5 0.05 0.85 1+3 1.00 1,180
Wingate Charleston, WV 0.71 0.13 1.62 4 1.66 1,030
Southridge Charleston, WV 1.35 0.5 4.85 4 4.10 845
Westlake Roanoke, VA 5.0 1 12.0 4 9.80 817
Farmington Fayetteville, AR 0.3 0.3 2.4 4 1.72 717
Auglaize Lima, OH 1.0 0 1.0 2 0.69 688
Beaverdam Lima, OH 0.51 0.2 1.91 1 1.04 545
Coolville Pomeroy, OH 0.3 0.2 1.7 2 0.92 542
Citrus City San Benito, TX 0.00 0.6 4.2 4 2.07 493 Hans Meadow Christiansburg, VA 0.68 0.8 6.28 4 2.25 358
Smyth Maron, VA 2.35 0.4 5.15 1 1.62 315
White Rd Columbus, OH 0.00 1.7 11.9 4 3.7 311
Bannock Steubenville, OH 1.79 0.2 3.19 1 0.71 221
Cavazos Cavazos, TX 0.26 0.5 3.76 2 0.79 210
Monroe Roanoke, VA 0.31 0.4 3.11 1 0.60 192
Port Isabel Port Isabel, TX 0.64 0.6 4.84 2 0.81 167
Milo Laredo, TX 2.54 1.5 13.04 2 1.57 120 * 1) Replace Transformer(s) 2) Add New Transformer(s) 3) Rebuild Part of Station 4) Build New Station and Feeders

22
Based on equipment ratings and load forecasts, AEP estimated an immediate capacity gap for each of the listed sites. This gap is often too small (100’s of kVA) compared to the minimum upgrade capacity of a new transformer or a new substation; and the investment in a conventional solution remains underutilized for a long time, especially if the load growth is small. Based on the expected load growth, planners often forecast a capacity gap several years in the future. Table 4 shows the estimated capacity gap of the listed stations at the end of a seven-year period. This gap is often in the range of a few MVA and much closer to the capacity increase that comes with conventional upgrades.
Chemical Station, Charleston, W. Virginia
Table 4 lists most of the distribution upgrade projects in the order of decreasing RAS values. For clarity, many projects with lower RAS values have been omitted. While Carolton station in Ohio has the highest RAS value, it did not meet the other desirable qualifications listed above. Although Chemical Station in North Charleston, WV, has only the second highest RAS value, it has many other advantages, such as available space for installing a temporary, relocatable battery and it is located very close to an AEP office that can support monitoring and operation of the battery. Chemical Station is a combination of transmission (138kV) and distribution (12kV) substations. The 20MVA, 46kV/12kV distribution transformer and the voltage regulator that supply the three 12kV feeders out of this station were very close to their limits during the 2005 summer peak (June through August) and were very likely to surpass them during that period. AEP decided to install a 1.2 MW DESS to mitigate this problem for a few years, until a new substation could be justified. Figure 11 is a one-line diagram of the distribution substation in Chemical Station, indicating the location of a 1.2 MW NAS battery that would be connected to one of the three 12kV feeders (West Washington Street).

23
Overloaded 20MVA 48kV/12kV Transformer
Overloaded Voltage Regulator
Overloaded 20MVA 48kV/12kV Transformer
Overloaded Voltage Regulator
Figure 11 – One-line diagram of the Chemical Distribution Substation in Charleston WV, with a photo of its overloaded voltage regulator and transformer. The three feeders that are supplied by this transformer and voltage regulator have similar load patterns. Figure 12 shows the annual load pattern on the West Washington Street feeder.
0
1
Jan Feb Mar Apr May Jun Jul Aug Sep Oct Nov Dec
Summer Peak
0
1
Jan Feb Mar Apr May Jun Jul Aug Sep Oct Nov Dec
Summer Peak
Figure 12 – Annual load pattern at W. Washington St. of one of the 12 kV feeders supplied by the stressed transformer
It might appear that a very simple solution to this problem would be to replace the transformer and voltage regulator. While this can be a low cost, short-term solution, replacement might not serve as an adequate long-term solution, because AEP has a policy of using certain transformer sizes that allow maximum interchangeability for expediting the restoration of a system. When the capacity is exceeded of some of these transformers, or similar equipment, standard practice at AEP requires the construction of a new substation and feeders. The situation at Chemical Station

24
called for building a new station, which can take several years to secure land, acquire permits, and then construct the new system. Therefore, the RAS value for this station is relatively high ($1340 /kVA). It might take several more years before a multi-hour, multi-MW AC energy storage device could be installed at a total cost below $1500/kW. However, relocatable storage devices can be used as quick, band-aid solutions at some sites before the end of their useful life. Such applications would not have the high initial cost of a first application, as was the case at Chemical Station. Figure 13 is a top view of the N.E. corner of Chemical Station, containing the 12kV distribution substation, 20MVA transformer (#3), control room, and the open, clear area that was ideal for the temporary installation of a relocatable energy storage device. The storage, in this case, is connected to the West Washington street feeder at the first wood pole located within the station fence.
Figure 13 – Top View diagram of the N.E. Corner of Chemical Station; showing the 12kV distribution, 20MVA transformer (#3), control room & the open
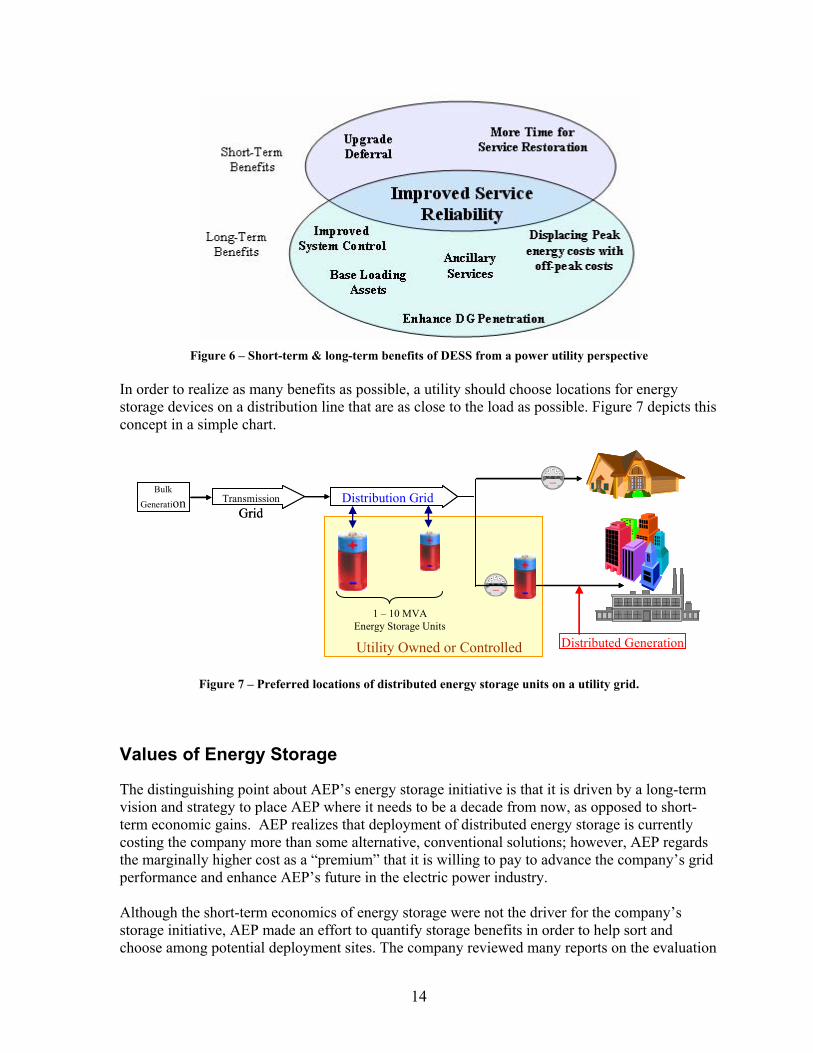
storage area marked for locating the NAS battery and its PCS. The upper photo in Figure 14 shows Chemical Substation with an open space for the DESS, the Control House, 12kV substation, stressed transformer (#3), battery, PCS and the step-up transformer. The lower photo is the DESS installed in the open space.
25
Point of Connection to Grid (pole top)
Control House12 kV Substation Open Space for Energy Storage System
1.2 MW NAS Battery
1.25 MVA PCS
480V to 12kV Step Up
Transformer
Point of Connection to Grid (pole top)
Control House12 kV Substation Open Space for Energy Storage System
Point of Connection to Grid (pole top)
Control House12 kV Substation Open Space for Energy Storage System
1.2 MW NAS Battery
1.25 MVA PCS
480V to 12kV Step Up
Transformer
1.2 MW NAS Battery
1.25 MVA PCS
480V to 12kV Step Up
Transformer
Figure 14 – Photographs of AEP's Chemical Substation before & after installation
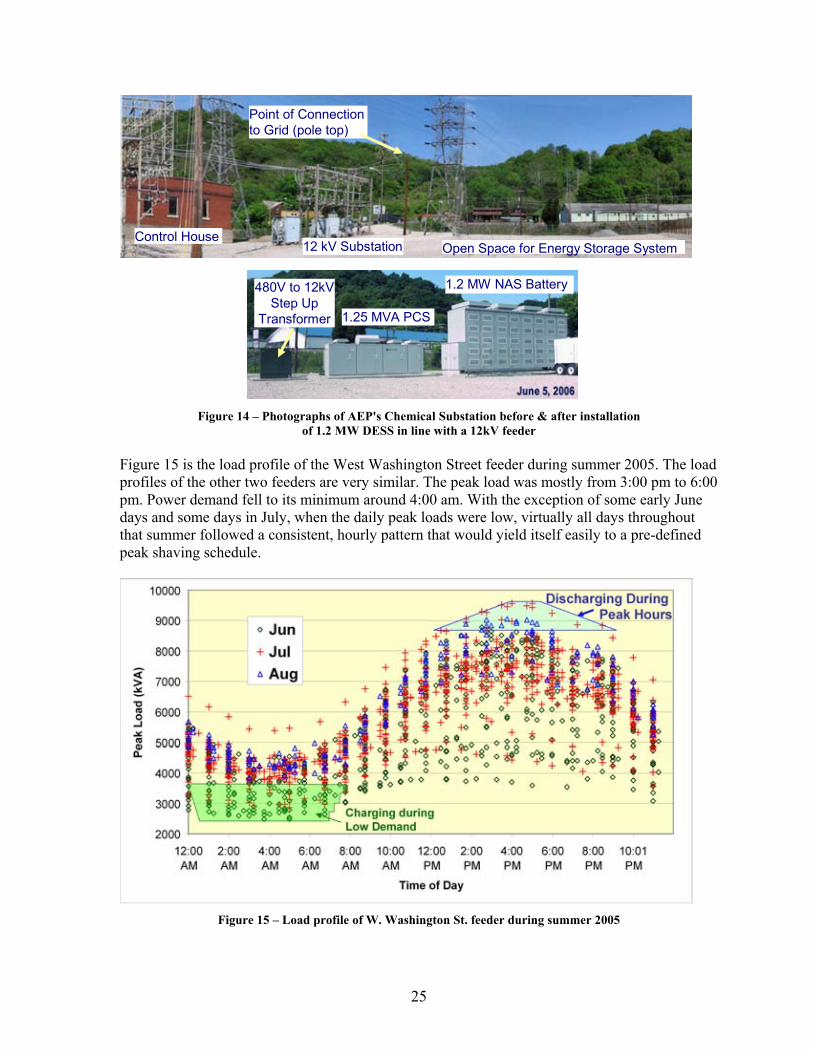
of 1.2 MW DESS in line with a 12kV feeder Figure 15 is the load profile of the West Washington Street feeder during summer 2005. The load profiles of the other two feeders are very similar. The peak load was mostly from 3:00 pm to 6:00 pm. Power demand fell to its minimum around 4:00 am. With the exception of some early June days and some days in July, when the daily peak loads were low, virtually all days throughout that summer followed a consistent, hourly pattern that would yield itself easily to a pre-defined peak shaving schedule.
Figure 15 – Load profile of W. Washington St. feeder during summer 2005

26
The load profile shows deployment of a trapezoidal discharge profile (green area in Figure 15), which indicates a profile that would allow the NAS system to be discharged at 120% of its rating for 1.5 hours. Therefore, the 1.0 MW NAS battery deployed here can be referred to as a 1.2MW battery because it, in effect, can reduce the peak load by 1.2 MW.
Site Acceptance Tests for the DESS
All twenty NAS batteries and their controller were tested in the NGK factory before being shipped to AEP. Because there was nothing unique about these batteries, compared to batteries used in many other NAS installations in Japan, battery factory tests have not been included in this report. The PCS design, however, is unique. Therefore, special factory and site acceptance tests were developed in accordance with IEEE Standards 1547-2003 and 1547.1-2005 to ensure proper design of the PCS and its integration with the batteries. Figure 16 shows the charging profile and eight, predefined discharge profiles based on an operator’s need for power (rated 1MW or over power at 1.2 MW) and energy level or depth of discharge (100%, 50% or 33%). The operator can cut short any of these profiles by disrupting the discharge; however, the profiles cannot be arbitrarily modified or expanded, because they impact battery temperature. If needed, other discharge profiles can be designed and defined by consulting with NGK engineers.
Figure 16 – Predefined discharge profiles based on different power levels & capacity

27
AEP’s logic for the discharge profiles (Figure 16) is:
• The DESS is rated for 1.2 MW and the system is normally utilized on the basis of a 1 MW load; the remaining .2 MW of discharge reserved for emergency or contingency loadings.
• A 90% capacity (depth of discharge) doubles battery life, which is recommended for our application. Full (100%) capacity would be used only as needed.
• A 50% capacity discharge is for winter double peaks that might require two discharges on each nightly charge.
• A 33% capacity discharge is for short and frequent discharges, as needed.

28

29
NAS BATTERIES
Battery Description, Packaging and Transportation
The 1.2 MW battery system at Chemical Station is composed of twenty, 50kW (60kW peak) NAS battery modules, as depicted in Figure 17. Each module weighs approximately 3.5 metric tons and occupies 3 cubic meters of space.
Figure 17 – A 50 kW, 360 kWh NAS Battery Module
The NAS modules were packed inside wooden crates. As shown in Figure 18, four of the wooden crates will fit securely inside a standard, 40-foot length shipping container.
Figure 18 – NAS battery modules were wrapped and protected in a wooden crate. Four such crates were
located and secured inside each 40’ long shipping container.

30
NGK was responsible for trans-oceanic transportation of the batteries and delivery to a New York port, where AEP took ownership and used the services of the same transportation company (Meiko America) to process the batteries at the port and forward them to Chemical Station. For ground transportation, the original shipping containers were loaded on air-ride flatbed trucks to minimize the impact of road shocks to the batteries (Figure 19).
Figure 19 – Ground transportation & delivery of shipping containers on air-ride flatbed trucks
Battery Enclosures
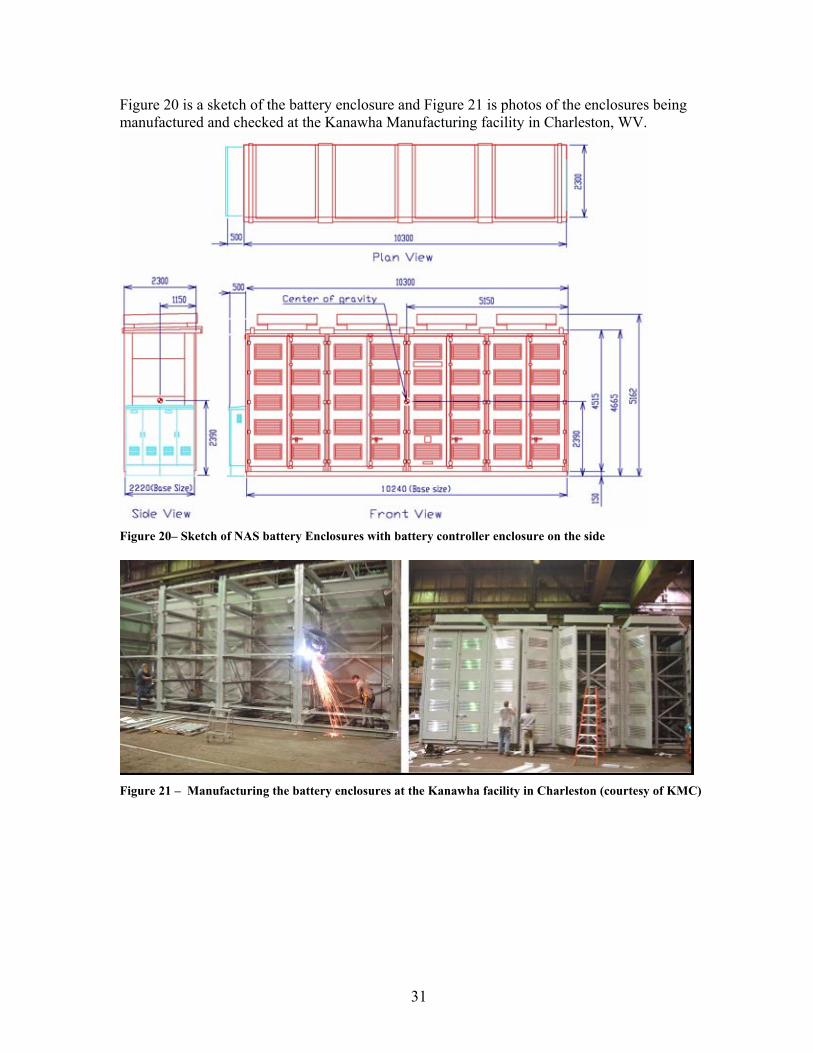
The NAS batteries and their controllers are contained within NEMA 3R enclosures (weatherproof construction) and mounted outdoors on a concrete pad. The enclosures are designed with a natural draft ventilating system to provide a proper environment for the battery modules. The design also facilitates relocation, as the intent is to move them several times during their useful life. Five battery modules are located inside a 17’- tall steel enclosure that supports a total of almost 18 tons. Four such enclosures accommodate the 20 battery modules of this installation. AEP considered buying and importing NAS enclosures from the Japanese supplier that has been building hundreds of them over the years. However, the company decided at the time that it would be more advantageous to the long-term objective if it were to involve and train a local manufacturer. Therefore, Kanawha Manufacturing Company of Charleston was selected for supplying the enclosures. AEP did not anticipate the differences between US and Japanese manufacturing tolerances when it ordered the battery enclosures from Kanawha; not only in the construction of the enclosures but also in the manufacturing processes, such as dimensions of the raw materials, proper hot-dip galvanizing and proper painting of large steel items. Some adjustments had to be made in the field. Kanawha’s engineers spent several months with their Japanese counterparts to understand and convert the Japanese drawings and parts lists to standard steel items that are readily available in the US. The unanticipated adjustments considerably delayed the on-site installation. AEP noted this situation for future installations.
31
Figure 20 is a sketch of the battery enclosure and Figure 21 is photos of the enclosures being manufactured and checked at the Kanawha Manufacturing facility in Charleston, WV.
Figure 20– Sketch of NAS battery Enclosures with battery controller enclosure on the side
Figure 21 – Manufacturing the battery enclosures at the Kanawha facility in Charleston (courtesy of KMC)

32
Site Preparation
Site preparation began in March 2006 and completed in mid-April. The weight of the batteries (77 tons), grounding, and cabling requirements all played a part in constructing foundations for the DESS. A special steel base bolted to the concrete foundation supports the battery enclosures (Figures 22 & 23).
Figure 22 – Preparation of DESS foundation with conduits for all cable connections
Figure 23 – Installation of the steel base under NAS battery enclosures
Because the battery enclosures were designed to minimize on-site construction, they were delivered to Chemical Station with doors and backs attached. The ventilation hoods, however, were removed during transportation. Figure 24 shows transportation, erection, and on-site setup of the battery enclosures and Figure 25 shows installation of the battery control cabinet adjacent to the battery enclosures. All battery cables are brought together in this cabinet and connected to the PCS through a disconnect switch.

33
Figure 24 – Erection and setup of NAS battery enclosure on site
Figure 25 – Installation of the battery control cabinet that contains the battery controller, battery data logger and disconnect switches Installation of the Batteries Six of the battery modules were shipped early to the US and scheduled for delivery to the S&C Electric Company facility in Franklin, Wisconsin, to be used in initial development and testing of the PCS. Instead, due to changes in the factory test plans and due to a one-week delay in erecting the battery enclosures, they were shipped directly to an AEP storage facility within a few miles of

34
Chemical Station. They were stored indoors for awhile, to await completion of the enclosures and delivery of the remaining batteries. The remainder of the batteries arrived in New York two months after the first six and took only a few days to clear customs and be delivered to Chemical Station. After which, the first six batteries were relocated to the site on a small flatbed truck. (See Figure 26). The fourteen battery modules that arrived later were delivered directly to the site, protected within their original shipping containers. The modules in their shipping containers were unloaded with a crane and a long-neck forklift was used to reach inside the containers and pull them out (Figure 26)
Figure 26– Delivery of NAS batteries to Chemical Station & their removal from containers
Once the batteries were taken out of the shipping containers and stripped of their packaging, the crane lifted them and placed them on a specially-constructed installation tool. In order to support each 3.5 ton battery, align it within fractions of an inch inside its enclosure, and then roll it into place, a special installation tool on rails was installed at the site. The installation tool had a modular design that allowed adjustments for installing batteries at different heights. Figure 27 shows the installation of the rails and the special equipment.

35
. Figure 27 – Installation of the NAS batteries with a specially constructed tool
Figure 28 is all 20 batteries installed in their four enclosures and Figure 29 is the four, completed battery enclosures with the smaller enclosure for the battery control system shown at the left side.
Figure 28 – Twenty NAS Batteries installed in four enclosures

36
Figure 29 – Battery system enclosure at Chemical Station

37
POWER CONVERSION SYSTEM (PCS) FOR THE DESS S&C Electric manufactured and assembled the 1.25 MVA Power Conversion System (PCS), called PureWave DESS, at their facility in Franklin, Wisconsin. The PCS arrived at Chemical Station pre-assembled in one unit, which was installed on its own foundation between the NAS battery and the step-up transformer (Figure 30). Figure 31 is a dual photo of the PCS enclosure with and without cover doors.
Figure 30 – Installation of PCS between the NAS battery and the step-up transformer
Two DC Breakers
UPS
Chopper Inductors
Inverter Controller
Chopper Controller
Choppers
InvertersAC
Breaker
Battery Heater Breaker
PCS Main Controller
Connection to Step-up
Transformer
AC Filter Inductor
Zigzag Transformer behind Controller Panel
Monitor Screen
Two DC Breakers
UPS
Chopper Inductors
Inverter Controller
Chopper Controller
Choppers
InvertersAC
Breaker
Battery Heater Breaker
PCS Main Controller
Connection to Step-up
Transformer
AC Filter Inductor
Zigzag Transformer behind Controller Panel
Monitor Screen
Figure 31 – The 1.25 MVA, PureWave DESS PCS, and its key components

38
Figure 32 shows an overall view of the battery, the PCS, and the 1.5 MVA, 480V/12kV step-up transformer that connected the system to a 12kV feeder through fused, cutout switches on a power pole (Figure 33).
Figure 32 – Layout of a 1.2 MW, 7.2 MWh DESS at Chemical Station in Charleston
12 kV cables from DESS step-up transformer
12 kV feeder from Station
12 kV feeder to West Washington Street
Fused cutouts
12 kV cables from DESS step-up transformer
12 kV feeder from Station
12 kV feeder to West Washington Street
Fused cutouts
Figure 33 – Connection of the DESS to a 12 kV feeder
Installation of the PCS required data channels into and out of the unit. Figure 34 is a simplified diagram of the major information exchange with the PCS master controller, which receives data from three sources:
1. The Utility system (includes current, voltage power flows, and temperature of the stressed transformer, #3),
2. The PCS equipment, and 3. The NAS battery controllers.

39
Figure 34– Layout of DESS and its PCS Master Controller with different data
For output, the PCS master controller provides processed and stored information, including alarms, through two main channels.
• AEP SCADA (Supervisory Control and Data Acquisition) and • On-site and remotely accessible HMI (Human Machine Interface)
The data through AEP SCADA is primarily intended for the system operators in dispatch centers, while the HMI data is for AEP, NGK and S&C to remotely monitor and, if necessary, control the DESS unit. Chemical Station has an AEP SCADA system with Wide Area Network (WAN) termination and a single analog telephone line available in the control house. The SCADA WAN is used for engineering access to substation relays and for SCADA communication with the substation Remote Terminal Unit (RTU). The SCADA WAN is also used to automatically collect 15-minute interval Distribution Monitoring System (DMS) data. The RTU is the connection point

40
for substation operating information and is the preferred route for dispatcher access. Normally, substation Intelligent Electronic Devices (IEDs) are cabled directly to the RTU. In an established substation, the cost of trenching new cables can be high, and isolation in the event of a fault is always a concern for electronics. To address these issues, 900 MHz ISM Band Frequency Hopping Spread Spectrum radio modems (Maxstream) are used for communication among the RTU, the PCS, and the Qualitrol device that monitors the transformer temperature. The radios are configured to communicate like a normal RS485 serial interface, but to include 256-bit AES encryption on all transmissions. This ensures that the communication links are very secure and completely isolated. The high frequency, hopping operation (902-928 MHz) guarantees that substation electrical signals will not interfere with the radios. Figure 35 shows the antennas for wireless communication between the DESS and AEP SCADA.
Figure 35 – Location of Antennas on PCS and in Control House for connection to SCADA Access to the PCS HMI could have been set up using the analog phone line; but, that line is used during substation events and might not be available for DESS use when needed. Instead, a DIGI WAN cellular modem is installed in the substation. This GPRS/EDGE modem is able to connect a remote user to the DESS HMI at data rates above 60 kBaud, without isolation or security issues. A short latency (about 500 msec) is expected.

41
DESS TESTING PROCEDURES Following is a list of the main procedures that AEP employed in the acceptance tests for the complete DESS:
1. Initial System Testing • Inspection of Inverter System Wiring • Setup of 1600 Amp Breaker • Megger test of Power Circuit • Application of Utility Power • Power-up of the Inverter • Verification of the Emergency Stop hardware (with NGK controller) • Chopper & Inverter Alarms
2. Preliminary Testing with Power
• Setup of Hioki Test Equipment • Voltage Feedback • Bridge Charging • AC Power Filter Capacitors • System Response to Chopper and Inverter alarms
3. Initial Runs
• Initial Chopper Discharge Operation • Initial Charge Operation
4. Cease to Energize upon Loss of Phase Test (IEEE 1547.1)
5. SCADA and HMI Testing
6. Selected Discharge Profile Testing
• 33% capacity, 1.0MW (followed by a recharge) • 50% capacity, 1.2MW (followed by a recharge) • 50% capacity, 1.0MW and 33% capacity, 1.2 MW (followed by a recharge) • 90% capacity, 1MW discharge followed by a recharge • 90% Capacity, 1.2MW discharge, followed by a recharge • 100% capacity, 1.2MW discharge, followed by a recharge • 100% capacity, 1.0MW discharge, followed by a recharge
42
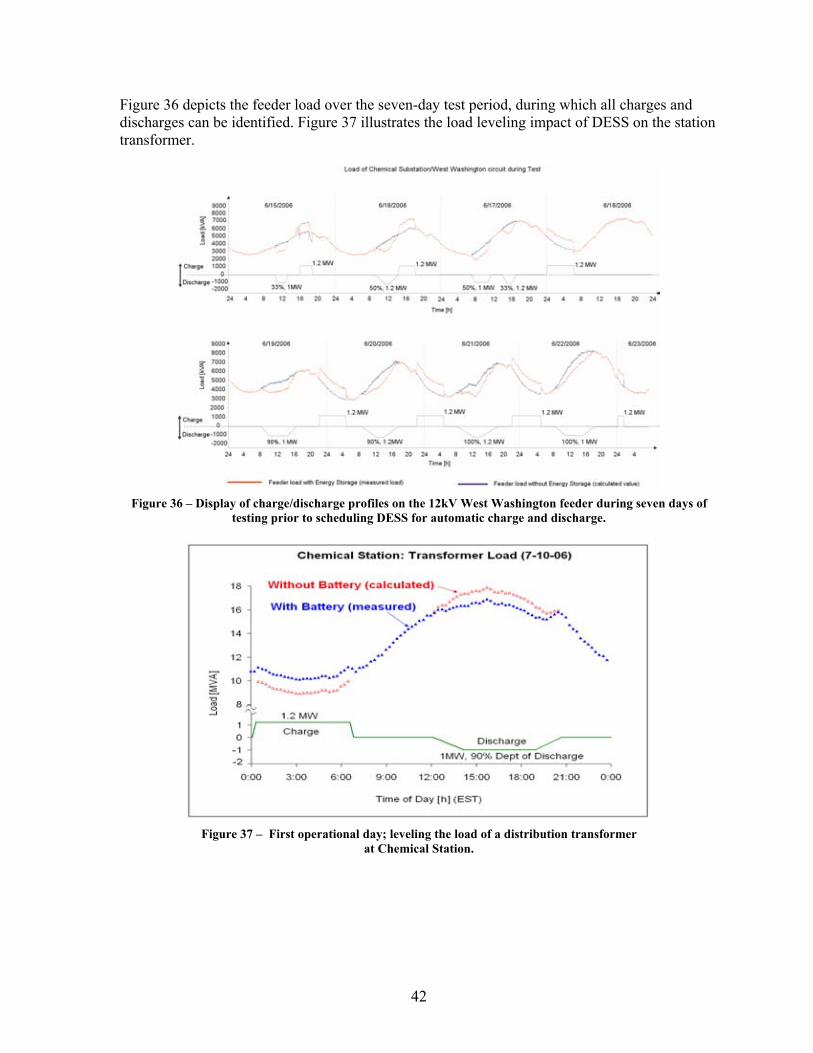
Figure 36 depicts the feeder load over the seven-day test period, during which all charges and discharges can be identified. Figure 37 illustrates the load leveling impact of DESS on the station transformer.
Figure 36 – Display of charge/discharge profiles on the 12kV West Washington feeder during seven days of
testing prior to scheduling DESS for automatic charge and discharge.
Figure 37 – First operational day; leveling the load of a distribution transformer
at Chemical Station.

43
COSTS OF INSTALLATION As is so often the case with initial projects of new technologies, the cost of the DESS installation at the Chemical Station site was affected by some factors that contributed to the overall lessons learned and will direct AEP’s efforts in future installations. The total, installed cost of an energy storage device includes many components beyond the battery and its power conversion system (PCS). Although the actual costs associated with the Charleston project were unique for this “first US installation,” the relative size of its cost components might prove to be of some value. With these factors in mind, Figure 38 is a pie chart of the relative cost components of the DESS project at Chemical Station.
Figure 38 – Major cost components for an installed NAS-based DESS Most of the non-repeat components that were unique to the design, engineering, and testing of the first unit are grouped together as a cut-out slice, because many of those costs are not expected in future installations. The support of the US Department of Energy and Sandia National Laboratories covered these non-repeat expenses, which are often hurdles when deploying a new technology. As part of business arrangements for the first NAS demonstration in the US that AEP did with NGK in 2002 (100kW/500kVA unit in Gahanna, Ohio), AEP receives a preferential price for NAS batteries for a limited number of years. However, some price reductions will still occur on future projects, due to the lessons learned in the Charleston project that allow the elimination or reduction of some of the logistics and installation-related cost components. The factory-to-site costs shown in the chart include trans-oceanic shipping, surface freights, exporting fees paid in Japan, and customs fees paid in the US. The delayed delivery of the batteries added an additional factory-to-site cost of approximately $20/kW ($4000 per container) to the project costs at Chemical Station. The total transportation costs from factory to site, including customs and handling charges plus a few other items shipped by air, translated to approximately $140/kW.

44
The 1.25MVA PCS was designed and manufactured by S&C company, which was also the “system integrator” for this project. The site work component includes the foundation work and some of the local support that AEP provided. This cost component is expected to be smaller for future installations. While costs will vary with local site conditions, it is the understanding at AEP that the next NAS-based energy storage project will cost approximately $2,500/kW, installed.

45
PERFORMANCE & ANALYSIS: FIRST YEAR The 1.2 MW NAS DESS at Chemical Station began operations as part of the grid on June 26, 2006. The DESS was placed online with one of three 12kV feeders that are supplied through a capacity-limited transformer and voltage regulator (Figure 39). The following three months served as the break-in period for the DESS, during which time the performance of the system was carefully monitored and analyzed.
Figure 39 – Connection of Storage to a 12kV feeder at Chemical Station Figure 40 shows the load leveling effect of the battery on three of the hottest days in summer 2006. The impact of load leveling on reducing the transformer hotspot and top-oil temperatures is shown to be about 3-6 °C (Figure 41). This is valuable for extending transformer life, particularly if the transformer is loaded at, or above, it’s rated power.
Figure 40 – Load leveling effect on three worst days

46
Figure 41– Effect of load leveling on reducing transformer hotspot & top-oil temps
Figure 42 shows the overall flattening impact of the DESS on the West Washington feeder load during the three hottest months of summer 2006. A comparison with the same data for summer of 2005, in figure 15, clearly shows the load leveling effect of the DESS.
+ 1.2 MW Charge
- 1.0 MW Discharge
+ 1.2 MW Charge
- 1.0 MW Discharge
Figure 42 – Impact of energy storage on flattening of the feeder load

47
Figure 43 reflects the feeder’s peak afternoon load from June 26 to September 30, with and without the peak shaving effect of the battery (set at 1 MW). Figure 44 is the impact of the battery on the feeder load factor (ratio of the average daily load to the peak load). The average of the feeder’s load factor is increased from 0.75 to 0.80.
Figure 43– Feeder daily peaks with and without the (DESS).
Figure 44– Feeder load factor with and without the (DESS).

48
October through December was a relatively inactive period between the summer and winter peaks, with a high load factor of 87%. As the weather became colder at Chemical Station, the mid-afternoon load peak that was normal due to air conditioning demands in the summer was replaced by two daily peaks caused by heating demands, at approximately 8:00 am and 7:00 pm. From late September through March, the charge and discharge schedule of the battery showed two daily discharges for each nightly charge. Figure 45 shows a double-peak daily profile with mild peaks and the impact of the DESS in flattening the load profile. During this period, the weather was very mild and the load did not increase beyond what is shown in Figure 45. Although the two daily peaks of the load profile are distinct during the autumn months, they do not become high until the January – February period.
Figure 45 – Double discharge and its impact on the transformer load profile (Feb 6th,2007)
During its first year of operation, DESS experienced some unscheduled down time, listed in the table below. During this first critical year, DESS was available 90% of the time for its scheduled daily discharges. Table 5 – Unscheduled Down Time of the DESS for the First Year of Operation
Dates Duration Cause Remedy 1 June 28-29 2 days Conductive debris blown on the Battery
Controller Vacuumed inside the enclosure
2 July 5-6 2 days Main inverter impeller malfunction Impeller & its motor were replaced 3 July 22-24 3 days Ethernet communication software glitch System reconfigured to be more tolerant 4 Aug 7-20 14 days Failure of a recalled element used on the
PCS Control Board simultaneous with interruptions in the Wireless Service
Replaced the control board. Wireless Service provider changed some hardware on a cell tower near the station on Aug 24.
5 Aug 21-28 8 days Intermittent activity caused by a change in metering of pulse-like battery heater load
Removed the heater load from the metering & control circuits
6 Sept 28-29 2 days Conductive debris blown on the Battery Controller
Vacuumed inside the enclosure more thoroughly & modified controller filters
7 Dec 20-21 0.5 day Software bug under investigation 8 Mar 14-15 1.5 days Software bug under investigation 9 May 4-9 5 days Failure of a small electronic component in
PCS Replaced

49
LESSONS LEARNED / CONCLUSIONS Installation and deployment of the first 1.2 MW DESS in the US were relatively smooth operations. AEP gained a wealth of knowledge and, in retrospect, learned lessons from the experience that will improve the efficiency of future installations. This section reflects AEP’s evaluations and conclusions for future grid-related DESS.
Operations / Construction / Deployment
Contractual Partnerships The trilateral collaboration among AEP, NGK and S&C did result in the successful installation of the DESS. However, AEP (the customer) had to deal with five different entities in multiple contracts and had to coordinate a variety of tasks and schedules in order to complete the task.
Conclusion: A single company should assume the complete task of DESS delivery and system integration; and, in turn, this should be reduced to a single contractual relationship between utility and the supplier of the DESS.
Shipping Because initial plans for the Chemical Station project involved testing the PCS with NAS batteries in advance of completion of all twenty of the DESS batteries, AEP ordered that six modules be shipped prior to completion of the entire system. AEP learned, after the fact, that some cost components of shipping charges are based on a “per container” basis, a container being a standard, forty-foot long overseas shipping box. Thus, one container was partially empty, resulting in unnecessary shipping charges.
Conclusion: Conform battery shipments to maximize packaging and minimize shipping costs.
Battery Enclosures Due to the differences between Japanese and US manufacturing practices that necessitated conversion of Japanese specifications to conform to US practices and standards, on-site modifications of the enclosures became necessary, which resulted in considerable delays. NAS batteries cannot be stored outdoors while awaiting completion of the battery enclosures. On the other hand, storing them indoors might require permits. Unless the NAS batteries are delivered pre-installed in integrated, relocate-able enclosures, it is necessary to closely coordinate battery delivery schedules with the delivery schedules of the battery enclosures.
Conclusion: Delivering the DESS batteries pre-installed in relocate-able enclosures will greatly increase efficiency, thus saving time and costs.

50
Energy Savings
The roundtrip AC energy efficiency of this energy storage system was measured at 76%. To extend the battery life, the DESS was used at 83% to 90% of its capacity (7.2 MWh) during the first years.
Conclusion: Applying PJM’s Locational Marginal Price (LMP) data for AEP revealed that the Chemical Station DESS, with its existing daily charge/discharge schedule, could have saved AEP approximately $57,000 during the first 11 months of operation, if it had been utilized at 100% of its capacity (see Figures 46 and 47). This saving can be increased if the daily charge-discharge pattern were to be adjusted for optimum energy arbitrage, as opposed to actual system capacity need.
Figure 46 – Sample of daily PJM energy market value of the DESS at Chemical Station
Figure 47 – Monthly PJM energy market value of the DESS at Chemical Station

51
REFERENCES [1] http://www.eia.doe.gov/neic/brochure/elecinfocard.html . [2] http://www.eia.doe.gov/oiaf/analysispaper/elecgen_fig2.html . [3] A. Nourai, et al, “AEP Outlook for Distributed Storage with NAS Battery Systems,” IERE
Workshop on Renewable Energy and Distributed Generation & Grid Interconnection. May 2005, Korea, pp137-143.
[4] A. Nourai, et al, “Testing the Limits,” IEEE Power and Energy Magazine, Vol 3, No 2, March/April 2005, pp 40-46
[5] “Large-Scale Electricity Storage Technologies for Energy management,” A. Nourai, IEEE Power Engineering Society Summer Meeting, vol. 1, 2002. pp310-315.
[6] EPRI PowerShape Load Data Analysis, EPRI SW-111998, Copyrighted 1998 [7] EPRI-DOE Handbook of Energy Storage for Transmission and Distribution Applications,
December 2004. [8] “Energy Storage Benefits and Market Analysis handbook”, J.M. Eyer, J.J.Iannucci,
G.P.Corey, Sandia Report, SAND2004-6177 [9] “Innovative Business cases for Energy Storage in a Restructured Electricity marketplace”,
J.J.Iannucci, J.M. Eyer, P.C. Butler, Sandia Report, SAND2003-0362 [10] “Innovative Applications of Energy Storage in a Restructured Electricity marketplace- Final
Report”, J.J.Iannucci, J.M. Eyer, Bill Erdman, Sandia Report, SAND2003-2546 [11] “Overview of NGK’s Sodium Sulfur (NAS) Battery”, Dan Mears Technology Insights,
presented in the 16th annual meeting of Electricity Storage Association (www.electricitystorage.org) , May 18, 2006, in Knoxville, TN.
[12] “AEP Sodium-Sulfur (NAS) Battery Demonstration,” EPRI Technical Report 10120249, June 2005. Steve Eckroad.

52
DISTRIBUTION
30 Nourai, Ali
Program Mgr. American Electric Power 1 Riverside Plaza Columbus, OH 43212373
1 Buckner, Michael D.
Panasonic Energy Solutions Lab. 1931 Old Middlefied Way, Unit B Mountain View, CA 940473
1 Gardow, Eva
Project Mgr. First Energy 300 Madison Ave P.O. Box 1911 Morristown, NJ 07962
1 Kruger, Larry
Partner 6-Nines Power, LLC. 344 Whitney St. Northborough, Ma 02532
1 Oshima, Taku
General Mgr., Sodium Div. NGK Insulators, Ltd. 2-56 Suda-cho, Mizuho Nagoya 467-8530, Japan
1 Roberts, Bradford
Power quality Systems Dir. S&C Electric Co. 5251 West Franklin Dr. Franklin, Wisconsin 53132-8663
1 Schainker, Robert B.
Technical Executive Strategic Planning Office of Innovation 3420 Hillview Ave. Palo Alto, CA 94303-0813
1 Simning, Brooks
Sr. Electrical Engineer Cummings Power Generation 1400 73rd Ave. N.E. Minneapolis, MN 55432

53
1 Walker, Stow
Assoc. Dir. Emerging Generation Technologies Cambridge Energy Research Associates 55 Cambridge Parkway Cambridge, MA 02142
1 MS0614 Nancy Clark, 02547 2 MS0899 Technical Library, 04536 1 MS0968 Don Ragland, 06336 2 MS9018 Central Technical Files, 08944

54