Embed Size (px)
Citation preview

Unclassified ECO/WKP(2016)33 Organisation de Coopération et de Développement Économiques Organisation for Economic Co-operation and Development 01-Jul-2016
___________________________________________________________________________________________
_____________ English - Or. English ECONOMICS DEPARTMENT
INSOLVENCY REGIMES AND PRODUCTIVITY GROWTH: A FRAMEWORK FOR ANALYSIS
ECONOMICS DEPARTMENT WORKING PAPERS No. 1309
By Müge Adalet McGowan and Dan Andrews
OECD Working Papers should not be reported as representing the official views of the OECD or of its member
countries. The opinions expressed and arguments employed are those of the author(s).
Authorised for publication by Christian Kastrop, Director, Policy Studies Branch, Economics Department.
All Economics Department Working Papers are available at www.oecd.org/eco/workingpapers.
JT03398897
Complete document available on OLIS in its original format
This document and any map included herein are without prejudice to the status of or sovereignty over any territory, to the delimitation of
international frontiers and boundaries and to the name of any territory, city or area.
EC
O/W
KP
(20
16)3
3
Un
classified
En
glish
- Or. E
ng
lish

ECO/WKP(2016)33
2
OECD Working Papers should not be reported as representing the official views of the OECD or of its member countries. The opinions expressed and arguments employed are those of the author(s). Working Papers describe preliminary results or research in progress by the author(s) and are published to stimulate discussion on a broad range of issues on which the OECD works. Comments on Working Papers are welcomed, and may be sent to OECD Economics Department, 2 rue André Pascal, 75775 Paris Cedex 16, France, or by e-mail to [email protected]. All Economics Department Working Papers are available at www.oecd.org/eco/workingpapers.
This document and any map included herein are without prejudice to the status of or sovereignty over any territory, to the delimitation of international frontiers and boundaries and to the name of any territory, city or area. The statistical data for Israel are supplied by and under the responsibility of the relevant Israeli authorities. The use of such data by the OECD is without prejudice to the status of the Golan Heights, East Jerusalem and Israeli settlements in the West Bank under the terms of international law.
© OECD (2016)
You can copy, download or print OECD content for your own use, and you can include excerpts from OECD publications, databases and multimedia products in your own documents, presentations, blogs, websites and teaching materials, provided that suitable acknowledgment of OECD as source and copyright owner is given. All requests for commercial use and translation rights should be submitted to [email protected]

ECO/WKP(2016)33
3
ABSTRACT/RÉSUMÉ
Insolvency Regimes and Productivity Growth: A Framework for Analysis
This paper develops an analytical framework to identify the policies relevant for firm exit and the channels
through which they shape aggregate productivity growth. A range of potentially relevant policies are
identified, spanning insolvency regimes, regulations affecting product, labour and financial markets,
macroeconomic policies, subsidies, taxation and environment regulations. These policies can directly
shape aggregate productivity along the exit margin through a variety of channels, including the strength of
market selection and the scope and speed at which scarce resources consumed by failing firms can be
reallocated to more productive uses. However, since market imperfections often generate obstacles to the
orderly exit of failing firms, the efficiency of insolvency regimes emerges as particularly crucial. Thus, the
paper analyses corporate and personal insolvency regimes in terms of their goals, optimal design (including
trade-offs) and key features relevant for explaining cross-country differences in productivity. Finally, the
paper proposes a strategy to obtain policy indicators that better capture cross-country differences in the key
design features of corporate and personal insolvency regimes, with a view to facilitate further research on
exit policies and productivity growth.
JEL Classification: K35, J63, O40, O43, O47.
Keywords: Bankruptcy, Institutions and Growth, Layoffs
********************
Régimes d'insolvabilité et croissance de la productivité – Un cadre d'analyse
Ce document établit un cadre d'analyse devant permettre de répertorier les politiques publiques qui
interviennent dans les sorties d'entreprises, ainsi que les voies par lesquelles ces politiques influent sur la
croissance de la productivité globale. On y recense un éventail de dispositifs publics susceptibles de jouer
un rôle à cet égard : régimes d'insolvabilité, réglementations relatives aux marchés de produits, aux
marchés du travail et aux marchés de capitaux, mesures macroéconomiques, subventions, fiscalité et
réglementation environnementale. Ces instruments de politique publique peuvent avoir un impact direct sur
la productivité globale au seuil de sortie, par différents biais tels que la puissance de la sélection par le
marché ou encore la rapidité avec lesquels des ressources rares utilisées par des entreprises en difficulté
peuvent être réaffectées à des emplois plus productifs, et l’ampleur de ces réaffectations. Cependant, étant
donné que les imperfections du marché produisent souvent des obstacles à une sortie en bon ordre des
entreprises en difficulté, l'efficacité des régimes d'insolvabilité apparaît comme particulièrement cruciale.
Dans ce document, les régimes d'insolvabilité des entreprises et des particuliers sont donc analysés sous
trois angles : les objectifs qui leur sont assignés, leur conception optimale (arbitrages compris) et les
principales caractéristiques permettant d’expliquer les disparités de productivité entre les pays. Enfin, le
document propose une stratégie pour construire des indicateurs permettant de mieux rendre compte des
différences nationales dans les éléments clés de la conception des régimes d'insolvabilité des entreprises et
des particuliers, afin de faciliter de futures recherches sur les politiques publiques intéressant les sorties
d'entreprises et la croissance de la productivité.
Classification JEL: K35, J63, O40, O43, O47.
Mots-clés: Faillite, institutions et croissance, licenciements
ECO/WKP(2016)33
4
TABLE OF CONTENTS
INSOLVENCY REGIMES AND PRODUCTIVITY GROWTH: A FRAMEWORK FOR ANALYSIS ..... 6
1. Introduction and main findings ............................................................................................................. 6 2. Exit policies and productivity growth ................................................................................................... 7
2.1 Firm exit and aggregate productivity growth .............................................................................. 7 2.2 Public policy and the exit margin ................................................................................................ 9
3. Corporate insolvency regimes ............................................................................................................ 14 3.1 Goals and best practices ............................................................................................................ 14 3.2 Procedures ................................................................................................................................. 15 3.3 Ex ante and ex post efficiency ................................................................................................... 16 3.4 Key features of corporate insolvency regimes ........................................................................... 17 3.5 Cross-country differences in corporate insolvency regimes relevant for productivity .............. 18 3.6 Measurement of corporate insolvency regimes ......................................................................... 26
4. Personal insolvency regimes ............................................................................................................... 28 4.1 The importance of a fresh start .................................................................................................. 29 4.2 Cross-country differences in personal insolvency regimes ....................................................... 29
5. Discussion and next steps ................................................................................................................... 32
REFERENCES .............................................................................................................................................. 34
APPENDIX: SURVEY OF POLICY INDICATORS ................................................................................... 39
Tables
Table 1. Specific features of insolvency regimes and productivity growth ......................................... 20 Table A1. Initiation of restructuring by creditors ................................................................................... 39 Table A2. Priority rules .......................................................................................................................... 40 Table A3. Key features of personal insolvency regimes ........................................................................ 41
Figures
Figure 1. Cross-country evidence on firm exit and job churning ........................................................... 8 Figure 2. A stylised depiction of how policies can shape productivity growth along the exit margin . 10 Figure 3. Key stages of the insolvency process .................................................................................... 16 Figure 4. Key features of insolvency regimes ....................................................................................... 18 Figure 5. Possibility and priority of new financing............................................................................... 22 Figure 6. The fate of incumbent management ...................................................................................... 23 Figure 7. Possibility to cram-down a restructuring plan on dissenting creditors .................................. 24 Figure 8. The World Bank strength of insolvency framework indicator .............................................. 27 Figure 9. The stigma of business failure and the availability of a fresh start ........................................ 30 Figure 10. Insolvency and entrepreneurship ........................................................................................... 32
ECO/WKP(2016)33
5
Figure A1. Stay on assets ......................................................................................................................... 42 Figure A2. Recovery rate of debt for secured creditors ........................................................................... 43 Figure A3. Efficiency of insolvency regimes .......................................................................................... 45
Boxes
Box 1. Policy-induced exit costs, firm entry and experimentation ............................................................ 10 Box 2. The rationale for insolvency regimes: market imperfections on the exit margin ........................... 11 Box 3. Limitations of the case study approach underlying the World Bank outcome-based indicators .... 28 Box 4. Details on the proposed insolvency questionnaire ......................................................................... 33 Box A1. The strength of insolvency framework index from World Bank Doing Business ...................... 44 Box A2. The features of insolvency regimes: European Commission data ............................................... 45 Box A3. The basis of the World Bank outcome-based indicator: the case study ...................................... 46
ECO/WKP(2016)33
6
INSOLVENCY REGIMES AND PRODUCTIVITY GROWTH: A FRAMEWORK FOR
ANALYSIS
By Müge Adalet McGowan and Dan Andrews1
1. Introduction and main findings
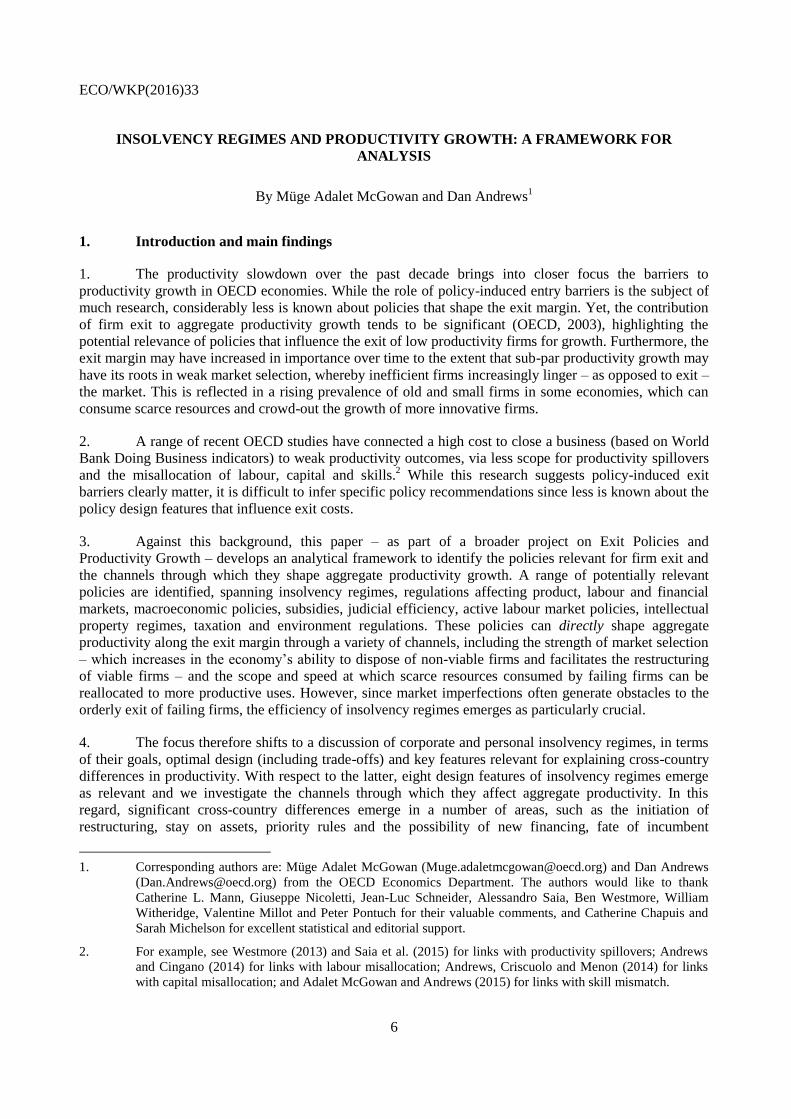
1. The productivity slowdown over the past decade brings into closer focus the barriers to
productivity growth in OECD economies. While the role of policy-induced entry barriers is the subject of
much research, considerably less is known about policies that shape the exit margin. Yet, the contribution
of firm exit to aggregate productivity growth tends to be significant (OECD, 2003), highlighting the
potential relevance of policies that influence the exit of low productivity firms for growth. Furthermore, the
exit margin may have increased in importance over time to the extent that sub-par productivity growth may
have its roots in weak market selection, whereby inefficient firms increasingly linger – as opposed to exit –
the market. This is reflected in a rising prevalence of old and small firms in some economies, which can
consume scarce resources and crowd-out the growth of more innovative firms.
2. A range of recent OECD studies have connected a high cost to close a business (based on World
Bank Doing Business indicators) to weak productivity outcomes, via less scope for productivity spillovers
and the misallocation of labour, capital and skills.2 While this research suggests policy-induced exit
barriers clearly matter, it is difficult to infer specific policy recommendations since less is known about the
policy design features that influence exit costs.
3. Against this background, this paper – as part of a broader project on Exit Policies and
Productivity Growth – develops an analytical framework to identify the policies relevant for firm exit and
the channels through which they shape aggregate productivity growth. A range of potentially relevant
policies are identified, spanning insolvency regimes, regulations affecting product, labour and financial
markets, macroeconomic policies, subsidies, judicial efficiency, active labour market policies, intellectual
property regimes, taxation and environment regulations. These policies can directly shape aggregate
productivity along the exit margin through a variety of channels, including the strength of market selection
– which increases in the economy’s ability to dispose of non-viable firms and facilitates the restructuring
of viable firms – and the scope and speed at which scarce resources consumed by failing firms can be
reallocated to more productive uses. However, since market imperfections often generate obstacles to the
orderly exit of failing firms, the efficiency of insolvency regimes emerges as particularly crucial.
4. The focus therefore shifts to a discussion of corporate and personal insolvency regimes, in terms
of their goals, optimal design (including trade-offs) and key features relevant for explaining cross-country
differences in productivity. With respect to the latter, eight design features of insolvency regimes emerge
as relevant and we investigate the channels through which they affect aggregate productivity. In this
regard, significant cross-country differences emerge in a number of areas, such as the initiation of
restructuring, stay on assets, priority rules and the possibility of new financing, fate of incumbent
1. Corresponding authors are: Müge Adalet McGowan ([email protected]) and Dan Andrews
([email protected]) from the OECD Economics Department. The authors would like to thank
Catherine L. Mann, Giuseppe Nicoletti, Jean-Luc Schneider, Alessandro Saia, Ben Westmore, William
Witheridge, Valentine Millot and Peter Pontuch for their valuable comments, and Catherine Chapuis and
Sarah Michelson for excellent statistical and editorial support.
2. For example, see Westmore (2013) and Saia et al. (2015) for links with productivity spillovers; Andrews
and Cingano (2014) for links with labour misallocation; Andrews, Criscuolo and Menon (2014) for links
with capital misallocation; and Adalet McGowan and Andrews (2015) for links with skill mismatch.

ECO/WKP(2016)33
7
management, treatment of dissenting creditors, role of courts, emphasis on employment preservation and
the availability of a fresh start.
5. Focusing on these key features, the paper assesses the suitability of existing policy indicators and
identifies a number of gaps in terms of country and time series coverage, and different features of
insolvency regimes. To address these deficiencies, a short questionnaire to member countries is proposed,
which aims to better document country characteristics of corporate and personal insolvency regimes that
are relevant for productivity outcomes. In turn, these indicators will be used to empirically identify the
contribution of exit policies to capital allocation and aggregate productivity growth in the next phase of the
project.
6. The paper is structured as follows. Section 2 presents the analytical framework linking policies to
firm exit and aggregate productivity growth. Sections 3 and 4 discuss corporate and personal insolvency
regimes in terms of their goals, implicit trade-offs, key design features relevant for explaining cross-
country productivity differences and availability of suitable policy indicators. Section 5 proposes a strategy
to improve policy indicators in the field of corporate and personal insolvency.
2. Exit policies and productivity growth
2.1 Firm exit and aggregate productivity growth
7. A well-functioning exit margin, which sorts successful market activities from unsuccessful ones,
is vital to aggregate productivity growth. Across OECD countries for which estimates are available, exit
rates of firms with at least one employee in the business sector averaged around 9% recently, although
there is significant cross-country variation (Figure 1, Panel A). Firm entry and exit rates are also positively
correlated across industries in OECD countries (OECD, 2003), suggesting a process of “creative
destruction”, whereby cohorts of new firms continuously displace obsolete firms. This market selection
process is productivity-enhancing, in as much as the productivity level of exiting firms is, on average,
lower than that of surviving firms. Indeed, the available cross-country evidence suggests that firm exit
makes an unambiguously positive contribution to aggregate productivity growth – with this effect
particularly strong in the United States where low productivity firms find it more difficult to survive –
while the direct contribution of firm entry is more mixed (OECD, 2003; Alam et al., 2008).3
8. The gains to aggregate productivity are magnified if the scarce resources once consumed by
exiting firms – capital, labour, skills and ideas – can be reallocated to more productive uses. Evidence
suggests that firm exit creates space for new varieties to emerge and that new entrants productively recycle
the assets of defunct firms across a range of activities.4 While this typically reflects the reallocation of
tangible inputs, there is also scope for the post-exit diffusion of codified knowledge to new entrants via
employee mobility and the sales of patents (Hoetker and Agarwal, 2007).5 These gains to aggregate
productivity will be reinforced if workers displaced due to firm bankruptcy are more likely to become
successful entrepreneurs than workers in stable firms (Røed and Skogstrøm, 2014).
3. However, it is important to note that firm entry also exerts indirect effects on aggregate productivity
growth, to the extent that it raises the pressure on incumbent firms to innovate.
4. For example, while prohibition laws in the United States led to the demise of breweries, it unexpectedly
triggered the entry of new soft drink firms as entrepreneurs exploited the market opportunity for new
beverages (Hiatt et al., 2009). Regarding the productive recycling of assets of exiting firms, see Australian
PC (2015) for the airline industry; Hiatt et al., (2009) for beverages and Hoetker and Agarwal (2007) for
the disk drive industry.
5. Of course, this process is likely to be more difficult when knowledge is tacit.

ECO/WKP(2016)33
8
Figure 1. Cross-country evidence on firm exit and job churning
A: Employer enterprise death rate (%) in the total business sector; circa 2006 and circa 2013
B: Gross job flows broken down into the intensive (incumbent firms) and extensive (firm entry and exit) margins
Notes: Panel A – The employer enterprise death rate corresponds to the number of deaths of employer enterprises as a percentage of the population of active enterprises with at least one employee. An employer enterprise death occurs either at the death of an enterprise with at least one employee in the year of death or when an enterprise shrinks to below the threshold of one employee for at least two years. Deaths do not include exits from the population due to mergers, take-overs, break-ups, restructuring of a set of enterprises and exits from a sub-population resulting only from a change of activity. The early period estimates for Latvia, Norway and Slovenia refer to 2005. The final period estimates refer to 2011 for Brazil, New Zealand and the United States, and 2012 for Australia, Canada, France, Israel and Korea. Panel B – the contributions are calculated as gross job creation and destruction by the entrant/exitor and incumbent status over total average employment, averaged across 17 countries (Austria, Belgium, Brazil, France, Finland, Hungary, Italy, Japan, Luxembourg, Netherlands, New Zealand, Norway, Portugal, Spain, Sweden, United Kingdom and United States) and three macro sectors (manufacturing, construction, and non-financial business services).
Source: Panel A – OECD (2015d); Panel B – Criscuolo, Gal and Menon (2014).
0
2
4
6
8
10
12
14
162006 2013
Incumbents9.0%
Incumbents6.7%
Incumbents7.7%
Incumbents8.4%
Extensive3.3%
Extensive3.6%
Extensive2.6%
Extensive3.9%
0%
2%
4%
6%
8%
10%
12%
14%
Job Creation Job Destruction Job Creation Job Destruction
2004-2007 2007-2010

ECO/WKP(2016)33
9
2.2 Public policy and the exit margin
9. This paper explores how public policies can shape the behaviour of distressed firms teetering on
the brink of market exit – i.e. those firms unable to pay their debts as they mature or whose liabilities
exceed their assets – and their implications for aggregate productivity growth. A variety of exit strategies
are open to such firms, including immediate closure, the partial wind-down of operations or internal
restructuring with a view to improve firm performance.6 Of course, firm exit can occur due to voluntary
reasons unrelated to financial distress – i.e. an entrepreneur winding down a business due to retirement or
to pursue different interests – but we abstract from these instances since the scope for public policy to
influence aggregate productivity through this channel is less clear.7
10. Insolvency proceedings, dealing with distressed firms, can result in procedures that aim to: i)
recover money owed to secured creditors by repossessing collateral assets of debtors that fail to make
repayment (i.e. foreclosure); ii) permanently wind up a firm, whereby its assets are sold separately (i.e.
piecemeal liquidation) or as a whole (liquidation as a going concern), and the proceeds are distributed to
creditors; and iii) restore the viability of a debtor’s business and allow the business to continue to operate
through debt forgiveness, debt rescheduling, debt for equity swaps and sale piecemeal or as a going
concern (i.e. restructuring).
11. The prospect of firm exit may elicit a policy response: i) to address market imperfections which
may prevent the orderly exit of failing firms (see below); or ii) because the political salience of job loss due
to firm exit appears much higher than that related to average job churning, which may lead to the erection
of barriers to firm exit. Indeed, the latter issue can be better understood in light of the millions of jobs that
are created and destroyed each year and the fact that firm exit accounts for around one-third of annual
gross job destruction (Figure 1, Panel B). Thus, while governments may intervene on the exit margin for a
variety of reasons, a key challenge is to design such policies in a way that is least harmful to aggregate
productivity growth, while also providing adequate insurance to workers displaced.
2.2.1 Analytical framework
12. Policy-induced distortions which interfere with market selection and the re-allocative capacity of
the economy might entail significant costs to aggregate productivity. Figure 2 illustrates how policies
directly shape aggregate productivity along the exit margin through their impact on two key channels: i)
the strength of market selection, which increases in the economy’s ability to dispose of non-viable firms
and by facilitating the restructuring of viable firms, holds out the prospect for higher within-firm
productivity growth in the future; and ii) the scope and speed at which scarce resources consumed by
failing firms can be reallocated to more productive uses.
13. The framework is deliberately stylised and abstracts from the possibility that: i) some policies
will affect aggregate productivity through other channels (e.g. the impact of product market regulations on
R&D); and ii) firms will endogenously adjust to policies that raise exit costs in terms of their decision to
enter, experiment with radical innovations and choice of capital structure (Box 1).
6. This process could also take place by mergers and acquisitions and offshoring, but these channels are
beyond the scope of the paper.
7. Scattered evidence suggests that the reason for firm exit varies across countries. For example, almost 95%
of firm exits in Australia are for reasons unrelated to a financial failure event (Australian PC, 2015).
Evidence from Belgium, however, suggests that over 40% of firms exit the market through either court
driven procedures (mainly bankruptcy) or voluntary liquidation, while 14% are acquired, merged or split
(Balcaen et al., 2012).

ECO/WKP(2016)33
10
Figure 2. A stylised depiction of how policies can shape productivity growth along the exit margin
Source: OECD calculations.
Box 1. Policy-induced exit costs, firm entry and experimentation
Research suggests that policies that excessively penalise business failure can reduce the supply of risk capital (Armour and Cumming, 2006) and firm entry rates (Peng et al., 2010). However, exit costs can also shape the willingness of new entrants to experiment with new products and processes, which is a defining feature of innovation at the firm level. Evidence from the United States suggests that every year, about 25% of consumer goods for sale are either new or will be discontinued the next year, at least 40% of new goods are sold only for a single year, and plants adopt only between half and a third of the technologies they try (Gabler and Poschke, 2011). Given that the innovation process is inherently uncertain, experimentation allows agents to assess and commercialise projects without investing the full amount and terminate projects quickly if they are not successful (Nanda and Rhodes-Kropf, 2012).
From this perspective, policies that raise the costs of business failure will, all else equal, reduce firms’ incentives to experiment with new ideas. Indeed, theoretical models suggest that exit costs may matter even more than entry costs. This reflects the idea that while entry costs must be incurred by all firms regardless of their innovation strategy, high exit costs will disproportionately affect firms that choose to experiment with riskier business strategies, which entail a high probability of failure (Bartelsman et al., 2008). Policies that excessively penalise business failure may also bias firms’ choice of capital structure towards tangible investments, which are easier to collateralise, at the expense of intangible investments (García-Posada and Mora-Sanguinetti, 2014). Of course, as discussed below, it is important to find an appropriate balance between leniency for failed entrepreneurs and protection to creditors in order to avoid adverse effects on the cost of capital.
2.2.2 Insolvency regimes
14. Insolvency regimes are crucial due to market imperfections – i.e. coordination problems,
incomplete contracts and information asymmetries – which make it difficult in practice for the private
market to facilitate the exit of failing firms in an orderly fashion (Box 2). When a debtor is suspected of
Aggregate productivity
growth
Market exit of non-
viable firms
Internal restructuring
by viable firms
More productive
firms expand
Strength of market
selection
Resource reallocation
from exiting firms
Efficient insolvency
regimes
Competitive pressures
Product market regulations
Public support schemes
Financial regulation
Fiscal distortions
Stance of monetary policy
Corporate governance
Enviromental regulations
Rule of law
Employment protection legislationActive labour market policies
Financial development
Housing market policies
Intellectual property markets Size contingent policies
Judicial
efficiency

ECO/WKP(2016)33
11
being insolvent, creditors have an incentive to engage in a “rush to the exit”, rapidly enforcing their
individual claims, even if it results in a reduction in the total value of recoverable assets. In practice, it is
also difficult for debtors and creditors to write a complete private contract that ensures an optimal outcome
ex ante due to the high number of contingencies and the fact that the debtor can acquire new assets and
liabilities after the initial contract (Hart, 2000). For these reasons, insolvency regimes that contain
provisions to deal in an orderly fashion with the financial distress of commercial entities (i.e. corporate
insolvency regimes) and entrepreneurs who have either been trading as a sole proprietor or who are part of
a closely-held private company (i.e. personal insolvency regimes) are required.
Box 2. The rationale for insolvency regimes: market imperfections on the exit margin
The existence of incomplete contracts and bargaining frictions in the case of firm distress give rise to a number of market imperfections, which private agents cannot address completely. For example:
Asymmetric and incomplete information between debtors and creditors regarding the true value of the firm is an important impediment to efficient bargaining outcomes. Insolvency law can play a verification role by examining the assets and claims to address the problem of asymmetric information (Smith and Strömberg, 2005).
When there are multiple creditors, the interests of individual creditors may conflict with those of the creditors as a collective (Marinc and Vlahu, 2012). Insolvency law can address coordination problems by preventing: i) creditor runs, leading to piecemeal liquidation even though collectively creditors would receive a higher payoff if the firm is preserved as a going concern; and ii) hold-out problems, when each creditor waits for the other creditors to write down their claim first.
A firm will typically have third party stakeholders such as current and past employees (wages and pensions) and tax authorities, who are not directly involved in the bargaining process. Insolvency law can ensure that the rights of such stakeholders are protected by assigning a court-appointed official to be a part of the bargaining, by representing the rights of these parties or by government guarantees of employee and pension claims.
Transaction costs associated with the bargaining process can lower the final value of the firm and cause inefficiencies (Hart, 2000). Insolvency laws can: i) directly reduce such costs (e.g. legal fees) by forcing parties to agree within a defined time period; and ii) indirectly reduce such costs by allowing firms to raise new financing to prevent underinvestment in viable new projects or by allowing incumbent management to stay in control to ensure that their expertise in running the firm can increase the value of the firm.
Insolvency laws can also provide insurance to individual firms which are in distress due to an industry or macroeconomic shock that would result in fire sales (Hotchkiss et al., 2008), by postponing asset sales until liquidity conditions improve.
15. Insolvency regimes that address these market imperfections may also affect multi-factor
productivity (MFP) growth through a variety of channels. First, to the extent that efficient insolvency
regimes can distinguish ex-ante between non-viable and viable firms, they can strengthen market selection
by facilitating the exit of the former and successful internal restructuring of the latter, which holds out the
prospect of higher within-firm productivity growth in the future. Second, they can reduce the likelihood
that scarce resources are trapped in inefficient firms and in turn improve the ease and speed at which such
resources are reallocated to more productive uses. Third, efficient insolvency regimes – by reducing the
cost of failure (Box 1) – can spur firm creation, draw more talented individuals into entrepreneurship and
incentivise radical innovation over conservative business strategies. These reasons may explain the
observed positive link between a lower cost to close a business and aggregate MFP growth via innovation
at the global technological frontier, the broad diffusion of knowledge and efficient resource allocation
(OECD, 2015a).

ECO/WKP(2016)33
12
16. Insolvency regimes also may carry broader implications for labour productivity through their
impact on capital deepening. In some European countries, inefficient insolvency regimes have recently
been identified as a barrier to addressing the rise in non-performing loans (NPLs), which can tie up capital
and burden banks’ loan officers with restructuring tasks rather than making new loans that could finance
investment, which is currently very weak (Bergthaler, et al., 2015; OECD, 2015b). Moreover, without
suitable debt restructuring tools, over-extended firms could have little incentive to invest because any
return is used to service their debt. From this perspective, insolvency regimes also carry important
implications for the stability of the financial system.
17. Before proceeding, however, it is important to note in general equilibrium, the cost of credit and
wages will reflect the risk put on various factor holders by the insolvency regime, which is likely to vary
according to the characteristics of the firm. On the one hand, an insolvency regime that is less punishing of
business failure may be desirable from the perspective of an entrepreneurial start-up firm experimenting
with uncertain technologies. On the other hand, such a system may be less desirable for established firms
which could likely borrow at a lower cost under an alternative regime, given that they have more tangible
assets to pledge as collateral.8 This suggests that the optimal insolvency regimes will likely vary according
to the sector and firm type, and that insolvency regimes designed at the national level will necessarily be
only “second best” and potentially entail distortions.
2.2.3 Other exit policies
18. While efficient insolvency regimes are crucial, the framework in Figure 2 suggests a need for
coherence across a range of other policies, which can be summarised as four key insights.
19. First, an efficient judicial system is crucial for the effectiveness of – and in turn the incentives for
stakeholders to utilise – formal insolvency procedures (Claessens and Klapper, 2005), partly reflecting the
fact that the involvement of courts often accounts for the largest part of insolvency costs. Furthermore,
courts’ ability to verify information and enforce contracts is important for an efficient resolution of
financial distress (Gennaioli, 2013; Gennaioli and Rossi, 2010). Indeed, it is likely that the ability of
insolvency regimes to distinguish viable from non-viable firms will be reduced when courts are congested
and judges lack the requisite expertise (Ayotte and Yun, 2009).
20. Second, product market reforms that raise competitive pressures will increase the efficiency of
the exit margin by making it more difficult for weak firms to survive. In addition to strengthening market
selection, such reforms will increase the likelihood that the resources released by exiting firms will be
reallocated to more productive uses, given the positive association between pro-competitive reforms and
allocative efficiency (Andrews and Cingano, 2014).
21. Third, even if product market regulations are well-designed, inefficient firms may still linger in
the market due to policy features in other areas. For example:
Inappropriate public support schemes: Subsidies to ailing firms or other forms of support for
sunset industries will weaken market selection. One concern is the persistence of crisis-induced
policy initiatives, such as government loan guarantees to SMEs, which are yet to be scaled back
in some OECD countries.
Financial regulation failures: Banks’ lack of incentives to deal with NPLs and realise losses on
their balance sheets, that may arise from corporate bankruptcies may lead to “evergreening”,
8. For example, evidence from Italy suggests that the introduction of reorganization procedures facilitating
loan renegotiation in 2005 increased interest rates and reduced investment, while a subsequent reform in
2006 which strengthened creditor rights in liquidation had an opposite effect (Rodano et al., 2015).

ECO/WKP(2016)33
13
thwarting the natural exit of insolvent firms. For instance, in order to prevent the realization of
losses on their balance sheets, Japanese financial institutions in the 1990s continued to provide
credit to less productive firms, more so among banks that reported capital ratios close to the
required minimum (Peek and Rosengren, 2005; Caballero et al., 2008). Loss recognition may
also become less urgent during periods of very loose monetary policy.
Fiscal distortions: If financially weak firms are over-leveraged, the inherent bias toward debt
over equity in corporate financing, partly induced by tax systems, might prolong the existence of
marginal firms and disproportionately penalise more innovative firms.9 Corporate tax systems
that have preferential rates for small firms, which tend to be less productive, may have similar
effects. Finally, the removal of inheritance tax exemptions for family owned firms may
strengthen market selection to the extent that they lead to the exit of poorly managed family
owned firms (Bloom and Van Reenen, 2007).
Corporate governance issues: The design of corporate law may complicate mergers and
acquisitions and takeover procedures, while corporate governance procedures (e.g. accounting
standards) may be unable to transparently reveal the true financial state of troubled firms.
Lax environmental regulation: A reluctance to tighten environmental policies may weaken
market selection to the extent that more stringent environmental regulations tend to penalise
laggard firms, while being associated with an improvement in productivity outcomes for the
technologically most advanced firms (Albrizio et al., 2014).
Weak rule of law: Lax enforcement of regulations and tolerance for informality may prolong the
survival of marginal firms.
22. Finally, the aggregate impacts of exit policies that strengthen market selection will be enhanced
by reallocation-friendly policies. Policies that facilitate the growth of productive firms will over time make
it increasingly difficult for weak firms to survive, thus indirectly strengthening market selection and help
channel the released resources to more productive uses. Such policies include:
Facilitating job turnover: Easing employment protection legislation (EPL) can facilitate the
reallocation process (Andrews and Cingano, 2014). Collective dismissals (CD) rules are
particularly relevant – i.e. additional delays, costs and notification procedures when an employer
dismisses a large number of workers at a time – since firm exit cannot be realised without CD on
some scale. Crucially, the design of CD legislation varies across countries and it generally
became more restrictive across the OECD over 2008 to 2013 (OECD, 2013a). In some instances,
however, information sharing and consultation between firms and worker representatives may
improve prospects for restructuring to the extent that it facilitates access to training.
Facilitating labour mobility: The productive re-deployment of labour from exiting firms can be
facilitated by housing market policies – e.g. low transaction costs, less cumbersome building
regulations and fewer rent controls – that promote residential mobility. The same is true for well-
designed active labour market policies (ALMPs), which are particularly effective at boosting the
re-employment probabilities of workers displaced by firm exit, compared to workers which lost
their job due to other involuntary reasons (Andrews and Saia, 2016).
9. The impact of reducing corporate income tax rates on market selection is unclear given that marginal firms
are unlikely to have profits and thus will not be directly exposed to the policy change. There may be
indirect effects, however, if reductions in corporate tax rates disproportionately stimulate MFP growth for
firms closer to the frontier (Andrews and Criscuolo, 2013), thus making it more difficult for marginal firms
to survive. But the tendency for frontier firms that are part of a MNE group to shift profits to avoid
corporate taxation further complicates the picture.

ECO/WKP(2016)33
14
Facilitating capital reallocation: Theoretical evidence shows that financial market development
can support the productive reallocation of capital (Buera et al., 2011), while the growth potential
of innovative firms tends to be stronger in countries with higher stock market capitalisation and
more developed risk capital markets (Andrews et al., 2014).
Facilitating the reallocation of intangibles: While there are many barriers to the efficient
reallocation of intangible assets (Andrews and Criscuolo, 2013), intellectual property regimes
that support the development of a secondary market for patents will likely foster the reallocation
of codified knowledge from exiting firms to more productive uses.10
Similarly, less binding non-
compete covenants – which prevent workers from joining competitors or forming spin-offs (Marx
et al., 2009) – may promote the productive re-deployment of tacit knowledge from exiting firms.
Limiting size contingent policies – the costs of which fall more heavily on larger firms – thereby
creating barriers to firm growth. For example, labour regulations in France – which become more
stringent once a firm reaches a size of 50 employees – induce a bunching of firms just below the
50 employee threshold (Garicano et al., 2013). This carries adverse consequences for allocative
efficiency since these firms are relatively more productive than larger firms on the other side of
the threshold.
3. Corporate insolvency regimes
3.1 Goals and best practices
23. To be effective, insolvency regimes should be accessible to distressed firms11
and facilitate exit in
a predictable and expedient manner. More specifically, it should: i) incentivize the restructuring of viable
firms and the liquidation of non-viable ones at low cost in order to maximise the total value of proceeds to
be distributed between creditors, shareholders, employees and other stakeholders12
; ii) balance the interests
of the parties involved to ensure an equitable resolution without discouraging future risk-taking by
investors and entrepreneurs; and iii) provide for a timely resolution of insolvency.
24. The objectives of insolvency regimes are well-established, but there is less consensus on their
optimal design. Given the complementarities between insolvency regimes and other institutional settings,
there is no “one size fits all”. Nevertheless, there have been a number of studies that have outlined
international best practices (IMF, 1999; INSOL, 2000; UNCITRAL, 2004; World Bank, 2015). These
include, but are not restricted to:
A clear trigger that induces either the creditor or the debtor to initiate insolvency proceedings.
This should be designed to encourage debtors to take appropriate actions sufficiently early on in
their financial difficulties, thereby increasing the chances of a successful restructuring.
10. Of course, the rise of patent aggregators (PAs) raises questions about the extent to which the secondary
market is facilitating an efficient reallocation of patents in the IT sector. While PAs could facilitate the
reallocation of intangibles by acquiring patents from bankrupt companies, organising patent auctions and
by helping businesses to obtain the rights to use ideas through licensing arrangements (see Chien, 2009),
substantial deadweight losses arise from litigations prompted by PAs (Bessen, et al., 2012).
11. Until recently, the poor design of the Spanish insolvency regime has meant that secured creditors typically
foreclosed on loans and seized collateral, providing few opportunities for marginal firms to restructure
through formal insolvency procedures (see García-Posada and Mora-Sanguinetti, 2014).
12. These include governments in the form of unpaid taxes and insolvency practitioners.

ECO/WKP(2016)33
15
The availability of an efficient liquidation option and a fair opportunity for rehabilitation, which
helps to assess whether firm value is maximised by liquidation or restructuring. Specifically:
Supporting rehabilitation of viable firms: The regime should provide a mechanism that
prevents a “hold-out” by a minority of creditors by enabling the overriding of their votes
on a restructuring plan by a requisite majority of creditors. The interests of dissenting
creditors should also be protected by ensuring that they are treated in the same way as
similarly situated creditors.
Speedy liquidation of non-viable firms: The system should facilitate the sale of the
business as a going concern, provide flexibility in the liquidation process, and incentivise
the speedy exit of non-viable firms so as to maximize value for all parties.
A design that discourages strategic behaviour by creditors and debtors. For example:
In the absence of well-designed voting rights for creditors, an individual creditor can
threaten to force an inefficient result in the negotiations (Quinn, 1985).
In the absence of credible threats, debtors can also strategically default, i.e. declare
insolvency to obtain debt relief.
Fraudulent entrepreneurs can strategically “tunnel” assets (i.e. transfer assets prior to
insolvency) so it is important that the system can differentiate between honest and
fraudulent entrepreneurs – a distinction that does not exist in many European countries in
contrast to the United States.13
An option for out-of-court settlements (see below for a discussion).
Procedural rules on cross-border insolvency and an equal treatment of foreign and domestic
creditors.
Given that in some countries, corporate insolvency may lead to personal insolvency once the firm
fails, even where the firm is a separate legal entity, the design of personal insolvency regimes
also matter. For example, an efficient personal insolvency regime should take into account the
debtors’ prospects and incentives for future income generation, with a view to enabling a post-
insolvency second chance for entrepreneurs.
3.2 Procedures
25. Figure 3 illustrates the three key stages of the insolvency process and how they relate to the time,
cost and chance of success of the process. Procedures available to enable firms to address their financial
difficulties can be considered in three broad categories:
Out-of-court settlements: Debtors and creditors can renegotiate their contract without formal
intervention by the courts. This may result, for example, in the rescheduling of payments,
reduction of interest rates, or total or partial write-off of the debt or of new loan facilities. Such
out-of-court agreements cannot impose a restructuring plan on dissenting creditors.
Hybrid preventive restructuring procedures: These combine the benefits of judicial control in
formal proceedings (automatic stay of assets, binding effects of a restructuring plan on a
dissenting minority of creditors) with the advantages and low cost of out-of-court procedures
(ease of negotiation, debtors remaining in control of their assets). They should be designed to
13. In the United States, a fraudulent entrepreneur may not be eligible for a debt write-off, will not be eligible
for discharge from records and databases and may be held criminally liable.

ECO/WKP(2016)33
16
balance the relative rights of different stakeholders. For example, while only requiring a majority
of creditors for the approval of a rehabilitation plan contributes to the success of restructuring, a
key issue is how to protect the interests of dissenting creditors.
Formal insolvency or restructuring proceedings: Debtors and creditors negotiate to reduce debt
obligations and restructure or liquidate through the intervention and supervision of the court or an
insolvency administrator, which can restrict their rights and actions. For example, the debtors can
lose control of their assets and the restructuring plan can be binding on all creditors, even if they
are dissenting.
26. The lack or non-widespread use of informal proceedings, particularly in Southern European
countries (see Costantini, 2009), can push viable firms experiencing temporary financial distress into
formal insolvency proceedings. Delays and higher costs associated with formal proceedings can erode the
final value of the firm, prevent the quick reallocation of assets and resources of distressed firms to more
productive uses and limit the opportunity of entrepreneurs to start a new business, lowering business
dynamism. Restrictive insolvency regimes can also result in the relocation of dynamic and innovative
companies to jurisdictions with less restrictive insolvency regimes. Furthermore, lack of informal
proceedings can exacerbate the trade-offs in the design of insolvency regimes.
Figure 3. Key stages of the insolvency process
Source: Carcea et al. (2015).
3.3 Ex ante and ex post efficiency
27. The key trade-off in designing insolvency procedures concerns on the one hand, the incentives it
provides investors to extend credit and to monitor firm performance, and on the other hand, the incentives
it provides debtors to manage the firm efficiently and transparently. Insolvency regimes can promote
efficient outcomes by providing these incentives: i) prior to insolvency when the firm is healthy (ex ante
efficiency); and ii) once the firm is in distress and enters insolvency (ex post efficiency). The literature has
tended to put more emphasis on ex post efficiency incentives, partly because it is easier to measure, but ex
ante efficiency will also be important in order to discourage risky behaviour from creditors and managers
(i.e. moral hazard). Moreover, as discussed below, ex ante and ex post efficiency incentives can conflict
with each other, complicating the design of insolvency regimes.
28. When any inefficient firm enters bankruptcy, the best outcome is to liquidate assets, thereby
releasing capital to higher value uses. In practice, however, filtering – i.e. correctly distinguishing between
viable and non-viable firms – can be a problem. In this regard, some economically inefficient failing firms
mistakenly may be categorised as efficient and allowed to restructure instead of liquidated (type-I errors).
Early signs of distress Insolvency
Low cost/high success
High None
Power of debtor's
management
High cost/low success
Time
Out-of-court workoutsHybrid preventive restructuring
processesFormal insolvency proceedings
Cost and rate of
success

ECO/WKP(2016)33
17
Conversely, type-II errors occur when some economically efficient firms that encounter temporary
financial stress are liquidated, either because no restructuring procedure exists or because the existing
procedure mistakenly categorises them as inefficient.
29. To achieve ex ante efficiency, insolvency laws should act as a screening mechanism that: i)
protects the rights of creditors adequately to give them incentives to supply credit at low cost, but not so
much as to reduce their incentives to closely monitor the debtors’ ability to pay; and ii) provides a
sufficient threat to the debtor and the management to prevent them from taking imprudent loans, so as to
ensure that they take repayment seriously and not conceal the true financial state of the firm (which can
result in type-I errors).14
30. Once the firm enters insolvency, ex post efficiency aims at: i) maximizing the total value of
assets to be divided between debtors, creditors and other stakeholders, including workers; ii) minimising
the cost of insolvency, by preventing a “race to courts” by individual creditors and an inefficient piecemeal
solution (which can result in type-II errors); and iii) reaching a welfare increasing asset reallocation.
31. Features of insolvency regimes can contribute to the ex ante and ex post efficiency aims in
opposite ways. For example, retaining incumbent management might be good for ex post efficiency
especially if they have specialised skills and expertise regarding the firm and also prevent them from high
risk-taking once the firm enters distress (i.e. gambling for resurrection). However, managers who know
that they will stay in charge, might have a weaker incentive to avoid insolvency, thus decreasing ex ante
efficiency (Hart, 1995; Berkovitch et al., 1997).
32. In general, creditor-friendly laws (see below) contribute to achieving ex ante efficiency compared
to debtor-friendly laws, but as the firm approaches insolvency, they can adversely affect ex post efficiency.
Creditor-friendly insolvency regimes guarantee high payoffs to creditors in case of insolvency and provide
a sufficient penalty to the debtor and management such that they do not take unnecessary risks or
strategically default. Ex ante, this leads to improved credit conditions (Berkowitz and White, 2004;
Djankov et al., 2008). However, once the firm enters distress, the debtors – in the knowledge that they will
not be in a strong position – may attempt to postpone insolvency by hiding losses through the use of
creative accounting or increasing cash flow by spending less on R&D and product quality. This problem
may become more acute if incumbent management knows that they will be removed in case of insolvency
(see Section 3.5). The creditors, on the other hand, will have an incentive to liquidate the firm rather than
restructure, resulting in excessive liquidation and a higher likelihood of type-II errors. This could further
reduce the incentives for new entrants to experiment with uncertain technologies and business practices.15
3.4 Key features of corporate insolvency regimes
33. With the three key stages of the restructuring process (Figure 3) and the trade-offs in mind,
Figure 4 provides a broad overview of how the balance of power between creditors and debtors and the
various options open to each party will influence the efficiency of the insolvency regime, assuming away
for the sake of simplicity the possibility that the financial problems of the firms are a product of fraud. We
14. There is conflicting evidence regarding the success of Chapter 11 restructurings in the United States in
minimising type-I errors. On the one hand, evidence suggests that the percentage of large companies
successfully emerging from Chapter 11 has dropped during the 2000s compared to 1980s (Baird and
Rasmussen, 2003). On the other hand, there is some evidence that Chapter 11 forces insolvent firms to
scale down their leverage, and make organisational changes that help to boost firms’ post-insolvency
operating cash flow (Aivazian and Zhou, 2012).
15. Creditor-friendly regimes can also hinder innovation (Acharya and Subramanian, 2009) and allow creditors
to appropriate rents and diminish investment into firm-specific human capital (Berkovitch et al., 1997).

ECO/WKP(2016)33
18
also abstract from other stakeholders, such as the governments, which to the extent that they are owed
taxes from exiting firms may have to finance these losses through adjustments elsewhere, such as higher
corporate income tax rates, for instance. As discussed below, the design of many of these features can vary
across countries with potential consequences for productivity.
34. A priori, having as many options as possible for the resolution of distress is important, without a
bias either towards liquidation or restructuring as this would increase the likelihood of type I and II errors.
It is important to have a well-functioning restructuring procedure because there is some evidence that on
average, recovery rates are higher in restructuring and the restructuring process is not necessarily longer
than liquidation (Bris et al., 2006). Furthermore, efficient preventive restructuring frameworks are
associated with higher levels of entrepreneurship (Carcea, et al., 2015). A working assumption is that
providing opportunities for restructuring is likely to be a desirable feature of insolvency regimes. Of
course, one risk is that non-viable firms use restructuring strategically to seek protection from liquidation,
lengthening the period of distress, reducing the final value of the firm and clogging up courts. Such Type-I
errors clearly imply costs to productivity but our working assumption based on prior research is that these
costs will be significantly less than those associated with insolvency regimes that excessively penalise
failure and do not provide a second chance for failed entrepreneurs.
Figure 4. Key features of insolvency regimes
Source: OECD calculations.
3.5 Cross-country differences in corporate insolvency regimes relevant for productivity
35. The different objectives and the trade-off between ex ante and ex post efficiency are reflected in
cross-country differences in the treatment of corporate insolvency. Insolvency and restructuring regimes
tend to range from very debtor-friendly to creditor-friendly, with different outcomes. Specifically, in some
countries, the most likely outcome of insolvency proceedings is liquidation (e.g. Sweden), while in others,
there is a bias towards restructuring (e.g. France). The United States could be classified as a hybrid
country, where well-defined laws and procedures exist for both liquidation (i.e. Chapter 7) and
restructuring (i.e. Chapter 11).16
36. Typically, Chapter 11 of the United States insolvency code has been viewed as a successful
restructuring system, and contains the following features: i) there is an automatic stay that stops all
payment of interest and principal to creditors and prevents secured creditors from foreclosing on their
collateral; ii) the management continues to run the operation; iii) the debtor may get debtor-in-possession
financing via a line of credit or new financing; iv) to prevent hold-outs, only “impaired” creditors – i.e.
those that would receive less than the value of their loan but greater than zero in liquidation – are allowed
16. In the United States, the firm can initiate both Chapter 7 and Chapter 11 and while creditors can initiate
Chapter 7, incumbent management can potentially convert this action to Chapter 11.
Efficient insolvency
regimes
Debtors:Features that affect the success of restructuring:
1. Automatic stay on assets2. The rights of incumbent management
3. Possibility of new financing and its prioritiesSecond chance possibilities after insolvency:1. Discharge possibilities
2. Exemptions protecting the insolvent debtor 3. Non-financial penalties
4. Difference in treatment of honest and fraudulent entrepreneurs5. Post-insolvency: Credit databases/credit
scoring
Creditors:
1. Voting rules for restructuring plans and the relative rights of dissenting creditors
2. Involvement of courts3. Selection , responsibilities and incentives of insolvency representatives
4. Existence of creditor committees
ECO/WKP(2016)33
19
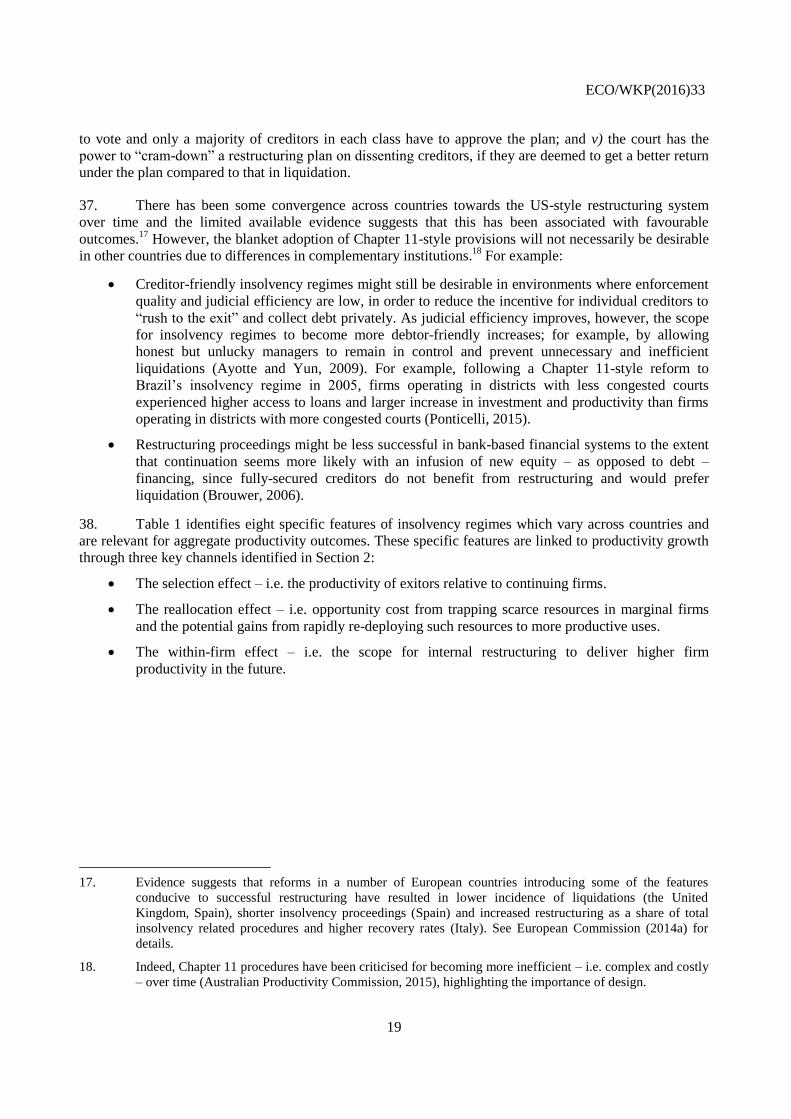
to vote and only a majority of creditors in each class have to approve the plan; and v) the court has the
power to “cram-down” a restructuring plan on dissenting creditors, if they are deemed to get a better return
under the plan compared to that in liquidation.
37. There has been some convergence across countries towards the US-style restructuring system
over time and the limited available evidence suggests that this has been associated with favourable
outcomes.17
However, the blanket adoption of Chapter 11-style provisions will not necessarily be desirable
in other countries due to differences in complementary institutions.18
For example:
Creditor-friendly insolvency regimes might still be desirable in environments where enforcement
quality and judicial efficiency are low, in order to reduce the incentive for individual creditors to
“rush to the exit” and collect debt privately. As judicial efficiency improves, however, the scope
for insolvency regimes to become more debtor-friendly increases; for example, by allowing
honest but unlucky managers to remain in control and prevent unnecessary and inefficient
liquidations (Ayotte and Yun, 2009). For example, following a Chapter 11-style reform to
Brazil’s insolvency regime in 2005, firms operating in districts with less congested courts
experienced higher access to loans and larger increase in investment and productivity than firms
operating in districts with more congested courts (Ponticelli, 2015).
Restructuring proceedings might be less successful in bank-based financial systems to the extent
that continuation seems more likely with an infusion of new equity – as opposed to debt –
financing, since fully-secured creditors do not benefit from restructuring and would prefer
liquidation (Brouwer, 2006).
38. Table 1 identifies eight specific features of insolvency regimes which vary across countries and
are relevant for aggregate productivity outcomes. These specific features are linked to productivity growth
through three key channels identified in Section 2:
The selection effect – i.e. the productivity of exitors relative to continuing firms.
The reallocation effect – i.e. opportunity cost from trapping scarce resources in marginal firms
and the potential gains from rapidly re-deploying such resources to more productive uses.
The within-firm effect – i.e. the scope for internal restructuring to deliver higher firm
productivity in the future.
17. Evidence suggests that reforms in a number of European countries introducing some of the features
conducive to successful restructuring have resulted in lower incidence of liquidations (the United
Kingdom, Spain), shorter insolvency proceedings (Spain) and increased restructuring as a share of total
insolvency related procedures and higher recovery rates (Italy). See European Commission (2014a) for
details.
18. Indeed, Chapter 11 procedures have been criticised for becoming more inefficient – i.e. complex and costly
– over time (Australian Productivity Commission, 2015), highlighting the importance of design.

ECO/WKP(2016)33
20
Table 1. Specific features of insolvency regimes and productivity growth
Notes: The table shows the links between key features of insolvency regimes and productivity growth via three channels (market selection, resource reallocation and within-firm productivity). For example, having a stay on assets gives viable firms the opportunity to restructure successfully – increasing productivity via stronger market selection – which in turn creates scope for future productivity gains via the within-firm productivity channel.
Source: OECD calculations.
39. The first seven features are discussed in the next subsections, while the last feature is considered
in Section 4. While each feature is important in its own right, as discussed below, complementarities may
emerge between some of these features.
3.5.1 Creditors ability to initiate restructuring
40. The possibility of starting restructuring procedures early is a key element of an efficient
insolvency regime as delays can increase costs and make it less likely that viable firms are successfully
restructured (Section 3.1). Hence, it is important that both debtors and creditors have the opportunity and
the right incentives to initiate such procedures. While debtors are allowed to initiate both liquidation and
restructuring in all OECD economies, the ability of creditors to initiate restructuring varies somewhat
across countries (Table A1 in the Appendix).19
41. The lack of creditors’ ability to initiate restructuring may increase the chance that viable firms are
liquidated (i.e. the probability of type-II errors). Giving the creditors an option to initiate restructuring not
only prevents delays and minimises costs, but can also lead to future within-firm productivity gains by
giving viable firms the opportunity to restructure and continue their operations successfully.
42. Complementarities also emerge between the initiation of restructuring and other features of the
insolvency regime. For example, it is especially important that this option is available in countries where
the system may provide low incentives for the debtor to file for restructuring, such as the removal of
incumbent management from the running of the firm (see Section 3.5.4).
19. For example, in Australia, Austria, Belgium, Canada, Chile, Estonia, Greece, Hungary, Iceland, Latvia,
Lithuania, Luxembourg, the Netherlands, Norway and Slovenia, creditors are only allowed to initiate
liquidation, but not restructuring.
Intensive margin
Reallocation effectFuture within firm
productivity
Specific features of insolvency regimesRestructuring of viable
firms
Exit of non-viable
firms
Creditors ability to initiate restructuring + +
Availability of a stay on assets + +
Possibility and priority of new financing over
unsecured creditors+ - +
Retention of incumbent management during
restructuring "+/-" +
Possibility to “cram-down” a restructuring plan
on dissenting creditors+ +
Limited involvement of courts + +
Emphasis on employment preservation - - -
Availability of a "fresh start" + + +
Extensive margin
Selection effect

ECO/WKP(2016)33
21
3.5.2 Availability of a stay on assets
43. Continuity of firm operations during the restructuring process increases the chances of a
successful restructuring. In this regard, having a stay on assets provides room for parties to negotiate
without the interruption of enforcement actions, while the absence of a stay on assets can lead to premature
liquidations, even when the value of keeping the firm in operation is higher than its liquidation value
(Wruck, 1990). This could not only result in a higher probability of viable firms being liquidated, but also
discourage entrepreneurs from starting a new business and affect the innovation strategy adopted by
entrants (Box 1). On the other hand, if creditors have limited ability to recuperate their loan, this can
increase the cost of credit, which can adversely affect entrepreneurship (Armour and Cumming, 2008; Lee
et al., 2011; Broadie et al., 2007). Hence, safeguards are necessary to ensure that the stay is time-limited
and be used strictly to facilitate a restructuring plan.
44. Since 2000, there has been a convergence in the use of stay on assets across OECD countries,
although whether it is granted automatically and the length of the stay varies (Figure A1 in the Appendix).
There is no consensus on whether the stay should be automatic, for example, European Commission
(2014a) recommends that a stay should be granted at the request of the debtor. Nevertheless, the role of a
stay on assets in giving viable firms the opportunity to restructure and continue their operations is widely
acknowledged. Even if the insolvency regime can select viable firms for restructuring, stronger market
selection will not necessarily occur if creditors can disrupt firm operations by claiming productive assets as
is the case when a stay is lacking (Table 1). In this regard, it also improves the chance that internal
restructuring is successful, thus creating scope for future within-firm productivity gains.
3.5.3 Possibility and priority of new financing over unsecured creditors
45. Priority rules refer to the order in which various stakeholders get paid in the event of liquidation.
While these are specified ex ante in the debt contract in accordance with general insolvency laws, there
might be ex post deviations from absolute priority rules. Typically, senior creditors are paid in full prior to
any payment being made to junior creditors. In particular, securitised creditors have the highest priority,
and all creditors have seniority to equity holders or shareholders, who tend to take on riskier investments.
However, there can be other stakeholders – including employees, suppliers and tax authorities – whose
priority rights vary across countries (Table A2 of the Appendix).
46. In general, retaining the (ex ante) priority order increases the efficiency of the system by making
it more predictable and fair. At times, however, deviations from absolute priority may be warranted (e.g.
priority for new financing), when it might lead to a successful restructuring and a higher final recovery
value for all creditors (EC 2014a and 2014b; Bergthaler et al., 2015). However, the extent and the exact
design of the priority is less clear cut. International best practice suggests that such new financing should
be granted priority ahead of unsecured creditors. At the same time, it is important to ensure that existing
creditors do not exploit the priority of new financing to move on to the top of the queue, by injecting new
capital to the firm. Unless it is agreed by the secured creditors, post-commencement financing should
normally not have priority over existing secured creditors since this would adversely affect the availability
of credit and legal certainty.20
20. This applies to cases when all creditors still are more likely to recover their investment with a successful
restructuring than in the alternative case of liquidation. Secured creditors refer to those lenders which hold
a secured claim, i.e. secured by collateral taken as a guarantee to enforce a debt in case of the debtor’s
default. See Section 3.5.7 for a discussion of how priority rules with respect to secured creditors differ
across countries.
ECO/WKP(2016)33
22
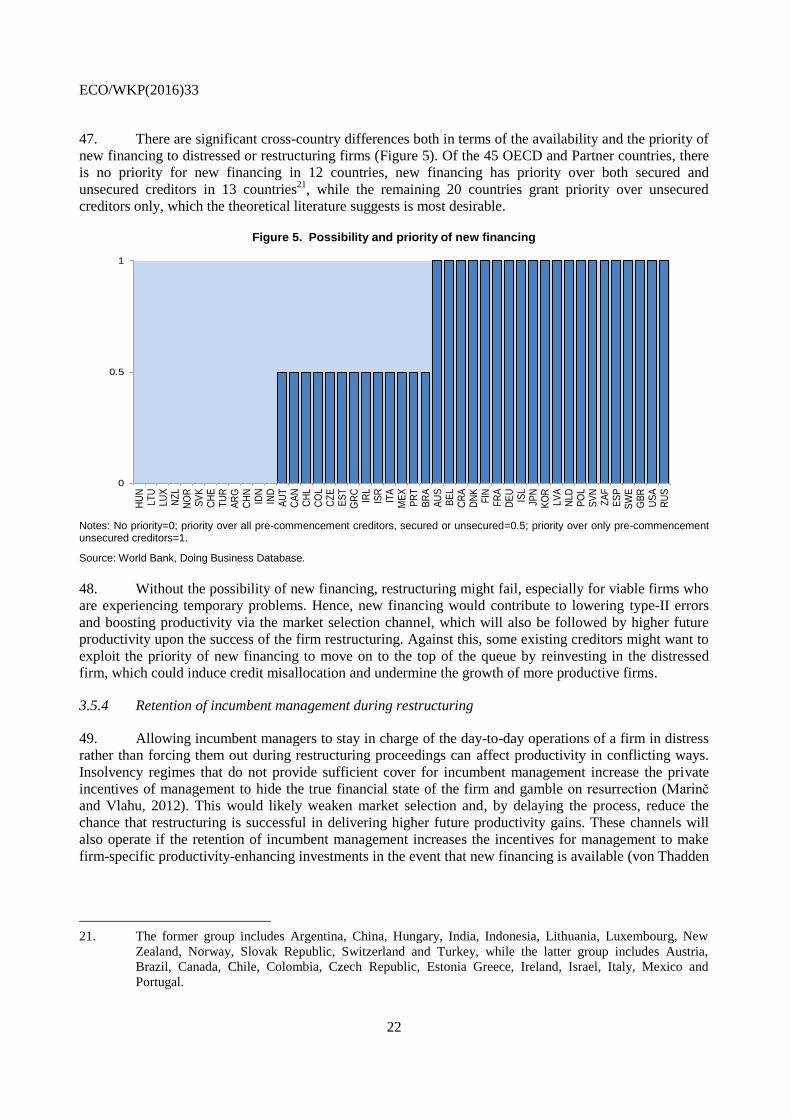
47. There are significant cross-country differences both in terms of the availability and the priority of
new financing to distressed or restructuring firms (Figure 5). Of the 45 OECD and Partner countries, there
is no priority for new financing in 12 countries, new financing has priority over both secured and
unsecured creditors in 13 countries21
, while the remaining 20 countries grant priority over unsecured
creditors only, which the theoretical literature suggests is most desirable.
Figure 5. Possibility and priority of new financing
Notes: No priority=0; priority over all pre-commencement creditors, secured or unsecured=0.5; priority over only pre-commencement unsecured creditors=1.
Source: World Bank, Doing Business Database.
48. Without the possibility of new financing, restructuring might fail, especially for viable firms who
are experiencing temporary problems. Hence, new financing would contribute to lowering type-II errors
and boosting productivity via the market selection channel, which will also be followed by higher future
productivity upon the success of the firm restructuring. Against this, some existing creditors might want to
exploit the priority of new financing to move on to the top of the queue by reinvesting in the distressed
firm, which could induce credit misallocation and undermine the growth of more productive firms.
3.5.4 Retention of incumbent management during restructuring
49. Allowing incumbent managers to stay in charge of the day-to-day operations of a firm in distress
rather than forcing them out during restructuring proceedings can affect productivity in conflicting ways.
Insolvency regimes that do not provide sufficient cover for incumbent management increase the private
incentives of management to hide the true financial state of the firm and gamble on resurrection (Marinč
and Vlahu, 2012). This would likely weaken market selection and, by delaying the process, reduce the
chance that restructuring is successful in delivering higher future productivity gains. These channels will
also operate if the retention of incumbent management increases the incentives for management to make
firm-specific productivity-enhancing investments in the event that new financing is available (von Thadden
21. The former group includes Argentina, China, Hungary, India, Indonesia, Lithuania, Luxembourg, New
Zealand, Norway, Slovak Republic, Switzerland and Turkey, while the latter group includes Austria,
Brazil, Canada, Chile, Colombia, Czech Republic, Estonia Greece, Ireland, Israel, Italy, Mexico and
Portugal.
0
0.5
1
HU
NLT
ULU
XN
ZL
NO
RS
VK
CH
ET
UR
AR
GC
HN
IDN
IND
AU
TC
AN
CH
LC
OL
CZ
EE
ST
GR
CIR
LIS
RIT
AM
EX
PR
TB
RA
AU
SB
EL
CR
AD
NK
FIN
FR
AD
EU
ISL
JPN
KO
RLV
AN
LDP
OL
SV
NZ
AF
ES
PS
WE
GB
RU
SA
RU
S

ECO/WKP(2016)33
23
et al., 2010; Ayotte, 2007).22
Against this, retaining incumbent management could weaken market selection
if it incentivises secured creditors to liquidate, rather than restructure, viable firms (Kaiser, 1996).23
50. Cross-country differences emerge regarding the fate of incumbent managers. As discussed above,
Chapter 11 in the United States allows managers to retain control of the firm. Across European countries,
however, incumbent management retains varying degrees of power in accordance with the responsibility
delegated to the insolvency administrator. Figure 6 shows that even if the debtor is left in control of the
daily operations, supervision by an insolvency practitioner or the courts may be obligatory or at least used,
which can increase costs and the burden on the judicial system. It is also interesting to note that incumbent
management tends to retain control in Southern European countries, where managerial quality is typically
low (Bloom and Van Reenen, 2007; Adalet McGowan and Andrews, 2015).
Figure 6. The fate of incumbent management
Notes: Debtor may be divested of the day-to-day operation of business and an insolvency practitioner is appointed by court=0; An insolvency practitioner is appointed by court but he does not take over the administration of business or the court itself supervises the procedure=1; an insolvency practitioner can be appointed outside court (e.g. elected by the committee of creditors) =2; no obligation to appoint an insolvency practitioner=3.
Source: Carcea et al. (2015).
3.5.5 Possibility to “cram-down” a restructuring plan on dissenting creditors
51. Requiring a unanimous vote by all creditors on a restructuring plan can delay proceedings. Thus,
allowing the approval of such a plan by only a requisite majority of creditors (the so-called “cram-down”)
can strengthen market selection by promoting the timely restructuring of viable firms that encounter
temporary financial difficulties, and deliver higher future within-firm productivity gains. At the same time,
in order to prevent the potential adverse effects on credit supply, it is important that the interests of
22. Of course, it is likely that the design of management compensation schemes will also affect incentives for
firms to undertake costly productivity-enhancing investments, where the benefits might only be realised
with a lag.
23. Furthermore, allowing management to stay on the job can be perceived by creditors as a block to secure
repayment on their debt, thereby increasing the cost of credit and reducing firm entry rates, especially if
creditors believe that managers can default strategically (Moulton and Thomas, 1993).
0
1
2
3

ECO/WKP(2016)33
24
dissenting creditors are protected by ensuring that they are treated equally to other creditors within the
same class and would receive under the plan at least as much as they would receive under liquidation.
52. There are significant cross-country differences in terms of the relative voting rights of creditors
on a restructuring plan (Figure 7). For example, in Austria and Lithuania, there is no possibility of a
majority decision, while in a number of countries (e.g. Greece, Italy and the United Kingdom), certain
categories of creditors (e.g. employees, secured creditors) can be excluded from being bound by a “cram-
down”. There is some tentative evidence that allowing majority decision on plan approval can improve
insolvency outcomes. Until 2014, the Spanish insolvency system did not have the possibility of a “cram-
down”, which increased the cost and time of insolvency proceedings.24
Together with other reforms (e.g.
the introduction of out-of-court settlements for SMEs and consumers and the introduction of the possibility
of a “fresh start”), reforms allowing the “cram-down” of a restructuring plan on dissenting creditors has
shortened the process and lowered the share of firms in liquidation.
Figure 7. Possibility to “cram-down” a restructuring plan on dissenting creditors
Notes: No possibility of majority decision or no possibility of affecting the rights of creditors=0; possibility of majority decision, but certain creditors excluded (tax authorities, employees, secured creditors, commercial creditors)=1; possibility of majority decision involving all types of creditors and all creditors, whether affected or not=2; and possibility of majority decision involving all types of creditors and possibility to involve only those who would be affected by the plan=3.
Source: Carcea et al. (2015).
3.5.6 Limited involvement of courts
53. Court involvement – directly or through court-appointed insolvency practitioners – is important
in guaranteeing the rights of different parties involved and can increase ex post efficiency by acting as a
coordination tool. However, court involvement can come at a cost – particularly for smaller firms that lack
scale to cover the associated fixed costs (Bergthaler et al., 2015) – so it is essential to: i) limit court
involvement to only those cases where it is absolutely necessary; ii) improve the expertise of the courts to
deal with complex insolvency cases where their intervention is required; and iii) effectively design the
compensation schemes for insolvency practitioners.
24. This tended to bias the capital structure of micro firms towards mortgage loans, which require collateral
and tangible investment, and lowered firms’ access to unsecured lending such as venture capital, the firm
size distribution and aggregate productivity (García-Posada and Mora-Sanguinetti, 2014).
0
1
2
3

ECO/WKP(2016)33
25
54. Although some stages of a restructuring process require court involvement, most procedural steps
– in principle – can be dealt with out-of-court. Doing so could reduce the workload of the courts, enabling
them to focus on a more timely resolution of those difficult cases where court involvement is necessary
(Franks and Sussman, 2001; Betker, 1997).
55. When courts are involved in the process, there are cross-country differences regarding the extent
of the discretionary power of the judge (Carcea et al., 2015). These differences typically relate to: i) how
much the judge can affect the decisions about the initial candidates and the ultimate choice of the
insolvency practitioner; and ii) the fate of the firm (i.e. liquidation or restructuring). Limiting the
involvement of courts to where it is only necessary can raise aggregate productivity by facilitating the exit
of non-viable firms (i.e. strengthening market selection) and to the extent this is achieved in a more timely
manner, release scarce resources to be re-deployed to more productive uses (i.e. the reallocation channel).
56. The rationale behind giving discretionary power to the judge is often to prevent “socially
inefficient” liquidations, such as in France where the main objective of insolvency law is to preserve jobs,
which may hinder productivity-enhancing reallocation (see Section 3.5.7). If not well-designed, the
allocation of control rights to an insolvency practitioner could also lead to inefficiencies. For example, the
structure of the compensation schemes for insolvency practitioners in Hungary creates a bias to keep
marginal firms alive despite large operating losses and low recovery rates (Franks and Loranth, 2014).25
57. Slow judicial processes have been identified as a barrier to addressing the rise in NPLs (OECD,
2015b and 2015c). Besides reforms to the insolvency law itself, the use of specialised courts and out-of-
court debt workouts can be ways to address such inefficiencies. Historically, there has been a move
towards out-of-court restructurings during crises as creditors try to avoid costly court-based insolvency
proceedings (Laryea, 2010), including the so-called “London Rules”.26
While the need for a separate,
specialised bankruptcy court depends on certain other institutional factors, cross-country evidence suggests
that some kind of specialisation in expertise of judges and bankruptcy practitioners does pay off, leading to
faster and cheaper procedures and, therefore, better recovery rates (OECD, 2013b; World Bank, 2005).
3.5.7 Emphasis on employment preservation
58. Table A2 shows that priority rules differ across countries, particularly with respect to the
treatment of employee claims. Employees receive limited or no priority in Finland and Germany, while in
other countries (e.g. Australia, Colombia, France, Greece and Mexico), the claims of employees receive
priority over other parties in liquidation.
59. Indeed, the super priority placed on employment preservation in French insolvency law (Plantin
et al., 2013) is reflected in: i) rules that give priority to the payment of unpaid wages before other creditors;
and ii) the strong role of the courts which can choose a plan that maximises employment preservation
without the approval of creditors, even if it results in a lower final value for stakeholders than otherwise
25. The remuneration scheme is based on a fixed percentage of both operating revenues accruing during
bankruptcy and income from asset sales. When expected operating revenues are larger than the potential
income from asset sales, the remuneration scheme creates incentives to operate the firm as a going concern.
See Franks and Loranth (2014).
26. “London Rules” were developed in the 1970s as a solution to collective action problems which forced
many firms into formal insolvency, when restructuring would have been preferable. A similar approach
was used to coordinate workouts during the Asian crisis and more recently in Italy and France (Novarese,
2009; Lucheux and Pusch, 2009).

ECO/WKP(2016)33
26
(Davydenko and Franks, 2008; Blazy et al., 2010).27
This creates a bias toward restructuring, over
liquidation, which can adversely affect productivity by: i) weakening market selection in the event that
non-viable firms are kept on life support; ii) stifling productivity-enhancing reallocation across firms; and
iii) choosing an internal restructuring strategy that is less likely to deliver future within-firm productivity
gains. This raises the question of whether there are more efficient tools – such as well-designed ALMPs –
to support workers displaced by firm exit (Andrews and Saia, 2016).
3.6 Measurement of corporate insolvency regimes
60. Existing policy indicators, generally based on surveys of local insolvency practitioners, a study of
laws and regulations and publicly available information, capture some of the relevant features discussed
above. The two main data sources are the World Bank and the European Commission.
61. Figure 8 shows the strength of insolvency framework from World Bank Doing Business (first
introduced in 2015) where higher values imply that the regime is more efficient at rehabilitating viable
firms and liquidating non-viable ones (Box A1 in the Appendix). The indicator is the sum of four
components: i) access to insolvency (the type of proceedings that can be initiated by the debtor and the
creditor and the trigger for initiation); ii) management of debtors’ assets (the ability of the firm to continue
operations and obtain new financing); iii) practices on the approval and content of the reorganisation plan
(voting rights of creditors); and iv) relative rights of creditors in relation to other creditors, the debtor and
insolvency practitioners.28
62. The World Bank indicator does not capture fully the availability and the length of the stay on
assets, restrictions on dismissal of employees during insolvency proceedings, the relative power of courts
and the fate of management, which as discussed above are also relevant. Moreover, it abstracts from the
features of personal insolvency regimes, which as discussed below, also influence the efficiency of
corporate insolvency regimes. To some extent, some of these gaps can be addressed using the data from the
European Commission (Box A2 in the Appendix), including the role of courts and the fate of incumbent
management. While these data only cover a smaller subset of OECD economies29
, they can be extended to
capture the missing elements for non-European OECD countries as well as updated for the existing sample
of countries, which have made extensive reforms to their insolvency regimes since the end of 2012, when
the questionnaire was conducted. However, more work will be required to deliver a longer time series
suitable for panel econometric analysis.
27. While the insolvency court acts as a referee between the different creditors and the debtor as they negotiate
a restructuring plan in the United States, the court supervises and controls the insolvency process in France.
28. Economies that have reformed their insolvency laws in the past several years score substantially higher on
the strength of insolvency framework index than economies with outdated insolvency provisions, and also
tend to have more credit available to the private sector (World Bank, 2015).
29. These data cover 23 European countries (of which 21 are OECD members and Lithuania and Latvia).

ECO/WKP(2016)33
27
Figure 8. The World Bank strength of insolvency framework indicator
Index ranging from 0 to 16, greater value indicates a stronger insolvency framework, 2015
Source: World Bank Doing Business.
63. Given that the strength of insolvency indicator in Figure 8 was only introduced in 2015, OECD
research has typically used outcome-based measures from World Bank Doing Business to measure the
stringency of corporate bankruptcy regimes, based on a case study introduced in Djankov et al. (2008).
Respondents are asked to estimate the most likely outcome, time to complete the insolvency procedure
(from default to the repayment of all or some of the money owed to the creditor) and the cost of the
proceedings borne by all parties based on the case study outlined in Box A3 of the Appendix.30
These
variables are combined to calculate the recovery rate – i.e. cents in the dollar recouped by the secured
creditors at the end of the proceedings (Figure A2 in the Appendix) – which proxies the present value of
the debt recovered after the deduction of the costs and any value lost as a result of lengthy proceedings.
64. The simplicity of the case study is appealing and it has advantages over surveys asking what the
average time of insolvency proceedings are, since insolvency procedures can be complex and survey
respondents find it difficult to give an exact answer without details on the complexity of the case.
However, it has limitations (see Box 3) which make the case study specific, reducing its ability to capture
the links between the efficiency and the design features of insolvency regimes.
30. More specifically, the cost to close a business refers to court fees and government levies; fees of
insolvency administrators, auctioneers, assessors and lawyers; and all other fees and costs as a proportion
of the debtor’s estate. Information is also available on the number of days it takes to close a business.
0
2
4
6
8
10
12
14
16
IND
LU
XLT
UT
UR
NZ
LH
UN
CR
IA
RG
IDN
IRL
AU
TC
AN
CO
LF
RA
GB
RB
EL
ISL
NE
XN
LD
NO
RS
VN
CH
NR
US
AU
SC
HL
DN
KG
RC
LV
AE
SP
SW
EC
HE
ISR
PO
LS
VK
BR
AC
ZE
ITA
ES
TJP
NF
INK
OR
PR
TZ
AF
DE
UU
SA

ECO/WKP(2016)33
28
Box 3. Limitations of the case study approach underlying the World Bank outcome-based indicators
While the World Bank Resolving Insolvency outcome indicators are useful, the case study approach – based on a hotel with a particular set of characteristics – has a number of limitations that need to be kept in mind. These include:
Only captures corporate insolvency: In many countries, corporate and personal insolvency laws differ and as discussed below, the design of personal insolvency regimes will shape the efficiency of corporate regimes, especially for new entrepreneurs.
Trigger for the event: The firm is unable to meet its obligations due to a demand shock, i.e. worsened market conditions, so the firm might be viable in the long term.
Focus on formal insolvency proceedings: The respondents are not offered the option of out-of court settlements and informal work-out options.
Number and relative rights of creditors: There is only one senior secured creditor, which is a bank. Hence, there are no issues of priority, which is an important element of insolvency regimes. There are also unsecured creditors, but it is not clear what their agenda is and whether they have the power to block a foreclosure, which can differ across countries.
Debtor/management perspective/incentives: The owner and management want to keep the firm operating, so the liquidation option from the debtor perspective is not considered.
Information available to the creditors: The case study assumes that the creditor knows that preservation as a going concern is efficient for the firm, i.e. does not need a court or an independent representative to tell them this information. This is generally not the case and could increase the cost of proceedings.
New financing: The firm does not require additional financing to continue to operate, which can be an important part of a successful restructuring.
Non-complex financial structure: The case involves debt covered by collateral, i.e. the hotel, a tangible asset, while intangible assets are difficult to collateralise. In turn, this can accentuate financing difficulties, partly because the value of intangible assets is more prone to erosion during asset fire sales given the greater tendency of intangible assets to generate firm-specific value.
Other factors not considered: i) the small firm size abstracts from the potential politicisation of bankruptcy; ii) tunneling of assets: the transfer of assets and profits out of firms for the benefit of those who control them, creating pressure for a quick piecemeal sale (not the efficient outcome); and iii) the firm operates only locally
and the fact that debtors can go to other jurisdictions to declare bankruptcy is not captured.
4. Personal insolvency regimes
65. While the different features of corporate insolvency regimes also apply to personal insolvency
regimes, personal insolvency regimes are often more relevant for entrepreneurs and small businesses.
Indeed, the corporate vs non-corporate distinction in assets and liabilities is often blurred for small firms,
either because lenders require personal guarantees or security – e.g. a second mortgage on the owner’s
home – or because prior to incorporating and obtaining limited liability protection, entrepreneurs typically
use personal finances (Berkowitz and White, 2004; Cumming, 2012). Cross-country evidence suggests that
entrepreneur-friendly insolvency laws – defined below – can increase self-employment rates, small
business owners’ use of insolvency proceedings (Armour and Cumming, 2008), firm entry rates (Lee, et
al., 2007; Fan and White, 2003) and attract “better” entrepreneurs (Eberhart, 2014; Fossen, 2014).
66. Efficient personal insolvency systems share many of the same goals and features of an efficient
corporate insolvency regime, such as the need for early warning mechanisms and informal work-outs,
given the potentially high number of insolvency cases that may overburden the courts (Laeven and Laryae,
2009). The remainder of this section discusses a key aspect of a personal insolvency regime – namely its
ability to enable an effective “fresh start” – and cross-country differences in the available indicators.
ECO/WKP(2016)33
29
4.1 The importance of a fresh start
67. The extent to which personal insolvency regimes limit entrepreneurs’ ability to start new
businesses in the future can be driven by the availability of a “fresh start” – i.e. the exemption of future
earnings from obligations to repay past debt due to liquidation bankruptcy. Indeed, the availability of a
“fresh start” can reduce the costs and the stigma of failure associated with insolvency, which is one of the
commonly cited barriers to entrepreneurship. In this regard, the availability of a “fresh start” can increase
productivity via market selection – i.e. making it more likely that non-viable firms exit the market in a
timely fashion – which in turn frees-up scarce resources to be recycled by more productive firms (Table 1).
68. The possibility of a “fresh start” can also foster productivity growth via better incentives for
entrepreneurship and experimentation by: i) increasing firm entry (Cumming, 2012); ii) providing failed
entrepreneurs with a second chance to apply their experience and lessons learnt to ensure their new
businesses grow (Burchell and Hughes, 2006); iii) attracting better quality entrepreneurs – i.e. individuals
with higher observed human capital (Eberhart, et al., 2014)
69. Evidence suggests that wealth has a positive effect on entry into entrepreneurship, reflecting the
presence of credit constraints which are less binding for wealthy potential entrepreneurs (Evans and
Jovanovic, 1989). While the availability of a “fresh start” can reduce personal risks of entrepreneurship, it
may also adversely impact the availability and the cost of credit. Evidence from Germany shows that while
both these effects are stronger for less wealthy individuals, the insurance effect of a more debtor-friendly
personal insolvency regime exceeds the interest rate effect, encouraging less wealthy individuals to
become entrepreneurs, which can contribute to inclusive growth (Fossen, 2014). Thus, the availability of a
“fresh start” may not necessarily imply a trade-off between efficiency and equity.
4.2 Cross-country differences in personal insolvency regimes
70. The availability of cross-country comparable data on personal insolvency regimes is limited. One
potential source is the Armour and Cumming (2008) database which contains for 15 countries over the
period 1990 to 2005 (see Table A3 of the Appendix for details).31
These data contain information on: i) the
availability of and the time to discharge (i.e. the number of years a bankrupt must wait until they are
discharged from pre-bankruptcy indebtedness); ii) the extent of exemptions of assets of the debtor that are
not directly linked to the business (e.g. the family house or a spouse’s assets); and iii) the restrictions
imposed on civil and economic rights of the debtor.32
The latter two features can affect productivity growth
in a similar fashion to a “fresh start”. For example, there is evidence that the generosity of exemptions can
positively affect entrepreneurship by lowering the cost of failure and enabling more risk-averse individuals
to start a business (Gropp et al., 1997), although they can also increase credit costs and collateral
requirements (Berkowitz and White, 2004; Davydenko and Franks, 2008).
71. The European Commission has recently conducted a number of surveys to determine how
friendly the insolvency regime is to entrepreneurs and how likely entrepreneurs are to start a new business
after filing for insolvency (EC, 2014c; EC, 2011). These surveys provide valuable cross-country
information for European countries, given that the stigma of failure associated with insolvency tends to be
high in a number of them (Figure 9, Panel A).
31. The countries included are Austria, Belgium, Canada, Denmark, Finland, France, Germany, Greece,
Ireland, Italy, the Netherlands, Spain, Sweden, the United Kingdom and the United States.
32. These include: i) the loss of power to deal with assets; loss of the right to vote or hold elected office; ii)
restrictions on obtaining credit or on being involved in the management of a firm; and iii) restrictions on
travel or interception of mail or being incarcerated for non-payment of debt.

ECO/WKP(2016)33
30
Figure 9. The stigma of business failure and the availability of a “fresh start”
A: Per cent of 18-64 year olds citing the fear of failure as an obstacle to setting up a business, 2014
B: The availability and length of discharge possibilities for insolvent entrepreneurs, 2012-13
Notes: Panel B: No discharge =0; indefinite discharge period or discretion for the judge or discharge period for more than 3 years=1; discharge period of 3 years but conditional on certain factors such as the payment of a percentage of debt=2; discharge period of 3 years or less with a repayment threshold=3.
Source: Panel A: OECD (2015d), Entrepreneurship at a Glance, Paris. Panel B: Carcea, et al., 2015.
72. One of these surveys discussed in Box A2 in the Appendix shows that there are significant cross-
country differences in discharge possibilities (Figure 9, Panel B). While discharge is unavailable or quite
restrictive in a number of Southern European countries (e.g. Greece, Italy and Spain), discharge conditions
are more conducive to entrepreneurship in the Netherlands, Sweden and the United Kingdom. While these
data are informative, more detailed data on the time to discharge (in years) – rather than an indicator based
on a grouping of countries according to whether their discharge period is greater or smaller than three years
0
10
20
30
40
50
60
70
ZA
F
CH
L
CH
E
SV
N
ME
X
US
A
TU
R
CO
L
NLD
AU
T
BR
A
SV
K
CZ
E
CA
N
SW
E
FIN
CR
I
GB
R
NO
R
IND
ES
P
IDN
PR
T
AU
S
IRL
RU
S
CH
N
DE
U
DN
K
FR
A
ES
T
HU
N
KO
R
LU
X
LT
U
ITA
BE
L
PO
L
ISR
JP
N
GR
C
0
0.5
1
1.5
2
2.5
3

ECO/WKP(2016)33
31
– would be desirable. In response to the cross-country variation, the European Commission has
recommended a harmonisation of discharge periods in Europe to a maximum of three years for honest
entrepreneurs as well as removing their names from credit rating databases a short period of time after
discharge. A harmonisation of procedures is also warranted given the tendency for financially-distressed
individuals and firms to relocate to jurisdictions with more favourable discharge periods (EC, 2014a).
73. The European Commission has also created composite indices for the entrepreneur-friendliness
of the insolvency law and the ease of second chance for 26 countries (EC, 2014c).
Entrepreneur-friendliness of the insolvency law covers: i) whether courts favour debtors or
creditors; ii) length of time of the debt repayment plan; iii) whether the repayment plan is part of
the court procedures; iv) whether there is a separation of judicial and administrative roles; v)
whether creditor committees exist; vi) the average time of insolvency procedures; vii) the
exemptions protecting the insolvent entrepreneur (residential house; certain percentage of
minimum income); and viii) non-financial consequences (e.g. disqualification from positions of
public office or a role that requires financial oversight). According to this indicator, insolvency
laws are entrepreneur-friendly in Austria, Germany and the United Kingdom, while they are
restrictive in Ireland, Norway and Poland (Figure 10, Panel A).33
Ease of second chance after insolvency features: i) the difference in the treatment of honest vs.
fraudulent entrepreneurs; ii) the existence of special procedures for SMEs; iii) the possibility and
time to discharge; iv) the possibility of an automatic discharge, i.e. with no court order; v) the
duration that a negative credit score is maintained; and vi) the possibility of removal from a credit
database after discharge. According to this indicator, chances to successfully restart a business
are low in Denmark, Estonia, Norway and Poland, while honest entrepreneurs can get a second
chance easily in Belgium, Portugal and Slovenia (Figure 10, Panel B).
74. The available data sources suggest that using surveys and publicly available legal sources are
useful in getting information on the relevant institutional characteristics. Hence, updating and extending
the time and country coverage of the Armour and Cumming (2008) data is desirable, given the importance
of personal insolvency regimes for entrepreneurship and productivity, and the fact that there have been
changes to it in a number of OECD countries in recent years, including in Estonia, Greece, Hungary,
Ireland, Italy, Latvia, Poland and Spain (IMF, 2015).34
33. While Norway has a relatively efficient corporate insolvency regime, highly complex legal procedures
which only result in discharge after a long period make the personal insolvency regime less efficient
(OECD, 2014).
34. For example, a 2012 reform in Ireland decreased the time to discharge to 3 years, while in Spain, reforms
to the personal insolvency regime in 2015 made “fresh start” easier.

ECO/WKP(2016)33
32
Figure 10. Insolvency and entrepreneurship
A: Index of entrepreneur-friendliness of insolvency procedures
B: Ease of second chance
Notes: Panel A: This composite index can take values between 0 and 9, with a higher value indicating stronger entrepreneur-friendliness. Panel B: This composite index can take values between 0 and 7, with a higher value indicating an easier second chance.
Source: European Commission (2014c).
5. Discussion and next steps
75. The above analysis suggests that there is a potential for reforms to insolvency regimes and other
policies to contribute to productivity growth via a number of channels. Assessing the size of this potential
and more generally exploring such links empirically could provide avenues for enriching the policymaker’s
toolkit for fighting the productivity slowdown. Such analysis, however, requires indicators of insolvency
regimes that effectively capture the key features that are relevant for productivity outcomes. Accordingly,
to successfully proceed to the next stage of the Exit Policies and Productivity Growth project, the
Secretariat has distributed a short questionnaire to member countries aimed at collecting data on
insolvency rules in OECD countries with a view to enrich and extend the currently available indicators. In
order to control costs, the breadth of the questionnaire would be limited to a few key issues outlined in
more detail in Box 4. To improve the measurement of personal insolvency regimes, countries will be asked
0
1
2
3
4
5
6
7
8
0
1
2
3
4
5
6
7

ECO/WKP(2016)33
33
to provide responses to a limited set of questions in order to leverage off and update the indicators
available in the Armour and Cumming (2008) database. Regarding corporate insolvency regimes, the
questionnaire will contain additional questions to fill the gaps not covered by the World Bank and
European Commission indicators.
Box 4. Details on the proposed insolvency questionnaire
Countries would be asked to provide responses to questions on how forgiving personal insolvency regimes are, based on the features covered in Armour and Cumming (2008). For sake of simplicity and to minimise confusion, these questions will be framed such that countries can provide answers on a YES/NO basis or in terms of the number of years (see Table A2 for more details). More specifically, the Secretariat proposes that:
The 15 OECD countries for which annual indicators are available from 1995 to 2005 provide information concerning developments since 2005, including the year in which any relevant reforms took place.
1
The remaining 19 OECD members and interested partner countries provide information for 2016 and any major reforms that have taken place in these areas since 1995.
Regarding corporate insolvency regimes, a dataset that combines and extends the best features of the World Bank Doing Business strength of insolvency framework indicators introduced in 2015, with the indicators collected by the European Commission in 2013 would be constructed. In this regard, the Secretariat proposes a questionnaire – where questions are framed in similar terms as above – whereby:
Non-European OECD countries and interested partner countries provide responses questions on the features of insolvency regimes that are not fully captured by the World Bank data, including details on the stay on assets, restrictions on dismissal of employees upon the initiation of the insolvency proceedings, the relative power of courts, the ability to “cram down” a restructuring plan on dissenting creditors and the fate of incumbent management.
The 23 European OECD (and partner) countries represented in the European Commission dataset would be asked to provide information concerning developments in the above areas since 2013.
2
To provide scope for panel econometric analysis, all countries would be asked to indicate the state of play with respect to the seven key features of corporate insolvency regimes (see Table 1) at five year intervals since 1995 (i.e.1995, 2000, 2005 and 2010). Countries would also have the option to provide brief and non-technical details on any major reforms in each area.
1. The 15 countries included are: Austria, Belgium, Canada, Denmark, Finland, France, Germany, Greece, Ireland, Italy, the Netherlands, Spain, Sweden, the United Kingdom and the United States.
2. These countries include: Austria, Belgium, the Czech Republic, Estonia, Finland, France, Germany, Greece, Hungary, Ireland, Italy, Latvia, Lithuania, Luxembourg, the Netherlands, Poland, Portugal, Slovak Republic, Slovenia, Spain and the United Kingdom.
76. Obtaining policy indicators that better capture cross-country differences in insolvency regimes
will be crucial for quantification of structural reforms, the Going for Growth exercise and Country
Surveys, especially given the extent of reform in this area over recent years. We plan to explore the
relationship between these indicators of insolvency regimes and labour productivity growth (MFP and
investment) at the aggregate, industry and firm level. The recent acquisition of updated firm level data will
enable us to test the key propositions of the framework developed in Section 2, which links insolvency
regimes and other exit policies to aggregate productivity growth via market selection, resource reallocation
across firms and within-firm productivity improvements.
77. More specifically, the new insolvency indicators – and other complementary policies discussed
above – will be linked to ongoing work on capital misallocation, which recent evidence suggests has
increased over time in some countries (Gopinath et al., 2015). The Secretariat is currently investigating the
prevalence, persistence and implications of financially-weak or “zombie” firms for aggregate productivity.
To the extent that significant cross-country differences emerge, an analysis of the relationship between exit
policies, including the proposed indicators of the efficiency of insolvency regimes, and the prevalence of
zombie firms, will be conducted.

ECO/WKP(2016)33
34
REFERENCES
Acharya, V. and Subramanian, K. (2009), “Bankruptcy Codes and Innovation”, The Review of Financial
Studies, Vol. 22, No. 12.
Adalet McGowan, M. and D. Andrews (2015), “Skill Mismatch and Public Policy in OECD countries”,
OECD Economics Department Working Paper, No. 1210.
Albrizio, S., T. Koźluk and V. Zipperer (2014), “Empirical Evidence on the Effects of Environmental
Policy Stringency on Productivity Growth”, OECD Economics Department Working Papers, No.
1179.
Aivazian, V. and S. Zhou (2012), “Is Chapter 11 Efficient?”, Financial Management, Vol. 41.
Andrews, D., C. Criscuolo and C. Menon (2014), “Do Resources Flow to Patenting Firms?: Cross-Country
Evidence from Firm Level Data”, OECD Economics Department Working Papers, No. 1127.
Andrews, D. and F. Cingano (2014), “Public Policy and Resource Allocation: Evidence from Firms in
OECD Countries”, Economic Policy, No. 29(78), pp. 253-296.
Andrews, D. and A. Saia (2016), “Coping with Creative Destruction: Reducing the Costs of Firm Exit”,
OECD Economics Department Working Papers, No. 1310.
Andrews, D. and C. Criscuolo (2003), “Knowledge Based Capital, Innovation and Resource Allocation”,
OECD Economics Department Working Papers, No. 1046.
Armour, J. and D. Cumming (2008), “Bankruptcy Law and Entrepreneurship”, American Law Economic
Review, Vol. 10, No. 2.
Armour, J. and D. Cumming (2006), “The Legislative Road to Silicon Valley”, Oxford Economic Papers,
Vol. 58.
Alam, A., P. Casero, F. Khan and C. Udomsaph (2008), “Unleashing Prosperity: Productivity Growth in
Eastern Europe and the Former Soviet Union”, World Bank Publications, No. 6588.
Australian Productivity Commission (2015), “Business Set-up, Transfer and Closure”, Draft Report, May
15, Canberra.
Ayotte, K. (2007), “Bankruptcy and Entrepreneurship: The Value of a Fresh Start”, Journal of Law,
Economics and Organisation, Vol. 23.
Ayotte, K. and H. Yun (2009), “Matching Bankruptcy Laws to Legal Environments”, Journal of Law,
Economics and Organisation, Vol. 25.
Baird, D. G., and R. Rasmussen (2003), “Chapter 11 at Twilight”, Stanford Law Review, Vol. 56.
Balcaen, S., J. Buyze., S. Manigart, and H. Ooghe (2012), “Firm Exit after Distress: Differentiating
between Bankruptcy, Voluntary Liquidation and M&A”, Small Business Economics, Vol. 39.
Bartelsman, E.J., E. Perotti and S. Scarpetta (2008), “Barriers to Exit, Experimentation and Comparative
Advantage”, RICAFE2 Working Paper, No. 056, London School of Economics.
Bebchuk, L. (2000), “Using Options to Divide Value in Corporate Bankruptcy”, European Economic
Review, Vol. 44.
Bergthaler, W., K. Kang, Y. Liu and D. Monaghan (2015), “Tackling Small and Medium-sized Enterprise
Problem Loans in Europe”, IMF Staff Discussion Note, No. 4.

ECO/WKP(2016)33
35
Berkovitch, E., R. Israel and J. Zender (1997), “Optimal Bankruptcy Law and Firm-Specific Investments”,
European Economic Review, Vol. 41.
Berkowitz, J. and M. White (2004), “Bankruptcy and Small Firms’ Access to Credit”, RAND Journal of
Economics, Vol. 35.
Bessen, J., J. Ford and M.J. Meurer (2012), “The Private and Social Costs of Patent Trolls, Do Non-
Practicing Entities Benefit Society by Facilitating Markets for Technology”, Regulation.
Betker, B. (1997), “The Administrative Costs of Debt Restructurings: Some Recent Evidence”, Financial
Management, Vol. 26.
Blazy, R., J. Petey and L. Weill (2010), “Can Bankruptcy Codes Create Value? Evidence from Creditors’
Recoveries in France, Germany and the UK”, Laboratoire de Recherche en Gestion et Economie
Working Papers, No. 11.
Blazy, R., B. Chopard, A. Fimayer and J. D. Guigou (2011), “Employment Preservation vs. Creditors’
Repayment under Bankruptcy Law: The French Dilemma?”, International Review of Law and
Economics, Vol. 31, Issue 2.
Bloom, N. and J. Van Reenen (2007), “Measuring and Explaining Management Practices Across Firms
and Countries”, Quarterly Journal of Economics, Vol. 122, No. 4.
Bris, A., I. Welch and N. Zhu (2006), “The Costs of Bankruptcy: Chapter 7 Liquidation versus Chapter 11
Reorganization”, The Journal of Finance, Vol. 61.
Broadie, M., M. Chernov and S. Sundaresan (2007), “Optimal Debt and Equity Values in the Presence of
Chapter 7 and Chapter 11 Reorganisation”, Journal of Finance, Vol. 62.
Brouwer, M. (2006), “Reorganisation in US and European Bankruptcy Law”, European Journal of Law
Economics, Vol. 22.
Buera, F.J., J.P. Kaboski and Y. Shin (2010). ‘Finance and development: a tale of two sectors’, American
Economic Review, 101(5), 1964–2002.
Burchell, B. and A. Hughes (2006), “The Stigma of Failure: An International Comparison of Failure
Tolerance and Second Chancing”, University of Cambridge Centre for Business Research Working
Papers, No. 334.
Caballero, R., T. Hoshi and A.K. Kashyap (2008), “Zombie Lending and Depressed Restructuring in
Japan”, American Economic Review, 98(5), pp. 1943-1977.
Carcea, M.C., D. Ciriraci, C. Cuerpo, D. Lorenzani and P. Pontuch (2015), “The Economic Impact of
Rescue and Recovery Frameworks in the EU”, European Commission Discussion Papers, No. 4.
Chien, C. (2009), “Of Trolls, Davids, Goliaths, and Kings: Narratives and Evidence in the Litigation of
High-Tech Patents”, North Carolina Law Review, 87, pp. 1571-1615.
Claessens S. and L. Klapper (2005), “Bankruptcy Around the World: Explanations of its Relative Use”,
American Law and Economics Review, Vol.7.
Costantini, J. (2009), “Effects of Bankruptcy Procedures on Firm Restructuring: Evidence from Italy”,
mimeo.
Cumming, D. (2012), “Measuring the Effect of Bankruptcy Laws on Entrepreneurship across Countries”,
Journal of Entrepreneurial Finance, Vol. 16.
Davydenko, S. and J. Franks (2008), “Do Bankruptcy Codes Matter? A Study of Defaults in France,
Germany and the UK”, The Journal of Finance, Vol. 63, No.2.
ECO/WKP(2016)33
36
Djankov, S., O. Hart, C. McLiesh and A. Shleifer (2008), “Debt Enforcement Around the World”, Journal
of Political Economy, Vol. 116, No. 6.
Eberhart, R., C. Eesley and K. Eisenhardt (2014), “Failure is an Option: Failure Barriers and New Firm
Performance”, Rock Centre for Corporate Governance at Stanford University Working Paper, No.
111.
Euler Hermes (2014), “International Debt Collection: the Good, the Bad and the Ugly”, Economic Outlook
No. 1213.
European Commission (2014a), Impact Assessment: Commission Recommendation on a New Approach to
Business Failure and Insolvency, Brussels.
European Commission (2014b), Commission Recommendation on a New Approach to Business Failure
and Insolvency, Brussels.
European Commission (2014c), Bankruptcy and Second Chance for Honest Bankrupt Entrepreneurs,
October.
European Commission (2011), Business Dynamics: Start-ups, Business Transfers and Bankruptcy,
Brussels.
Evans, D. and B. Jovanovic (1989), “An Estimated Model of Entrepreneurial Choice under Liquidity
Constraints”, Journal of Political Economy, Vol. 97, pp. 809-827.
Fan, W. and M. White (2003), “”Personal Bankruptcy and the Level of Entrepreneurial Activity”, Journal
of Law and Economics, Vol. 46.
Franks, J. and G. Loranth (2014), “A Study of Bankruptcy Costs and the Allocation of Control”, Review of
Finance, Vol. 18, Issue 3.
Franks, J. and O. Sussman (2001), “Resolving Financial Distress by Way of a Contract: An Empirical
Study of Small UK Companies”, mimeo.
Fossen, F. (2014), “Personal Bankruptcy Law, Wealth, and Entrepreneurship—Evidence from the
Introduction of a Fresh Start Policy”, American Law and Economics Review, Vol. 16.
Gabler, A. and M. Poschke (2011), “Growth through Experimentation”, Centre Interuniversitaire de
Recherche en Économie Quantitative Working Papers, No. 11.
García-Posada, M. and J. S. Mora-Sanguinetti (2014), “Are there Alternatives to Bankruptcy? A Study of
Small Business Distress in Spain”, Journal of the Spanish Economic Association, Vol. 5.
Garicano L, C LeLarge and J Van Reenen (2013), ‘Firm Size Distortions and the Productivity Distribution:
Evidence from France’, NBER Working Paper, No 18841.
Gennaioli, N. (2013), “Optimal Contracts with Enforcement Risk”, Journal of the European Economic
Association, Vol. 11.
Gennaioli, N. and S. Rossi (2010), “Judicial Discretion in Corporate Bankruptcy”, Review of Financial
Studies, Vol. 23.
Gopinath, G., S. Kalemli-Ozcan, L. Karabarbounis and C. Villegas-Sanchez (2015), “Capital Allocation
and Productivity in South Europe”, NBER Working Paper, No. 21453.
Gropp, R., J. Scholz and M. White (1997), “Personal Bankruptcy and Credit Supply and Demand”, The
Quarterly Journal of Economics, Vol. 112.
Hart, O. (2000), “Different Approaches to Bankruptcy”, NBER Working Paper Series, No. 7921.
Hart, O. (1995), Firms, Contracts, and Financial Structure, Oxford: Oxford University Press.

ECO/WKP(2016)33
37
Hiatt, S. R., W.D. Sine and P.S. Tolbert (2009), “From Pabst to Pepsi: The Deinstitutionalization of Social
Practices and the Creation of Entrepreneurial Opportunities”, Administrative Science Quarterly,
54(4).
Hoetker, G. and R. Agarwal (2007), “Death Hurts, but It Isn't Fatal: The Post-exit Diffusion of Knowledge
Created by Innovative Companies”, Academic Management Journal, Vol. 50.
Hotchkiss, E., J. Kose, R. Mooradian and K. Thorburn (2008), “Bankruptcy and the Resolution of
Financial Distress”, in B. Eckbo ed., Handbook of Corporate Finance: Empirical Corporate
Finance, Vol. 2.
IMF (2015), Technical Background Notes to “A Strategy for Resolving Europe’s Problem Loans”,
Washington, DC.
IMF (1999), Orderly and Effective Insolvency Procedures, Washington, DC.
International Federation of Insolvency Professionals-- INSOL (2000), Statement of Principles for a Global
Approach to Multi-Creditor Workouts, London.
Kaiser, K. (1996), “European Bankruptcy Laws: Implications for Corporations Facing Financial Distress”,
Financial Management, Vol. 25.
Laeven, L. and T. Laryea (2009), “Principles for Household Debt Restructuring”, IMF Staff Position Note,
No. 15.
Laryea, T. (2010), “Approaches to Corporate Debt Restructuring in the Wake of The Financial Crisis”,
IMF Staff Position Note, No. 02.
Lee, S., M. Peng and J. Barney (2007), “Bankruptcy Law and Entrepreneurship Development: A Real
Options Perspective”, Academy of Management Review, Vol. 32, No. 1.
Lee, S., Y. Yamakawa, M. Peng, J. Barney (2011), “How do Bankruptcy Laws Affect Entrepreneurship
Development Around the World?”, Journal of Business Venturing, Vol. 26.
Lucheux, J. M. and O. Pusch (2009), “An Overview of French Insolvency Law”, International Financial
Law Review, Online edition.
Marinc, M. and R. Vlahu (2012), The Economics of Bank Bankruptcy Law, Springer-Verlag, Berlin
Heidelberg.
Marx, M., D. Strumsky and L. Fleming (2009), “Mobility, Skills, and the Michigan Non-Compete
Experiment”, Management Science, 55(6), pp. 875-889.
Moulton, W. and T. Howard (1993), “Bankruptcy as a Deliberate Strategy: Theoretical Considerations and
Empirical Evidence”, Strategic Management Journal, Vol. 14.
Nanda, R. and M. Rhodes-Kropf (2012), “Innovation and the Financial Guillotine”, Harvard Business
School Working Paper, No. 13-038.
Novarese, A. (2009), “Bankruptcy Law and Reforms”, in H. Gibbon and Q. Carruthers ed., Corporate
Restructuring: The Breaking Wave, pp.133-136.
OECD (2015a), The Future of Productivity, OECD, Paris.
OECD (2015b), OECD Economic Survey Italy, OECD, Paris.
OECD (2015c), OECD Economic Survey Ireland, OECD, Paris.
OECD (2015d), Entrepreneurship at a Glance, OECD, Paris.
OECD (2014), OECD Economic Survey Norway, OECD, Paris.
OECD (2013a), OECD Employment Outlook, 2013, OECD, Paris.
ECO/WKP(2016)33
38
OECD (2013b), “What Makes Civil Justice Effective?”, OECD Economics Department Policy Notes,
No. 18.
OECD (2003), The Sources of Economic Growth in OECD Countries, OECD, Paris.
Peek, J. and E. Rosengren (2005), “Unnatural Selection: Perverse Incentives and the Misallocation”,
American Economic Review, Vol. 95, No. 4.
Peng, M.W., Y. Yamakawa and S.H. Lee (2010), “Bankruptcy Laws and Entrepreneur Friendliness”,
Entrepreneurship Theory and Practice, Vol. 34, pp. 517-530.
Plantin, G., D. Thesmar and J. Tirole (2013), “Reforming French Bankruptcy Law”, Les Notes du Conseil
d’analyse économique, No. 7.
Ponticelli, J. (2015), “Court Enforcement, Bank Loans and Firm Investment: Evidence from a Bankruptcy
Reform in Brazil”, Chicago Booth Research Paper, No. 14-08.
Quinn, J. (1985), “Corporate Reorganization and Strategic Behaviour: An Economic Analysis of Canadian
Insolvency Law and Recent Proposals for Reform”, Osgoode Hall Law Journal, Vol. 23.
Rodano, G., N. Serrano-Velarde and E. Tarantino (2015), “Bankruptcy Law and Bank Financing”,
Working Papers 547, IGIER (Innocenzo Gasparini Institute for Economic Research), Bocconi
University.
Røed, K and J.F. Skogstrøm (2014), “Job Loss and Entrepreneurship”, Oxford Bulletin of Economics and
Statistics 76(5), pp. 727-744.
Saia, A., D. Andrews and S. Albrizio (2015), “Productivity Spillovers from the Global Frontier and Public
Policy: Industry Level Evidence”, OECD Economics Department Working Paper, No. 1238.
Smith, D. and P. Strömberg (2005), “Maximizing the Value of Distressed Assets: Bankruptcy Law and the
Efficient Reorganization of Firms”, in L. Laeven and P. Honohan ed. Systemic Financial Crises:
Containment and Resolution, Cambridge University Press.
von Thadden, E., E. Berglöf and G. Roland (2010), “The Design of Corporate Debt Structure and
Bankruptcy”, Review of Financial Studies, Vol. 23.
United Nations Commission on International Trade Law --UNCITRAL (2004), Legislative Guide on
Insolvency Law, Vienna.
Westmore, B. (2013), “R&D, Patenting and Productivity: The Role of Public Policy”, OECD Economics
Department Working Paper, No. 1046.
World Bank (2015), “Resolving Insolvency: Measuring the Strength of Insolvency Laws”, Doing Business
Report, Washington, DC.
World Bank (2005), Doing Business in 2005: Removing Obstacles to Growth, Washington DC.
World Bank (2001), Principles and Guidelines for Effective Insolvency and Creditor Rights Systems,
Washington, DC.
Wruck, K. (1990), “Financial Distress, Reorganisation and Organisational Efficiency”, Journal of
Financial Economics, Vol. 27.

ECO/WKP(2016)33
39
APPENDIX: SURVEY OF POLICY INDICATORS
Table A1. Initiation of restructuring by creditors
Source: World Bank, Doing Business Database.
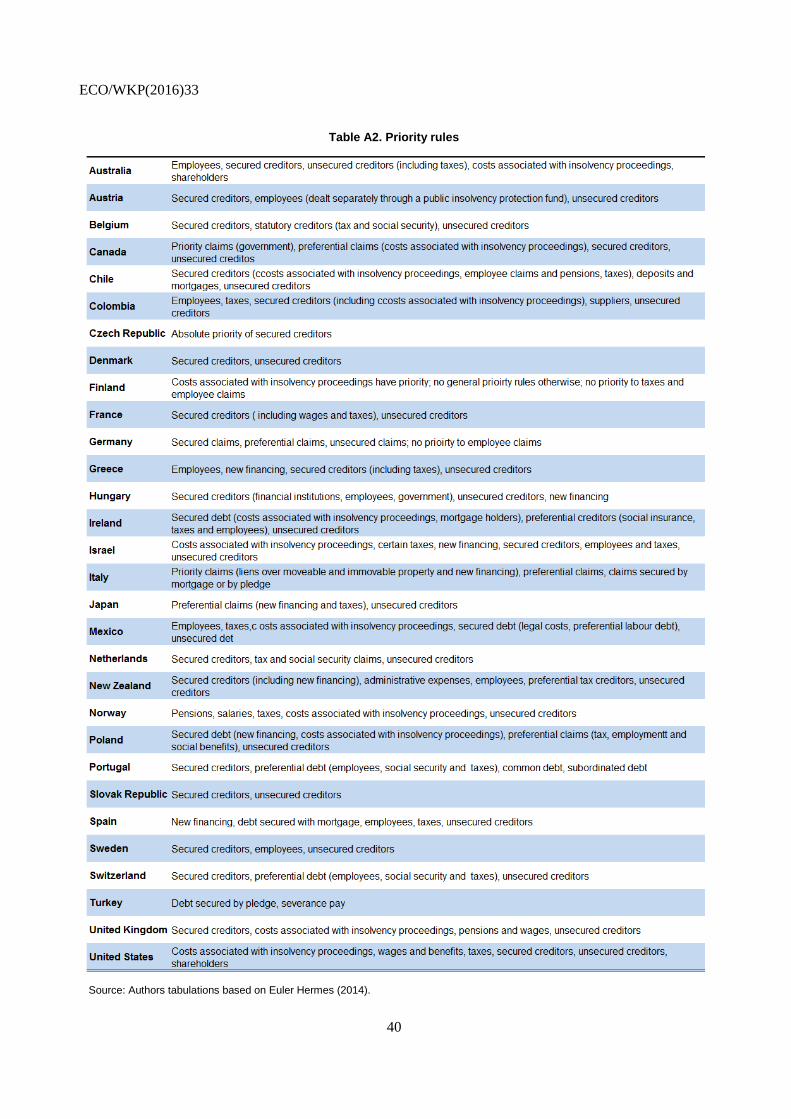
ECO/WKP(2016)33
40
Table A2. Priority rules
Source: Authors tabulations based on Euler Hermes (2014).

ECO/WKP(2016)33
41
Table A3. Key features of personal insolvency regimes
Notes: a. Discharge availability =0 if discharge is available and 1 otherwise. Discharge years take the value of the number of years until typical discharge; if discharge is unavailable, the value is life expectancy minus 40. b. Exemptions relate to pre-bankruptcy assets that are exempted from the bankrupt estate and takes the value 1 if exemptions of assets from the bankruptcy estate cover only personal items, tools of trade, etc.; 0 if exemptions are more generous and 2 if exemptions are “negative,” (i.e., spousal property can be pulled into the estate). c. Disabilities relate to restrictions on the debtor's civil and economic rights related to bankruptcy and takes the value 0 if no disabilities other than loss of power to deal with assets in bankrupt estate and is equal to 1 for civic disabilities (i.e., loss of right to vote, hold elected office, or membership of professional groups); 2 for economic disabilities (i.e., restrictions on obtaining credit or being involved in the management of a company); 3 for interference with mail and/or travel (i.e., prohibition on travel without consent or mail opened by trustee); and 4 if debtor may be incarcerated for non-payment of debts.
Source: Armour and Cumming (2008).
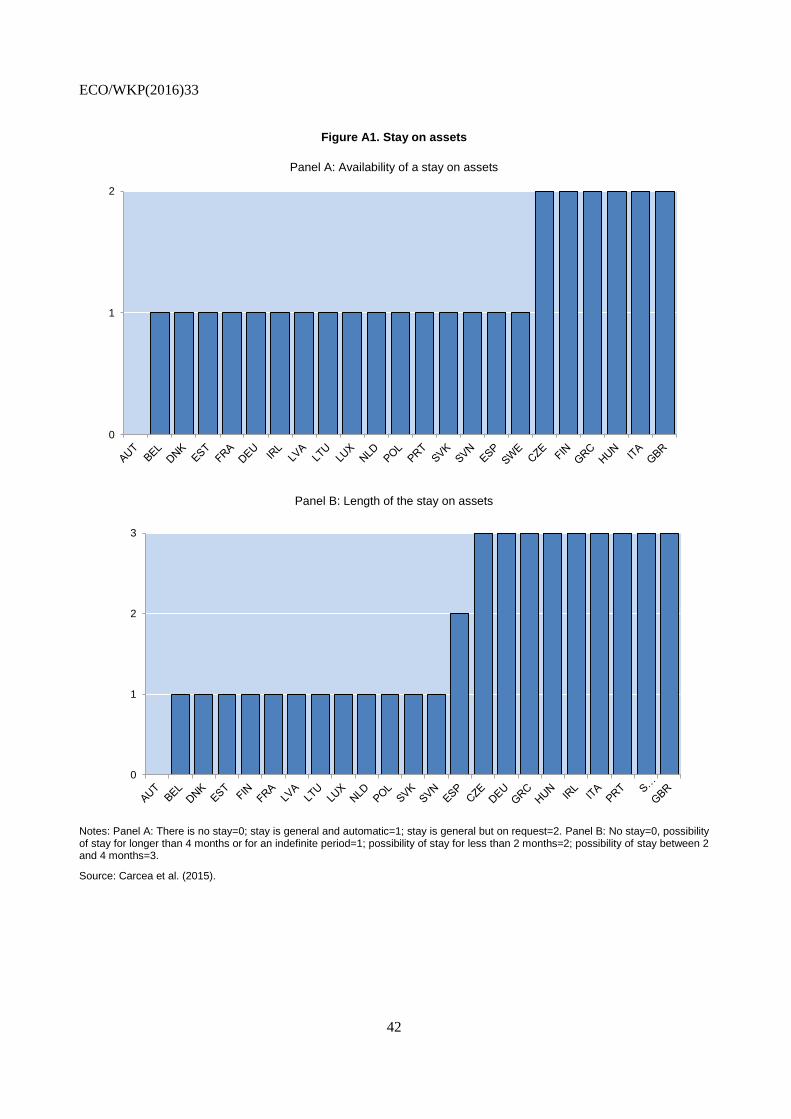
ECO/WKP(2016)33
42
Figure A1. Stay on assets
Panel A: Availability of a stay on assets
Panel B: Length of the stay on assets
Notes: Panel A: There is no stay=0; stay is general and automatic=1; stay is general but on request=2. Panel B: No stay=0, possibility of stay for longer than 4 months or for an indefinite period=1; possibility of stay for less than 2 months=2; possibility of stay between 2 and 4 months=3.
Source: Carcea et al. (2015).
0
1
2
0
1
2
3

ECO/WKP(2016)33
43
Figure A2. Recovery rate of debt for secured creditors
Notes: The recovery rate is the cents in the dollar recouped by the secured creditors at the end of the proceedings.
Source: World Bank, Doing Business Database.
0
10
20
30
40
50
60
70
80
90
100
TU
RB
RA
AR
GIN
DC
RI
IDN
CH
LG
RC
ZA
FC
HN
ES
TR
US
HU
NLT
ULU
XC
HE
LV
AS
VK
PO
LIS
RIT
AC
ZE
ME
XC
OL
ES
PP
RT
SW
EF
RA
US
AA
US
AU
TN
ZL
KO
RD
EU
ISL
CA
NIR
LD
NK
SV
NG
BR
NLD
BE
LF
INN
OR
JP
N

ECO/WKP(2016)33
44
Box A1. The strength of insolvency framework index from World Bank Doing Business
The strength of insolvency framework index is based on the four sub-indices:
Commencement of proceedings: This index ranges from 0 to 3, with higher values indicating greater access to insolvency and has three components: i) what type of proceedings (liquidation or reorganisation or both) can be initiated by debtors; ii) what type of proceedings (liquidation or reorganisation or both) can be initiated by creditors; and iii) what standard is used to declare a debt insolvent: liquidity (the debtor is
unable to pay its debts as they mature) or balance sheet (the liabilities exceed the assets) test.
Management of debtors’ assets: This index ranges from 0 to 6, with higher values indicating more advantageous treatment of the debtors’ assets from the perspective of the company’s stakeholders and measures whether: i) a debtor can continue transactions essential to the survival of the business; ii) a debtor can terminate contracts that are overly burdensome (cost of performance is greater than the benefit received); iii) a debtor can avoid transactions executed before filing for bankruptcy such as those that preferential (which results in a creditor obtaining more than its pro rata share of the debtor’s assets) and undervalued (which were made as a gift or in exchange for less than equivalent value); iv) the debtor can obtain new financing during insolvency proceedings to continue its operations; and v) such financing has
priority over unsecured creditors during the distribution of assets.
Reorganisation proceedings: This index ranges from 0 to 3, with higher values indicating greater compliance with internationally accepted practices on the approval and content of the reorganisation plan and measures whether: i) the plan is voted on only by the creditors whose rights are modified or affected by the plan; ii) the voting creditors are divided into classes and each class votes separately and the creditors within each class are treated equally; and iii) the amount creditors receive under reorganisation is equivalent to that under liquidation.
Creditors’ rights index: This index ranges from 0 to 4, with higher values indicating greater participation and rights of creditors and measures whether: i) creditors participate in the selection of an insolvency representative; ii) creditors are required to approve the sale of debtor’s assets; iii) creditors have access to information about the debtor and the proceedings; and iv) creditors can object to decisions affecting their rights, such as approval of claims of other creditors.

ECO/WKP(2016)33
45
Box A2. The features of insolvency regimes: European Commission data
One source of cross-country data on the different features of insolvency frameworks for members of the European Union is based on a survey conducted by INSOL Europe, the European association of insolvency professionals in 2013. The data from the survey has been used to construct an index of the efficiency of insolvency regimes (Figure A3; Carcea et al., 2015), based on twelve dimensions: i) existence of early restructuring possibilities; ii) conditions for initiating the early restructuring process; iii) existence of alternative preventive procedures; iv) debtor remaining in possession of its assets in preventive procedures; v) possibility of a moratorium (i.e. stay of individual enforcement actions by the creditors against the debtor); vi) length of the moratorium; vii) majority-decision on plan approval as opposed to the requirement of full consensus among creditors (also called cram-down); viii) possibility to obtain new financing in preventive procedures; ix) limited court involvement; x) confidentiality of the agreement; xi) existence of early-warning procedures of insolvency (particularly useful for SMEs); and xii) debt discharge possibilities
following an entrepreneur’s bankruptcy.
Figure A3. Efficiency of insolvency regimes
2012-13
Source: Carcea, et al. (2015).
0.0
0.1
0.2
0.3
0.4
0.5
0.6
0.7
0.8
0.9

ECO/WKP(2016)33
46
Box A3. The basis of the World Bank outcome-based indicator: the case study
The “resolving insolvency” indicator (i.e. cost and time to close a business) from World Bank Doing Business is based on a questionnaire whereby respondents are asked to estimate the most likely outcome, time to complete the insolvency procedure and the cost of the proceedings borne by all parties in light of the following case study:
Mirage is a local limited-liability company that runs a hotel in the economy’s largest city; its only asset and source of income is the hotel property. The value of the hotel is 100 times GNI per capita or USD 200,000 in local currency, whichever is greater. On January 1, 2009, Mirage signed a 10-year loan agreement with BizBank, a local bank. The loan was secured by the hotel property and/or by a universal business charge (an enterprise charge) in those economies where this type of collateral is allowed. BizBank’s outstanding credit is equal to the market value of the hotel and represents 74% of Mirage’s total outstanding debt. The outstanding amount owed to BizBank is exactly equal to the market value of the hotel business.
Unsecured creditors (e.g. suppliers, tax authorities and employees) hold the remaining 26% of Mirage’s debt. Among unsecured creditors, the largest group is Mirage’s suppliers (50 in total), all of which are owed payment for their last deliveries.
Mirage’s founder owns 51% of the company and is the chairman of its board of directors (or equivalent supervisory body). No other shareholder holds more than 5% of the voting power. The company has a professional general manager and 201 employees. All parties in this scenario are local entities or citizens. The founder and Mirage’s management both want to keep the firm operating.
Today is January 1, 2015. Since the execution of the loan agreement with BizBank, Mirage has met all conditions of its loan and made all payments on time. However, at the end of 2014, Mirage experienced an unexpected operating loss due to worsened market conditions. As a result, Mirage will default on its next loan payment to BizBank, which is due tomorrow, January 2, 2015. Mirage can neither obtain a new loan from another financial institution nor renegotiate its current loan with BizBank.
The company expects to have negative net worth and operating losses in both 2015 and 2016. The company’s expected 2015 cash flow will cover all operating expenses, including supplier payments, salaries, maintenance costs and taxes. It will not cover principal or interest payments to BizBank.
If Mirage is sold as a going concern (i.e. as a business that has the resources needed in order to continue to operate in the foreseeable future), it would fetch 100% of its current market value. But if Mirage’s assets are sold piecemeal, they would fetch only 70% of Mirage’s current market value.
Source: World Bank Doing Business.


![Insolvency and Creditor/Debtor Regimes Report (ICR ROSC ......Guide on Insolvency Law] FINANCIAL SECTOR ASSESSMENT PROGRAM and ... - Anti-Money Laundering (IMF/WB) - Corporate Governance](https://img.dokumen.tips/doc/110x75/5f5d61f0b5d45552c12e90c7/insolvency-and-creditordebtor-regimes-report-icr-rosc-guide-on-insolvency.jpg)