Embed Size (px)
Citation preview
Merrill Lynch does and seeks to do business with companies covered in its research reports. As a result, investors should be aware that the firm may have a conflict of interest that could affect the objectivity of this report. Investors should consider this report as only a single factor in making their investment decision. Refer to important disclosures on page 22 to 23. Analyst Certification on page 21. 10547990
Filmed Entertainment
Inside film financing
Equity film financing gaining prominence There has been a flurry of activity of third party film financing over the past couple of years driven in large part by the influx of capital into hedge funds and private equity, with equity investments now more prevalent. This is a change from past financing deals that were largely debt financed. We estimate that 30%+ of negative costs are now being covered by 3rd party financing, with important implications from both a return on capital and an accounting perspective.
Co-financing increases rate of return and reduces risk From a studio perspective, we believe the three primary reasons to use film financing are to reduce risk, increase rates of return and to maintain output to support their distribution infrastructure. Using a Monte Carlo simulation, our mock film slate model suggests the median rate of return is significantly higher for a co-financed slate and the risk (i.e., the coefficient of variation) is markedly lower.
Outside investors attracted by high returns/low correlation In our view, slate deals and the application of portfolio theory have been key to attracting institutional investors that may have previously considered film equity investments to be excessively risky. Our Monte Carlo simulation suggests median levered returns can be above 20%, but that significant leverage (i.e., 2-1 debt to equity) is necessary. Low correlation with the equity markets is also an important consideration for alternative investment managers, in our opinion.
Co-financing reduces EBITDA and margins The accounting impact from 3rd party financing may surprise investors. Assuming the studio self-distributes and takes on the P&A risk, revenue does not change. However, EBITDA falls (assuming the slate is profitable), as participations owed to the 3rd party more than offsets the reduction in film amortization. This has the net effect of lowering margins.
Industry Overview
Equity | Americas | Entertainment 13 September 2006
Jessica Reif Cohen +1 212 449 3334 Research Analyst MLPF&S [email protected] Michael Kopelman +1 212 449 6452 Research Analyst MLPF&S [email protected] Robert Fishman +1 212 449 8566 Research Analyst MLPF&S [email protected] Lucas Ramirez, CFA +1 212 449-9719 Research Analyst MLPF&S [email protected]
Fi lmed Enter ta inment 13 September 2006
2
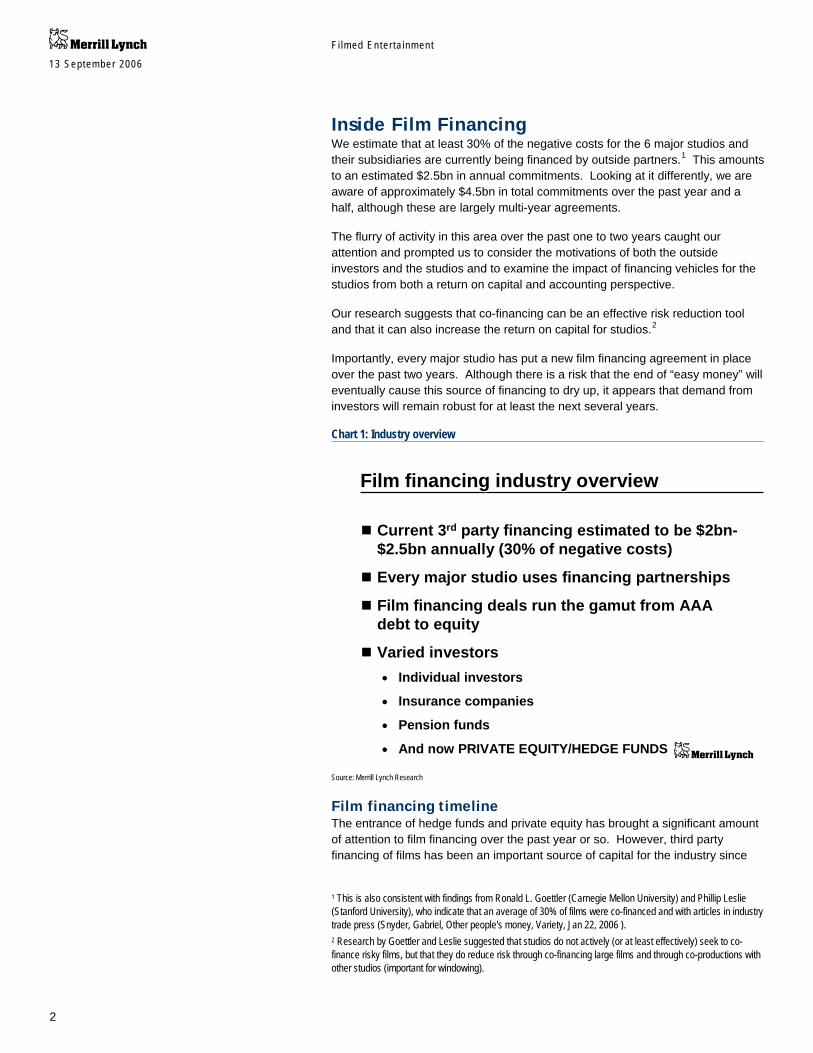
Inside Film Financing We estimate that at least 30% of the negative costs for the 6 major studios and their subsidiaries are currently being financed by outside partners.1 This amounts to an estimated $2.5bn in annual commitments. Looking at it differently, we are aware of approximately $4.5bn in total commitments over the past year and a half, although these are largely multi-year agreements.
The flurry of activity in this area over the past one to two years caught our attention and prompted us to consider the motivations of both the outside investors and the studios and to examine the impact of financing vehicles for the studios from both a return on capital and accounting perspective.
Our research suggests that co-financing can be an effective risk reduction tool and that it can also increase the return on capital for studios.2
Importantly, every major studio has put a new film financing agreement in place over the past two years. Although there is a risk that the end of “easy money” will eventually cause this source of financing to dry up, it appears that demand from investors will remain robust for at least the next several years.
Chart 1: Industry overview
Refer to important disclosures on pages 24- 28.
Current 3rd party financing estimated to be $2bn-$2.5bn annually (30% of negative costs)
Every major studio uses financing partnerships
Film financing deals run the gamut from AAA debt to equity
Varied investors• Individual investors
• Insurance companies
• Pension funds
• And now PRIVATE EQUITY/HEDGE FUNDS
Film financing industry overviewFilm financing industry overview
Source: Merrill Lynch Research
Film financing timeline The entrance of hedge funds and private equity has brought a significant amount of attention to film financing over the past year or so. However, third party financing of films has been an important source of capital for the industry since
1 This is also consistent with findings from Ronald L. Goettler (Carnegie Mellon University) and Phillip Leslie (Stanford University), who indicate that an average of 30% of films were co-financed and with articles in industry trade press (Snyder, Gabriel, Other people's money, Variety, Jan 22, 2006 ). 2 Research by Goettler and Leslie suggested that studios do not actively (or at least effectively) seek to co-finance risky films, but that they do reduce risk through co-financing large films and through co-productions with other studios (important for windowing).

Fi lmed Enter ta inment 13 September 2006
3
the 1970’s.3 The first wave of outside financing was largely driven by the desire to take advantage of incentives written into the U.S. tax code and designed to prevent runaway production. These incentives initially allowed investors to depreciate their film investments in a relatively short time frame, even if the investment was largely debt financed. The full amount of the investment was deductible for tax purposes, even when the investors’ own money was not truly at risk. These rules were tightened in the mid 70’s, but substantial tax advantages remained, largely the ability to use accelerated depreciation. These tax incentives created the opportunity for studios to engage in tax arbitrage through agreements with financing partners. The demand for these vehicles fell following the 1986 tax reform and the market correction of 1987.4
Chart 2: Film financing timeline
Refer to important disclosures on pages 24- 28.
Film financing timelineFilm financing timeline
• Surge in limited partnerships
• First wave of outside equity money
• Tax incentives the key driver
• Mostly individual investors
• 1987 Silver Screen Partners JV with Disney
• ~$400mn raised in issuance of LP Units
• Financed 33 films with total budgets of ~$600mn
• Disney bought Silver Screen Partners’ interest in JV in 1995 for ~$330mn.
• Hedge funds/private equity funds become more prominent
• Slate deals
• ~$3-4bn in commitments
• Marvel - $525mn
• Magic Films (Disney) - $300mn
• Weinstein Co. - $500mn
• Legendary - $500mn
• DreamWorks - $1.0bn
• Universal - $1.0bn
• Debt Securitizations
• Mostly credit enhanced
• German and other foreign investment takes increasing role due to tax credits
• Millennium Film (Fox) - $1.0bn
• Galaxy Film (Universal) - $1.1bn
1980 1990 Present2000
Mostly debt financing
Institutional investors:
• Insurance companies
• Pension funds
Source: Merrill Lynch Research, Desai, A. Mihir, et.al., The Strategy and Sources of Motion Picture Finance, Harvard Business School. Source: Merrill Lynch Research
Financing vehicles started to reappear in force in 1995. The key to these deals was a realization that the portfolio theory used for stocks could also be applied to films. This is consistent with the Monte Carlo simulation we ran for our mock slate and with academic research done in this area. A diversified portfolio of films, say 20-25, should provide significant benefits by reducing the volatility of returns. The portfolio approach and cross collaterization of the films in a slate were key to attracting institutional investors, in our view.
Towards the end of the 1990’s foreign tax shelters become more prevalent, with German investors taking a lead role. U.S. studios sold the copyright of the film to a German company and then arranged to lease it back for lease and option payments of approximately 10% less than the sale price, generating an instant profit for the U.S. studios.5 German investors benefited by taking an immediate
3 For a good overview of the industry see Desai, A. Mihir, et.al., The Strategy and Sources of Motion Picture Finance, Harvard Business School. 4 Desai, A. Mihir, et.al. 5 Bardeen, William and Shaw, Claude, Tax-Motivated German Financing of the U.S. Film Industry, Columbia Business School, Fall 2004.
Fi lmed Enter ta inment 13 September 2006
4
tax deduction for the purchase amount, allowing them to defer tax payments until some point in the future. Although tax credits for film production are not particularly unusual, Germany’s laws were extremely permissive in that they did not require the film to be produced locally or to employ local personnel.6
The tightening of loopholes in Germany in the past few years has coincided with a surge in alternative investment funds, which we believe are now the primary source of outside financing for film slates.
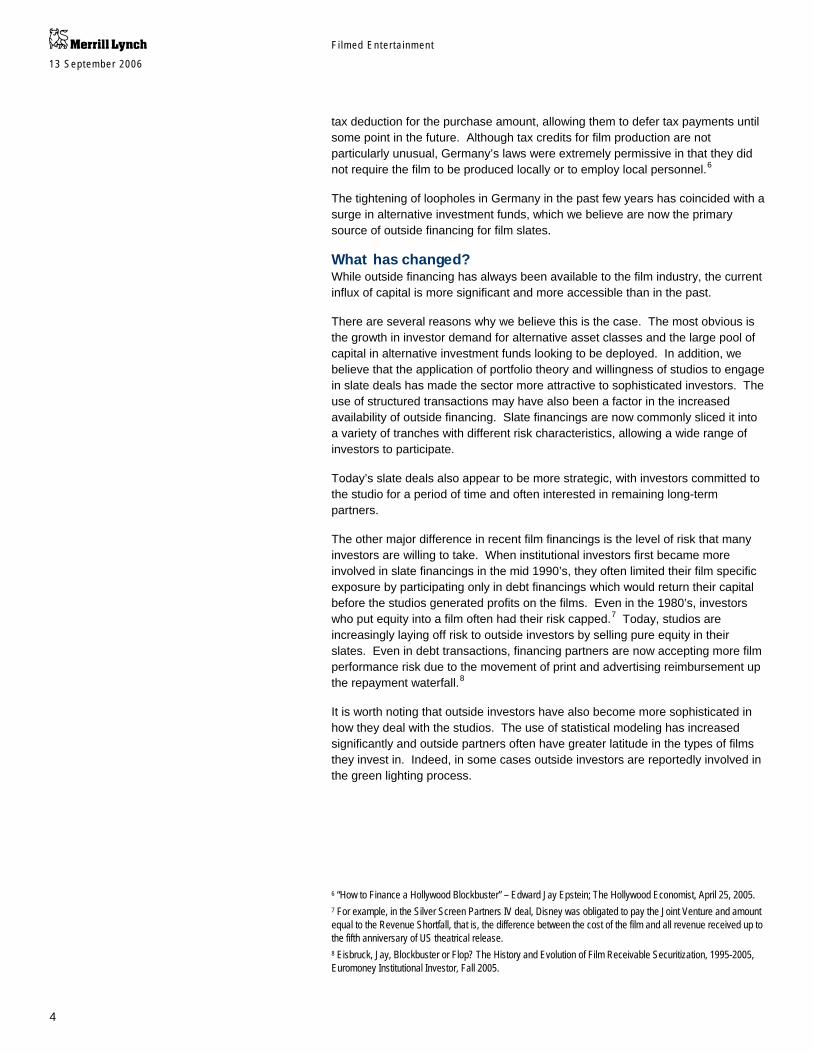
What has changed? While outside financing has always been available to the film industry, the current influx of capital is more significant and more accessible than in the past.
There are several reasons why we believe this is the case. The most obvious is the growth in investor demand for alternative asset classes and the large pool of capital in alternative investment funds looking to be deployed. In addition, we believe that the application of portfolio theory and willingness of studios to engage in slate deals has made the sector more attractive to sophisticated investors. The use of structured transactions may have also been a factor in the increased availability of outside financing. Slate financings are now commonly sliced it into a variety of tranches with different risk characteristics, allowing a wide range of investors to participate.
Today’s slate deals also appear to be more strategic, with investors committed to the studio for a period of time and often interested in remaining long-term partners.
The other major difference in recent film financings is the level of risk that many investors are willing to take. When institutional investors first became more involved in slate financings in the mid 1990’s, they often limited their film specific exposure by participating only in debt financings which would return their capital before the studios generated profits on the films. Even in the 1980’s, investors who put equity into a film often had their risk capped.7 Today, studios are increasingly laying off risk to outside investors by selling pure equity in their slates. Even in debt transactions, financing partners are now accepting more film performance risk due to the movement of print and advertising reimbursement up the repayment waterfall.8
It is worth noting that outside investors have also become more sophisticated in how they deal with the studios. The use of statistical modeling has increased significantly and outside partners often have greater latitude in the types of films they invest in. Indeed, in some cases outside investors are reportedly involved in the green lighting process.
6 “How to Finance a Hollywood Blockbuster” – Edward Jay Epstein; The Hollywood Economist, April 25, 2005. 7 For example, in the Silver Screen Partners IV deal, Disney was obligated to pay the Joint Venture and amount equal to the Revenue Shortfall, that is, the difference between the cost of the film and all revenue received up to the fifth anniversary of US theatrical release. 8 Eisbruck, Jay, Blockbuster or Flop? The History and Evolution of Film Receivable Securitization, 1995-2005, Euromoney Institutional Investor, Fall 2005.
Fi lmed Enter ta inment 13 September 2006
5
Chart 3: What has changed?
Refer to important disclosures on pages 24- 28.
What has changed?What has changed?
Mainly institutionsMainly institutions
Increased availability of capital Increased availability of capital
Slate dealsSlate deals
More structured transactionsMore structured transactions
More strategic partnershipsMore strategic partnerships
P&A reimbursement at top of P&A reimbursement at top of waterfallwaterfall
Mainly individual investorsMainly individual investors
Often tax drivenOften tax driven
Single tranche common Single tranche common
OpportunisticOpportunistic
Portion of P&A subordinatedPortion of P&A subordinated
TodayTodayHistoricallyHistorically
Source: Merrill Lynch Research
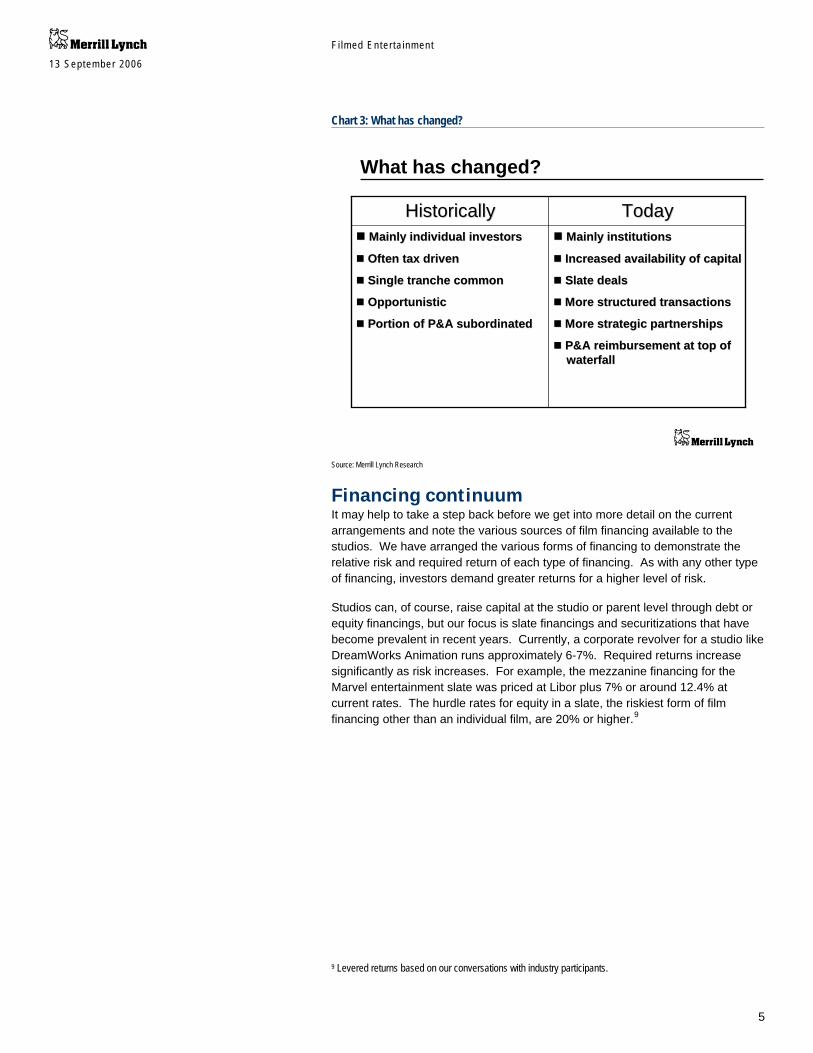
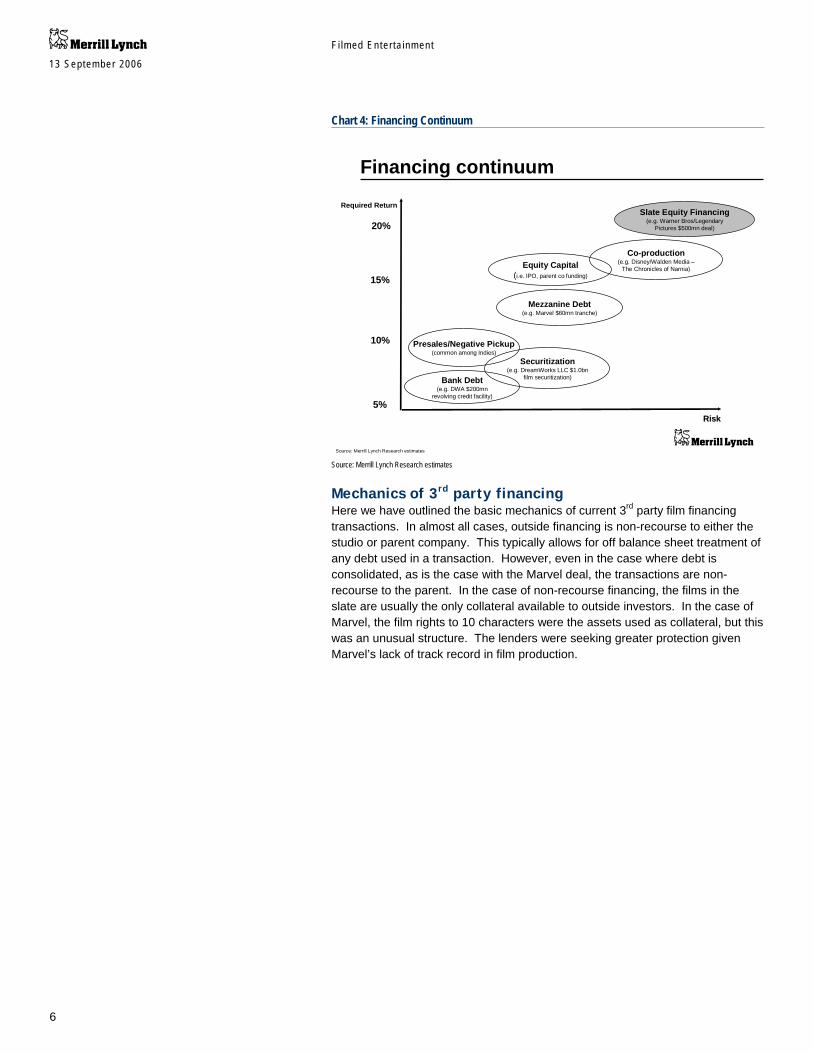
Financing continuum It may help to take a step back before we get into more detail on the current arrangements and note the various sources of film financing available to the studios. We have arranged the various forms of financing to demonstrate the relative risk and required return of each type of financing. As with any other type of financing, investors demand greater returns for a higher level of risk.
Studios can, of course, raise capital at the studio or parent level through debt or equity financings, but our focus is slate financings and securitizations that have become prevalent in recent years. Currently, a corporate revolver for a studio like DreamWorks Animation runs approximately 6-7%. Required returns increase significantly as risk increases. For example, the mezzanine financing for the Marvel entertainment slate was priced at Libor plus 7% or around 12.4% at current rates. The hurdle rates for equity in a slate, the riskiest form of film financing other than an individual film, are 20% or higher.9
9 Levered returns based on our conversations with industry participants.
Fi lmed Enter ta inment 13 September 2006
6
Chart 4: Financing Continuum
Refer to important disclosures on pages 24- 28.
Financing continuum Financing continuum
Required Return
20%
5%
15%
RiskRisk
Equity Capital(i.e. IPO, parent co funding)
Securitization(e.g. DreamWorks LLC $1.0bn
film securitization)Bank Debt(e.g. DWA $200mn
revolving credit facility)
Presales/Negative Pickup(common among Indies)
Slate Equity Financing(e.g. Warner Bros/Legendary
Pictures $500mn deal)
Co-production(e.g. Disney/Walden Media –
The Chronicles of Narnia)
Mezzanine Debt(e.g. Marvel $60mn tranche)
10%
Source: Merrill Lynch Research estimates Source: Merrill Lynch Research estimates
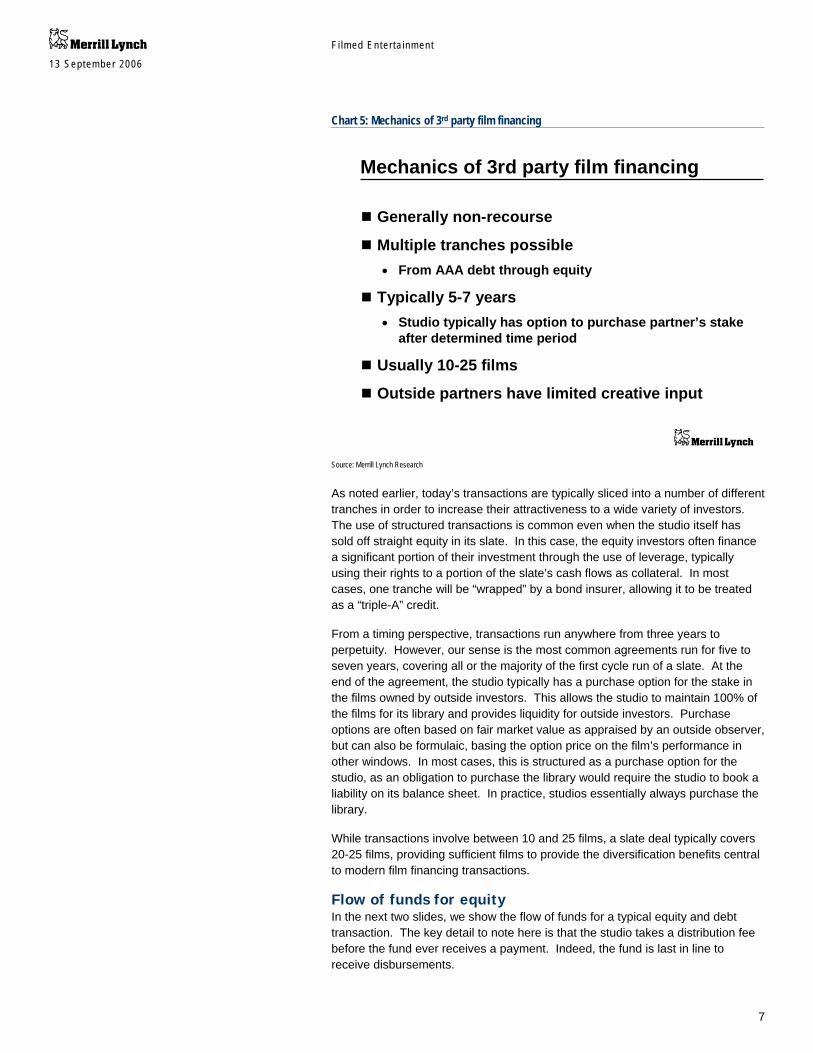
Mechanics of 3rd party financing Here we have outlined the basic mechanics of current 3rd party film financing transactions. In almost all cases, outside financing is non-recourse to either the studio or parent company. This typically allows for off balance sheet treatment of any debt used in a transaction. However, even in the case where debt is consolidated, as is the case with the Marvel deal, the transactions are non-recourse to the parent. In the case of non-recourse financing, the films in the slate are usually the only collateral available to outside investors. In the case of Marvel, the film rights to 10 characters were the assets used as collateral, but this was an unusual structure. The lenders were seeking greater protection given Marvel’s lack of track record in film production.
Fi lmed Enter ta inment 13 September 2006
7
Chart 5: Mechanics of 3rd party film financing
Refer to important disclosures on pages 24- 28.
Generally non-recourse
Multiple tranches possible• From AAA debt through equity
Typically 5-7 years• Studio typically has option to purchase partner’s stake
after determined time period
Usually 10-25 films
Outside partners have limited creative input
Generally non-recourse
Multiple tranches possible• From AAA debt through equity
Typically 5-7 years• Studio typically has option to purchase partner’s stake
after determined time period
Usually 10-25 films
Outside partners have limited creative input
Mechanics of 3rd party film financingMechanics of 3rd party film financing
Source: Merrill Lynch Research
As noted earlier, today’s transactions are typically sliced into a number of different tranches in order to increase their attractiveness to a wide variety of investors. The use of structured transactions is common even when the studio itself has sold off straight equity in its slate. In this case, the equity investors often finance a significant portion of their investment through the use of leverage, typically using their rights to a portion of the slate’s cash flows as collateral. In most cases, one tranche will be “wrapped” by a bond insurer, allowing it to be treated as a “triple-A” credit.
From a timing perspective, transactions run anywhere from three years to perpetuity. However, our sense is the most common agreements run for five to seven years, covering all or the majority of the first cycle run of a slate. At the end of the agreement, the studio typically has a purchase option for the stake in the films owned by outside investors. This allows the studio to maintain 100% of the films for its library and provides liquidity for outside investors. Purchase options are often based on fair market value as appraised by an outside observer, but can also be formulaic, basing the option price on the film’s performance in other windows. In most cases, this is structured as a purchase option for the studio, as an obligation to purchase the library would require the studio to book a liability on its balance sheet. In practice, studios essentially always purchase the library.
While transactions involve between 10 and 25 films, a slate deal typically covers 20-25 films, providing sufficient films to provide the diversification benefits central to modern film financing transactions.
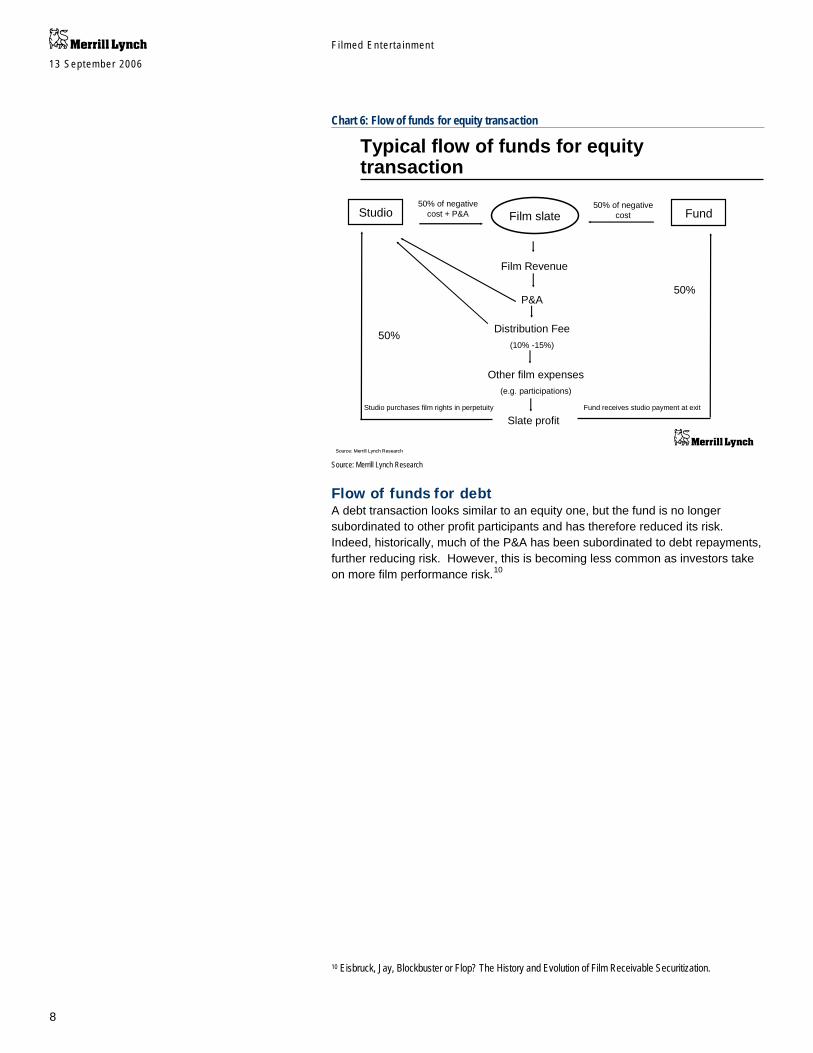
Flow of funds for equity In the next two slides, we show the flow of funds for a typical equity and debt transaction. The key detail to note here is that the studio takes a distribution fee before the fund ever receives a payment. Indeed, the fund is last in line to receive disbursements.
Fi lmed Enter ta inment 13 September 2006
8
Chart 6: Flow of funds for equity transaction
Refer to important disclosures on pages 24- 28.
Typical flow of funds for equity transactionTypical flow of funds for equity transaction
Film slateStudio Fund50% of negative
cost + P&A50% of negative
cost
Film Revenue
P&A
Distribution Fee(10% -15%)
Slate profit
50%
50%
Studio purchases film rights in perpetuity
Other film expenses(e.g. participations)
Fund receives studio payment at exit
Source: Merrill Lynch ResearchSource: Merrill Lynch Research Source: Merrill Lynch Research
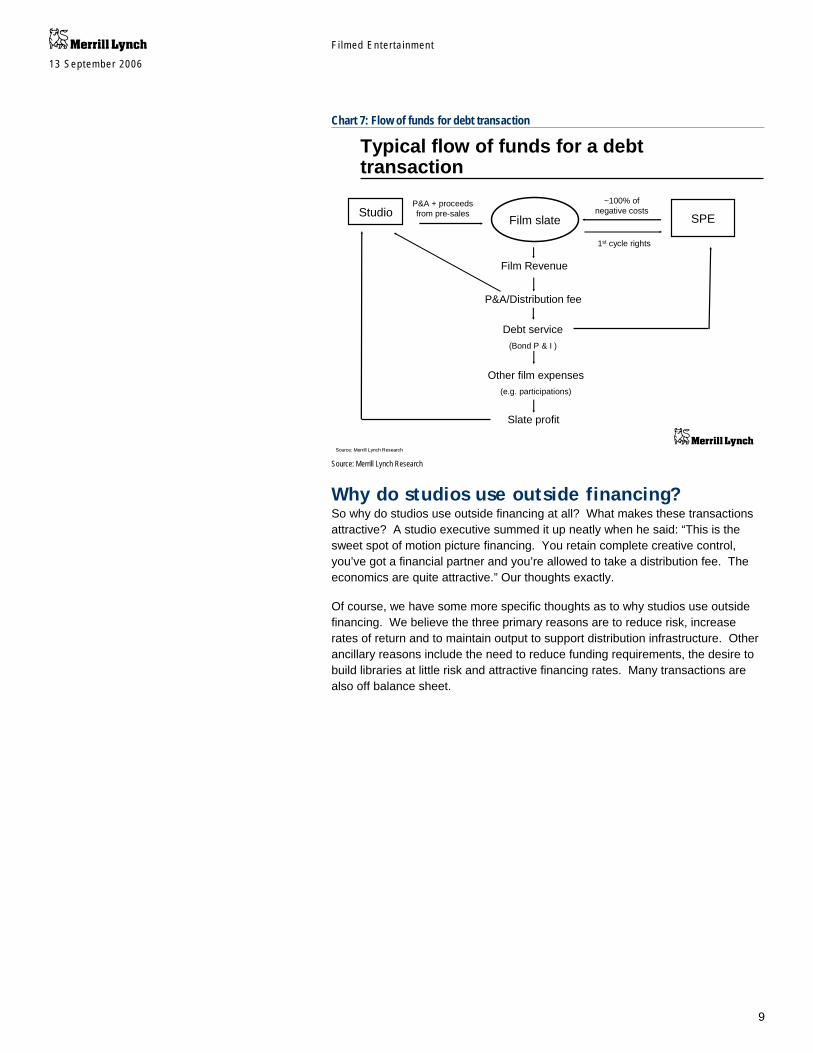
Flow of funds for debt A debt transaction looks similar to an equity one, but the fund is no longer subordinated to other profit participants and has therefore reduced its risk. Indeed, historically, much of the P&A has been subordinated to debt repayments, further reducing risk. However, this is becoming less common as investors take on more film performance risk.10
10 Eisbruck, Jay, Blockbuster or Flop? The History and Evolution of Film Receivable Securitization.
Fi lmed Enter ta inment 13 September 2006
9
Chart 7: Flow of funds for debt transaction
Refer to important disclosures on pages 24- 28.
Typical flow of funds for a debt transactionTypical flow of funds for a debt transaction
Film slateStudio SPEP&A + proceeds from pre-sales
~100% of negative costs
Film Revenue
P&A/Distribution fee
Debt service(Bond P & I )
Slate profit
Other film expenses(e.g. participations)
1st cycle rights
Source: Merrill Lynch ResearchSource: Merrill Lynch Research Source: Merrill Lynch Research
Why do studios use outside financing? So why do studios use outside financing at all? What makes these transactions attractive? A studio executive summed it up neatly when he said: “This is the sweet spot of motion picture financing. You retain complete creative control, you’ve got a financial partner and you’re allowed to take a distribution fee. The economics are quite attractive.” Our thoughts exactly.
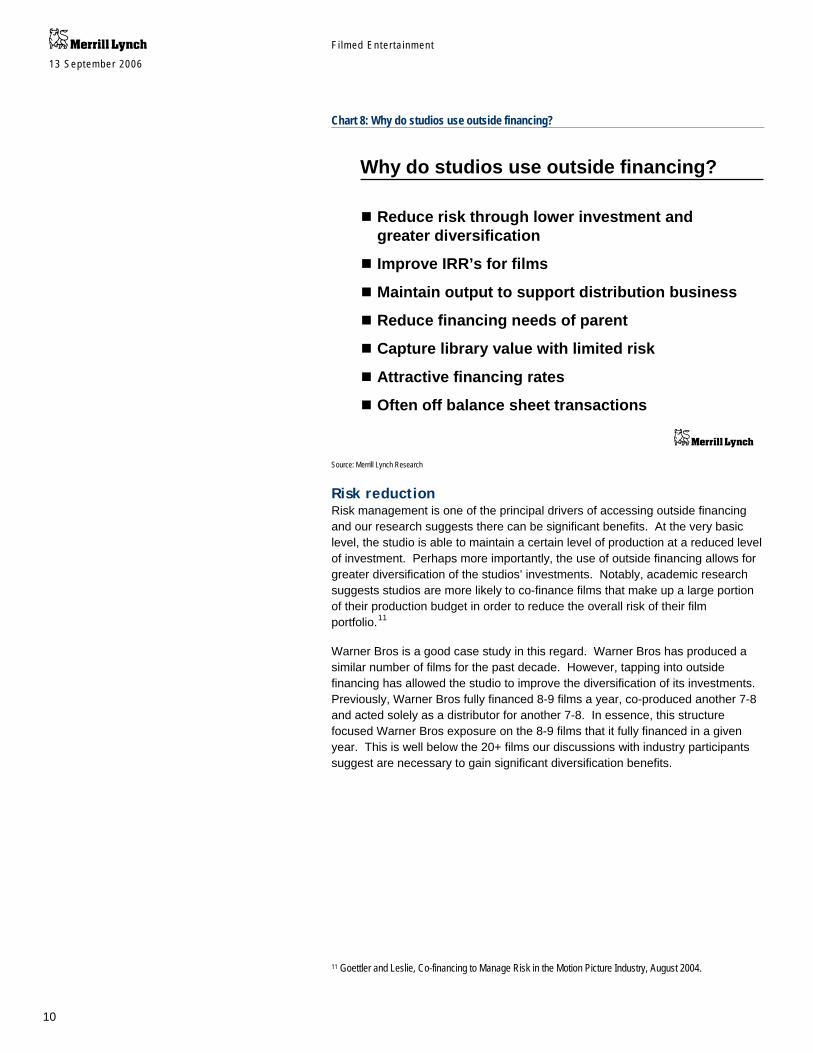
Of course, we have some more specific thoughts as to why studios use outside financing. We believe the three primary reasons are to reduce risk, increase rates of return and to maintain output to support distribution infrastructure. Other ancillary reasons include the need to reduce funding requirements, the desire to build libraries at little risk and attractive financing rates. Many transactions are also off balance sheet.
Fi lmed Enter ta inment 13 September 2006
10
Chart 8: Why do studios use outside financing?
Refer to important disclosures on pages 24- 28.
Reduce risk through lower investment and greater diversification
Improve IRR’s for films
Maintain output to support distribution business
Reduce financing needs of parent
Capture library value with limited risk
Attractive financing rates
Often off balance sheet transactions
Reduce risk through lower investment and greater diversification
Improve IRR’s for films
Maintain output to support distribution business
Reduce financing needs of parent
Capture library value with limited risk
Attractive financing rates
Often off balance sheet transactions
Why do studios use outside financing?Why do studios use outside financing?
Source: Merrill Lynch Research
Risk reduction Risk management is one of the principal drivers of accessing outside financing and our research suggests there can be significant benefits. At the very basic level, the studio is able to maintain a certain level of production at a reduced level of investment. Perhaps more importantly, the use of outside financing allows for greater diversification of the studios’ investments. Notably, academic research suggests studios are more likely to co-finance films that make up a large portion of their production budget in order to reduce the overall risk of their film portfolio.11
Warner Bros is a good case study in this regard. Warner Bros has produced a similar number of films for the past decade. However, tapping into outside financing has allowed the studio to improve the diversification of its investments. Previously, Warner Bros fully financed 8-9 films a year, co-produced another 7-8 and acted solely as a distributor for another 7-8. In essence, this structure focused Warner Bros exposure on the 8-9 films that it fully financed in a given year. This is well below the 20+ films our discussions with industry participants suggest are necessary to gain significant diversification benefits.
11 Goettler and Leslie, Co-financing to Manage Risk in the Motion Picture Industry, August 2004.
Fi lmed Enter ta inment 13 September 2006
11
Chart 9: Risk reduction plays central role
Refer to important disclosures on pages 24- 28.
Risk reduction plays central roleRisk reduction plays central role
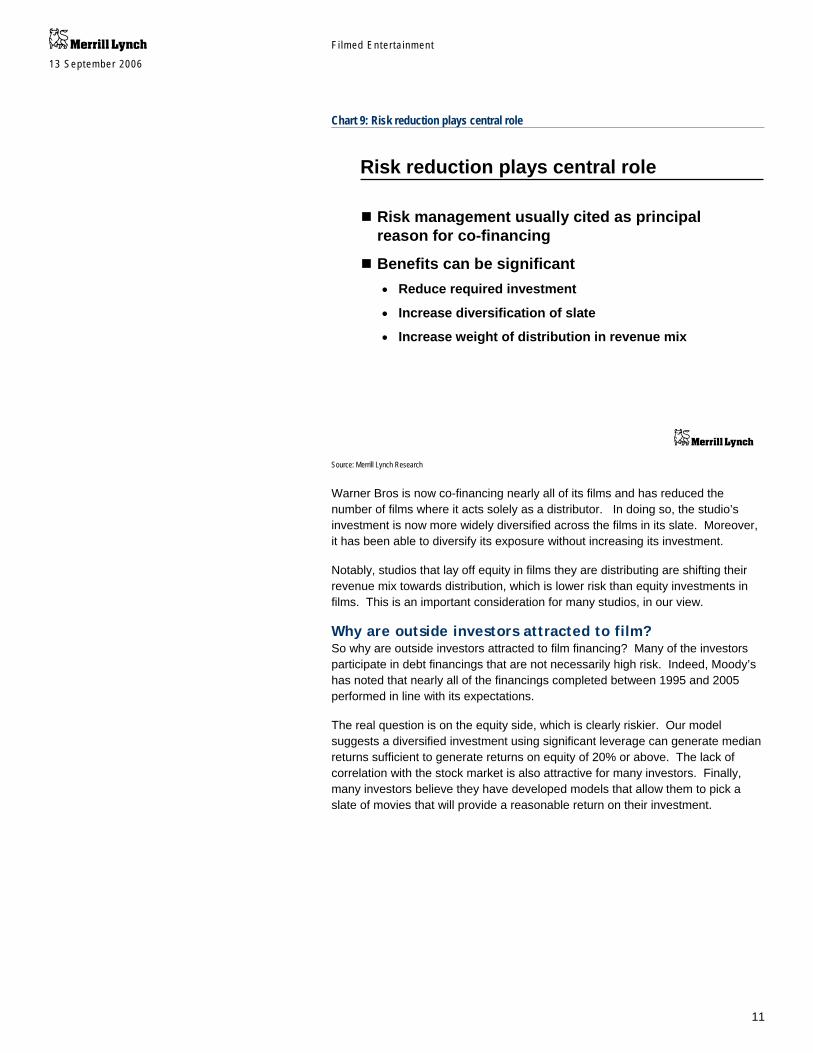
Risk management usually cited as principal reason for co-financing
Benefits can be significant• Reduce required investment
• Increase diversification of slate
• Increase weight of distribution in revenue mix
Risk management usually cited as principal reason for co-financing
Benefits can be significant• Reduce required investment
• Increase diversification of slate
• Increase weight of distribution in revenue mix
Source: Merrill Lynch Research
Warner Bros is now co-financing nearly all of its films and has reduced the number of films where it acts solely as a distributor. In doing so, the studio’s investment is now more widely diversified across the films in its slate. Moreover, it has been able to diversify its exposure without increasing its investment.
Notably, studios that lay off equity in films they are distributing are shifting their revenue mix towards distribution, which is lower risk than equity investments in films. This is an important consideration for many studios, in our view.
Why are outside investors attracted to film? So why are outside investors attracted to film financing? Many of the investors participate in debt financings that are not necessarily high risk. Indeed, Moody’s has noted that nearly all of the financings completed between 1995 and 2005 performed in line with its expectations.
The real question is on the equity side, which is clearly riskier. Our model suggests a diversified investment using significant leverage can generate median returns sufficient to generate returns on equity of 20% or above. The lack of correlation with the stock market is also attractive for many investors. Finally, many investors believe they have developed models that allow them to pick a slate of movies that will provide a reasonable return on their investment.

Fi lmed Enter ta inment 13 September 2006
12
Chart 10: Why are outside investors attracted to film?
Refer to important disclosures on pages 24- 28.
High returns possible• Levered equity returns can be above 20%
• Debt returns lower, but with much less risk
Portfolio approach reduces film specific risk
Low (or no correlation) to market
Ancillary revenue streams improved economics• Home video sell through
• International markets
High returns possible• Levered equity returns can be above 20%
• Debt returns lower, but with much less risk
Portfolio approach reduces film specific risk
Low (or no correlation) to market
Ancillary revenue streams improved economics• Home video sell through
• International markets
Why are outside investors attracted to film?Why are outside investors attracted to film?
Source: Merrill Lynch Research
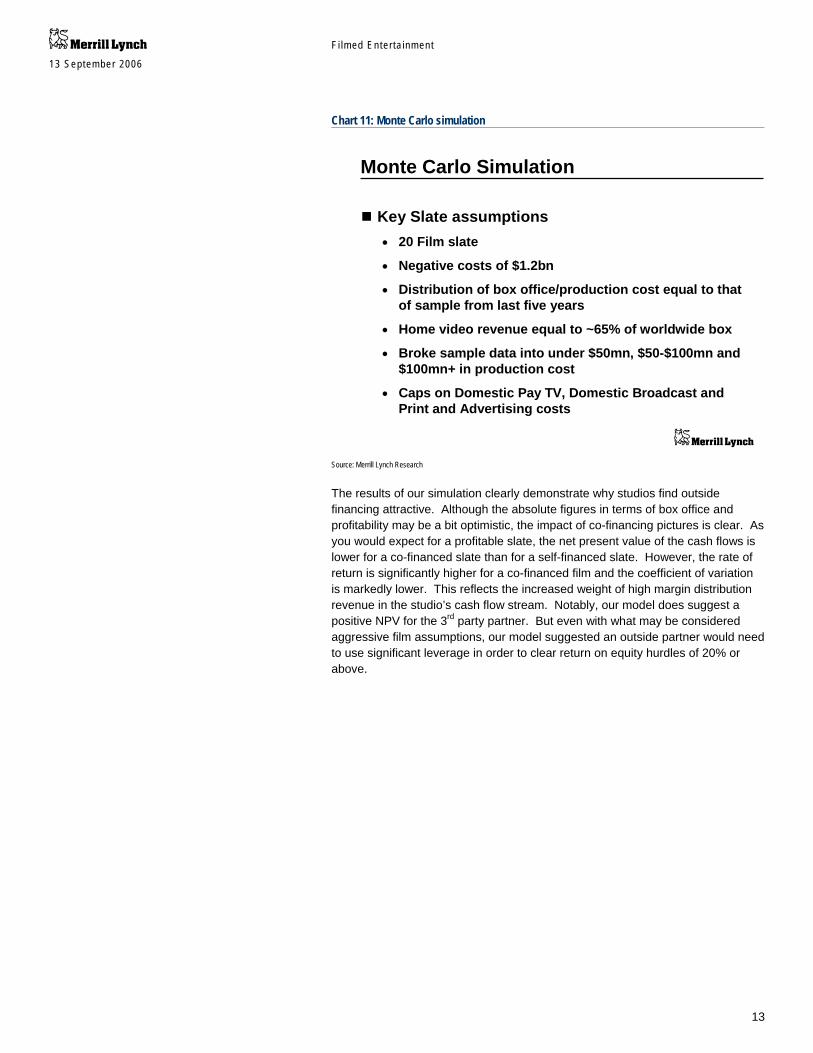
Monte Carlo simulation To better understand the impact of using outside financing, we have constructed a mock slate and run Monte Carlo simulations using custom distributions. For our slate, we have assumed a production budget of $1.2bn and output of 20 films. For our domestic box office estimates, we used production cost as the independent variable. We constructed our custom distribution using domestic box office and production data for the past five years as provided by Box Office Mojo. We used the same data to construct a distribution for international box office to domestic box office. We broke our data for the distributions into smaller samples to account for the variance in performance for different box office levels. We also sensitized our outcomes for home video revenue, assuming average worldwide revenue of 65% of global box office.
Clearly, there are a number of factors in addition to production cost that should be considered when attempting to project box office for a film. However, as a mock slate, it was not practical for us consider other factors such as the talent involved in a project, release dates or genre.
Fi lmed Enter ta inment 13 September 2006
13
Chart 11: Monte Carlo simulation
Refer to important disclosures on pages 24- 28.
Monte Carlo SimulationMonte Carlo Simulation
Key Slate assumptions• 20 Film slate
• Negative costs of $1.2bn
• Distribution of box office/production cost equal to that of sample from last five years
• Home video revenue equal to ~65% of worldwide box
• Broke sample data into under $50mn, $50-$100mn and $100mn+ in production cost
• Caps on Domestic Pay TV, Domestic Broadcast and Print and Advertising costs
Source: Merrill Lynch Research
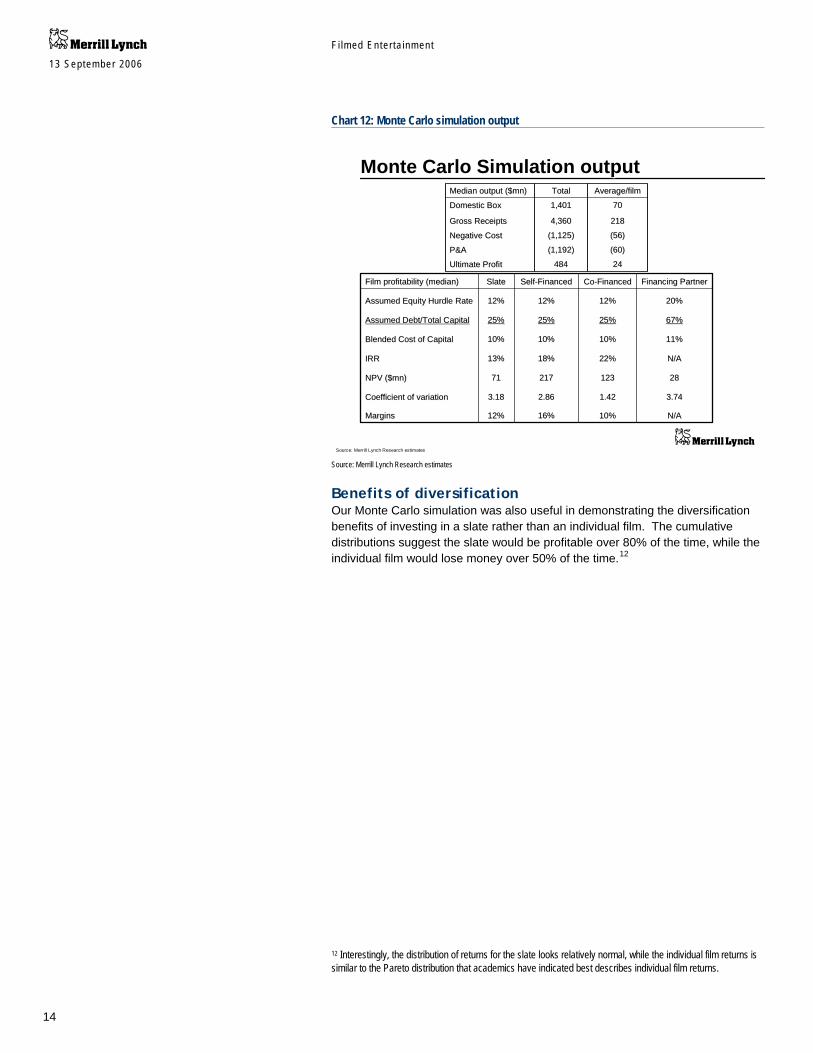
The results of our simulation clearly demonstrate why studios find outside financing attractive. Although the absolute figures in terms of box office and profitability may be a bit optimistic, the impact of co-financing pictures is clear. As you would expect for a profitable slate, the net present value of the cash flows is lower for a co-financed slate than for a self-financed slate. However, the rate of return is significantly higher for a co-financed film and the coefficient of variation is markedly lower. This reflects the increased weight of high margin distribution revenue in the studio’s cash flow stream. Notably, our model does suggest a positive NPV for the 3rd party partner. But even with what may be considered aggressive film assumptions, our model suggested an outside partner would need to use significant leverage in order to clear return on equity hurdles of 20% or above.
Fi lmed Enter ta inment 13 September 2006
14
Chart 12: Monte Carlo simulation output
Refer to important disclosures on pages 24- 28.
Monte Carlo Simulation outputMonte Carlo Simulation output
20%20%12%12%12%12%12%12%Assumed Equity Hurdle RateAssumed Equity Hurdle Rate
67%67%25%25%25%25%25%25%Assumed Debt/Total CapitalAssumed Debt/Total Capital
3.743.741.421.422.862.863.183.18Coefficient of variationCoefficient of variation
28281231232172177171NPV ($mn)NPV ($mn)
10%10%
22%22%
10%10%
CoCo--FinancedFinanced
N/AN/A
N/AN/A
11%11%
Financing PartnerFinancing Partner
12%12%
13%13%
10%10%
SlateSlate
16%16%MarginsMargins
18%18%IRRIRR
10%10%Blended Cost of CapitalBlended Cost of Capital
SelfSelf--FinancedFinancedFilm profitability (median)Film profitability (median)
218 218 4,360 4,360 Gross ReceiptsGross Receipts
70 70 1,401 1,401 Domestic BoxDomestic Box
24 24 484 484 Ultimate ProfitUltimate Profit
(60)(60)(1,192)(1,192)P&AP&A
(56)(56)(1,125)(1,125)Negative CostNegative Cost
Average/filmAverage/filmTotalTotalMedian output ($mn)Median output ($mn)
Source: Merrill Lynch Research estimates Source: Merrill Lynch Research estimates
Benefits of diversification Our Monte Carlo simulation was also useful in demonstrating the diversification benefits of investing in a slate rather than an individual film. The cumulative distributions suggest the slate would be profitable over 80% of the time, while the individual film would lose money over 50% of the time.12
12 Interestingly, the distribution of returns for the slate looks relatively normal, while the individual film returns is similar to the Pareto distribution that academics have indicated best describes individual film returns.

Fi lmed Enter ta inment 13 September 2006
15
Chart 13: Monte Carlo simulation output
Refer to important disclosures on pages 24- 28.
Monte Carlo simulation highlights benefit of diversificationMonte Carlo simulation highlights benefit of diversification
$175 $175 90%90%
$80 $80 80%80%
$29 $29 70%70%
$10 $10 60%60%
($2)($2)50%50%
($15)($15)40%40%
($34)($34)30%30%
($46)($46)20%20%
($62)($62)10%10%
ValueValuePercentilePercentile
Forecast: Ultimate Profit (single film)Forecast: Ultimate Profit (single film)
$1,210 $1,210 90%90%
$930 $930 80%80%
$756 $756 70%70%
$614 $614 60%60%
$502 $502 50%50%
$381 $381 40%40%
$264 $264 30%30%
$136 $136 20%20%
($26)($26)10%10%
ValueValuePercentilePercentile
Forecast: Ultimate Profit (slate)Forecast: Ultimate Profit (slate)
Over 50% chance of losses
Under 20% chance of losses
Source: Merrill Lynch Research estimates
Frequency Chart
.000
.014
.028
.042
.056
0
28
56
84
112
($77) $81 $238 $396 $553
2,000 Trials 1,986 Displayed
Forecast: Ultimate Profi t (single film)
Frequency Chart
.000
.008
.016
.024
.032
0
15.75
31.5
47.25
63
($640) $156 $952 $1,748 $2,544
2,000 Trials 1,957 DisplayedForecast: Ultimate Profit (slate)
Prob
abili
tyPr
obab
ility Frequency
Frequency
Prob
abili
tyPr
obab
ility Frequency
Frequency
Source: Merrill Lynch Research
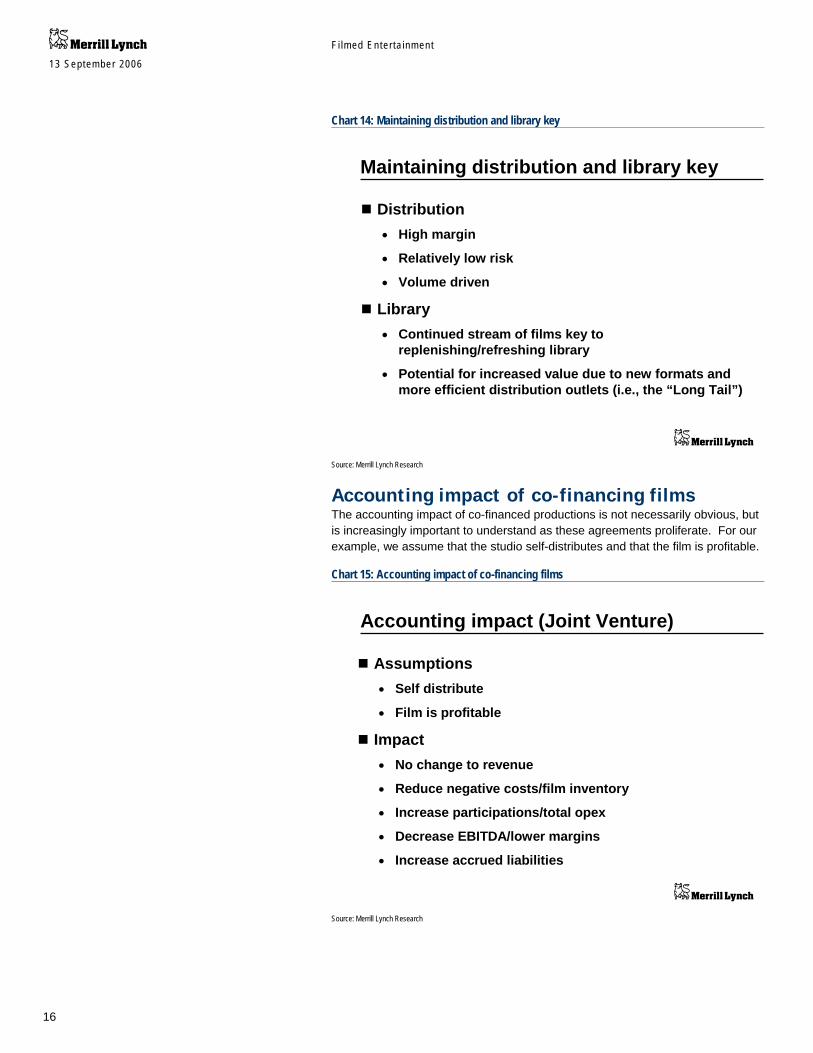
Role of distribution and library It is worth noting the importance of both distribution and a firm’s library in the decision to co-finance. We are not sure that the weight of distribution in studios’ profitably is fully appreciated by investors. Distribution revenues are higher margin and lower risk than the rest of the film business. Given the distribution business is volume driven, it is not surprising that studios would be willing to co-finance productions in order to maintain production in the face of rising costs and restrictive budgets.
In addition to the desire to drive distribution revenue, studios may be motivated to use co-financing to replenish libraries. This motivation may have increased due to the potential for increasing value of library content as distribution vehicles become more efficient.
Fi lmed Enter ta inment 13 September 2006
16
Chart 14: Maintaining distribution and library key
Refer to important disclosures on pages 24- 28.
Maintaining distribution and library keyMaintaining distribution and library key
Distribution• High margin
• Relatively low risk
• Volume driven
Library• Continued stream of films key to
replenishing/refreshing library
• Potential for increased value due to new formats and more efficient distribution outlets (i.e., the “Long Tail”)
Distribution• High margin
• Relatively low risk
• Volume driven
Library• Continued stream of films key to
replenishing/refreshing library
• Potential for increased value due to new formats and more efficient distribution outlets (i.e., the “Long Tail”)
Source: Merrill Lynch Research
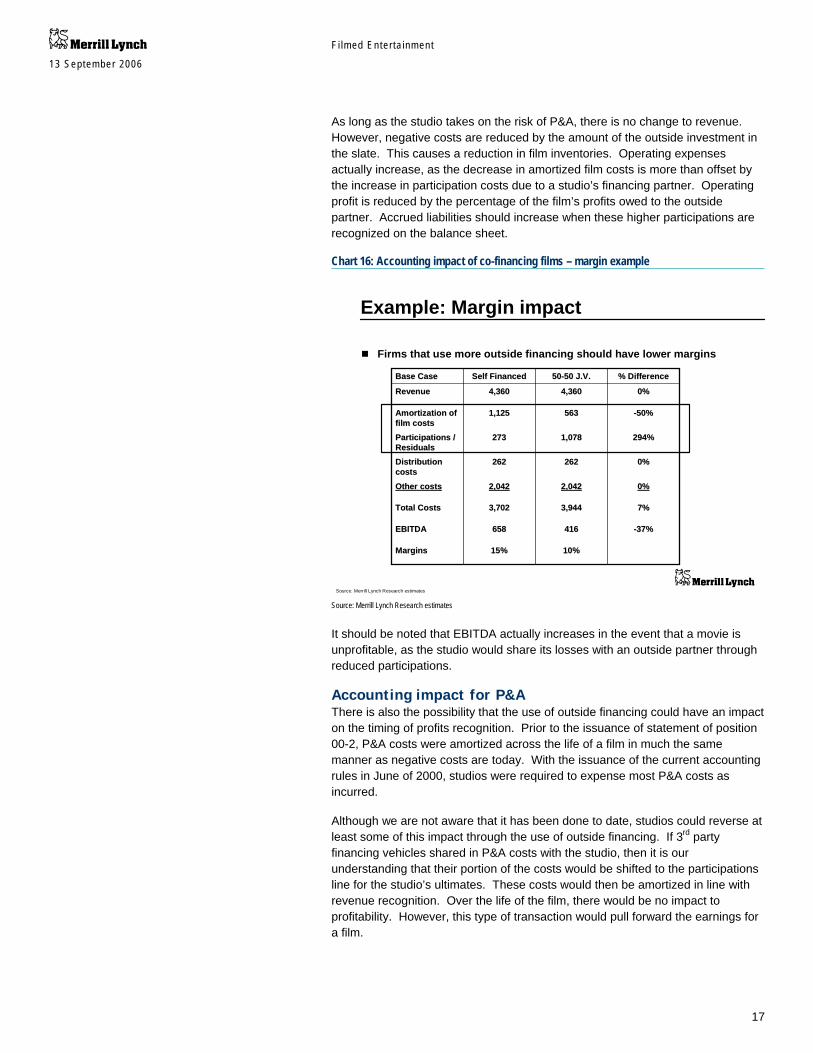
Accounting impact of co-financing films The accounting impact of co-financed productions is not necessarily obvious, but is increasingly important to understand as these agreements proliferate. For our example, we assume that the studio self-distributes and that the film is profitable.
Chart 15: Accounting impact of co-financing films
Refer to important disclosures on pages 24- 28.
Accounting impact (Joint Venture)Accounting impact (Joint Venture)
Assumptions• Self distribute
• Film is profitable
Impact• No change to revenue
• Reduce negative costs/film inventory
• Increase participations/total opex
• Decrease EBITDA/lower margins
• Increase accrued liabilities
Assumptions• Self distribute
• Film is profitable
Impact• No change to revenue
• Reduce negative costs/film inventory
• Increase participations/total opex
• Decrease EBITDA/lower margins
• Increase accrued liabilities
Source: Merrill Lynch Research
Fi lmed Enter ta inment 13 September 2006
17
As long as the studio takes on the risk of P&A, there is no change to revenue. However, negative costs are reduced by the amount of the outside investment in the slate. This causes a reduction in film inventories. Operating expenses actually increase, as the decrease in amortized film costs is more than offset by the increase in participation costs due to a studio’s financing partner. Operating profit is reduced by the percentage of the film’s profits owed to the outside partner. Accrued liabilities should increase when these higher participations are recognized on the balance sheet.
Chart 16: Accounting impact of co-financing films – margin example
Refer to important disclosures on pages 24- 28.
Example: Margin impactExample: Margin impact
Firms that use more outside financing should have lower marginsFirms that use more outside financing should have lower margins
294%294%1,078 1,078 273 273 Participations / Participations / ResidualsResiduals
10%10%15%15%MarginsMargins
--37%37%416 416 658 658 EBITDAEBITDA
7%7%3,944 3,944 3,702 3,702 Total CostsTotal Costs
0%0%2,042 2,042 2,042 2,042 Other costsOther costs
0%0%262 262 262 262 Distribution Distribution costscosts
--50%50%563 563 1,125 1,125 Amortization of Amortization of film costsfilm costs
0%0%4,360 4,360 4,360 4,360 RevenueRevenue
% Difference% Difference5050--50 J.V.50 J.V.Self Financed Self Financed Base CaseBase Case
Source: Merrill Lynch Research estimates Source: Merrill Lynch Research estimates
It should be noted that EBITDA actually increases in the event that a movie is unprofitable, as the studio would share its losses with an outside partner through reduced participations.
Accounting impact for P&A There is also the possibility that the use of outside financing could have an impact on the timing of profits recognition. Prior to the issuance of statement of position 00-2, P&A costs were amortized across the life of a film in much the same manner as negative costs are today. With the issuance of the current accounting rules in June of 2000, studios were required to expense most P&A costs as incurred.
Although we are not aware that it has been done to date, studios could reverse at least some of this impact through the use of outside financing. If 3rd party financing vehicles shared in P&A costs with the studio, then it is our understanding that their portion of the costs would be shifted to the participations line for the studio’s ultimates. These costs would then be amortized in line with revenue recognition. Over the life of the film, there would be no impact to profitability. However, this type of transaction would pull forward the earnings for a film.

Fi lmed Enter ta inment 13 September 2006
18
Chart 17: Accounting impact (Joint Venture)
Refer to important disclosures on pages 24- 28.
Accounting impact (Joint Venture)Accounting impact (Joint Venture)
Assumptions• Self distribute
• Film is profitable
Impact• No change to revenue
• Reduce negative costs/film inventory
• Increase participations/total opex
• Decrease EBITDA/lower margins
• Increase accrued liabilities
Assumptions• Self distribute
• Film is profitable
Impact• No change to revenue
• Reduce negative costs/film inventory
• Increase participations/total opex
• Decrease EBITDA/lower margins
• Increase accrued liabilities
Source: Merrill Lynch Research
Conclusions The increased availability of capital is a positive development for the studios, in our view. All else being equal, a co-financed slate will show less variation in its profits and a higher return on invested capital. It also allows studios to maintain their scale, particularly their distribution organization, without increasing investment. This frees up capital at the parent company. A side benefit of this development could also be increased focus on cost control due to scrutiny from their 3rd party partners.
This is not to say 3rd party financing comes without risk. The availability of capital could encourage overproduction, potentially crowding an already saturated market and reducing return on investment. Moreover, there remains the question as to what would happen if outside financing were to dry up, with the potential need for increased investment and a likely drop in returns on investment.
Given the pools of capital currently available and the agreements already in place, this is unlikely to happen for at least several years.

Fi lmed Enter ta inment 13 September 2006
19
Chart 18: Conclusions
Refer to important disclosures on pages 24- 28.
ConclusionsConclusions
Outside financing benefits studios• Studios reduce risk and increase returns
• Frees up capital at parent company
• Greater outside scrutiny creates spending discipline
Risks• Creates incentive to produce more films
• Could crowd market and reduce ROI
• What happens if it goes away?
Increased investment/reduced IRR’s
Source: Merrill Lynch Research
Appendix Chart 19: Historical Studio Deals
Refer to important disclosures on pages 24- 28.
Studio Deals 1995-2006Studio Deals 1995-2006
1/061/063253252020thth Century FoxCentury Fox17. Dune Capital17. Dune Capital
9/059/05525525MarvelMarvel14. Marvel Funding14. Marvel Funding
1/061/06750750SonySony15. Gun Hill Road (Relativity Media)15. Gun Hill Road (Relativity Media)
1/061/06515515UniversalUniversal16. Gun Hill Road (Relativity Media)16. Gun Hill Road (Relativity Media)
6/056/05500500Warner BrothersWarner Brothers12. Legendary Pictures12. Legendary Pictures
8/058/05505505DisneyDisney13. Magic Films 13. Magic Films
8/048/04300300ParamountParamount10. Melrose Investors LLC10. Melrose Investors LLC
2/032/031,0001,000Village RoadshowVillage Roadshow9. Village Roadshow II9. Village Roadshow II
5/005/001,0001,000UniversalUniversal8. Galaxy Film II8. Galaxy Film II
3/003/00300300SonySony7. Palisades Partners7. Palisades Partners
1/001/00550550DreamWorksDreamWorks6. DreamWorks Film Trust II6. DreamWorks Film Trust II
6/986/98900900Village RoadshowVillage Roadshow5. Village Roadshow Trust5. Village Roadshow Trust
12/9712/97425425DreamWorksDreamWorks4. DreamWorks Film Trust4. DreamWorks Film Trust
10/9710/97300300DestinationDestination3. Hollywood Funding No 5 & 63. Hollywood Funding No 5 & 6
6/976/971,1001,100UniversalUniversal2. Galaxy Film2. Galaxy Film
11/9511/951,0001,0002020thth Century FoxCentury Fox1. Millennium Film1. Millennium Film
Closing dateClosing dateApprox. Size ($mn)Approx. Size ($mn)StudioStudioTransaction Name/FundTransaction Name/Fund
Source: Journal of Structured Finance, Hollywood Reporter, Merrill Lynch Research
Source: Journal of Structured Finance, Hollywood Reporter, Merrill Lynch Research
Fi lmed Enter ta inment 13 September 2006
20
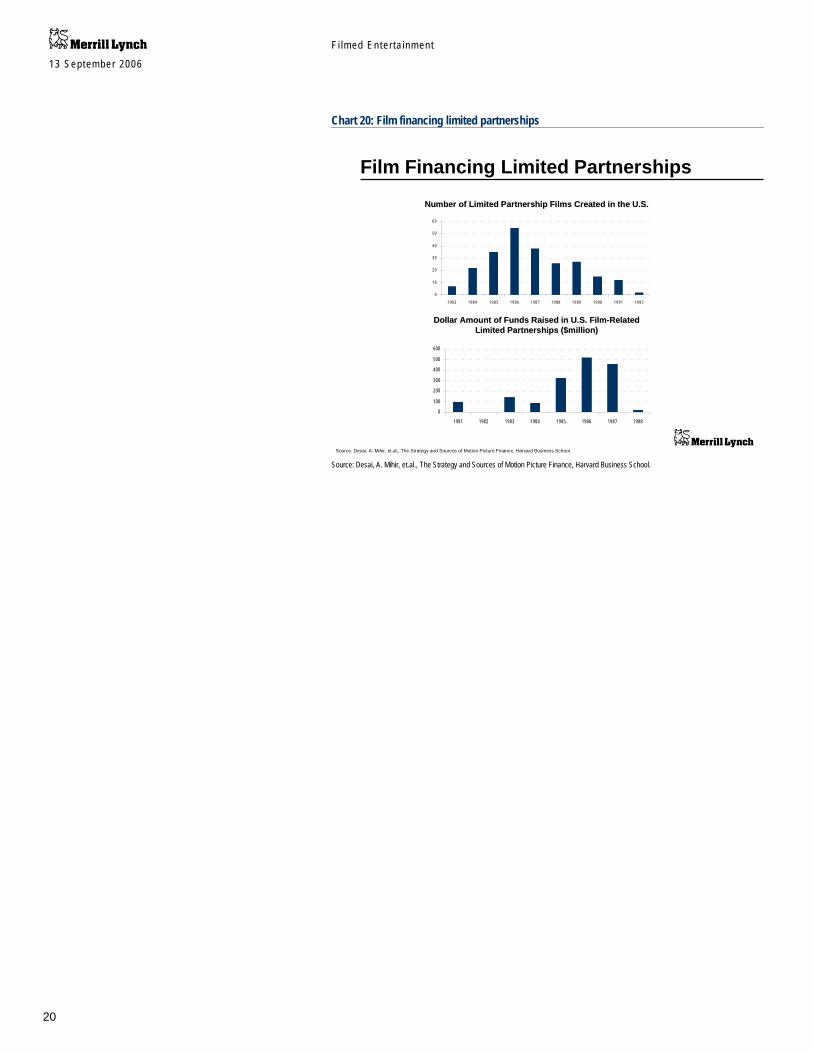
Chart 20: Film financing limited partnerships
Refer to important disclosures on pages 24- 28.
Film Financing Limited PartnershipsFilm Financing Limited Partnerships
0
10
20
30
40
50
60
1983 1984 1985 1986 1987 1988 1989 1990 1991 1992
0
100
200
300
400
500
600
1981 1982 1983 1984 1985 1986 1987 1988
Number of Limited Partnership Films Created in the U.S.Number of Limited Partnership Films Created in the U.S.
Dollar Amount of Funds Raised in U.S. FilmDollar Amount of Funds Raised in U.S. Film--Related Related Limited Partnerships ($million)Limited Partnerships ($million)
Source: Desai, A. Mihir, et.al., The Strategy and Sources of Motion Picture Finance, Harvard Business School. Source: Desai, A. Mihir, et.al., The Strategy and Sources of Motion Picture Finance, Harvard Business School.

Fi lmed Enter ta inment 13 September 2006
21
Analyst Certification I, Jessica Reif Cohen, hereby certify that the views expressed in this research report about securities and issuers accurately reflect the research model applied in such analysis. I also certify that no part of my compensation was, is, or will be, directly or indirectly, related to the specific recommendations or view expressed in this research report.

Fi lmed Enter ta inment 13 September 2006
22
Important Disclosures
FUNDAMENTAL EQUITY OPINION KEY: Opinions include a Volatility Risk Rating, an Investment Rating and an Income Rating. VOLATILITY RISK RATINGS, indicators of potential price fluctuation, are: A - Low, B - Medium, and C - High. INVESTMENT RATINGS, indicators of expected total return (price appreciation plus yield) within the 12-month period from the date of the initial rating, are: 1 - Buy (10% or more for Low and Medium Volatility Risk Securities - 20% or more for High Volatility Risk securities); 2 - Neutral (0-10% for Low and Medium Volatility Risk securities - 0-20% for High Volatility Risk securities); 3 - Sell (negative return); and 6 - No Rating. INCOME RATINGS, indicators of potential cash dividends, are: 7 - same/higher (dividend considered to be secure); 8 - same/lower (dividend not considered to be secure); and 9 - pays no cash dividend.
The analyst(s) responsible for covering the securities in this report receive compensation based upon, among other factors, the overall profitability of Merrill Lynch, including profits derived from investment banking revenues.

Fi lmed Enter ta inment 13 September 2006
23
Other Important Disclosures
UK readers: MLPF&S or an affiliate is a liquidity provider for the securities discussed in this report.
Information relating to Non-U.S. affiliates of Merrill Lynch, Pierce, Fenner & Smith Incorporated (MLPF&S): MLPF&S distributes research reports of the following non-US affiliates in the US (short name: legal name): Merrill Lynch (France): Merrill Lynch Capital Markets
(France) SAS; Merrill Lynch Dublin (Frankfurt Branch): Merrill Lynch CMB Ltd, Dublin, Frankfurt Branch; Merrill Lynch (South Africa): Merrill Lynch South Africa (Pty) Ltd; Merrill Lynch (Milan): Merrill Lynch Capital Markets Bank Limited; MLPF&S (UK): Merrill Lynch, Pierce, Fenner & Smith Limited; Merrill Lynch (Australia): Merrill Lynch Equities (Australia) Limited; Merrill Lynch (Hong Kong): Merrill Lynch (Asia Pacific) Limited; Merrill Lynch (Singapore): Merrill Lynch (Singapore) Pte Ltd; Merrill Lynch (Canada): Merrill Lynch Canada Inc; Merrill Lynch (Mexico): Merrill Lynch Mexico, SA de CV, Casa de Bolsa; Merrill Lynch (Argentina): Merrill Lynch Argentina SA; Merrill Lynch (Brazil): Banco Merrill Lynch de Investimentos SA; Merrill Lynch (Japan): Merrill Lynch Japan Securities Co, Ltd; Merrill Lynch (Seoul): Merrill Lynch International Incorporated (Seoul Branch); Merrill Lynch (Taiwan): Merrill Lynch Taiwan Limited; DSP Merrill Lynch (India): DSP Merrill Lynch Limited; PT Merrill Lynch (Indonesia): PT Merrill Lynch Indonesia; Merrill Lynch (KL) Sdn. Bhd.: Merrill Lynch (Malaysia); Merrill Lynch (Israel): Merrill Lynch Israel Limited; Merrill Lynch (Russia): Merrill Lynch CIS Limited, Moscow.
This research report has been prepared and issued by MLPF&S and/or one or more of its non-U.S. affiliates. MLPF&S is the distributor of this research report in the U.S. and accepts full responsibility for research reports of its non-U.S. affiliates distributed in the U.S. Any U.S. person receiving this research report and wishing to effect any transaction in any security discussed in the report should do so through MLPF&S and not such foreign affiliates.
This research report has been approved for publication in the United Kingdom by Merrill Lynch, Pierce, Fenner & Smith Limited, which is authorized and regulated by the Financial Services Authority; has been considered and distributed in Japan by Merrill Lynch Japan Securities Co, Ltd, a registered securities dealer under the Securities and Exchange Law in Japan; is distributed in Hong Kong by Merrill Lynch (Asia Pacific) Limited, which is regulated by the Hong Kong SFC; is issued and distributed in Taiwan by Merrill Lynch (Taiwan) Ltd or Merrill Lynch, Pierce, Fenner & Smith Limited (Taiwan Branch); is issued and distributed in Malaysia by Merrill Lynch (KL) Sdn. Bhd., a licensed investment adviser regulated by the Malaysian Securities Commission; and is issued and distributed in Singapore by Merrill Lynch International Bank Limited (Merchant Bank) and Merrill Lynch (Singapore) Pte Ltd (Company Registration No. 198602883D). Merrill Lynch International Bank Limited and Merrill Lynch (Singapore) Pte Ltd. are regulated by the Monetary Authority of Singapore. Merrill Lynch Equities (Australia) Limited, (ABN 65 006 276 795), AFS License 235132, provides this report in Australia. No approval is required for publication or distribution of this report in Brazil.
Merrill Lynch Dublin is regulated by BaFin. Copyright, User Agreement and other general information related to this report: Copyright 2006 Merrill Lynch, Pierce, Fenner & Smith Incorporated. All rights reserved. This research report is prepared for the use of Merrill Lynch clients and
may not be redistributed, retransmitted or disclosed, in whole or in part, or in any form or manner, without the express written consent of Merrill Lynch. Merrill Lynch research reports are distributed simultaneously to internal and client websites eligible to receive such research prior to any public dissemination by Merrill Lynch of the research report or information or opinion contained therein. Any unauthorized use or disclosure is prohibited. Receipt and review of this research report constitutes your agreement not to redistribute, retransmit, or disclose to others the contents, opinions, conclusion, or information contained in this report (including any investment recommendations, estimates or price targets) prior to Merrill Lynch's public disclosure of such information. The information herein (other than disclosure information relating to Merrill Lynch and its affiliates) was obtained from various sources and we do not guarantee its accuracy. Merrill Lynch makes no representations or warranties whatsoever as to the data and information provided in any third party referenced website and shall have no liability or responsibility arising out of or in connection with any such referenced website.
This research report provides general information only. Neither the information nor any opinion expressed constitutes an offer or an invitation to make an offer, to buy or sell any securities or other investment or any options, futures or derivatives related to such securities or investments. It is not intended to provide personal investment advice and it does not take into account the specific investment objectives, financial situation and the particular needs of any specific person who may receive this report. Investors should seek financial advice regarding the appropriateness of investing in any securities, other investment or investment strategies discussed or recommended in this report and should understand that statements regarding future prospects may not be realized. Investors should note that income from such securities or other investments, if any, may fluctuate and that price or value of such securities and investments may rise or fall. Accordingly, investors may receive back less than originally invested. Past performance is not necessarily a guide to future performance. Any information relating to the tax status of financial instruments discussed herein is not intended to provide tax advice or to be used by anyone to provide tax advice. Investors are urged to seek tax advice based on their particular circumstances from an independent tax professional.
Foreign currency rates of exchange may adversely affect the value, price or income of any security or related investment mentioned in this report. In addition, investors in securities such as ADRs, whose values are influenced by the currency of the underlying security, effectively assume currency risk.
Officers of MLPF&S or one or more of its affiliates (other than research analysts) may have a financial interest in securities of the issuer(s) or in related investments.
Merrill Lynch Research policies relating to conflicts of interest are described at http://www.ml.com/media/43347.pdf. Fundamental equity reports are produced on a regular basis as necessary to keep the investment recommendation current.