Embed Size (px)
DESCRIPTION
Inside ALEC is our monthly newsletter. For additional information, please visit www.alec.org.
Citation preview

INSIDEMARCH / APRIL 2013
A P U B L I C A T I O N O F T H E A M E R I C A N L E G I S L A T I V E E X C H A N G E C O U N C I L
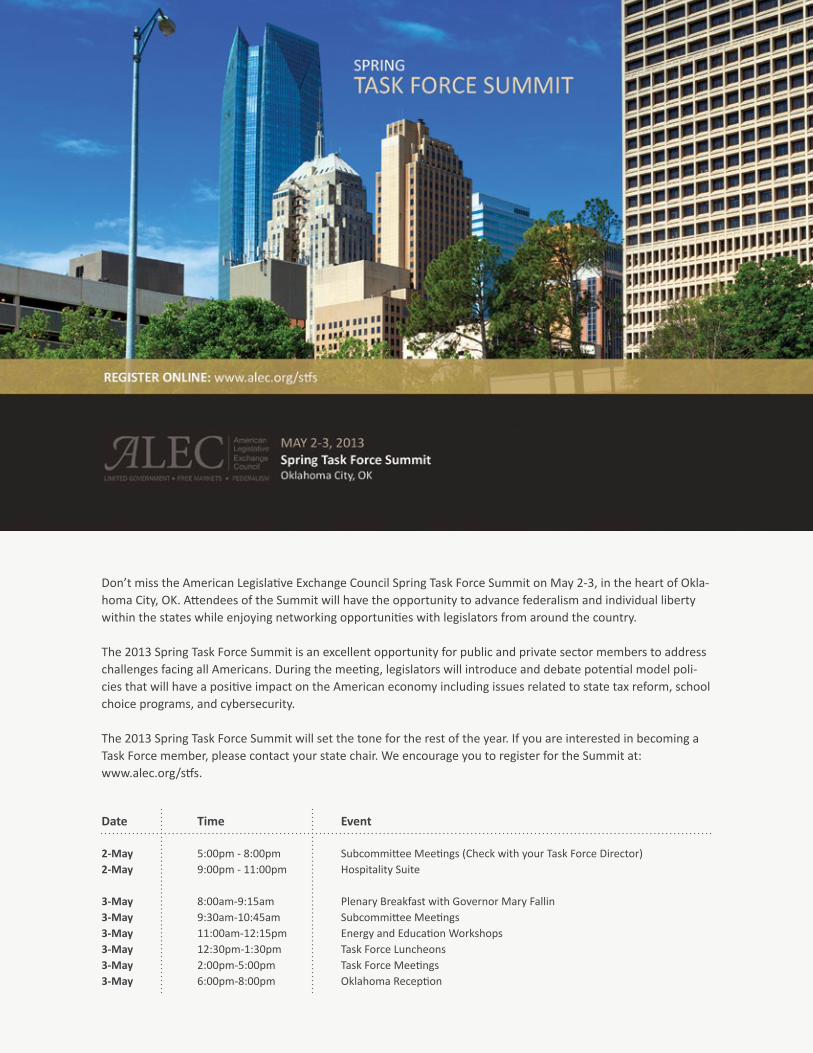
Don’t miss the American Legislative Exchange Council Spring Task Force Summit on May 2-3, in the heart of Okla-homa City, OK. Attendees of the Summit will have the opportunity to advance federalism and individual liberty within the states while enjoying networking opportunities with legislators from around the country.
The 2013 Spring Task Force Summit is an excellent opportunity for public and private sector members to address challenges facing all Americans. During the meeting, legislators will introduce and debate potential model poli-cies that will have a positive impact on the American economy including issues related to state tax reform, school choice programs, and cybersecurity.
The 2013 Spring Task Force Summit will set the tone for the rest of the year. If you are interested in becoming a Task Force member, please contact your state chair. We encourage you to register for the Summit at: www.alec.org/stfs.
Date Time Event
2-May 5:00pm - 8:00pm Subcommittee Meetings (Check with your Task Force Director)2-May 9:00pm - 11:00pm Hospitality Suite 3-May 8:00am-9:15am Plenary Breakfast with Governor Mary Fallin3-May 9:30am-10:45am Subcommittee Meetings3-May 11:00am-12:15pm Energy and Education Workshops3-May 12:30pm-1:30pm Task Force Luncheons3-May 2:00pm-5:00pm Task Force Meetings3-May 6:00pm-8:00pm Oklahoma Reception

CONTENTS
Inside ALEC | March / April 2013 • 3
A PUBLICATION OF THE AMERICAN LEGISLATIVE EXCHANGE COUNCIL
LEADERSHIP2013 National ChairmanThe Honorable John Piscopo, CT (HD-76)
Private Enterprise Advisory Council ChairC. Stevens Seale, SAP America
Executive DirectorRon Scheberle
Senior DirectorPolicy and Strategic InitiativesMichael Bowman
Senior DirectorFinance and AdministrationLisa Bowen
Senior DirectorPublic AffairsBill Meierling
INSIDE ALEC Editor in ChiefBill MeierlingExecutive EditorAshley Varner
Exhibiting or advertising at an Exchange Council event is a great way to promote your company to members of both the private and public sectors. If you are interested in exhibiting or advertising at a Council meeting, please contact Sarah McManamon at: [email protected] or (202) 742-8516.
© American Legislative Exchange Council
1101 Vermont Ave., NW, 11th FloorWashington, D.C. 20005
Phone: (202) 466-3800Fax: (202) 466-3801www.alec.org
DESIGN / LAYOUTSteven Andrews
The Council provides legislators with viewpoints and discussions on issues important to them and their constituents. Authors submitting articles for Inside ALEC do not necessarily reflect the views or policy positions of the Council.
Leadership Profiles
A Plea For Fiscal PreparednessBY THE HONORABLES WAYNE NIEDERHAUSER, UT (SD-9), REBECCA LOCKHART, UT (HD-64), RICHARD ELLIS & JOHN DOUGALL
Best Practices for Protecting Tax PayersBY DR. BARRY W. POULSON
Who’s Winning the Pension Wars?BY RICK DREYFUSS
Streamlining Commissions as an Important Tool for Increasing State CompetitivenessBY THE HONORABLE MAURICE P. McTIGUE
Tax Myths DebunkedBY DR. RANDALL POzDENA & DR. ERIC FRUITS
A Legislator’s Guide to Diffusing the Pension BombBY THE HONORABLE DAN LILJENqUIST
Gasoline Taxes: Funding Roads or Pork?BY JONATHAN WILLIAMS
Coming Soon: Rich States, Poor States 6th Edition
Technology Provides Opportunity to Limit Government SpendingBY THE HONORABLE JASON SAINE, NC (HD-97)
Travel Services Taxes: Stepping Over Dollars to Reach for PenniesBY THE HONORABLE JASON BROUDER, FL (HD-28)
The Road Less Traveled: Transportation FundingBY CARA SULLIVAN
Right-to-Work in Michigan: The Untold StoryBY F. VINCENT VERNUCCIO
Smart Aid to Africa: An Innovative ApproachBY AVI LESHES AND ED ELEASIAN
Promoting Fair Share LiabilityBY VICTOR E. SCHWARTz & CARY SILVERMAN
4
5
6
8
9
10
11
13
14
17
18
19
20
22
24
JUSTICE PERFORMANCE PROJECTTAX & COMMERCE
INSIDE ALEC | MARCH / APRIL 2013
SPECIAL REPORT: INTERNATIONAL RELATIONS
SPECIAL REPORT: CIVIL JUSTICE

Chairman Profile: The Honorable Dawn Pentgill Iowa (HD-39) Chairman of the Council Task Force on Commerce, Insurance and Economic Development
The American Legislative Exchange Council is pleased to announce Iowa Representative Dawn Pettengill (HD-39) as the incoming chair of the Council Task Force on Commerce, Insurance and Economic Devel-opment. Former mayor and city councilwoman of Mt. Auburn, Iowa, Representative Pettengill will bring to the Task Force over nine years of experience in the Iowa Legislature and the Iowa House Commerce Committee.
The Task Force has already benefited from Representative Petten-gill’s leadership as the public sector chair of the Labor and Business Regulation Subcommittee. Representative Pettengill explains, “The Task Force has served as a great means of exchanging policy ideas and learning what other states have done to advance the principles of free markets and limited government. Guest speakers and panelists give attendees evidence-based ideas on how to enhance competition, pro-mote employment and limit government regulation.”
Representative Pettengill’s experience and commitment to free market principles will certainly benefit the members of the Task Force on Commerce, Insurance and Economic Development.
Chairman Profile: The Honorable Ken Weyler New Hampshire (HD-8) Chairman of the Council Task Force on Tax and Fiscal Policy
Following the highly successful task force chairmanship of Indiana Senator, Jim Buck (SD-21), the American Legislative Exchange Council is pleased to announce the selection of New Hampshire Representa-tive Ken Weyler (HD-8) as the 2013-2014 chairman of the Council Task Force on Tax and Fiscal Policy. A retired American Airlines pilot, Weyler brings more than 15 years of experience serving on the New Hamp-shire House Finance Committee and the Council Task Force on Tax and Fiscal Policy. As Rep. Weyler explains, “the Task Force has been the best experience in learning about other states’ methods in Tax Expen-diture Limitations, such as the Taxpayers’ Bill of Rights, and exchang-ing ideas with other legislators about budgeting. Guest Scholars, like Professor Richard Vedder of Ohio University, have educated us with applicable facts and ideas. I have learned many valuable concepts that have been used to increase accountability and efficiency back home.”
Weyler is a legislator who embodies the state’s “live free or die” motto. After fighting for greater budget effectiveness and sound tax policy, he describes how the Council’s research has been influential in the legislature. “The Rich States, Poor States series by Jonathan Wil-liams, Dr. Arthur Laffer and Stephen Moore has been an eye-opener for me and my colleagues in discovering the impact of fiscal policy. The Budget Reform Toolkit was also a very popular publication in my legislature.”
Members of the Task Force on Tax and Fiscal Policy are sure to bene-fit from Rep. Weyler’s experience and his commitment to the Council’s limited government principles.
4 • Inside ALEC | March / April 2013
L E A D E R S H I P P R O F I L E S

Inside ALEC | March / April 2013 • 5
iTA X & C O M M E R C E
A Plea For Fiscal Preparedness
BY THE HONORABLES WAYNE NIEDERHAUSER, REBECCA LOCKHART, RICHARD ELLIS & JOHN DOUGALL
T ogether, we issue a plea for fiscal responsibility in an era of federal irresponsibility. We call on individuals and business and civic leaders to join us in preparing our families, busi-nesses and communities to lead out as a model to the nation
dealing with what has been called the most predictable economic crisis in history.
According to the most recent report of the Government Accountability Office and the Comptroller General of the United States, “The compre-hensive long-term fiscal projections show that—absent policy changes—the federal government continues to face an unsustainable fiscal path.” While Utah is widely recognized as being the best managed State in the Nation, during fiscal year 2010, 45.3 percent of Utah’s spending was com-prised of federal funds.
When necessary and painful changes are inevitably made at the fed-eral level, the amount of federal funding available to our state, communi-ties and citizens must decline, in some cases, substantially. Pending cuts from the federal Budget Control Act of 2011, under which 8-9 percent of federal discretionary spending in Utah and 9-10 percent of military spending are slated to be cut, still leave massive federal deficits in place. We anticipate that further cuts of federal funds to state and local govern-ments must unavoidably follow.
Utahns know how to prepare for and deal with crisis better than any-one! We invite everyone, young and old alike, to join us in establishing and implementing the Financial Ready Utah initiative to help Utahns
prepare for the financial challenges that lie ahead. We urge you to visit FinancialReadyUtah.com to find additional resources and specific actions you can take.
During this Legislative session, a team of Legislators has prepared a package of bills that will lay the groundwork for preparing our state, our communities and our families to address these challenges including legis-lation which establishes a Federal Funds Review Commission to evaluate the risks and implements comprehensive planning measures to address these challenges.
We have an obligation to our children and our grandchildren to make sure that we do not leave a legacy of selfishness and entitlement. We need to model the behaviors we say we value—thrift, hard work, gener-osity of spirit and true community care. Sometimes when problems are so enormous, like the current federal debt situation, we feel frozen. But each of us can start today by not spending beyond our means, getting out of debt, putting away savings or supplies for a rainy day and asking our political leaders to do the same! We can start today by holding elected officials accountable for their stewardship of taxpayer funds.
We encourage you to get involved! Mobilize your communities, includ-ing your cities, counties, chambers of commerce and other organizations to adopt a Resolution supporting the Financial Ready Utah efforts. Such resolutions leverage everyone’s commitment and support to lead our na-tion in preparing for the coming financial turmoil as the federal govern-ment right-sizes its spending.
Join us, to become Financial Ready, Utah!
Reprinted with permission from the Deseret News www.deseretnews.com
senator Wayne niederhauser, ut (sd-9) is the president of the Utah
State Senate.
representative rebecca Lockhart, ut (hd-64) is the Speaker of the
Utah House of Representatives.
MR. RICHARD ELLIS is the Utah State Treasurer.
MR. JOHN DOUGALL is the Utah State Auditor.
6 • Inside ALEC | March / April 2013
I N S I D E A L E C
best practices for protecting taxpayers
BY DR. BARRY W. POULSON
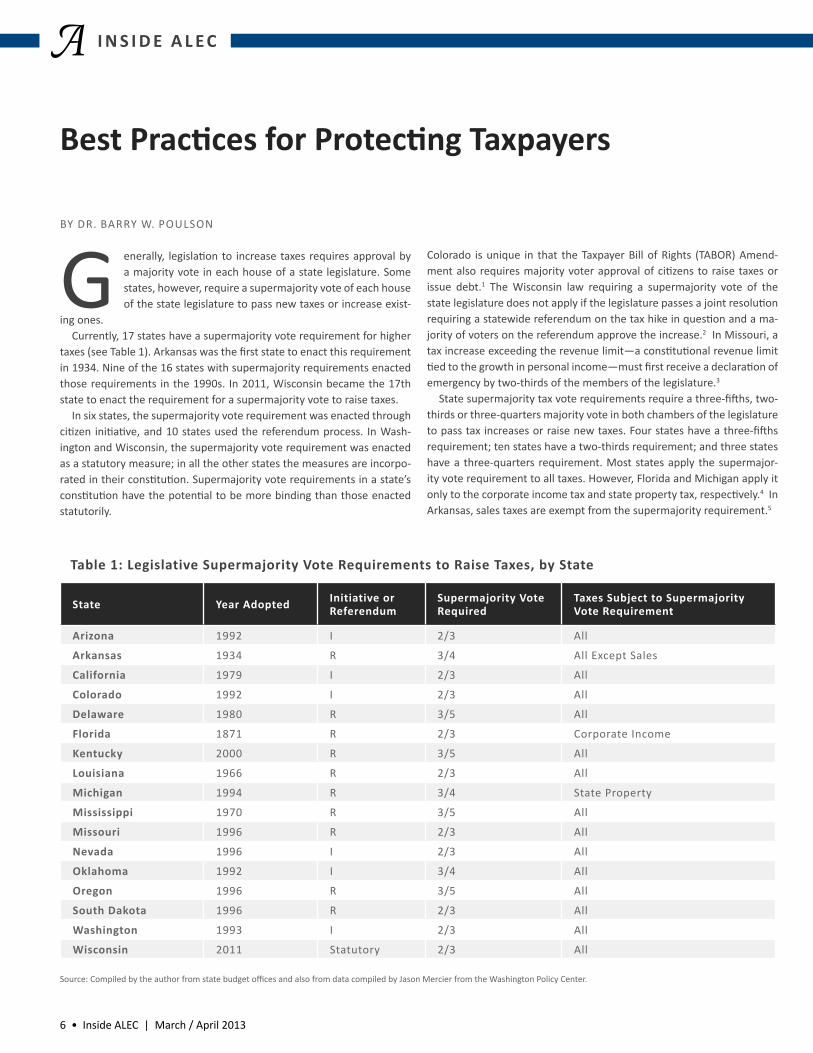
G enerally, legislation to increase taxes requires approval by a majority vote in each house of a state legislature. Some states, however, require a supermajority vote of each house of the state legislature to pass new taxes or increase exist-
ing ones. Currently, 17 states have a supermajority vote requirement for higher
taxes (see Table 1). Arkansas was the first state to enact this requirement in 1934. Nine of the 16 states with supermajority requirements enacted those requirements in the 1990s. In 2011, Wisconsin became the 17th state to enact the requirement for a supermajority vote to raise taxes.
In six states, the supermajority vote requirement was enacted through citizen initiative, and 10 states used the referendum process. In Wash-ington and Wisconsin, the supermajority vote requirement was enacted as a statutory measure; in all the other states the measures are incorpo-rated in their constitution. Supermajority vote requirements in a state’s constitution have the potential to be more binding than those enacted statutorily.
Colorado is unique in that the Taxpayer Bill of Rights (TABOR) Amend-ment also requires majority voter approval of citizens to raise taxes or issue debt.1 The Wisconsin law requiring a supermajority vote of the state legislature does not apply if the legislature passes a joint resolution requiring a statewide referendum on the tax hike in question and a ma-jority of voters on the referendum approve the increase.2 In Missouri, a tax increase exceeding the revenue limit—a constitutional revenue limit tied to the growth in personal income—must first receive a declaration of emergency by two-thirds of the members of the legislature.3
State supermajority tax vote requirements require a three-fifths, two-thirds or three-quarters majority vote in both chambers of the legislature to pass tax increases or raise new taxes. Four states have a three-fifths requirement; ten states have a two-thirds requirement; and three states have a three-quarters requirement. Most states apply the supermajor-ity vote requirement to all taxes. However, Florida and Michigan apply it only to the corporate income tax and state property tax, respectively.4 In Arkansas, sales taxes are exempt from the supermajority requirement.5
State Year Adopted Initiative or referendum
supermajority vote required
taxes subject to supermajority vote requirement
Arizona 1992 I 2/3 All
Arkansas 1934 R 3/4 All Except Sales
california 1979 I 2/3 All
Colorado 1992 I 2/3 All
Delaware 1980 R 3/5 All
Florida 1871 R 2/3 Corporate Income
kentucky 2000 R 3/5 All
Louisiana 1966 R 2/3 All
Michigan 1994 R 3/4 State Property
Mississippi 1970 R 3/5 All
Missouri 1996 R 2/3 All
Nevada 1996 I 2/3 All
Oklahoma 1992 I 3/4 All
Oregon 1996 R 3/5 All
south dakota 1996 R 2/3 All
Washington 1993 I 2/3 All
Wisconsin 2011 Statutory 2/3 All
table 1: Legislative supermajority vote requirements to raise taxes, by state
Source: Compiled by the author from state budget offices and also from data compiled by Jason Mercier from the Washington Policy Center.

Inside ALEC | March / April 2013 • 7
iTA X & C O M M E R C E
Legislation to enact a new supermajority vote requirement has been introduced in several other states in recent years. In 2011, the North Da-kota Legislature introduced a constitutional amendment requiring a 60 percent vote by each legislative chamber to increase the state’s sales, in-come, use and motor vehicle taxes. That measure failed in the house.6 In November 2012, Washington voters decisively approved Initiative 1185, a constitutional amendment requiring a two-thirds vote of the Legisla-ture to raise taxes.7
The supermajority vote requirement is designed to limit the growth of state revenue by constraining the ability of legislators to raise taxes. As Nobel Memorial Prize-winning economist James Buchanan and econo-mist Gordon Tullock argue, a supermajority vote requirement alters the lawmaking process by increasing the cost of decision-making.8 Since more negotiation and compromise is required, it is more difficult to in-crease taxes, and tyranny by a majority is avoided.
In periods of recession and revenue shortfall, states usually rely on a combination of tax increases and spending cuts to balance their budgets.9 To the extent that a supermajority vote requirement limits the ability of a legislature to raise taxes, it is forced to rely on spending cuts. In the long run, a supermajority vote requirement can constrain the ratcheting up of taxes, revenue and spending from one business cycle to the next.10
A supermajority vote requirement is often referred to as a tax limita-tion rule, but should be distinguished from a tax and expenditure limit (TEL). A TEL imposes a limit on state revenue and/or expenditures, as well as taxes. The TEL limit may be based on a measure of state spending or linked to some measure of aggregate economic activity, such as state income. In five states, a TEL limit is linked to the growth in population and inflation, a more stringent constraint on revenue and spending.11
A number of scholars have analyzed the effectiveness of supermajority vote requirements.12 While most studies find that supermajority vote requirements significantly slow the growth in taxes and state revenue, the evidence is mixed. In this sense the literature on supermajority vote requirements is similar to that on TELs, which are sometimes, but not always, found to constrain the growth of state revenues and spending.13
Recent studies, however, find that when TELs are stringently designed and implemented, they significantly reduce the growth in state revenue and spending.14 Some states have enacted weak TELs by excluding some portion of revenue or expenditure from the limit; in other cases, the TELs
include waivers to exceed the limit. Statutory TELs tend to be less effec-tive than TELs incorporated in a state constitution because legislators can easily ignore or suspend a statutory TEL. When the TEL is linked to infla-tion and population growth, as in Colorado, it is more effective.15 On the other hand, TELs linked to income growth, as in Florida and Michigan, are often ineffective.16
Perhaps the most important shortcoming in this literature on su-permajority vote requirements and TELs is the failure to understand the relationship between fiscal discipline rules.17 The experience in Colorado reveals the nature of this flaw. Colorado’s TABOR amendment is the most effective tax and spending limit in the country. One of the most impor-tant provisions in TABOR is the requirement for majority-vote approval of citizens for any increase in taxes or debt. Over the past two decades, this voting requirement has proven to be a very effective constraint on the ability to raise taxes, especially at the state level. While Colorado has a supermajority requirement for the legislature to propose tax increases, it is the requirement for voter approval that most limits state increases in taxes and revenue. The Colorado Legislature could propose an emergen-cy tax increase with a two-thirds majority vote, but to become a perma-nent tax increase the measure would also require a majority vote of the citizens. As a result, bills proposing emergency tax increases are rarely introduced, and have yet to receive the requisite two-thirds majority vote of the legislature.
Thus, in states like Colorado with a stringent TEL we should not ex-pect that a supermajority vote requirement to raise taxes will be very significant. However, in states with a weak TEL the proposed superma-jority vote requirement to raise taxes is likely to be more significant. A supermajority vote requirement is not a magic bullet, but it does require legislators to achieve a broader consensus before raising taxes.
DR. BARRY W. POULSON is Professor emeritus of
Economics from the University of Colorado at Boulder.
He is also an advisor of the American Legislative
Exchange Council’s Task Force on Tax and Fiscal Policy.
1 Barry W. Poulson, Tax and Spending Limits: Theory Analysis and Policy, Issue Paper 2-2004, Independence Institute, Golden Colorado, January 31, 2004.
2 2011-2012 Wisconsin Legislature, January 2011 Special Session Assembly Bill 5. http://docs.legis.wisconsin.gov/2011/proposals/jrl/AB5
3 Article X, Sections 16-24 of the Missouri Constitution. 4 Article 9, Section 3 of the Michigan Constitution. Article 7, section 5(b) of the Florida
Constitution.5 Amendment 19 of the Arkansas Constitution. 6 North Dakota State Legislature, 2011 Legislation Information, House Concurrent Resolu-
tion 3023.7 Washington State Legislature, January 2011 Special Session, Assembly Bill 5; and Jason
Mercier, “Tax Restrictions Across the Country,” Washington Policy Center, August 7, 2012.8 The idea that tax increases should require more than a simple majority vote of a repre-
sentative body has a long history in the public choice literature. See for example James Buchanan, and Gordon Tullock. The Calculus of Consent, Ann Arbor: University of Michigan Press, 1962.
9 Brian Knight. 2000. “Supermajority Voting Requirements for Tax Increases: Evidence from the States,” Journal of Public Economics 76 41-67.
10 Ibid.
11 For a discussion of tax and expenditure limits see John Merrifield and Barry W. Poulson, “State Fiscal Policies for Budget Stabilization and Economic Growth: A Dynamic Scoring Analysis,” paper prepared for the Southern Economic Association meetings November 16-18, New Orleans, 2012.
12 Op. Cit. Brian Knight. 2000. “Supermajority Voting Requirements for Tax Increases: Evidence from the States,” Journal of Public Economics 76 41-67; Allison McCarthy and Elaine Magg. 2006. “Limits on State Revenue,” Tax Policy Center http://taxpolicycenter.org/publication/template.cfm?PubID=9839; Juliet Mussso, Elizabeth Graddy, and Jennifer Grizard. 2006. “State Budgetary Processes and Reforms: The California Story.” Public Bud-geting and Finance 26: 1-21; Timothy Beasly and Anne Case. 2003. “Political Institutions and Policy Choices: Evidence from the United States.” Journal of Economic Literature 41: 7-73.
13 Op. Cit Merrifield and Poulson.14 Op. Cit. Merrifield and Poulson15 Ibid.16 Barry W. Poulson, The Case for Florida to Enact a Taxpayer Protection Amendment, Back-
grounder Number 54, The James Madison Institute, December 2007.17 Ibid.

8 • Inside ALEC | March / April 2013
I N S I D E A L E C
BY RICK DREYFUSS
W hile most private corporations moved to defined con-tribution (DC) pension plans decades ago, defined ben-efit (DB) plans remain common throughout the public sector. In pension reform debates, DB plans are often
defended as cheaper to administer, thus offering taxpayers “more bang for the buck.” The National Institute on Retirement Security has esti-mated that DB plans can provide the same level of retirement income at nearly half the cost of a DC plan.
This claim is misleading. DC plans are not inherently more expensive to administer than DB plans. Arguments that they are, by the NIRS and others, are typically based on two flawed assumptions.
First, DB advocates assume that DC plans are less professionally man-aged than DB plans. This is the old wisdom. When 401(k) plans were first introduced there was often an absence of diversified fund options and little investment guidance provided to participants. In those days, the de-fault investment option was frequently a stable-value fund providing a fixed rate of return. For a variety of reasons, many early 401(k) fund man-agers did not properly diversify and consequently invested up to 100 per-cent of their assets in this low-risk/low-return option. Such returns were often the basis of comparison against properly diversified DB portfolios.
But markets change in response to consumer needs. As evidence of this, target-date funds based upon the participant’s assumed year of re-tirement have emerged and in many cases represent the default 401(k) investment option. These funds are diversified and the asset composi-tion of the fund automatically changes as the participant approaches retirement. For others the preferred option is to participate in several “professionally managed” funds using the guidance of financial planning resources readily accessible to members.
In contrast, many DB plans need to achieve long-term investment an-nual return assumptions in the 7.5 percent range. This often leads them to take on excessive investment risks with high expenses, whereas many top-rated DC firms including Vanguard and Fidelity have capably man-aged 401(k) assets in a low-cost, competitive environment for years.
Second, DB plans are said to be more efficient since DC participants must “over-save” to ensure they do not outlive their assets. DB plans, by contrast, are designed to provide average payouts for everyone, and thus face no over-saving problem.
But this presumes that DB participants who die early are perfectly con-tent to subsidize longer-living members. Wouldn’t most people prefer any unpaid funds to be directed to their surviving family members or a preferred charity rather than a stranger within the retirement plan pool?
DB plans are also said to be more efficient than DC plans because they can invest for indefinite time horizons, which increases returns and low-ers costs. But this only works because of a forced intergenerational sub-sidy from younger employees to older employees. It requires an ongoing inflow of new employees to sustain this arrangement.
Taxpayers rarely realize any of the “savings” that DB plans supposedly provide. The possibility of lower costs is exploited by those looking for a rationale to increase pension benefits. Moreover in 2010, 38 states failed to make their required DB contributions. In the private economy, em-ployer contributions must be made on an ongoing basis into individual accounts.
The reality is DC plans have costs that are current, predictable and can easily be designed to be affordable. More states need to seriously con-sider joining Michigan and Alaska in enacting a reform that will move new hires into defined contribution retirement plans.
Who’s Winning the Pension Wars?
RICK DREYFUSS is a senior fellow at the Manhattan
Institute. He has more than two decades of private-
sector actuarial experience with the Hershey Co. and
is the author of a new report “Fixing The Public Sector
Pension Problem: The (True) Path To Long-Term Reform.”

Inside ALEC | March / April 2013 • 9
iTA X & C O M M E R C E
Streamlining Commissions as an Important Tool for increasing state competitivenessBY THE HONORABLE MAURICE P. McTIGUE
L awmakers across the country are increasingly focused on mak-ing their states more business-friendly than their neighbors and attracting the people, capital and jobs that come with this distinction. Too often, though, they attempt to do so by offer-
ing tax breaks, subsidies, and other special privileges as inducements for businesses to pack up and move to their state. Funding this largesse to outsiders means that existing businesses and job creators must pay more than their share in taxes and fees, ultimately leading to a brain drain of the state’s talented young people. A far better path would be to focus on improving the state’s overall economies so that both new and established businesses can thrive.
In Rhode Island, we saw a clear example of the favoritism strategy over the last few years. In July 2010, the state’s Economic Development Cor-poration offered Studio 38, a video game production company headed by Curt Schilling, a $75-million loan guarantee to move its production to Providence from Massachusetts. Two years later, the company filed
for bankruptcy, ultimately leaving state taxpayers on the hook for $112.6 million in moral obligation bonds. This is just the latest and best example of what can happen when states attempt to create a competitive econo-my by picking winners and losers. For a federal example, look no further than Solyndra, which epitomizes the riskiness of such ventures.
It is far better to have 1,000 existing firms in your state hire one ad-ditional employee than to subsidize an outside firm to come in and hire 1,000 workers. The effect of the former is widespread and the entire state economy benefits. Most resident businesses have a track record of succeeding there, while the new entrant often has to be bribed again with taxpayer dollars at the end of their preferential period to stay.
Policymakers can measure their success by looking at job growth and the expansion of state businesses. This stems from private sector invest-ment. So to remain competitive with their neighbors and faraway places, states must provide the friendliest face for investment possible. They can do this by providing a policy environment of certainty, simplicity, and a low cost of tax and regulatory compliance.
Certainty is the most important consideration for investors, so states’ fiscal and regulatory habits play an important part in the decisions busi-ness leaders make. Future debt is the result of today’s spending, and it forces residents and businesses to predict future taxes and spending. In states with large unfunded obligations and high debt levels, they know to expect higher taxes and decreased public services eventually—but how much is anyone’s guess. It is no coincidence that states with the highest levels of debt per capita have been losing residents to states with smaller government, lower tax rates and policy certainty.
Illinois provides an example of how states can easily fall behind. In a five-year period it dropped from 8th to 48th in CEO Magazine’s ranking of the Best and Worst States for Business. Not an example to follow; the state now has the nation’s lowest bond rating, reflecting its dismal pros-pects for economic growth.
For state legislators and governors seeking to improve their competi-tive standing, appointing a streamlining commission is an important tool. Including experts from outside of government is a critical step in the process. In particular, streamlining commissions that include members of the private sector can offer insights into improved managerial prac-tices for government organizations. And they provide invaluable advice on creating a better climate for investors by identifying key barriers to investment like compliance costs and regulatory hurdles.
For example, Colorado’s Department of Regulatory Agencies brought together the “Pits and Peeves” Roundtable Initiative, a group of dozens of business leaders with the objective of improving customer service from the state’s agencies. The initiative provided the agencies with the oppor-tunity to listen to their customers and identify the ways in which they could simplify the regulatory process. Similarly, Virginia’s Commission on Government Reform and Restructuring identified four professions which could be deregulated, making it easier for residents to do business with-out the time and expenses of too much occupational licensing.
Improving competitiveness is a continuous cycle; to stand still and do nothing means moving backwards in the rankings. Decisions that are un-friendly to investment will move capital and jobs to other states or even to other countries, and proactive lawmakers must be aware that they are competing in a global market. Ultimately, policymakers in struggling states will know they have created a truly competitive economy when the educated kids who have left to pursue opportunities elsewhere start returning home to work.
THE HONORABLE MAURICE P. McTIGUE, qSO, is vice
president for outreach at the Mercatus Center at George
Mason University. He is a former cabinet minister and
member of parliament in his native New zealand.
It is far better to have 1,000 existing
firms in your state hire one additional
employee than to subsidize an outside
firm to come in and hire 1,000 workers.

10 • Inside ALEC | March / April 2013
I N S I D E A L E C
BY DR. RANDALL POzDENA AND DR. ERIC FRUITS
I t is taken as an article of faith today that the cure for recession or slow growth is to increase government spending––even if that requires issuing debt and increasing tax rates. Indeed, we were told by the President’s economic advisors in 2009
that their deficit spending plan would cause the unemployment rate to peak at less than 8 percent, and decline quickly to less than 6 percent by 2012. Instead, of course, unemployment jumped to 10 percent by 2010 and remains stubbornly near 8 percent today.
The failure of the Obama stimulus plan came as no surprise to those of us who have not drunk the long-discarded Keynesian Kool-Aid. After all, if the government spends more, then someone else has to do with less––now or in the future––thereby impeding eco-nomic activity and delaying recovery. Unfortunately, the unques-tioned faith in the Keynesian spending cure is just one example of many popularly held misconceptions about economic policy that are prevalent in today’s culture. As debates rage on in Washington and throughout the states about tax and economic policy, there is an abundance of misrepresentations and misconceptions that are regularly accepted as fact.
With the help of the American Legislative Exchange Council, we au-thored Tax Myths Debunked. It is an attempt to set the record straight on the facts surrounding the tax and fiscal policies that have been pushed by a progressive agenda. Our report discusses seven popularly held mis-conceptions about tax and fiscal policy that are misleading policy makers and the public, and will lead to harmful decisions. From the myth that raising taxes on the rich will not harm the economy, to the fallacy that austerity in the form of spending cuts will necessarily harm growth and employment, we have documented the academic studies and empirical data that refute these claims. Our goal is to balance the debate by dem-onstrating the strength of the evidence against the commonly-accepted wisdom regarding certain key issues. Readers will see that the strength of the evidence demonstrates that the key to economic growth is in free markets, contained government spending, and low tax rates.
Tax Myths Debunked also includes an examination of Rich States, Poor States, the state economic competitiveness index that is published yearly by the Council. This report seems to strike a nerve with progressives who have a stake in limiting the right to work, being given the authority to redistribute income, and building public sector empires at the expense of economic growth. Taxes matter to economic growth, and Rich States, Poor States highlights how this and other economic competitiveness fac-tors drive income, population, and job growth at the state level; there is, indeed, a correlation between a state’s economic performance rank and its competitiveness rank in Rich States, Poor States. We found the conclusions of the authors’ reports to have both sound theoretical and empirical bases.
In researching these studies, we also encountered critiques to this type of research from the proponents of larger government on the po-litical Left. It was surprising to us that the critiques from groups such as the Center for Budget and Policy Priorities demonstrated so little
awareness of the most relevant threads of the professional literature including authoritative studies by the Organisation for Economic Coop-eration and Development, International Monetary Fund and others. The studies also demonstrate serious inaccuracies––confusing improvements in one industry’s share of the economy with overall economic growth, for example, and consistently failing to use appropriate statistical methods. For those who care more about analysis than ideology, we have incorpo-rated more than 100 citations to the professional literature in Tax Myths Debunked to buttress our views.
We hope that Tax Myths Debunked serves to introduce some healthy skepticism about accepting the common misconceptions about tax and fiscal policy that pervade the current political discussion. The publication can then serve as a resource for policymakers and interested individu-als when discussing the options for how to best achieve a fast growing economy.
DR. RANDALL POzDENA is President of
quantEcon Inc. and is a former Research
Vice-President at the San Francisco
Federal Reserve Bank. DR. ERIC FRUITS
is an adjunct professor of economics and
business at Portland State University.
Download your free copy of Tax Myths Debunked at:
alec.org/publications/tax-myths-debunked
Tax Myths Debunked

Inside ALEC | March / April 2013 • 11
iTA X & C O M M E R C E
BY THE HONORABLE DAN LILJENqUIST
T he latest publication from ALEC’s Center for State Fiscal Re-form tackles one of the greatest threats to state finances – unfunded pension systems for government workers. A Legis-lator’s Guide to Diffusing the Pension Bomb provides several
tools for legislators to ensure that the state’s government can affordably fund state and local pensions, while protecting taxpayers.
State governments face many problems, including stagnant school performance, soaring Medicaid budgets and gridlock on urban roads. Their ability to fund improvements to services is challenged by a topic that seldom sees the light of day: pensions for state and local govern-ment workers. In most situations, retired public sector employees have a legal right to their pension checks. Ironically, they have no guarantee during their working years that legislators will put away enough money to pay for those checks. The sad fact is political calculations give legislators
strong incentives to promise generous benefits and few, if any, incentives to make good on those promises. “Unfunded liabilities” is the term used to describe the promises that legislatures have made, but cannot keep. Estimating the size of those pension liabilities is a difficult task, but the liabilities range somewhere from $750 billion to more than $4 trillion—enough to cover a $60,000 salary and benefits package for 625,000 to 1.2 million new elementary school teachers for 20 years.
Employers in the private sector have moved most of their employees from the defined-benefit model that dominates public employment to other designs. Most notable are “defined contribution” and “cash bal-ance” plans. Though these two types of plans differ from each other and come in many versions, they share a fundamental difference from the defined-benefit plan: They offer increased predictability for the employer and an increased likelihood to the employee that the money promised to them will actually be put away in their name.
As overseers of both the public treasury and the public workforce, leg-islators, regardless of ideological stripe or policy goals, need to review the health of government pensions in their states. In many cases, they will need to look for both short-term patches and long-term cures. Before
looking in the toolbox, though, they should establish some principles for reform. These should include: removing the possibility that the state will go functionally bankrupt due to pension-related costs, meeting the obli-gations the state has incurred in the past, and making future obligations predictable and sustainable.
Once they establish principles for reform, legislators can choose from a menu of options. Tinkering with existing plans is the most obvious, and sometimes the easiest. Some of these steps include raising the retire-ment age, eliminating the practice of an employee obligating the em-ployer for decades worth of pension payments through one year of cash-ing in sick leave, and making cost-of-living adjustment (COLA) payments contingent on the financial health of the pension plan. Rhode Island is the most notable example of a state that has taken this path.
Often these “inside-the-box” changes may not be significant enough to restore financial health to a pension plan. Worse yet, they do not remove the threat of functional bankruptcy. Legislators should move defined-benefit systems to properly designed alternatives, such as defined-con-tribution, cash balance, and hybrid plans. Several states have moved in these directions, including Michigan (defined contribution), Kansas (cash balance) and Utah (hybrid).
Reformers must listen to a wide range of people and treat them with respect, and stress math rather than ideology. Let me be clear, the pen-sion problems facing states are not political, but mathematical in nature. Solving the problem will require bipartisan solutions that are based in financial reality. A Legislator’s Guide to Diffusing the Pension Bomb pro-vides policymakers with sound ideas to further fundamental reform.
DAN LILJENqUIST is a former Utah State
Senator who is nationally recognized for his work
on retirement reform. He is the founder and
president of Liljenquist Strategies.
Political calculations give legislators
strong incentives to promise generous
benefits and few, if any, incentives to
make good on those promises.
A Legislator’s Guide to Diffusing the Pension Bomb
Looking to get your message in front of the country’s top poLicy makers, business Leaders and grassroots advocacy groups?
May/June: the Legal issueCivil Justice Health and Human Services Justice Performance Project
July/aug: energy and tradeEnergy, Environment and AgricultureInternational Relations
Sept/Oct: Back-to-SchoolEducation
nov/dec: innovation and the Future Communications and Technology
Jan/Feb: the year ahead, council MembershipGoals and Policies for State Sessions Around the Country
Mar/apr: tax-timeCommerce, Insurance and Economic Development Tax and Fiscal Policy
Maximize your advertising dollars with Inside ALEC: a publication distributed six times per year to Council members including nearly one-third of all state elected officials and many of the country’s most influential businesses and think tanks.
Inside ALEC provides a unique opportunity to reach state legislators, business leaders and citizen organizations around the country.
to learn more about advertising in Inside ALEC, contact Ashley Varner at (202) 742-8526 or [email protected]

Inside ALEC | March / April 2013 • 13
iTA X & C O M M E R C E
Gasoline taxes: Funding roads or pork?
BY JONATHAN WILLIAMS
According to the American Petroleum Institute, federal, state, and local taxes average 48.8 cents per gallon of unleaded gaso-line and 54.4 cents per gallon of diesel. As drivers face that burden each time they fill up at the pump, it is necessary for
lawmakers to show that these funds are being used prudently. For the past 100 years, American motorists have been enamored with
better roadways, and the benefits of increased personal mobility cannot be overstated. Gasoline taxes provided the vast majority of funding re-quired to bring the United States into the automobile age and to build the interstate highway system. For generations, Ameri-cans thought of gasoline taxes as the price of mobility in America; however, with in-creasing mismanagement of gasoline tax funds at the state and federal level, driv-ers no longer see the connection between gasoline taxes at the pump and spending to build and maintain transportation infra-structure.
Gasoline taxes in America were levied upon the premise that they would serve as a user fee for roads. If the benefit prin-ciple is to work, governments must ensure gasoline tax dollars are spent to build and maintain roads for the benefit of users who pay the gasoline tax.
Unfortunately, gasoline taxes have un-questionably departed from their historical justification, rooted in the benefit principle of taxation. The Council’s Task Force on Tax and Fiscal Policy adopted model language to correct this problem (see “A Constitu-tional Amendment Restricting the Use of Vehicle Fees and Taxes for Highway Purposes”). According to previous research, at least 20 states divert gasoline tax revenue to fund numer-ous general fund projects. In addition, state gasoline tax revenue, which could have been used for road construction and maintenance, has been instead used for the following:
• Administration of mobile home titling,• Aid to public schools,• Improvement of recreational snowmobiling,• Eradication of the fruit fly and other emergencies,• Recreational boating activities, freshwater fisheries management
and research,• Boating and boating facilities, seafood and salt water sports fishing,
and• Conservation activities to prevent or reduce soil, wildlife and habitat
loss.
The recent acceleration away from the benefit principle is detrimental to sound tax policy, quality public roads and the overall integrity of gov-ernment “trust funds.” If benefit-principle taxation is to survive as the foremost source of road funding, lawmakers must insist on more over-sight to ensure revenue from gasoline tax user fees do not support bridg-es to nowhere or attempts to eradicate the fruit fly. Instead, these user fees should be used to build the roads of the 21st century and to provide a fair and equitable transportation system for all American motorists.
For additional information, please see “Paying at the Pump: Gasoline Taxes in America” www.taxfoundation.org
JONATHAN WILLIAMS is director of the Council’s Task
Force on Tax and Fiscal Policy, as well as the Center for
State and Fiscal Reform
Gasoline taxes in America were levied
upon the premise that they would
serve as a user fee for roads.

14 • Inside ALEC | March / April 2013
I N S I D E A L E C
the nine states with the Lowest and the highest Marginal personal income tax (pit) rates ten-year economic performance (performance between 2001 and 2010 unless otherwise noted)
Non-Farm Gross State Payroll State & Local top pit product employment population tax revenue State Rate* Growth Growth Growth Growth***
Alaska 0.00% 77.0% 12.2% 12.1% 175.1%
Florida 0.00% 47.7% 0.2% 15.0% 63.6%
Nevada 0.00% 58.9% 6.1% 28.9% 74.0%
New Hampshire 0.00% 35.2% -0.7% 4.7% 52.1%
south dakota 0.00% 58.5% 6.4% 7.3% 47.2%
Tennessee 0.00% 38.6% -2.8% 10.3% 43.9%
texas 0.00% 57.7% 8.7% 17.9% 65.1%
Washington 0.00% 47.8% 3.0% 12.3% 44.0%
Wyoming 0.00% 105.6% 15.2% 14.3% 168.8%
9 states with no pit** 0.00% 58.54% 5.36% 13.65% 81.53% u.s. average** 5.70% 46.61% 0.51% 8.63% 51.04% 9 States with Highest Marginal pit rate** 9.90% 42.06% -1.68% 5.49% 44.88%
Ohio 8.43% 24.8% -9.3% 1.2% 28.4%
Maine 8.50% 35.4% -2.5% 3.4% 32.6%
Maryland 8.70% 50.9% 1.7% 7.4% 47.5%
Vermont 8.95% 36.1% -1.6% 2.2% 54.9%
New Jersey 9.97% 33.7% -3.6% 3.6% 55.1%
california 10.30% 42.1% -4.8% 8.0% 41.2%
Oregon 10.59% 55.0% -0.3% 10.4% 32.5%
Hawaii 11.00% 57.4% 5.7% 11.7% 55.8%
New York 12.70% 43.1% -0.4% 1.5% 56.0%
*Highest marginal state and local personal income tax rate imposed as of 1/1/2012 using the tax rate of each state's largest city as a proxy for the local tax . The deductability of federal taxes from state tax liability is included where applicable. New Hampshire and Tennessee tax some investment forms of income only. **Equal-weighted averages ***2000-2009
Inside ALEC | March / April 2013 • 15
I N S I D E A L E C TA X & C O M M E R C E
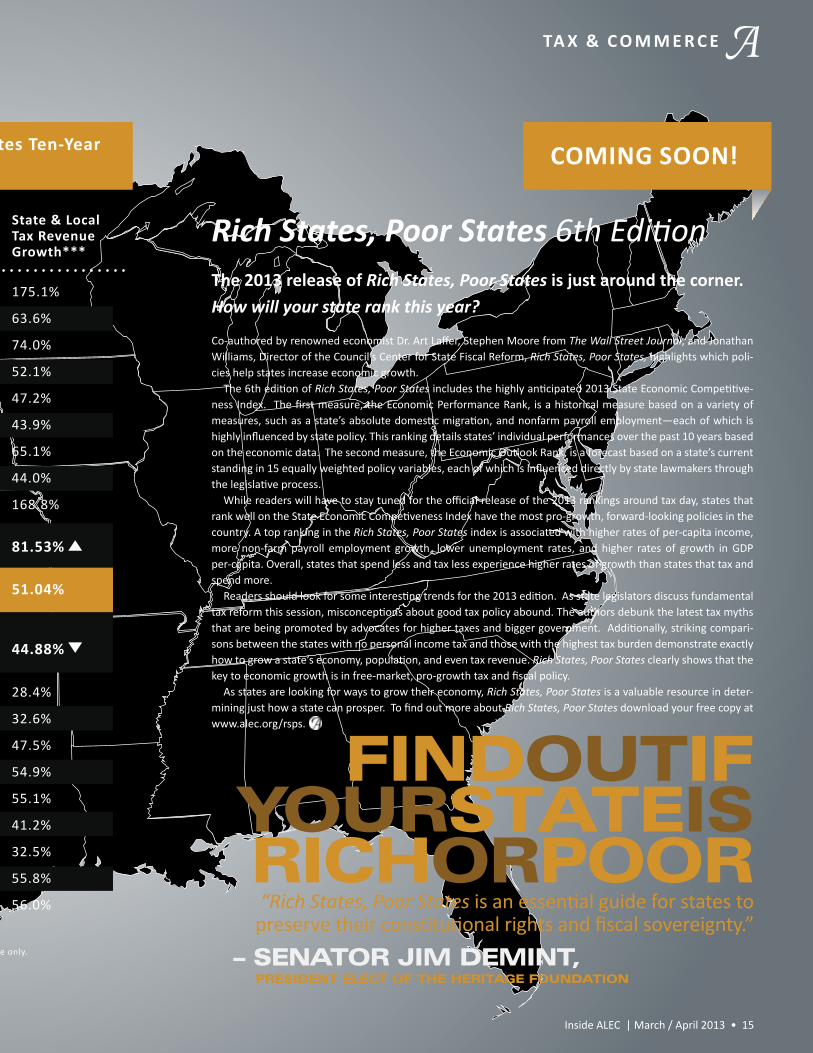
Rich States, Poor States 6th Editionthe 2013 release of Rich States, Poor States is just around the corner. How will your state rank this year?
Co-authored by renowned economist Dr. Art Laffer, Stephen Moore from The Wall Street Journal, and Jonathan Williams, Director of the Council’s Center for State Fiscal Reform, Rich States, Poor States, highlights which poli-cies help states increase economic growth.
The 6th edition of Rich States, Poor States includes the highly anticipated 2013 State Economic Competitive-ness Index. The first measure, the Economic Performance Rank, is a historical measure based on a variety of measures, such as a state’s absolute domestic migration, and nonfarm payroll employment—each of which is highly influenced by state policy. This ranking details states’ individual performances over the past 10 years based on the economic data. The second measure, the Economic Outlook Rank, is a forecast based on a state’s current standing in 15 equally weighted policy variables, each of which is influenced directly by state lawmakers through the legislative process.
While readers will have to stay tuned for the official release of the 2013 rankings around tax day, states that rank well on the State Economic Competiveness Index have the most pro-growth, forward-looking policies in the country. A top ranking in the Rich States, Poor States index is associated with higher rates of per-capita income, more non-farm payroll employment growth, lower unemployment rates, and higher rates of growth in GDP per-capita. Overall, states that spend less and tax less experience higher rates of growth than states that tax and spend more.
Readers should look for some interesting trends for the 2013 edition. As state legislators discuss fundamental tax reform this session, misconceptions about good tax policy abound. The authors debunk the latest tax myths that are being promoted by advocates for higher taxes and bigger government. Additionally, striking compari-sons between the states with no personal income tax and those with the highest tax burden demonstrate exactly how to grow a state’s economy, population, and even tax revenue. Rich States, Poor States clearly shows that the key to economic growth is in free-market, pro-growth tax and fiscal policy.
As states are looking for ways to grow their economy, Rich States, Poor States is a valuable resource in deter-mining just how a state can prosper. To find out more about Rich States, Poor States download your free copy at www.alec.org/rsps.
the nine states with the Lowest and the highest Marginal personal income tax (pit) rates ten-year economic performance (performance between 2001 and 2010 unless otherwise noted)
Non-Farm Gross State Payroll State & Local top pit product employment population tax revenue State Rate* Growth Growth Growth Growth***
Alaska 0.00% 77.0% 12.2% 12.1% 175.1%
Florida 0.00% 47.7% 0.2% 15.0% 63.6%
Nevada 0.00% 58.9% 6.1% 28.9% 74.0%
New Hampshire 0.00% 35.2% -0.7% 4.7% 52.1%
south dakota 0.00% 58.5% 6.4% 7.3% 47.2%
Tennessee 0.00% 38.6% -2.8% 10.3% 43.9%
texas 0.00% 57.7% 8.7% 17.9% 65.1%
Washington 0.00% 47.8% 3.0% 12.3% 44.0%
Wyoming 0.00% 105.6% 15.2% 14.3% 168.8%
9 states with no pit** 0.00% 58.54% 5.36% 13.65% 81.53% u.s. average** 5.70% 46.61% 0.51% 8.63% 51.04% 9 States with Highest Marginal pit rate** 9.90% 42.06% -1.68% 5.49% 44.88%
Ohio 8.43% 24.8% -9.3% 1.2% 28.4%
Maine 8.50% 35.4% -2.5% 3.4% 32.6%
Maryland 8.70% 50.9% 1.7% 7.4% 47.5%
Vermont 8.95% 36.1% -1.6% 2.2% 54.9%
New Jersey 9.97% 33.7% -3.6% 3.6% 55.1%
california 10.30% 42.1% -4.8% 8.0% 41.2%
Oregon 10.59% 55.0% -0.3% 10.4% 32.5%
Hawaii 11.00% 57.4% 5.7% 11.7% 55.8%
New York 12.70% 43.1% -0.4% 1.5% 56.0%
*Highest marginal state and local personal income tax rate imposed as of 1/1/2012 using the tax rate of each state's largest city as a proxy for the local tax . The deductability of federal taxes from state tax liability is included where applicable. New Hampshire and Tennessee tax some investment forms of income only. **Equal-weighted averages ***2000-2009
COMING SOON!
FINDOUTIFYOURSTATEISRICHORPOOR“Rich States, Poor States is an essential guide for states to
preserve their constitutional rights and fiscal sovereignty.”
– SENATOR JIm DEmINT, PRESIDENT ElECT OF THE HERITAgE FOUNDATION

16 • Inside ALEC | March / April 2013
I N S I D E A L E C
Inside ALEC | March / April 2013 • 17
iTA X & C O M M E R C E
BY THE HONORABLE JASON SAINE
A s government at all levels struggles to pay bills, two Califor-nia men were convicted of a fraud scheme aimed to defraud the government of over $250 million through falsified tax re-turns.1 Through their tax preparation company, they charged
clients fees as high as $10,000 in exchange for preparing and filing false tax returns that often sought hundreds of thousands of dollars in refunds.
With each new instance of fraud and abuse in government programs, the tactics and schemes used are increasing in sophistication. Perpetra-tors often work in organized and expansive fraud networks to exploit these public resources. In just one instance, 111 defendants in nine cities were charged for their participation in fraud schemes involving over $225 million in false Medicare and Medicaid billings.2 As federal spending ap-proaches $4 trillion ($3.8 in 2013), the opportunity for waste, fraud, and abuse within government abounds and is ever-increasing.
The potential for great public loss is prevalent at both the federal and state level. According to Jim Frogue, editor of Stop Paying the Crooks (CHT Press, 2009), “Fraud and abuse are rampant in programs like Med-icaid and food stamps. If state policymakers want to solve the problem, they can demand greater transparency in how those programs are run
and utilize the most modern technology to identify and eliminate fraudu-lent activity in real time.”
Modern technologies designed to reduce the losses from fraud, waste, abuse, and improper payments do exist. In fact, they have been deployed successfully in the commercial sector for many years. By implementing an approach that utilizes data from multiple sources and across govern-ment agencies, states can increase the detection of inconsistent behav-iors such as doctors billing Medicaid for more than 24 hours’ worth of appointments in a single day, personal injury attorneys who repeatedly send the same clients to the same doctors for diagnosis, or claims made under two names with the same Social Security number and address.
It is much easier to pinpoint inconsistencies in the data when it is shared across agencies. However, state agencies are often hesitant to share data.
Policymakers can encourage data and information sharing by estab-lishing an Enterprise Fraud Program Office to calculate estimated costs and savings, implement fraud detection technology, and coordinate with state agencies to encourage them to share data and tailor the technology to their particular needs.
technology provides opportunity to Limit Government Spending
Continued on Page 27

18 • Inside ALEC | March / April 2013
I N S I D E A L E C
travel services taxes: stepping over dollars to Reach For PenniesBY THE HONORABLE JASON BRODEUR
While it is correctly said that the states are laboratories of democracy, even the most successful lab can produce bad results. It is hardly a secret that state and municipal governments actively seek new sources of revenue to
fund existing programs and to expand their control of commerce. Among the least desirable legislative experiments is a tax proposal that has been considered—and rejected—by more than a dozen states in the past sev-eral years: new taxes on travel services.
Travel service taxes take various forms, but generally extend hotel oc-cupancy taxes or state sales taxes to the service fees that travel interme-diaries charge to their customers.
This is accomplished through a change in the definition of room rent, which is the cost of sleeping in a hotel for a night, to include any booking fees associated with the reservation. Other bills propose changes in the definition of hotelier or hotel operator to include providers of booking services, including online travel companies like Orbitz and Expedia; tour operators; and travel agents.
These taxes tend to target out-of-state corporations and have pro-found implications for in-state businesses, such as travel agents, inde-pendent hoteliers who often need extra help to market their properties, and other businesses that rely on tourism to survive.
Lawmakers disguise these taxes by characterizing the legislation as a positive source of revenue from outside the state, the establishment of a level playing field, or the identification and closing of a loophole. But there is no loophole, and the system is already fair. Online travel com-panies and travel agents operate highly successful businesses that mar-ket local hotels and attractions to a global customer base. When hotel rooms are full, hotels generate tax revenue—as do out-of-state visitors, who help local economies by spending money on restaurant meals, taxis, souvenirs and tickets to attractions.
Democrat city officials in New York City, the Bay Area, and Washing-ton, D.C. were early proponents of this type of legislation; they saw the chance to impose a politically cost-free tax on visitors and businesses that couldn’t retaliate at the ballot box—after all, there’s a reason taxes on ho-tels and rental cars are as high as they are. However, in the past several years, the concept has spread to unexpected places such as Virginia, Ten-nessee and Utah—not generally fertile ground for tax increases—where even some Republicans have chosen to pursue this legislative concept.
Fortunately, every state that considered travel services taxes in 2012 rejected the idea. I’m proud that my home state of Florida recognizes the importance of the tourism industry and has chosen not to go down this dangerous road. Despite pressure from municipal officials looking for new tax revenue for local stadiums and other attractions, state legislators understand these ideas have a detrimental impact on tourism demand and hurt rural communities, small and independent hotels, travel agents, and local small businesses.
The first “Golden Rule of Effective Taxation” in Rich States, Poor States puts it best: When you tax something more, you get less of it. Applying new taxes on travel services will have a predictable result: it creates a disincentive to promote travel to states that have such taxes. Consum-ers—and businesses—are savvy enough to find out where it makes sense to spend limited travel budgets. States that steer clear of new taxes on tourism will benefit.
REPRESENTATIVE JASON BROUDER
(hd-28) is Chairman of the Florida House
subcommittee on Government Operations,
and represents Sanford, Florida in the
state House of Representatives.
When you tax something more, you get less of it.

Inside ALEC | March / April 2013 • 19
iTA X & C O M M E R C E
the road Less traveled: transportation Funding BY CARA SULLIVAN
In the sequestration talks earlier this year, transportation funding played a large role as policymakers discussed how best to deal with our nation’s deteriorating infrastructure. Even in his State of the Union address, President Obama highlighted our nation’s crumbling
roads. Regardless of one’s opinion on the extent of the deterioration of our highway system—a recent analysis conducted by David Hartgen and colleagues found the average condition of highways has actually im-proved over the past two decades—there is broad consensus that much work needs to be done and a general acknowledgement that creative funding solutions are needed.1
The long-standing method of funding highways, the Highway Trust Fund, was established in 1956 as a mechanism for collecting federal fuel taxes to be used exclusively for highway construction and maintenance. Over the years, however, the purview of the Highway Trust Fund has expanded to include local projects such as bike paths, decorative land-scaping, and sidewalks. In 2009, 38 percent of federal highway funding was spent on non-highway projects.2 In addition, as the fuel efficiency of motor vehicles increases, less gas taxes are collected per mile traveled. These factors led to the increasing inability of the Highway Trust Fund to cover its own expenses.
In July 2012, Congress passed MAP-21, the surface transportation re-authorization bill, and transferred $18.8 billion of general funds to the Highway Trust Fund to help cover the funding gap.3 Reliance on general funds is not a viable method of paying for our nation’s roads and, as bud-get cuts loom in Washington, similar transfers are less likely. Consequent-ly, states will need to find innovative ways to maintain an adequate level of transportation funding.
In order to meet this need, states are examining various alternatives to fund their transportation projects. So far this year, proposals have ranged from Virginia Governor Bob McDonnell’s plan to replace the gas tax with
an increase in the sales tax to considerations of Vehicle Miles Travelled (VMT) taxes in multiple states. These approaches are highly debated but, regardless of which path a state decides to take, there is an essential role for the private sector.
The private sector stands ready to invest in transportation infrastruc-ture and would have more opportunities to do so if focus shifted from funding to financing. Instead of being paid for out of annual budgets, surface transportation projects should be financed so they are paid for over time as users receive benefits. States can do this by enacting public-private partnership enabling legislation.
Public-private partnerships (PPPs) are contractual agreements be-tween public and private sector partners where part of the services that fall under the responsibility of the public entity are provided by the pri-vate sector partner. PPPs have the ability to leverage private sector capi-tal, transfer financial risks from taxpayers to the private sector, and more efficiently deliver projects than when the public entity acts alone.
There are successful models of PPPs in Puerto Rico, the United King-dom, Australia, and British Columbia. Texas implemented wide-ranging policies to authorize private sector financing for state and local assets and Virginia has employed PPPs to construct projects such as the Mid-town Tunnel.
PPPs are not the entire solution but they provide an important way for states to infuse private sector dollars into their transportation projects as the federal government and Highway Trust Fund become less likely sources of funding. As states continue to consider methods to fund their surface transportation, they should look to the private sector as a critical ally.
CARA SULLIVAN is the director
of the American Legislative
Exchange Council Task Force
on Commerce, Insurance and
Economic Development.
1 Hartgen, David, M. Gregory Fields, and Elizabeth San Jose. “Are Highways Crumbling? State and U.S. Highway Performance Trends, 1989-2008.” 2012.
2 Utt, Ronald D. “Federal Highway Trust Fund: Recommit to Better Highways and Enhanced Mobility.” 2010.
3 Poole, Robert W. “Funding Importation Transportation Infrastructure in a Fiscally Con-strained Environment.” Reason Foundation.
20 • Inside ALEC | March / April 2013
I N S I D E A L E C
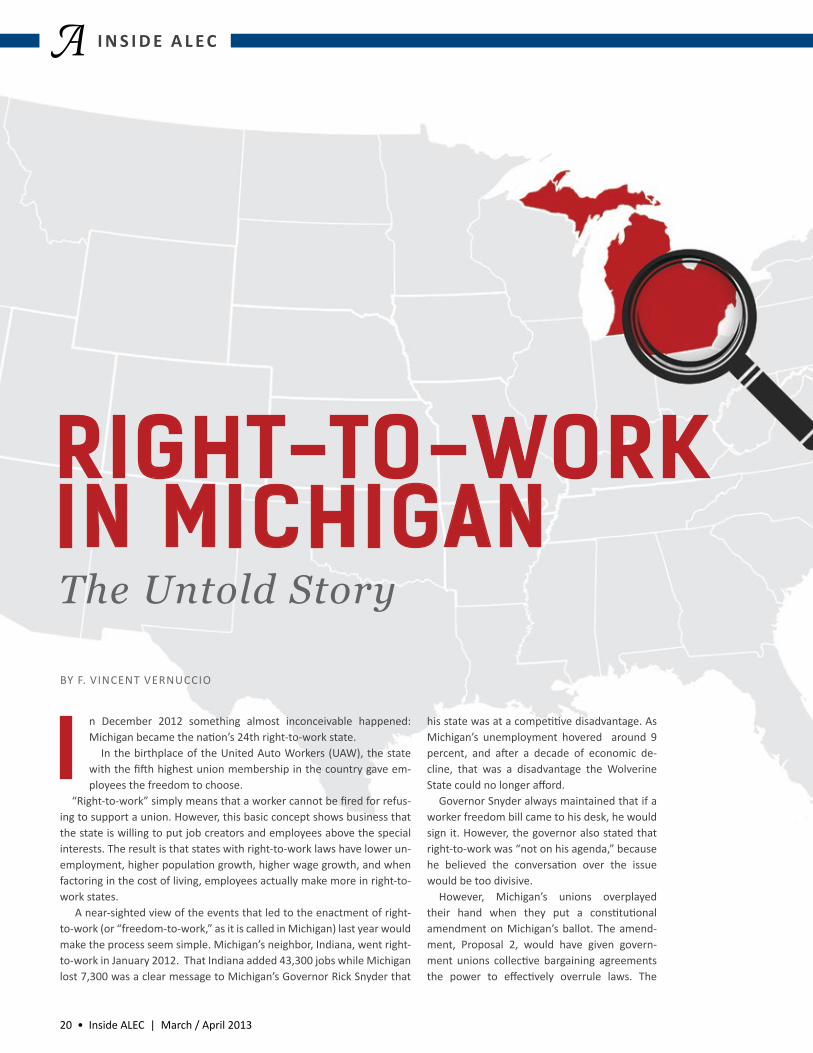
n December 2012 something almost inconceivable happened: Michigan became the nation’s 24th right-to-work state.
In the birthplace of the United Auto Workers (UAW), the state with the fifth highest union membership in the country gave em-ployees the freedom to choose.
“Right-to-work” simply means that a worker cannot be fired for refus-ing to support a union. However, this basic concept shows business that the state is willing to put job creators and employees above the special interests. The result is that states with right-to-work laws have lower un-employment, higher population growth, higher wage growth, and when factoring in the cost of living, employees actually make more in right-to-work states.
A near-sighted view of the events that led to the enactment of right-to-work (or “freedom-to-work,” as it is called in Michigan) last year would make the process seem simple. Michigan’s neighbor, Indiana, went right-to-work in January 2012. That Indiana added 43,300 jobs while Michigan lost 7,300 was a clear message to Michigan’s Governor Rick Snyder that
The Untold Story
ihis state was at a competitive disadvantage. As Michigan’s unemployment hovered around 9 percent, and after a decade of economic de-cline, that was a disadvantage the Wolverine State could no longer afford.
Governor Snyder always maintained that if a worker freedom bill came to his desk, he would sign it. However, the governor also stated that right-to-work was “not on his agenda,” because he believed the conversation over the issue would be too divisive.
However, Michigan’s unions overplayed their hand when they put a constitutional amendment on Michigan’s ballot. The amend-ment, Proposal 2, would have given govern-ment unions collective bargaining agreements the power to effectively overrule laws. The
BY F. VINCENT VERNUCCIO

Inside ALEC | March / April 2013 • 21
iTA X & C O M M E R C E
Michigan. This planning allowed the center to put out information al-most overnight, highlighting prior studies and analyses on the benefits of worker freedom.
The grassroots organizations showed their members over time why they should care about the issue. Donors with political influence held their fire until the time was right. Lawmakers who wanted nothing more than to give their union member constituencies the power to choose kept their powder dry, working to convince their colleagues instead.
All of these pieces were in place and, when the timing was perfect, sprang into action.
But even this is not the full picture. The final component was wait-ing for the stage to be set. Could right-to-work have happened in 2012 without Proposal 2 or Indiana’s passage of right-to-work? Probably not.
Michigan did not have much influence in Indiana; however the con-certed effort making the case for worker freedom which resulted in ever increasing support, in conjunction with the governor’s labor reforms for government unions is likely what forced the unions to overplay their hand with Proposal 2.
Recently, UAW President Bob King said that the labor reforms enacted around the nation in 2011 and 2012 caused unions to worry about the possibility of right-to-work and without that possibility, he never would have pursued Proposal 2.
In essence, even Proposal 2 was a result of those fighting for labor reform.Finally, there was messaging. Everyone involved with the right-to-work
fight knew the battle would not be won with statistics – which were de-cidedly in favor of employee freedom, such as employees in right-to-work states make about four percent more when factoring in the cost of living.
The effort needed a clear and convincing message that was under-standable to everyone. It had to appeal to a broad base and not simply speak to those who were already predisposed to union reform.
The message had to underline that right-to-work is about helping em-ployees and focus on the positive instead of going negative.
The governor perfectly encapsulated this message when he explained how right-to-work policies lead to more freedom. These policies are “pro-worker,” and result in “more and better jobs” for Michigan employees.
Right-to-work does this because it helps make unions more account-able to their membership and may even make them stronger.
A fact reflected in the most recent statistics from the Department of Labor shows that in 2012 right-to-work states (not counting Indiana or Michigan) added 39,000 union members while forced unionism states lost 390,000.
In the end, Michigan had the perfect storm, but the storm conditions arose from a variety of factors precipitated by two decades of hard work, making the impossible possible.
amendment would have also made right-to-work legislatively impossible.
In the end, this political power-play backfired, forcing Michigan to have the conversation about right-to-work. The result was clear and over-whelming: Michigan voters rejected the union-backed Proposal 2 by a margin of 15 points.
Now, with the voters having spoken and (more importantly) with the need to stay competitive with its neighbor, Michigan took on right-to-work and quickly gave employees the freedom to choose. That simple, right?
Not at all. Like an iceberg, the movement to give employees freedom of choice in Michigan had a large foundation that often went unobserved on the surface.
Naming everyone who deserves credit would take more space than is available here. While the Mackinac Center provided intellectual am-munition, groups such as Americans for Prosper-ity and the Michigan Freedom to Work Committee deployed a large number of grassroots activists. Terry Bowman, president of Union Conservatives and current UAW member, spoke to rally his fellow union members in support of worker freedom.
There were motivated lawmakers pushing the bill, led by two freshmen legislators: Senator Pat Colbeck (SD-7) and Representative Mike Shirkey (HD-65).
Michigan power players such as Dick Devos and Ambassador Ron Weiser bolstered nervous politi-cians concerned about being targeted by unions in their reelections.
Worried legislators could take comfort in the electoral victories of their neighbor. In the election after Indiana passed right-to-work, the party that supported right-to-work did not lose a single seat in the state Senate and even picked up nine seats in the House.
A number of national groups coalesced to pro-vide logistical support and advice, such as the Na-tional Right to Work Committee, Americans for Tax Reform and the State Policy Network.
No single person or group made right-to-work happen in Michigan, but it was an effort of which if one or two of the players were not present, work-ers in the state still would be forced to pay a union just to keep their job.
However, that analysis also does not fully grasp the entire picture of the careful two-decade long planning that resulted in right-to-work’s eventual passage.
For years, the Mackinac Center carefully made the case for how right-to-work would help
F. VINCENT VERNUCCIO is Director of Labor Policy
at the Mackinac Center for Public Policy in Michigan
and Subcommittee Chair of ALEC’s Labor and Business
Regulation Committee.

22 • Inside ALEC | March / April 2013
I N S I D E A L E C
smart aid to africa: an innovative approach
BY AVI LESHES AND ED ELEASIAN
During the second half of the twentieth century, many African nations seemed to exchange colonialism for tribal and ethnic rivalry leading to civil war, genocide, famine and the displace-ment of millions of Africans. The proliferation of disease,
including the rapid spread of HIV/AIDS and a series of natural disasters added to the misery. Numerous international organizations increased aid to the region. However, continued violence and territorial struggles impeded these efforts and the chronic challenges the continent faced hindered its progress in establishing the institutions that underpin func-tional governments and rule of law.
Control over natural resources is the primary driver of tribal and eth-nic violence, since gold, diamonds, precious metals and other valuable minerals are the chief means of financial support for insurgents working in opposition to local governments and terrorists and other international criminals. Terrorists routinely avoid having their assets frozen or confis-cated by converting them into commodities like diamonds, which more easily cross national borders. Just before 9/11, al-qaeda converted $20
million into diamonds and gold obtained in Africa; the 9/11 attacks cost a mere $500,000. Drug cartels, such as Los zetas of Mexico, FARC of Co-lombia and Hezbollah routinely use Africa to expand their operations and resources.
The Kimberley Process (KP), established in 2003 by a United Nations General Assembly resolution, was one proposed remedy. KP is a certifica-tion method seeking to ensure diamond buyers that the diamond being purchased is not from a conflict stricken country. Gold, precious gems and other valuable minerals, however, do not fall under KP jurisdiction. And while its objective is laudable, the scheme has enjoyed only mod-erate success. Rather than eliminating the illicit diamond trade, KP has forced it underground, increasing corruption. Local merchants profit by forging false certification documents that enable conflict diamonds to en-ter the non-conflict supply chain.
We are all appalled by atrocities committed in Africa and by terror-ist and international crime networks in Africa and elsewhere, although we unwittingly support these activities by purchasing commodities like diamonds that are smuggled from conflict zones into neutral markets. Conflict diamonds have begun appearing in China, Dubai, the UAE and
Inside ALEC | March / April 2013 • 23
iI N T E R N AT I O N A L R E L AT I O N S
Lebanon – countries which have never historically served as diamond hubs at all. These diamonds are resold into larger markets like London and NYC.
The Royal Miracle Corporation (RMC) is a consortium of New York City diamond merchants that has developed a public-private partnership framework to help reduce the flow of conflict diamonds and promote rule of law in parts of Africa where it is absent. RMC has a plan to improve KP enforcement by changing the way U.S. aid is distributed in Africa. RMC’s primary objective is to use American enterprises already engaged in African trade to help the nations of Africa to develop sustainable, consistent income and employment opportunities. These efforts should ultimately lead to adequate educational and health facilities, functional governments and rule of law in the nations targeted.
Too often U.S. aid delivery systems fail the African people and squan-der US tax dollars. Much aid never reaches its intended recipients, in-stead ending up in the hands of corrupt political and business leaders as well as terrorists. Instead of sending U.S. aid to governments unwilling and incapable of adequately monitoring how funds are disbursed, RMC proposes to pilot a new distribution network by using U.S. companies, such as RMC or other U.S. companies on the ground in Africa which are uniquely positioned to oversee the dissemination of aid.
Any government contractor receiving funds under RMC’s proposal should be subject to a quarterly audit by the relevant government bodies including U.S. Agency for International Development, the Internal Rev-enue Service, Congress and the Office of Management and Budget. These U.S. companies can and should be prosecuted in a U.S. Court of Law if funds are misappropriated.
RMC also recommends that the U.S. government and its allies provide additional support to African nations that have experienced an increase in smuggling activities to assist in enforcement of the law. This support would weaken the local warlords and dictators who currently control many of the mines. This should provide local governments with the op-portunity to certify the commodities that are mined legally, thus estab-lishing legitimate revenue streams. Reinforcing local law enforcement will disrupt the flow of illegal commodities and local governments can team with U.S. enterprises to retake their mines, extract the resources and sell them legally, resulting in the economic opportunities that these countries need to improve governance and grow their economies.
RMC has approached African leaders who have agreed in principle to RMC’s public-private partnership proposal and who view it as a way to spur economic opportunity and build much needed infrastructure. RMC is confident in its ability to ensure that U.S. aid is distributed in the man-ner intended, which will allow the people of Africa to derive the benefits of their continent’s resources for themselves. RMC will establish opera-tions in each country in which it operates to guarantee that rules like KP are followed for all commodities extracted. We would suggest that all other U.S. enterprises adopting the plan do the same. Having a local presence gives RMC the oversight capability to ensure that funds are not diverted and that there is sufficient capital to build schools, hospitals, water treatment facilities, electrical capacity, food security and general infrastructure in these developing nations. RMC will work with Congress and other governmental entities to conduct pilot projects to test the pro-gram’s efficacy. Once tested, the program’s ultimate goal is to provide the tools necessary for the targeted African nations to become economically independent. Leaders in several African nations have seen how political
and economic stability can help maintain current foreign investment and attract new investors who want to work in emerging markets and how the foreign investment can boost the tourism industry as well. Angola, Sierra Leone and zambia are poised for this kind of economic growth and have become the focus of many Asian and European investors. We be-lieve this plan can make the difference between their success and failure.
The benefits to Africans of the successful implementation of the RMC scheme are obvious, but Americans will also benefit. U.S. companies will perform oversight and help with infrastructure projects, creating US jobs, and U.S. diamond and commodities companies will be in a better posi-tion to compete globally. RMC and other diamond merchants support this project because it will create a better business environment. As My-ron Brilliant, the Senior Vice President for International Affairs of the U.S. Chamber of Commerce observed in the Heritage Foundation’s 2013 Index of Economic Freedom, “Good governance leads to good business.” A reli-able justice system is an important consideration when deciding to invest in a country as business needs assurance that national governments will abide by decisions rendered by their justice systems. Yet in many parts of Africa, rule of law and appropriate law enforcement are absent, sti-fling economic opportunity and hindering business growth. The diamond industry acutely suffers the effects of Africa’s good governance deficien-cies.
At their founding, Singapore and Malaysia worked tirelessly to develop a rule of law model to attract foreign investment. Today both have be-come major centers of economic growth in the region and while there is still more work to do, Singapore’s Freedom House rating improved over the past year while Malaysia’s 2012 numerical ratings have not wors-ened, and Malaysia remains “partly free.” It is this model that RMC hopes to replicate in Africa. RMC is confident the creation of a rule of law model will appeal to investors and set the stage for future economic opportuni-ties for Africa.
It is time for U.S. aid to facilitate Africa’s ability to create the inter-national trade relationships that can serve as a sustainable economic engine. “Give a man a fish; you have fed him for today. Teach a man to fish; and you have fed him for a lifetime.” We need to help Africa lay the foundation for a “lifetime” of economic growth!
AVI LESHES, RMC’s Political Liaison, previously worked as
the assistant to the Director of Military Programs at the
Aleph Institute; served as a specialist in New York Senator
Kirsten Gillibrand’s office on Military and Veterans Affairs
and lived in Singapore for a year, where he researched
the factors leading to Singapore’s vibrant economy.
ED ELEASIAN, a Senior Vice President at RMC, has
worked in the jewelry industry since his high school
graduation at 15. Within 10 years he became his
company’s Vice President and was responsible for a 300%
revenue increase as well as a number of innovations that
cut waste and improved profits. Ed provides solutions
for other firms in the trade by providing media and
advertising expertise.

24 • Inside ALEC | March / April 2013
I N S I D E A L E C
promoting Fair share Liability
BY VICTOR E. SCHWARTz & CARY SILVERMAN
The unfairness of joint and several li-ability has become increasingly ap-parent over the past three decades. When joint liability applies, a person
who is only minimally at fault may be forced to pay the entire amount of a court judgment, in-cluding the portion attributed to the wrongful conduct of others. In other words, a jury’s find-ing that a particular defendant may have been only 10% at fault is overridden and that defen-dant may be forced to pay 100% of the award if others who share responsibility do not pay their “fair share.” A new Council model policy, the Fair Share Act, provides a roadmap for reform.
Let’s say, for example, you run out of gas on a highway and you have no choice but to leave the car on the side of the road as you walk to the nearest gas station. A drunk driver slams into your car, killing a passenger in his vehicle and injuring another driver who is unable to avoid the wreckage. The drunk driver is unin-sured and has little financial resources. Most people would think it is unfair to place the en-tire amount of the damages from any injuries stemming from the accident on you as the ve-hicle owner, given that your responsibility was miniscule in comparison to the drunk driver.
Most jurisdictions have moved away from joint liability and adopted a “Fair Share” ap-proach, under which each party is responsible for damages in proportion to its responsibility for the injury. Oklahoma and Pennsylvania are the most recent states to do so. Several states, however, fully retain joint liability or apply joint liability in a wide range of cases. States can im-prove their civil justice systems by amending their laws to eliminate loopholes, correct ju-dicial misinterpretations, or address confusion in the courts regarding the ability of a jury to allocate fault among all who contributed to an injury.
The purpose of the new model act is sim-ple—establishing that liability is imposed in proportion to responsibility—but complexi-ties and questions may arise as you develop a
proposal that fits the law of your state. The Council stands ready to assist you in under-standing the nature and nuances of this model policy.
THE PUBLIC POLICY BASIS FOR JOINT LIABILITY NO LONGER APPLIES
Joint liability has its origin in a time in which the doctrine of contributory negligence barred a plaintiff that was even partially at fault for his or her own injury from any recovery. When this rule was in place, it was felt that it was fairer for a culpable defendant to bear the loss than to leave a blameless plaintiff without a full re-covery.
With the widespread adoption of compara-tive fault, the principal justification for requir-ing one defendant to bear another individual or entity’s share of fault was lost.1 In the vast ma-jority of jurisdictions, a plaintiff who is partially to blame for his or her own injury is not barred from recovery, but will have his or her recovery reduced in proportion to that individual’s share of responsibility for the harm.
In today’s legal environment, in which liabil-ity is closely linked with fault, both courts and legal scholars have criticized the continued ap-plication of joint liability.2
Aside from placing unfair, disproportionate liability on defendants, joint liability encour-ages plaintiffs’ attorneys to engage in “shotgun pleading.” Plaintiffs’ lawyers know that if they “sue everybody” they are likely to be able to convince the jury to assign at least one percent responsibility to one of the defendants, assur-ing that at least one party will be available to pay the entirety of a potentially large award.
Joint liability may also encourage plaintiffs’ lawyers to target businesses they consider to have “deep pockets” even when those busi-nesses played a small part in the plaintiff’s injury, while settling with those who bare the greatest responsibility for a nominal amount.
In addition, joint liability blunts incentives for safety because it allows negligent actors to un-der-insure and puts full responsibility on those who may have been only marginally at fault.
THE VAST MAJORITY OF STATES HAVE MOVED AWAY FROM JOINT LIABILITY
Recognizing the need for reform, most states have abolished or limited the application of joint liability through legislation or court deci-sion. These reforms show a clear movement to-ward equating liability with fault. Significantly, no state that has repealed or modified its joint liability law has ever gone back and amended the law to restore joint liability.
RECENT ENACTMENT OF JOINT LIABILITY REFORM
As we have indicated, Oklahoma and Pennsyl-vania are the most recent states to enact joint liability reform.
The Oklahoma experience shows that states can successfully take a step-by-step approach to reducing joint liability. In 2004, Oklahoma moved from full joint liability to a 50% thresh-old approach, but continued to apply joint li-ability when it is found that the defendants act-ed willfully or recklessly, or where the plaintiff had no comparative negligence. Five years lat-er, the Oklahoma legislature eliminated these exceptions, but otherwise retained the 50% threshold approach. Most recently, in 2011, Oklahoma abolished joint liability except where the state brings the lawsuit.8
Pennsylvania moved toward several liability on June 28, 2011, when Governor Tom Corbett signed the Fair Share Act into law. The Pennsyl-vania law is similar to Oklahoma’s first step in joint liability reform. Pennsylvania’s Fair Share Act eliminates joint liability except where a de-fendant is responsible for 60% or greater of the total fault apportioned to all parties and in sev-eral other limited situations.9
Other states that have reformed their joint and several liability laws over the past decade include Arkansas, Florida, Georgia, and Missis-sippi, which abolished joint liability, Missouri and South Carolina, which limited joint liability to defendants who are found at least 50% re-sponsible for the injury, Ohio, which adopted both a 50% threshold and limited joint liability

Inside ALEC | March / April 2013 • 25
iC I V I L J U S T I C E
to economic damages, and Texas, which clari-fied its procedures for allocation of fault to non-parties. In addition, West Virginia placed mod-est limitations on joint liability.10
CONSIDERATION OF ALL PARTIES
The area of greatest deviation, ambiguity, and confusion in the states is with respect to a jury’s ability to allocate fault to individuals or entities that are not present at trial, but whose conduct is likely to have contributed to the plaintiff’s in-jury. This issue arises in states that have oth-erwise abolished joint liability, modified joint liability to apply only to those whose respon-sibility for the injury reaches a certain thresh-old percentage, or enacted other limitations on joint liability.
There are many reasons why a person or company may not be named as a defendant in litigation, even if it contributed to the plaintiff’s injury. A company that shares responsibility for the injury may have gone out of business or may be insolvent. An individual who clearly is largely at fault for the harm may be “judgment proof,” meaning he or she has little or no as-sets to pay damages. Some people or entities are immune from litigation. For example, states have sovereign immunity, employers’ liability for on-the-job injuries is generally limited to workers’ compensation, and, in some states, charitable organizations have limited liability.
A plaintiff may choose not to sue an individu-al or entity because it is beyond the jurisdiction of the court or not subject to service of process, such as a foreign company that does little busi-
ness in the United States. As noted earlier, it is common for plaintiffs to settle with those who have little financial resources, even if those parties bear most of the responsibility for the injury. Instead, joint liability encourages plain-tiffs’ lawyers to focus their litigation on “deep pockets” and press for major liability exposure on a business that had a minor role in bringing about an alleged harm.
If a jury is only allowed to consider the re-sponsibility of parties that are before the court, the effect is to shift liability on the named de-fendants for the wrongful conduct of others. Such a result is contrary to the purpose of sev-eral liability and, effectively, retains a form of joint liability. As the authoritative treatise on tort law recognizes, “[T]he failure to consid-er the negligence of all tortfeasors, whether
Joint Liability: Eight states and D.C. retain full joint liability which allows a winning plaintiff to collect the entire judgment from any one of the defendants regardless of their degree of responsibility.3
• Half of those states, however, retain contributory negligence as a complete bar to recovery.• Several other states have generally adopted several liability, but provide broad exceptions in which joint liability continues
to apply.4
Fair Share Liability: 19 states have replaced joint liability with several (“fair share”) liability, under which each defendant is liable in proportion to its percentage of responsibility for the harm, or sharply limited joint liability to narrow situations.5
Threshold Approach: 17 states have abolished joint liability for defendants whose degree of fault falls below a specified threshold (e.g., no joint liability for defendants found to be less than 50% at fault), retaining joint liability only for defendants with a major share of the fault for the plaintiff’s harm.6
Economic/Noneconomic Distinction: Seven states limit joint liability for noneconomic damages, such as pain and suffering, while retaining joint liability for certain economic losses, such as medical expenses or lost wages.7
Combination: A few states combine these approaches.
STATE OF THE STATES
26 • Inside ALEC | March / April 2013
I N S I D E A L E C
parties or not, prejudices the joint defendants who are thus required to bear a greater propor-tion of the plaintiff’s loss than is attributable to their fault.”11
Nevertheless, this issue is subject to a great deal of litigation because some state laws re-fer to allocation of fault to “parties” or “defen-dants.” Some courts have narrowly interpreted these terms to limit allocation of fault to those who are named as a defendants in the litiga-tion.12 Some states, such as Illinois, do not even allow the jury to consider the responsibility of settling parties.13 In other states, judges inter-pret state law as permitting juries to allocate fault to nonparties.14 Several states have ad-opted statutes that explicitly permit the jury to allocate fault to nonparties. Some of these states provide a specific procedure for a defen-dant to provide notice to the plaintiff of its in-tention to allocate fault to a nonparty15 while others do not provide such detail.16 Finally, in some states, the law on allocation of fault to nonparties may be unclear.
THE COUNCIL’S NEW MODEL FAIR SHARE ACT
In January 2013, the Council adopted new mod-el policy addressing this issue, the Fair Share Act. The Council has long supported elimina-tion of joint liability and its “Joint and Several Liability Abolition Act,” approved in 1995, was influential In the states, but the model policy, like an old house, needed to be remodeled to fit the conditions of 2013. The new Fair Share Act retains the central feature of the earlier model act: each defendant is liable only for damages in direct proportion to that defendant’s respon-sibility. The Fair Share Act incorporates helpful
features of state laws enacted in recent years. It makes clear that juries may allocate fault to any person or entity that shared responsibility for the injury, regardless of whether it is named as a defendant.
The core of the Fair Share Act abolishes joint liability and adopts several liability. In allocat-ing responsibility, jurors (or the court in a bench trial) would consider the responsibility of each claimant, defendant, settling party, or nonparty designed by a defendant. A jury’s allocation of fault to a nonparty would not bind that person or entity to pay damages and may not be used in any subsequent legal proceeding. The jury allocates responsibility to nonparties only as a way of accurately determining the defendant’s liability.
While legislators may chose to adopt a threshold approach, or retain state law provid-ing such an approach, it is essential that legisla-tion explicitly recognize that juries may allocate fault to nonparties regardless of whether the person or entity was or could have been named as a party to the action. Without such a provi-sion, courts may interpret the law to shift liabili-ty onto named defendants for the responsibility of those who are not in court.
The Fair Share Act includes a specific proce-dure for designation of nonparties to which the jury may allocate responsibility. The model pol-icy recommends providing notice of an intent to allocate fault to a nonparty by filing a motion no later than 60 days prior to the date of trial or the close of discovery, whichever is closer to trial, to provide fairness to plaintiffs. A person or entity may be designated as a responsible nonparty regardless of whether the person was or could have been named as a party to the
action and irrespective of whether the non-party is insolvent, immune, or not subject to service of process in the jurisdiction.
States that provide for allocation of fault to nonparties currently vary on how and when such notice is to be given to the plaintiff. If court decisions in your state raise concerns as to whether the legislature may specify a par-ticular procedure for designating nonparties17, there are two alternatives: require only that the defendant provide notice of designation of a nonparty before trial in accordance with re-quirements established by court rule, which is the approach used in Arizona18, or do not pro-vide a procedure for designation of nonparties, as is the case in several other states.19
Through adoption of legislation based on the Fair Share Act, you can ensure that your state’s civil justice system follows the basic principle of fairness that liability is imposed in proportion to responsibility.
1 See Victor E. Schwartz, Comparative Negligence § 1.05[e][3], at 29 (5th ed. 2010).2 See, e.g., Restatement (Third) of Torts: Apportionment of Liability § 10 cmt. a (2000) (stating “it is difficult to make a compelling argument” for full joint liability).3 Jurisdictions retaining full joint liability include Alabama, Delaware, District of Columbia, Maine, Maryland, Massachusetts (limited to proportionate share of common liability), North
Carolina, Rhode Island, and Virginia.4 Connecticut, Hawaii, Nevada, New Mexico, Washington, and West Virginia are examples of states with statutes that include broad exceptions in which joint liability continues to apply.5 States that have largely replaced joint liability with several liability include Alaska, Arizona, Arkansas, Colorado, Florida, Georgia, Idaho, Indiana, Kansas, Kentucky, Louisiana, Michigan, Mis-
sissippi, North Dakota, Oklahoma, Tennessee, Utah, Vermont, and Wyoming.6 States that have adopted the “threshold approach” include Illinois (25%), Iowa (50%), Minnesota (50%), Missouri (51%), Montana (50%), Nevada (less than plaintiff’s fault), New Hampshire
(50%), New Jersey (60%), New York (50%), Ohio (50%), Oregon (equal or less than plaintiff or 25%), Pennsylvania (60%), South Carolina (50%), South Dakota (50%), Texas (50%), West Vir-ginia (30%), and Wisconsin (51%). Washington State applies joint liability only when the plaintiff bears no degree of fault and other limited situations.
7 States that have limited joint liability for noneconomic damages, but retained joint liability in some circumstances for economic damages, include California, Hawaii, Illinois, Iowa, Nebraska, New York, and Ohio.
8 S.B. 862 (2011) (codified at Okla. Stat. tit. 23, § 15.1).9 42 Pa. Cons. Stat. § 7102. The Pennsylvania law also continues to apply joint liability where there is an intentional misrepresentation, an intentional tort, for certain environmental claims,
and where there is a violation of the state’s dram shop law.10 The West Virginia law eliminates joint liability for defendants 30% or less at fault. If a claimant has not been paid after six months of the judgment, however, defendants 10% or more
responsible are subject to reallocation of uncollected amount. Defendants less than 10% at fault or whose fault is equal to or less than the claimant’s percentage of fault are not subject to reallocation. W. Va. Code Ann. § 55-7-23.
VICTOR E. SCHWARTz serves as
the private sector co-chair of the
Council’s Task Force on Civil Jus-
tice Task Force and as the chair
of Shook, Hardy & Bacon’s Public
Policy Group. He is also on the
Council’s Board of Scholars.
CARY SILVERMAN is an advisor
to the Task Force on Civil Justice
and Counsel with the Public
Policy Group at Shook, Hardy &
Bacon L.L.P. He presented the
Fair Share Act to the Task Force.

Inside ALEC | March / April 2013 • 27
iC I V I L J U S T I C E
The establishment of an Enterprise Fraud Program Office is a smart investment and likely to translate into cost savings, ultimately lowering overall spending for the state. In order to keep the Enterprise Fraud Pro-gram Office accountable, legislators should set regular reporting require-ments for the Office to relay progress and identify anticipated costs and savings to the legislature.
In 2010, states lost an estimated $67 billion to waste, fraud, and abuse across five major benefit programs.3 Taxpayers are footing the bill for criminal activity and government programs are becoming less effective. According to current SAS employee and former Michigan Senator and Council state chair, Wayne Kuipers, “Fraud and abuse are unnecessarily draining funds from state coffers and robbing benefits from our neediest citizens. States should be leveraging all of their data assets and deploy-ing the most innovative technologies available to stop these criminals in their tracks.”
Identifying how government agencies can cut instances of fraud, waste, abuse, and improper payments will increase government efficien-cy, transparency, and accountability. It is an important step toward limit-ing the size and scope of government spending and giving Americans the highest return on their taxpayer dollars.
For more information, please see the American Legislative Exchange Council model policy on detection and prevention of fraud, waste, abuse and improper payments in state government.
representative Jason saine (hd-97) is the
Council State Chairman for North Carolina. He
represents North Carolina House District 97.
1 Gruszecki, Debra. “Banking: 2 convicted in $250 million tax fraud scheme.” The Press-Enterprise. January 31, 2013.2 U.S. Department of Health and Human Services. “Medicare Fraud Strike Force Charges 111 Individuals for more than $225 million in False Billing and Expands Operations to Two Additional
Cities.” February 17, 2011. 3 SAS. “Fraud, Improper Payments and Non-Compliance.” Accessed February 20, 2013. Available at: http://www.sas.com/industry/government/state/fraud/index.html4 “Labor Department Reports on Unemployment Benefits Paid In Error.” Time & Pay - Payroll, Payroll Taxes, HR, ATA, Benefits. Time & Pay, 26 Sept. 2011.5 United States Treasury Inspector General for Tax Administration. 19 July 2012. 6 The Indiana Family and Social Services Administration. “Medicaid Program Integrity Commission on State Tax and Financing Policy.” October 2012.
Fraud, waste, abuse, and improper payments are a widespread and problem for the federal and state governments:
• According to the U.S. Department of Labor, the 2011 Unemployment Insurance Payment Error Rate was 11.2%, resulting in $5.7 billion of improper payments.4
• In the 2012 filing season, IRS estimated losses due to identity theft alone at $5 billion.5
• The Government Accountability Office (GAO) estimates that over $70 billion in improper payments are made each year in Medicaid and Medicare.6
Technology, continued from Page 17...
11 See W. Page Keeton et al., Prosser & Keeton on the Law of Torts 475-76 (5th ed. 1984) (emphasis added).12 See, e.g., Donner v. Kearse, 662 A.2d 1269 (Conn. 1995); Baker v. Webb, 833 S.W.2d 898 (Ky. Ct. App. 1994); Jensen v. ARA Servs., Inc., 736 S.W.2d 374 (Mo. 1987); Bencivenga v.
J.J.A.M.M., Inc., 609 A.2d 1299 (N.J. Super Ct., App. Div. 1992); Bowman v. Barnes, 282 S.E.2d 613 (W. Va. 1981); Connar v. West Shore Equip. of Milwaukee, Inc., 227 N.W.2d 660 (Wis. 1975); Board of County Commissioners v. Ridenour, 623 P.2d 1174 (Wyo. 1981).
13 See Ready v. United/Goedecke Services, Inc., 905 N.E.2d 725 (Ill. 2008).14 See, e.g., DaFonte v. Up-Right, Inc., 828 P.2d 140 (Cal. 1992); Idaho Dep’t of Labor v. Sunset Marts, Inc., 91 P.3d 1111 (Idaho 2004); Brown v. Keill, 580 P.2d 867 (1978); Hunter v. General
Motors Corp., 729 So.2d 1264 (Miss. 1999); Bode v. Clark Equip. Co., 719 P.2d 824 (Okla. 1986).15 See, e.g., Ariz. Rev. Stat. § 12-2506; Colo. Rev. Stat. § 13-21-111.5; Fla. Stat. Ann. § 768.81(3); Ga. Code Ann. § 51-12-33; Ind. Code Ann. § 34-51-2; Mich. Comp. Laws §§ 600.2957,
600.6304; Tex. Civ. Prac. & Rem. Code Ann. §§ 33.003, 33.004; Utah Code Ann. § 78-27-38(4)(a).16 See, e.g., La. Civ. Code art. 2323(A); N.M. Stat. Ann. § 41-3A-1(B); N.D. Cent. Code § 32-03.2-02.17 See Johnson v. Rockwell Automation, Inc., 308 S.W.3d 135 (Ark. 2009) (finding that requiring the filing of a pleading by a certain date violates the separation of powers by intruding on
court rules).18 Ariz. Rev. Stat. § 12-2506.19 Louisiana, New Mexico, and North Dakota are among states that explicitly provide for allocation of fault to nonparties but do not provide a specific procedure for doing so. This approach,
however, may also raise the potential for a constitutional challenge as the Montana Supreme Court, in invalidated a law authorizing allocation of fault to nonparties, found that the statute lacked “any kind of procedural safeguard” when compared to laws in other states and “imposed a burden upon plaintiffs to anticipate defendants’ attempts to apportion blame [to a nonparty] up to the time of submission of the verdict form to the jury.” Newville v. Department of Family Servs., 883 P.2d 793, 802 (Mont. 1994).

1101 Vermont Ave., NW, 11th FloorWashington, D.C. 20005www.alec.org


