Embed Size (px)
Citation preview

Input-Output Model for Pacific Coast Fisheries, 2013 Revisions and Extensions
Jerry Leonard
Northwest Fisheries Science Center Fishery Resource Analysis and Monitoring Division 2725 Montlake Boulevard East Seattle, Washington 98112
April 2013

ii
Acknowledgments
There are several individuals to thank for their contributions to this effort. We thank Scott Steinback, Northeast Fisheries Science Center, for advice in modeling economic effects of recreational fishing; Brad Stenberg, Pacific Fisheries Information Network (PacFIN), who supplied fish ticket landings data and consultations about PacFIN related data issues; Erin Steiner and Abigail Hartley for assistance with EDC data; and Carl Lian for assistance with the voluntary cost earnings survey data.

iii
Abbreviations and Acronyms
AKFIN Alaska Fisheries Information Network BEA Bureau of Economic Analysis CDFG California Department of Fish and Game EDC Economic Data Collection Program IMPLAN Impact Analysis for Planning (regional input-output software) IO input-output IO-PAC input-output model for Pacific Coast fisheries NAICS North American Industry Classification System NERIOM Northeast Region Commercial Fishing Input-Output Model NMFS National Marine Fisheries Service NWFSC Northwest Fisheries Science Center ODFW Oregon Department of Fish and Wildlife PSMFC Pacific States Marine Fisheries Commission PacFIN Pacific Fisheries Information Network WDFW Washington Department of Fish and Wildlife WDOR Washington Department of Revenue

4
1. Introduction
The NWFSC’s Input-Output model for Pacific Coast Fisheries (IO-PAC) is designed to estimate the changes in economic contributions and economic impacts resulting from policy, environmental, or other changes that affect fishery harvest. IO-PAC was built by customizing the Impact Analysis for Planning (IMPLAN) regional input-output software. The original methodology employed in developing this model was similar to that used in the Northeast Fisheries Science Center’s Northeast Region Commercial Fishing Input-Output Model (Steinback and Thunberg, 2006). The development and design of IO-PAC is documented in detail in Leonard and Watson (2011). This paper presents recent updates to IO-PAC. The updates presented are part of an ongoing effort to continually improve the IO-PAC model with the latest available data and improvements in regional impact modeling capabilities. The updates of IO-PAC include incorporating more recent available data, the addition of a recreational fishing component, the addition of separate catcher processor and mothership sectors, and revisions to the model construction.
As it stands currently, the model is not in its anticipated state for use in the 2015-2016 groundfish harvest specifications process. Several data sources that the model uses will be revised between the time of this writing and when the model is used in the groundfish harvest specifications process. Further discussion of the planned data updates is contained below, but in brief the planed updates include incorporating data collected through the Economic Data Collection program (EDC), the 2011 Marine Recreational Expenditure Survey, the 2009 and 2010 Limited Entry Fixed Gear Survey, the 2011 and 2012 Open Access Survey. Additionally, the planned updates will include 2012 Pacific Fisheries Information Network (PacFIN) fish ticket data. Nevertheless, at the time of this writing, IO-PAC makes use of the most recent data available, and the updates made since the first version of IO-PAC, provide insight into how these upcoming data sources will be incorporated into the model.
The data updates made to date include the following. One, the underlying Impact Analysis for Planning (IMPLAN) data is changed from the 2006 base year to 2010. Two, the fish-ticket (landings) data from Pacific Fisheries Information Network (PacFIN) is changed from 2006 to 2010. Three, the commercial vessel production functions incorporate the latest data from the voluntary Limited Entry and Open Access Surveys conducted by the Norwest Fisheries Science Center. Four, it incorporates data collected as part of the EDC program for first receivers and shorebased processors.
The addition of a recreational fishing component involves incorporating data collected on
marine recreational expenditures (Gentner and Steinback, 2006), charter vessel cost earnings data collected by the Pacific States Marine Fisheries Commission and Southwest Fisheries Science Center (Pacific States Marine Fisheries Commission, 2004) and the Northwest Fisheries Science Center in 2006.
5
The revisions to IO-PAC construction are done to reduce effort involved in making
changes to fishing sector production functions over time and simplify the process of building numerous port level models. 2010 IMPLAN data uses the Version 3 software update of IMPLAN. The original version of IO-PAC modified IMPLAN Version 2 software. Transitioning the unique fishing industry information in IO-PAC from IMPLAN Version 2 to Version 3, provides numerous initial obstacles, but ultimately enables a more efficient method to incorporate fishing sector production function changes and changing model study areas.
2. IMPLAN Data
IMPLAN collects, organizes, and econometrically estimates the data that is necessary to construct regional economic impact models. These data, collectively referred to as the region’s social accounts, consist of purchases of inputs, labor, and capital by the respective sectors of the economy, the production of each sector, household demands in the region, sources of income of households in the region, taxes paid and government spending in the region, and the region’s imports and exports. IMPLAN constructs county-level social accounts based on a variety of data sources including the U.S. Census Bureau, U.S. Bureau of Economic Analysis (BEA), and employment and wages covered by unemployment insurance data.
The current update to IO-PAC changes the underlying IMPAN data from 2006 to 2010. The IMPLAN data are used in IO-PAC to characterize the nonfishing economy of the regions such as the agricultural, manufacturing, trade, and service sectors, as well as the various institutions in the region such as households and governments. A major revision in the industry sectoring scheme was made in the 2008 IMPLAN data. In 2008 the IMPLAN data transitioned to 440 unique industry sectors from the 509 used in 2006. This change necessitated a new mapping of factor expenditures made by seafood harvesters and wholesalers into IMPLAN sectors. The new mapping scheme for the 440 IMPLAN sectors is presented in detail in Appendix A.
3. PacFIN Data
The current update changes the fish-ticket data utilized by IO-PAC from 2006 to 2010. PacFIN data include fish ticket and vessel registration information that is supplied by California Department of Fish and Game (CDFG), Oregon Department of Fish and Wildlife (ODFW), and Washington Department of Fish and Wildlife (WDFW). Each time a commercial fishing vessel lands fish along the West Coast, it is documented by a fish ticket. For all commercial landings sold to shoreside wholesale fish dealers or processors, the fish buyers are required to fill out a fish ticket that describes the species, weight, and total price paid for the fish purchased. If a
6
commercial fishing harvester sells directly to consumers, the harvester is responsible for recording the receipts, filling out fish tickets, and remitting the information to the appropriate state agency. These data, when aggregated into vessel classifications and commodity types, comprise the total revenue or industry output estimates that are included in the model. PacFIN also contains information on the vessel identification of the seller, gear type used to catch the fish, date of transaction, and port where the fish were landed. Vessel registration information supplied by the states includes some physical characteristics such as length and engine horsepower. For this project, PacFIN personnel supplied data on pounds landed and revenue received by species, gear type, and port in 2010. Table 1 provides of a summary of the data that is currently used in IO-PAC, and its application. For commercial fishing vessels, it indicates that the PacFIN data are used in generating vessel production functions, estimates of total industry output (revenue), and total vessel employment. For processors the data are used in generating processor industry output and processor employment1.
The IO-PAC update makes two changes in how the PacFIN data are used in the model. Previously, the length of the vessel, which is contained in PacFIN, was used in conjunction with moorage rates by length at a sample of ports along the West Coast to estimate average annual moorage expenditures by vessel classification. This approach to estimating moorage expenditures is no longer necessary due to changes in the NWFSC’s cost earnings surveys. The cost earnings surveys now directly query vessel owners about moorage expenditures. Additionally, PacFIN data is no longer used exclusively to assign vessels to the Radtke and Davis (2000) classification scheme. Because PacFIN contains fish-ticket data from only shoreside landings made on the West Coast, there are no landings data for Alaska fisheries vessels and at-sea vessels (motherships and catcher processors). In the last version of IO-PAC both of these vessel classifications were blank, so impacts could not be estimated for these sectors. In this update vessels are assigned to the Alaska category by using information derived from the Alaska Fisheries Information Network (AKFIN). For vessel IDs that appear in PacFIN, personnel from the Pacific States Marine Fishery Commission (PSMFC) provided data that indicates whether a vessel had landings in Alaska in 2008. Vessels with landings in Alaska were assigned to the Alaska fisheries vessel category.
While the PacFIN data currently included in IO-PAC is from 2010, the data will be updated to 2012 prior to the use of the model for the 2015-2016 groundfish harvest specifications process. The model’s usage for groundfish specifications is expected to occur around the end of 2013. Table 1 presents the timeframe of expected data changes. The table indicates that the PacFIN data is expected to change to 2012 in the third quarter of 2013.
1 For a detailed discussion of how the PacFIN data fulfills these roles, see Leonard and Watson (2010).

7
Table 1. IO-PAC data sources and applications
Open Access Survey
(2009, 2008)
Limited Entry Trawl Survey (2007, 2008)
Limited Entry Fixed Gear Survey
(2007, 2008)
Marine Rec. Exp. Survey
(2006)
WA and OR Charter Vessel Survey (2006)
West Coast Charter Vessel Survey (2000)
EDC DATA
(2010)
Data Year 2008 2008 2008 2006 2006 2000 2010
Expected Date Current Current Current Current Current Current Current
Application
Commercial Vessels
Production Functions X X X
Vessel Industry Output X X
Vessel Employment X X X
Processors
Production Functions X
Processor Industry Output X
Processor Employment X
Recreational Fishing
Expenditures X
Charter Prod. Functions X X
Charter Industry Output X X X
Charter Employment X X X
Non-Fishing Data

8
Table 1 (continued horizontally). IO-PAC data sources and applications
IMPLAN
PacFIN Fish
Ticket
Limited Entry Fixed Gear Survey
(2009, 2010)
Open Access Survey
(2011, 2012)
EDC Data
(2011)
PacFIN Fish
Ticket
Data Year 2010 2010 2010 2011 2011 2012
Expected Date Current Current 2013 Q3 2013 Q3 2013 Q3 2013 Q3
Application
Commercial Vessels
Production Functions X X X X X
Vessel Industry Output X X X X X X
Vessel Employment X X X X X
Processors
Production Functions X X
Processor Industry Output X X X X
Processor Employment X X X X
Recreational Fishing
Expenditures
Charter Prod. Functions
Charter Industry Output
Charter Employment
Non-Fishing Data X

4. Commercial Fisheries Economic Data
Cost earnings surveys provide the data necessary to construct the commercial fishing vessel and processor production functions. Since the last version of IO-PAC, the EDC program has been established as a data source for IO-PAC. Previously, the model relied solely on the voluntary limited entry trawl, limited entry fixed gear, and open access surveys for commercial fishery cost data. Currently, the commercial vessel production functions still rely exclusively on the most recent voluntary survey data. Following the schedule in Table 1, a transition will be made to the EDC data for limited-entry trawl, catcher processors, motherships and shorebased processors. For shorebased processors, processors, preliminary data from the EDC survey is already incorporated into IO-PAC.
4.1. Voluntary Cost-Earnings Surveys
The vessel production functions are currently using data from the most recent voluntary
limited entry trawl survey, limited entry fixed gear survey, and open access survey. Since the first version of IO-PAC was completed, all three surveys have been reprised. The updated results have been incorporated into IO-PAC. Because of the expanded scope and increased detail of the more recent surveys, incorporating the data has the added benefit of likely increasing the accuracy of IO-PAC, especially for vessel classifications that were previously not covered or partially covered. The expanded scope is the result of a changed target population of the open access survey. The increased detail is the result of an increased number of cost categories for all the voluntary surveys. These additional cost categories permit improved specification of the production functions. Previous costs categories used in the model included fuel and oil; food and crew provisions; ice; bait; repairs, maintenance, and improvements; insurance; permit leases; permit purchases; interest and financial services; crew expense; and captain expense. The new additional cost categories include moorage, enforcement, dues, offloading, and trucking. Responses to the surveys can be easily matched to vessel landings by species, gear type, physical characteristics, and permit information contained in PacFIN. A short description of the surveys follows2.
The survey population for the limited entry trawl survey consisted of all vessels with a limited entry trawl permit and at least $1,000 in landings in 2008. The survey collected information for 2007 and 2008 through in-person interviews. There were 73 completed responses out of a total of 127 vessels for a response rate of 57%. Using a modified version of the vessel classification scheme suggested by Radtke and Davis (2000), shown in Table 3, the
2 For a more detailed description of the survey programs and summary statistics used in constructing the production functions, see the forthcoming NOAA Technical Memoranda by Lian.

2
principle classification of respondents was large groundfish trawler, and other vessel classifications covered were Alaska, whiting, crabber and shrimper.
The survey population for the limited entry fixed gear survey consisted of all vessels with a limited entry fixed gear permit and at least $1,000 in landings in 2008. This survey also collected information for 2007 and 2008, and used in-person interviews. There were 57 completed responses out of a total of 125 vessels for a response rate of 46%. The principle classification of respondents was sablefish (Anoplopoma fimbria) fixed gear, and other vessel classifications covered were Alaska, crabber, other groundfish fixed gear, and other < $15,000.
The survey population for the open access survey consisted of all commercial fishing vessels that: 1) landed at least $1,000 of salmon, groundfish, crab or shrimp at West Coast ports during 2008, 2) had at least one trip on which groundfish, salmon, crab or shrimp accounted for a majority of revenue from landings, and 3) did not hold a limited entry permit. Survey data was collected via in-person interviews and mail questionnaires. The population of targeted vessels for the most recent survey was expanded considerably from the 2005 and 2006 version because of the addition of crab and shrimp to the first two requirements. There were 1,712 vessels that met the above three requirements. There were 1,098 vessels for which a telephone and address was obtainable. There were 437 completed responses for a response rate of 39.8% among those vessels where contact information was available. Responses came from vessels classified as Alaska, crabber, sablefish fixed gear, other groundfish, salmon troller, salmon netter, shrimper, and other less than $15,000.
4.2. Mandatory EDC Surveys
In January 2011, the West Coast groundfish trawl fishery transitioned to a new, management approach known as a Catch Share Program. The Catch Share Program consists of an individual fishing quota (IFQ) program for the shorebased trawl fleet and cooperative programs for the at-sea mothership and catcher/processor trawl fleets. The economic benefits of the West Coast groundfish trawl fishery and their distribution will likely change under trawl rationalization. To monitor these changes, the rationalization program includes a mandatory economic data collection program. Using data collected from industry members, the EDC program monitors whether the goals of the Catch Share Program have been met. The EDC program will also help meet the requirements of the Magnuson-Stevens Act for catch share evaluation. The regulations detailing the Economic Data Collection program are available in 50CFR 660.114.
The EDC program collects vessel/plant characteristics, capitalized investments, annual expenses, annual earnings, crew/labor payments, and quota and permit expenses from the following types of businesses.
Limited Entry Trawl Catcher Vessels - All owners, lessees, and charterers of a catcher vessel registered to a limited entry trawl endorsed permit.

3
Motherships - All owners, lessees, and charterers of a mothership vessel registered to a mothership permit.
Catcher/Processors - All owners, lessees, and charterers of a catcher processor vessel registered to a catcher/processor-endorsed limited entry trawl permit.
First Receivers/Shorebased Processors - All owners and lessees of a shorebased processor that received round or headed-and-gutted IFQ species groundfish or whiting from a first receiver, and all owners of a first receiver site license in 2011 and beyond.
The inclusion of data collected through the EDC program in IO-PAC is currently underway. When fully implemented following the schedule in Table 1 the EDC data will be used for several purposes in IO-PAC. For the shoreside trawl catcher vessel fleet, the EDC data will replace the voluntary trawl survey data currently in use. Additionally, it will provide the first cost earnings data to permit the inclusion of the at-sea fleet (motherships and catcher processors) in the model. Lastly, it will provide the data necessary to replace the default IMPLAN approach to generating shorebased processing employment, industry output (revenue), and production function used in the previous version IO-PAC. The last of these purposes, is currently operational in IO-PAC. The default IMPLAN processor approach used in the previous version of IO-PAC had notable disadvantages, particularly that all species contained in IO-PAC were limited to the same markup to develop processor impacts. Consequently, improving the processor specification in IO-PAC was given priority.
5. The IO-PAC Model
Several aspects of the IO-PAC model are modified in the revision. To the existing vessel classification scheme in IO-PAC, the revision adds vessel sectors for motherships, catcher processors, and charter recreational fishing vessels. The underlying product flow assumptions are changed. The commercial vessel production functions are changed through the inclusion of more recent cost earnings data. Processor sector production functions and estimates of appropriate processor markups for different species are altered through the use of EDC data. Lastly, a recreational module is added to enable impact and contribution estimates of recreational fishing.
5.1. Industry/Commodity Scheme
The revised industry classification scheme modifies the Radtke and Davis (2000) vessel classification scheme by separating motherships and catcher processors and adding a sector for recreational charter vessels. In the Radtke and Davis (2000) sector scheme motherships and catcher processors are grouped together. In the revision they are separated into two industry

4
classifications. The addition of a sector for recreational charter vessels is discussed in detail in Section 5.5 below. The IO-PAC codes for the industry sectors included in the model are displayed in Table 2. The classification rules for the commercial fleet are presented in Table 3. The classification scheme is hierarchical. Working from the top down, the rule description of the category that is met, is the classification for a vessel.
Table 2. Industry categories and associated IMPLAN codes.
IO-PAC Code Category description 509 Catcher processor 510 Mothership 511 Alaska fisheries vessel 512 Pacific whiting trawler 513 Large groundfish trawler 514 Small groundfish trawler 515 Sablefish fixed gear 516 Other groundfish fixed gear 517 Pelagic netter 518 Migratory netter 519 Migratory liner 520 Shrimper 521 Crabber 522 Salmon troller 523 Salmon netter 524 Other netter 525 Lobster vessel 526 Diver vessel 527 Other, more than $15,000 528 Other, less than $15,000 561 Bait ship 563 Wholesale seafood dealers 570 Recreational charter

5
Table 3. Vessel sectors used in the IO-PAC. Modified from Radtke and Davis (2000).
Order Vessel sector Rule description 1 Catcher processor Vessel registered to a catcher processor permit. 2 Mothership Vessel registered to a mothership permit. 3 Alaska fisheries vessel Alaska revenue is > 50% of vessel’s total revenue. 4 Pacific whiting offshore
and onshore trawler Pacific whiting (Merluccius productus) PacFIN revenue plus U.S. West Coast offshore revenue is > 33% of vessel total revenue and total revenue is > $100,000.
5 Large groundfish trawler
Groundfish (including sablefish, halibut, and California halibut [Paralichthys californicus]) revenue from other than fixed gear is > 33% of vessel total revenue and total revenue is > $100,000.
6 Small groundfish trawler
Groundfish (including sablefish, halibut, and California halibut) revenue from other than fixed gear is > 33% of vessel total revenue and total revenue is > $15,000.
7 Sablefish fixed gear Sablefish revenue from fixed gear is > 33% of vessel total revenue and total revenue is > $15,000.
8 Other groundfish fixed gear
Groundfish (including halibut and California halibut), other than sablefish, revenue from fixed gear is > 33% of vessel total revenue and total revenue is > $15,000.
9 Pelagic netter Pelagic species revenue is > 33% of vessel total revenue and total revenue is > than $15,000.
10 Migratory netter Highly migratory species revenue from gear other than troll or line gear is > 33% of vessel total revenue and total revenue is > $15,000.
11 Migratory liner Highly migratory species revenue from troll or line gear is > 33% of vessel total revenue and total revenue is > $15,000.
12 Shrimper Shrimp revenue is > 33% of vessel total revenue and total revenue is > $15,000.
13 Crabber Crab revenue is > 33% of vessel total revenue and total revenue is > $15,000.
14 Salmon troller Salmon revenue from troll gear is > 33% of vessel total revenue and total revenue is > $5,000.
15 Salmon netter Salmon revenue from gill or purse seine gear is > 33% of vessel total revenue and total revenue is > $5,000.
16 Other netter Other species revenue from net gear is > 33% of vessel total revenue and total revenue is > $15,000.
17 Lobster vessel Lobster revenue is > 33% of vessel total revenue and total revenue is > $15,000.
18 Diver vessel Revenue from sea urchins, geoduck (Panopea abrupta), or other species by diver gear is > 33% of vessel total revenue and total revenue is > $5,000.
19 Other > $15,000 All other vessels not above with total revenue > $15,000. 20 Other ≤ $15,000 All other vessels not above with total revenue ≤ $15,000.
6
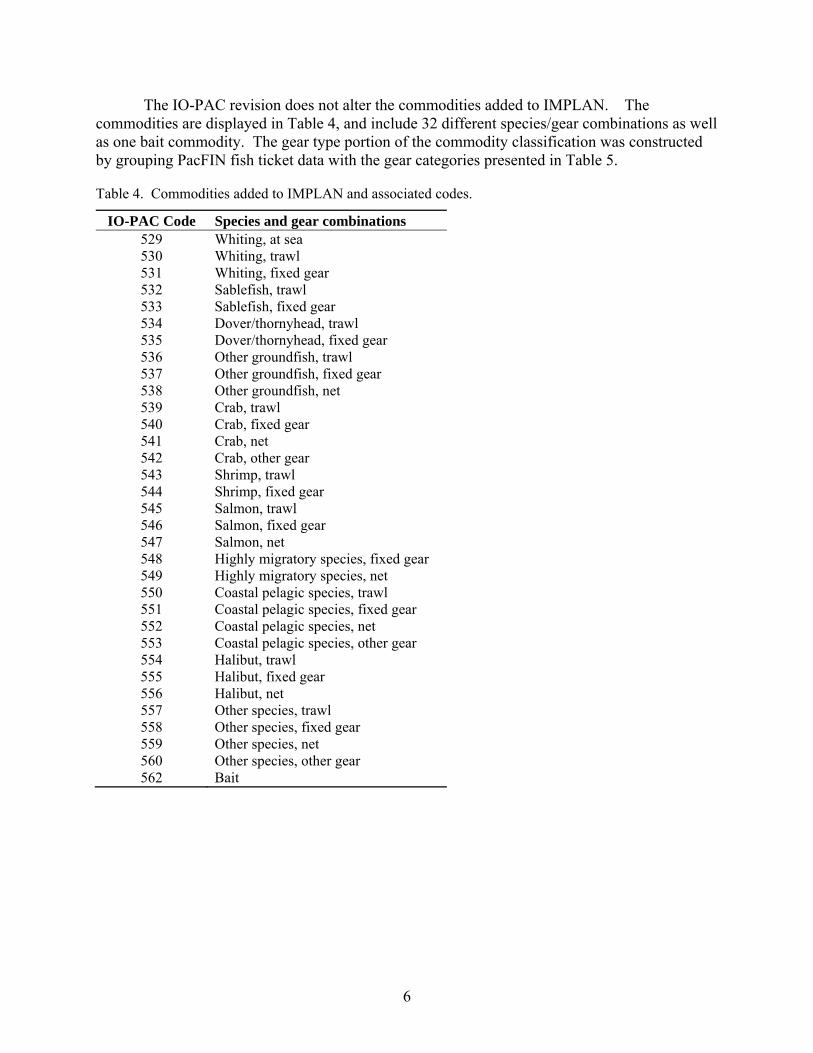
The IO-PAC revision does not alter the commodities added to IMPLAN. The commodities are displayed in Table 4, and include 32 different species/gear combinations as well as one bait commodity. The gear type portion of the commodity classification was constructed by grouping PacFIN fish ticket data with the gear categories presented in Table 5.
Table 4. Commodities added to IMPLAN and associated codes.
IO-PAC Code Species and gear combinations 529 Whiting, at sea 530 Whiting, trawl 531 Whiting, fixed gear 532 Sablefish, trawl 533 Sablefish, fixed gear 534 Dover/thornyhead, trawl 535 Dover/thornyhead, fixed gear 536 Other groundfish, trawl 537 Other groundfish, fixed gear 538 Other groundfish, net 539 Crab, trawl 540 Crab, fixed gear 541 Crab, net 542 Crab, other gear 543 Shrimp, trawl 544 Shrimp, fixed gear 545 Salmon, trawl 546 Salmon, fixed gear 547 Salmon, net 548 Highly migratory species, fixed gear 549 Highly migratory species, net 550 Coastal pelagic species, trawl 551 Coastal pelagic species, fixed gear 552 Coastal pelagic species, net 553 Coastal pelagic species, other gear 554 Halibut, trawl 555 Halibut, fixed gear 556 Halibut, net 557 Other species, trawl 558 Other species, fixed gear 559 Other species, net 560 Other species, other gear 562 Bait

7
Table 5. Gear groupings and associated PacFIN variables.
IO-PAC Gear ID Description Trawl TWL Trawls except shrimp trawls Trawl TWS Shrimp trawls Fixed gear NTW Nontrawl gear Fixed gear HKL Hook and line gear except troll Fixed gear TLS Troll gear Fixed gear POT Pot and trap gear Net NET Net gear except trawl Other gear MSC Other miscellaneous gear Other gear DRG Dredge gear
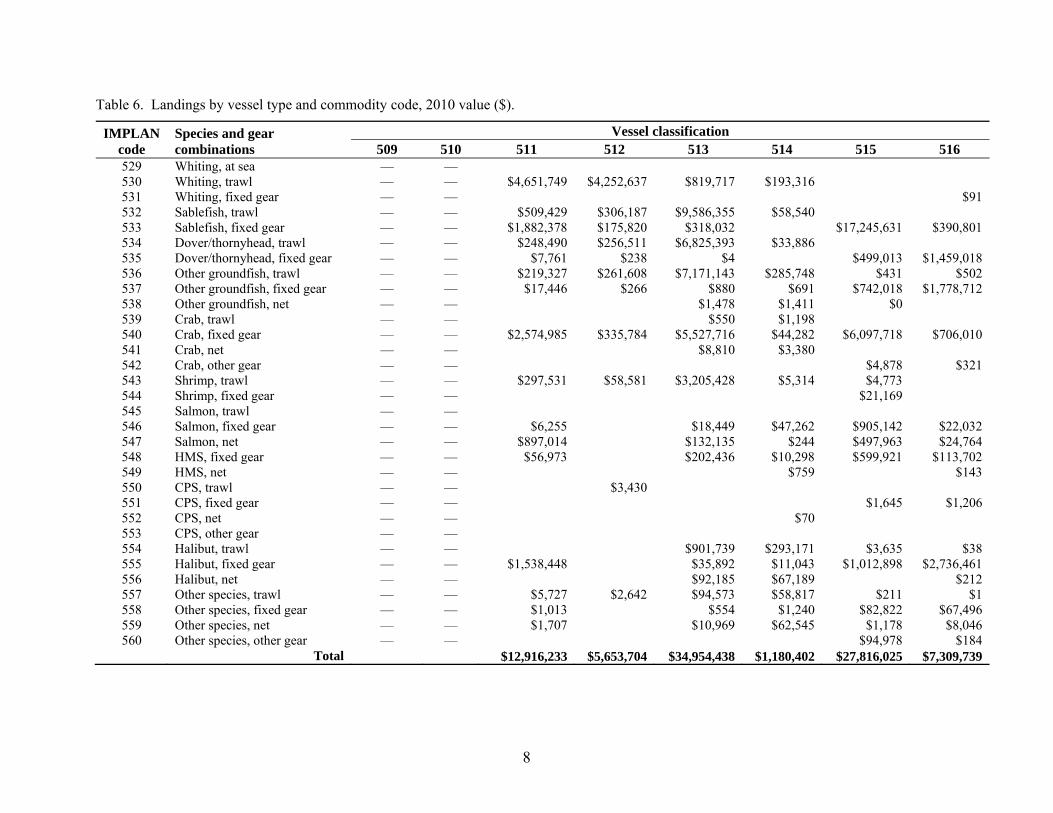
The total landings by vessel type and species/gear combinations are displayed in Table 6. Landings are classified in the species/gear classifications even if species for particular gear types are considered bycatch.
8
Table 6. Landings by vessel type and commodity code, 2010 value ($).
IMPLAN code
Species and gear combinations
Vessel classification 509 510 511 512 513 514 515 516
529 Whiting, at sea — — 530 Whiting, trawl — — $4,651,749 $4,252,637 $819,717 $193,316 531 Whiting, fixed gear — — $91 532 Sablefish, trawl — — $509,429 $306,187 $9,586,355 $58,540 533 Sablefish, fixed gear — — $1,882,378 $175,820 $318,032 $17,245,631 $390,801 534 Dover/thornyhead, trawl — — $248,490 $256,511 $6,825,393 $33,886 535 Dover/thornyhead, fixed gear — — $7,761 $238 $4 $499,013 $1,459,018 536 Other groundfish, trawl — — $219,327 $261,608 $7,171,143 $285,748 $431 $502 537 Other groundfish, fixed gear — — $17,446 $266 $880 $691 $742,018 $1,778,712 538 Other groundfish, net — — $1,478 $1,411 $0 539 Crab, trawl — — $550 $1,198 540 Crab, fixed gear — — $2,574,985 $335,784 $5,527,716 $44,282 $6,097,718 $706,010 541 Crab, net — — $8,810 $3,380 542 Crab, other gear — — $4,878 $321 543 Shrimp, trawl — — $297,531 $58,581 $3,205,428 $5,314 $4,773 544 Shrimp, fixed gear — — $21,169 545 Salmon, trawl — — 546 Salmon, fixed gear — — $6,255 $18,449 $47,262 $905,142 $22,032 547 Salmon, net — — $897,014 $132,135 $244 $497,963 $24,764 548 HMS, fixed gear — — $56,973 $202,436 $10,298 $599,921 $113,702 549 HMS, net — — $759 $143 550 CPS, trawl — — $3,430 551 CPS, fixed gear — — $1,645 $1,206 552 CPS, net — — $70 553 CPS, other gear — — 554 Halibut, trawl — — $901,739 $293,171 $3,635 $38 555 Halibut, fixed gear — — $1,538,448 $35,892 $11,043 $1,012,898 $2,736,461 556 Halibut, net — — $92,185 $67,189 $212 557 Other species, trawl — — $5,727 $2,642 $94,573 $58,817 $211 $1 558 Other species, fixed gear — — $1,013 $554 $1,240 $82,822 $67,496 559 Other species, net — — $1,707 $10,969 $62,545 $1,178 $8,046 560 Other species, other gear — — $94,978 $184
Total $12,916,233 $5,653,704 $34,954,438 $1,180,402 $27,816,025 $7,309,739

9
Table 6 continued horizontally. Landings by vessel type and commodity code, 2010 value ($).
IMPLAN code
Species and gear combinations
Vessel classification 517 518 519 520 521 522 523
529 Whiting, at sea 530 Whiting, trawl $6,674 531 Whiting, fixed gear 532 Sablefish, trawl $93,967 $49,187 533 Sablefish, fixed gear $145 $120,968 $71,041 $4,052,348 $75,375 $61,822 534 Dover/thornyhead, trawl $140,366 $12,630 535 Dover/thornyhead, fixed gear $109 $3 $3,214 $424 $538 536 Other groundfish, trawl $68,998 $239,975 537 Other groundfish, fixed gear $45 $12,611 $15,547 $165,632 $39,826 $1,881 538 Other groundfish, net $660 $14 $738 $76 539 Crab, trawl $995 540 Crab, fixed gear $562,560 $5,504,969 $5,708,325 $102,250,685 $49,369 $914,489 541 Crab, net $185 $52 542 Crab, other gear $53,646 $4,557 543 Shrimp, trawl $50,232 $11,810,093 $345,734 $434 544 Shrimp, fixed gear $4,222,313 $1,245,050 $170,607 545 Salmon, trawl 546 Salmon, fixed gear $932,428 $46 $2,447,369 $3,647,338 $182,066 547 Salmon, net $1,569,625 $1,860 $59,222 $6,035,306 $108,360 $29,065,941 548 HMS, fixed gear $54,673 $626 $23,936,734 $71,357 $4,099,394 $237,555 549 HMS, net $209 $5,040 $55,430 $5,853 550 CPS, trawl $35 $27 551 CPS, fixed gear $13 552 CPS, net $13,440,855 $55,673 $39,749 553 CPS, other gear 554 Halibut, trawl $36,803 $73,203 555 Halibut, fixed gear $392 $57,981 $64,248 $1,100,042 $146,846 $161,830 556 Halibut, net $8,303 $29,675 $383 557 Other species, trawl $13,293 $108,068 $4,148 558 Other species, fixed gear $39,196 $3,929 $1,611,343 $877,854 $820,951 $394 $20 559 Other species, net $71,143,799 $328,537 $191,171 $88,306 $185,773 $370,701 560 Other species, other gear $298,467 $65,830 $892
Total $86,833,939 $666,325 $32,541,679 $23,445,453 $123,246,673 $4,310,045 $30,970,157

10
Table 6 continued horizontally. Landings by vessel type and commodity code, 2010 value ($).
IMPLAN code
Species and gear combinations
Vessel classification 524 525 526 527 528 Total all classifications
529 Whiting, at sea $0 530 Whiting, trawl $11,016 $9,935,110 531 Whiting, fixed gear $7 $13 $111 532 Sablefish, trawl $2,060 $13,899 $10,619,625 533 Sablefish, fixed gear $158,147 $65,808 $33,905 $431,702 $25,083,923 534 Dover/thornyhead, trawl $52 $3,454 $7,520,781 535 Dover/thornyhead, fixed gear $6,068 $1,048 $2,039 $4,939 $1,984,416 536 Other groundfish, trawl $7,359 $15,967 $8,271,059 537 Other groundfish, fixed gear $59,206 $9,714 $7,877 $712,117 $3,564,469 538 Other groundfish, net $3,636 $71 $1,152 $9,235 539 Crab, trawl $1,612 $4,355 540 Crab, fixed gear $149,770 $438,579 $54,056 $253,599 $1,514,385 $132,687,282 541 Crab, net $5,715 $188 $1,169 $19,497 542 Crab, other gear $1,425 $40,616 $49,634 $155,077 543 Shrimp, trawl $837 $101,290 $5,579 $15,885,826 544 Shrimp, fixed gear $13,366 $60 $42 $6,480 $172,460 $5,851,547 545 Salmon, trawl $0 546 Salmon, fixed gear $72,491 $414,247 $8,695,124 547 Salmon, net $58,444 $489,636 $1,916,609 $40,857,123 548 HMS, fixed gear $645 $1,936 $252 $70,200 $322,656 $29,779,359 549 HMS, net $7,675 $75,109 550 CPS, trawl $3,491 551 CPS, fixed gear $17 $10,178 $168 $13,227 552 CPS, net $696 $34,432 $50,827 $13,622,302 553 CPS, other gear $1 $1 554 Halibut, trawl $15,391 $29,164 $23,300 $1,376,443 555 Halibut, fixed gear $35,767 $173,358 $30,887 $44,708 $435,256 $7,586,057 556 Halibut, net $168,020 $4,807 $24,870 $395,643 557 Other species, trawl $203 $12,616 $263,883 $4,511 $568,692 558 Other species, fixed gear $306,862 $9,897,530 $7,466 $2,440,575 $450,556 $16,609,802 559 Other species, net $3,370,252 $74,503 $42 $142,203 $232,412 $76,212,145 560 Other species, other gear $77,842 $7,919,127 $108,510,837 $429,818 $117,397,975
Total $4,137,277 $10,926,681 $8,104,596 $112,546,073 $7,225,366 $534,784,804

11
5.2. Commercial Catcher-Vessel Production Functions
The vessel production functions in IO-PAC rely on the 2008 data from the voluntary limited entry trawl, fixed gear, and open access surveys. Table 7 presents the vessel production functions included in IO-PAC. Because these voluntary surveys do not extend to the at-sea fishery, the mothership and catcher processor production functions are left blank at this time. The expenditure categories shown in Table 7 must be mapped into IMPLAN commodity codes for inclusion in the model. The mapping of the expenditure categories into IMPLAN commodity codes is presented in detail in Appendix A. While the expenditure categories have changed little in the IO-PAC update, the mapping to IMPLAN commodity codes has changed considerably due to the shift in the IMPLAN industry classification scheme from 509 unique sectors to 440.
5.3. Motherships and Catcher Processor Production Functions
The EDC is currently collecting data applicable to the at-sea fleet: motherships and catcher processors. Cost earnings surveys necessary to create production functions for these vessels were previously unavailable. These production functions will be assigned the EDC data following the schedule in Table 1.

12
Table 7. Percentage distribution of commercial fishing production functions by expenditure categories.
Expenditure categories (table continued horizontally below)
Catcher processor
Mother-ship Alaska
Pacific whiting trawler
Large groundfish
trawler
Small groundfish
trawler
Sablefish fixed gear
Other groundfish fixed gear
Migratory liner
Pelagic netter
Captain — — 13.4 12.3 17.5 17.5 21.6 18.3 16.6 16.6 Crew — — 19.6 17.8 21.6 21.6 23.7 21.5 18.1 18.1 Fuel, lubricants — — 13.2 12.8 16.8 16.8 7.4 7.5 8.3 8.3 Food, crew provisions — — 1.4 1.6 1.5 1.5 2.0 1.9 1.2 1.2 Ice — — 0.1 0.8 1.4 1.4 1.2 1.1 0.7 0.7 Bait — — 0.8 1.0 0.8 0.8 4.4 4.3 2.8 2.8 Repair and maintenance: vessel, gear, equipment
— — 8.7 11.3 14.3 14.3 10.7 12.4 10.4 10.4
Insurance — — 3.2 5.4 4.6 4.6 2.8 5.9 3.6 3.6 Interest and financial services — — 0.4 1.7 1.1 1.1 2.1 1.8 1.1 1.1 Purchases of permits — — 1.7 0.1 0.5 0.5 0.5 2.6 0.9 0.9 Leasing of permits — — 0.6 0.0 0.5 0.5 2.1 0.2 0.5 0.5 Moorage — — 0.8 0.7 0.7 0.7 2.4 1.6 1.2 1.2 Landings taxes — — 0.7 4.3 4.4 4.4 0.1 0.0 1.1 1.1 Enforcement — — 0.5 1.1 0.4 0.4 1.1 0.7 0.4 0.4 Dues — — 0.1 0.3 0.9 0.9 0.3 0.0 0.3 0.3 Freight Supplies — — 0.0 0.0 0.0 0.0 0.0 0.6 0.1 0.1 Offloading — — 0.0 0.0 0.0 0.0 0.0 1.0 0.2 0.2 Trucking — — 0.0 0.0 0.0 0.0 0.0 1.1 0.2 0.2 Other miscellaneous — — 1.1 1.1 2.8 2.8 2.4 6.7 4.7 4.7 Proprietary income — — 33.6 27.7 10.2 10.2 15.0 10.8 27.5 27.5
Total (%) 100.0 100.0 100.0 100.0 100.0 100.0 100.0 100.0

13
Table 7 continued horizontally. Percentage distribution of commercial fishing production functions by expenditure categories
Expenditure categories (column list repeated from above)
Migratory netter Shrimper Crabber
Salmon troller
Salmon netter
Other netter Lobster Diver
Other >15,000
Other <15,000
Captain 16.6 20.8 21.4 7.5 19.0 16.6 16.6 16.6 16.6 17.9 Crew 18.1 17.7 21.6 17.2 8.2 18.1 18.1 18.1 18.1 13.3 Fuel, lubricants 8.3 2.3 6.9 9.9 1.4 8.3 8.3 8.3 8.3 17.6 Food, crew provisions 1.2 13.4 1.1 3.0 4.3 1.2 1.2 1.2 1.2 3.6 Ice 0.7 1.2 0.4 0.3 0.0 0.7 0.7 0.7 0.7 1.0 Bait 2.8 2.2 4.4 0.2 0.0 2.8 2.8 2.8 2.8 2.7 Repair and maintenance: vessel, gear, and equipment 10.4 7.5 11.3 15.6 17.7 10.4 10.4 10.4 10.4 27.0 Insurance 3.6 4.4 4.2 5.0 2.2 3.6 3.6 3.6 3.6 4.7 Interest and financial services 1.1 0.0 1.0 3.1 0.0 1.1 1.1 1.1 1.1 0.6 Purchases of permits 0.9 0.0 1.2 3.2 0.2 0.9 0.9 0.9 0.9 5.9 Leasing of permits 0.5 0.0 0.4 0.3 0.3 0.5 0.5 0.5 0.5 0.3 Moorage 1.2 3.0 1.2 3.2 0.8 1.2 1.2 1.2 1.2 8.4 Landings taxes 1.1 1.2 0.1 0.0 1.0 1.1 1.1 1.1 1.1 0.0 Enforcement 0.4 0.3 0.1 0.3 0.0 0.4 0.4 0.4 0.4 0.7 Dues 0.3 0.2 0.2 0.8 0.5 0.3 0.3 0.3 0.3 0.8 Freight Supplies 0.1 0.4 0.1 0.0 0.0 0.1 0.1 0.1 0.1 0.0 Offloading 0.2 0.5 0.4 0.0 0.5 0.2 0.2 0.2 0.2 0.1 Trucking 0.2 0.0 0.2 0.6 1.7 0.2 0.2 0.2 0.2 1.1 Other miscellaneous 4.7 0.4 8.2 10.7 3.3 4.7 4.7 4.7 4.7 6.5 Proprietary income 27.5 24.4 15.6 19.1 38.9 27.5 27.5 27.5 27.5 -12.1
Total (%) 100.0 100.0 100.0 100.0 100.0 100.0 .100.0 100.0 100.0 100.0 *Percentages not shown due to confidentiality restrictions

14
5.4. Shoreside processor production functions and mark-ups
For shoreside processors located on the West Coast, the EDC data permits the building of a production function and mark-up by species. The Benchmark Input-Output data produced by the Bureau of Economic Analysis (BEA) contains a production function for seafood processors, which is used in IMPLAN for the default seafood processing sector. This production function is not specific to processors on the West Coast, so to the extent that processors on the West Coast differ from seafood processors nationally, the use of the Benchmark Input-Output production function will be a source of error. In the last version of IO-PAC, shoreside processor sales of seafood were made by using the markup margin information imbedded in the IMPLAN default seafood processing production function. Additionally, the output per-employee information in the default production function was used to make employment estimates. This previous approach has a couple of notable disadvantages. First, it is derived from data on all U.S. processors. The national data is heavily influenced by the processing activity that occurs in Alaska, where the production costs for fish and output per employee are likely different than shoreside seafood processors on the West Coast. To the extent that West Coast shoreside processors deviate from the processors nationally, there will be errors in both income and employment impact estimates. Second, the markup margin in the default approach is not species specific. While this approach will approximate the markup received by processors for all species on average, it lacks species specific detail. Based on the EDC data, markups differ substantially among different species.
The EDC data permits the specification of a production function specific to processors on the West Coast, and perhaps more importantly, it provides information on species specific mark-up for different fish species. IO-PAC uses data collected through the EDC to represent all shoreside processors on the West Coast. Using the EDC data in this application is a potential source of error, because not all processors of on the West Coast are required to complete a survey. An EDC survey is required of all owners and lessees of a shorebased processor that received round or headed-and-gutted IFQ species groundfish or whiting from a first receiver, and all owners of a first receiver site license in 2011 and beyond.3 Processors that do not receive fish fitting this description are not included in the EDC program. Thus, no cost data is available for them. Because the lack of available data, we assume that all West Coast shoreside processors are represented by those who complete an EDC survey.
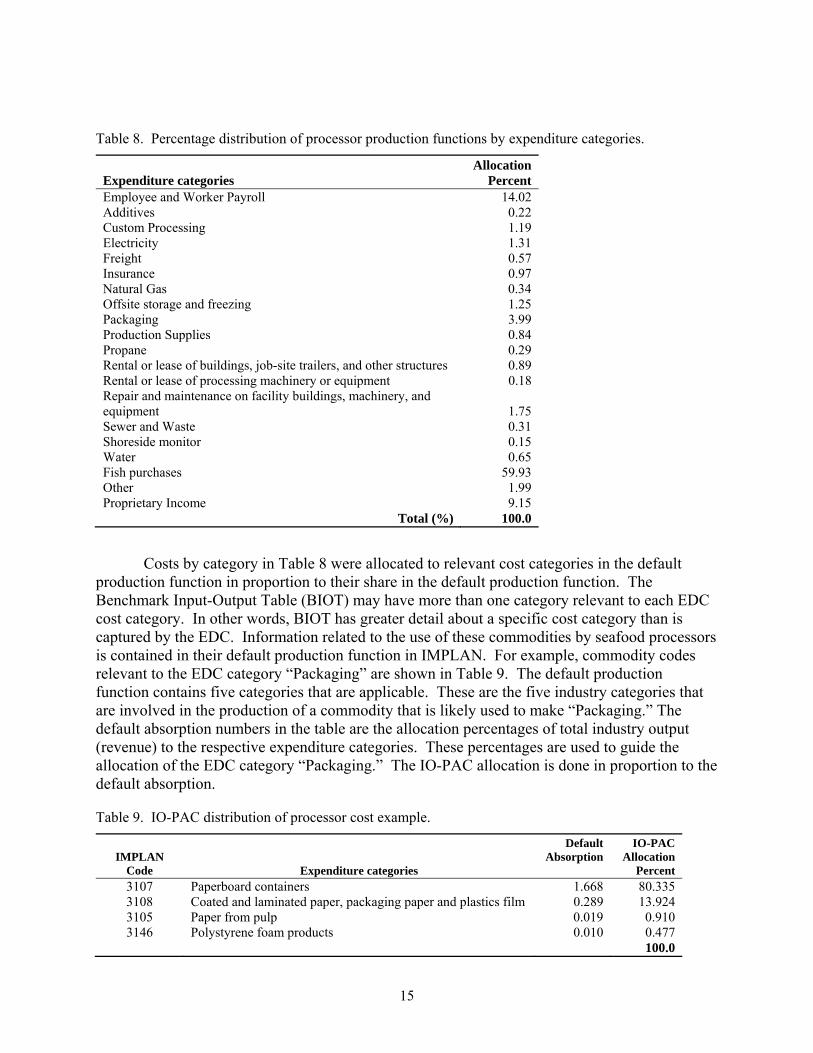
The processor production function was generated through dividing each of the expenditures displayed in Table 8 by total revenue. The production function is built using 2010 data. The mapping of the cost categories into the appropriate IMPLAN sectors is detailed in Appendix A. The default production function in IMPLAN, which is based on the BEA’s input-output table, is useful in mapping expenditure categories covered in the EDC to the appropriate commodity codes.
3 For a complete definition see 50 CFR 660.114. Under NAICS some of these entities may be classified as fish and seafood merchant wholesalers, frozen specialty food manufacturing, or something else. For the purposes of IO-PAC they are considered processors.
15
Table 8. Percentage distribution of processor production functions by expenditure categories.
Expenditure categories Allocation
Percent Employee and Worker Payroll 14.02 Additives 0.22 Custom Processing 1.19 Electricity 1.31 Freight 0.57 Insurance 0.97 Natural Gas 0.34 Offsite storage and freezing 1.25 Packaging 3.99 Production Supplies 0.84 Propane 0.29 Rental or lease of buildings, job-site trailers, and other structures 0.89 Rental or lease of processing machinery or equipment 0.18 Repair and maintenance on facility buildings, machinery, and equipment 1.75 Sewer and Waste 0.31 Shoreside monitor 0.15 Water 0.65 Fish purchases 59.93 Other 1.99 Proprietary Income 9.15
Total (%) 100.0
Costs by category in Table 8 were allocated to relevant cost categories in the default production function in proportion to their share in the default production function. The Benchmark Input-Output Table (BIOT) may have more than one category relevant to each EDC cost category. In other words, BIOT has greater detail about a specific cost category than is captured by the EDC. Information related to the use of these commodities by seafood processors is contained in their default production function in IMPLAN. For example, commodity codes relevant to the EDC category “Packaging” are shown in Table 9. The default production function contains five categories that are applicable. These are the five industry categories that are involved in the production of a commodity that is likely used to make “Packaging.” The default absorption numbers in the table are the allocation percentages of total industry output (revenue) to the respective expenditure categories. These percentages are used to guide the allocation of the EDC category “Packaging.” The IO-PAC allocation is done in proportion to the default absorption.
Table 9. IO-PAC distribution of processor cost example.
IMPLAN Code Expenditure categories
Default Absorption
IO-PAC Allocation
Percent 3107 Paperboard containers 1.668 80.335 3108 Coated and laminated paper, packaging paper and plastics film 0.289 13.924 3105 Paper from pulp 0.019 0.910 3146 Polystyrene foam products 0.010 0.477
100.0
16
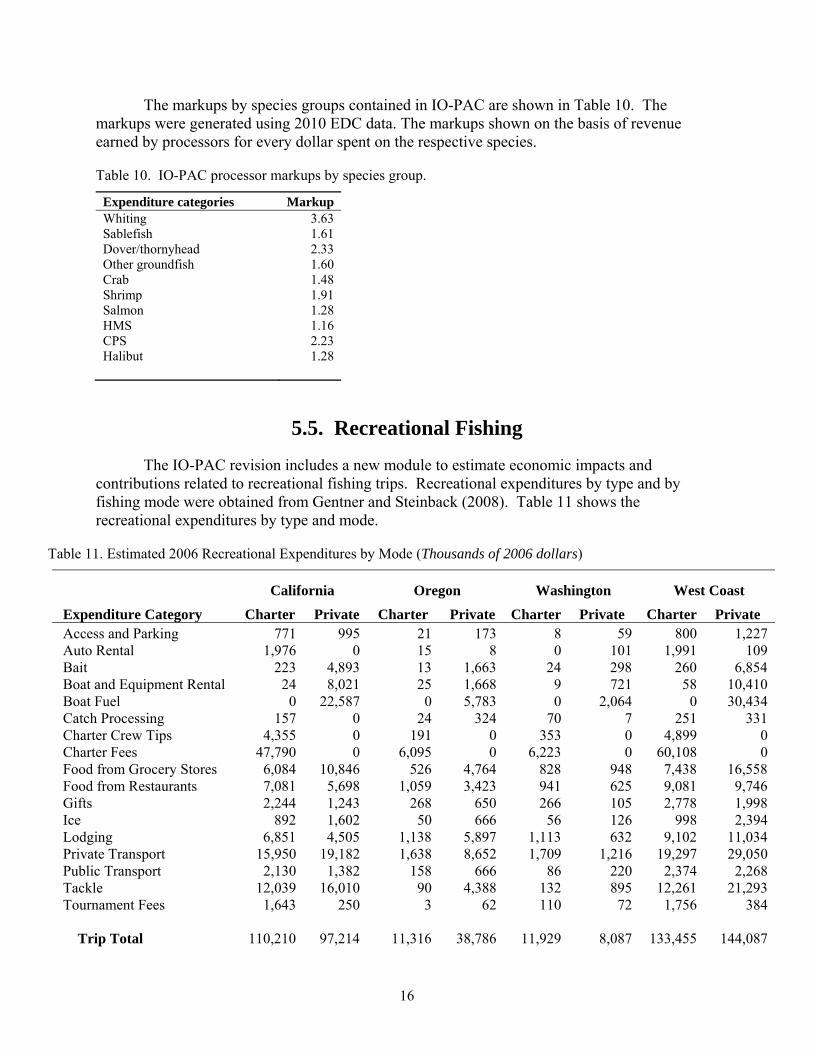
The markups by species groups contained in IO-PAC are shown in Table 10. The markups were generated using 2010 EDC data. The markups shown on the basis of revenue earned by processors for every dollar spent on the respective species.
Table 10. IO-PAC processor markups by species group.
Expenditure categories Markup Whiting 3.63 Sablefish 1.61 Dover/thornyhead 2.33 Other groundfish 1.60 Crab 1.48 Shrimp 1.91 Salmon 1.28 HMS 1.16 CPS 2.23 Halibut 1.28
5.5. Recreational Fishing
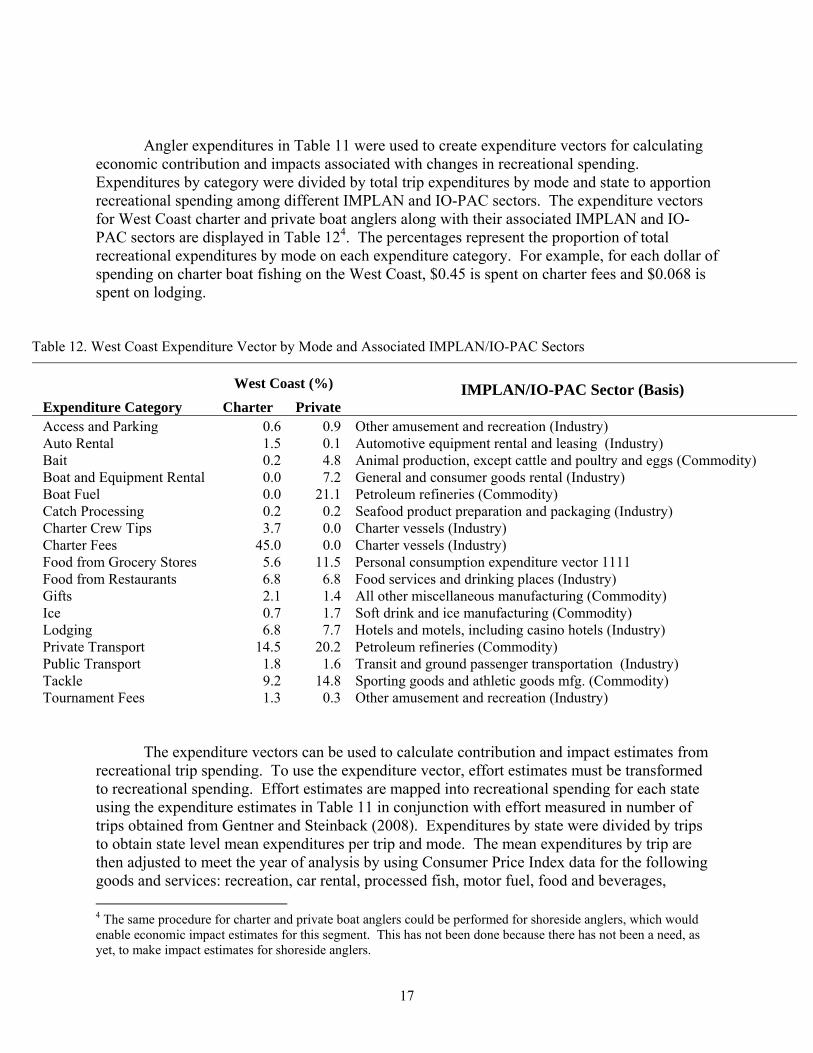
The IO-PAC revision includes a new module to estimate economic impacts and contributions related to recreational fishing trips. Recreational expenditures by type and by fishing mode were obtained from Gentner and Steinback (2008). Table 11 shows the recreational expenditures by type and mode.
Table 11. Estimated 2006 Recreational Expenditures by Mode (Thousands of 2006 dollars)
California Oregon Washington West Coast Expenditure Category Charter Private Charter Private Charter Private Charter Private Access and Parking 771 995 21 173 8 59 800 1,227 Auto Rental 1,976 0 15 8 0 101 1,991 109 Bait 223 4,893 13 1,663 24 298 260 6,854 Boat and Equipment Rental 24 8,021 25 1,668 9 721 58 10,410 Boat Fuel 0 22,587 0 5,783 0 2,064 0 30,434 Catch Processing 157 0 24 324 70 7 251 331 Charter Crew Tips 4,355 0 191 0 353 0 4,899 0 Charter Fees 47,790 0 6,095 0 6,223 0 60,108 0 Food from Grocery Stores 6,084 10,846 526 4,764 828 948 7,438 16,558 Food from Restaurants 7,081 5,698 1,059 3,423 941 625 9,081 9,746 Gifts 2,244 1,243 268 650 266 105 2,778 1,998 Ice 892 1,602 50 666 56 126 998 2,394 Lodging 6,851 4,505 1,138 5,897 1,113 632 9,102 11,034 Private Transport 15,950 19,182 1,638 8,652 1,709 1,216 19,297 29,050 Public Transport 2,130 1,382 158 666 86 220 2,374 2,268 Tackle 12,039 16,010 90 4,388 132 895 12,261 21,293 Tournament Fees 1,643 250 3 62 110 72 1,756 384
Trip Total
110,210
97,214 11,316
38,786
11,929 8,087
133,455 144,087
17
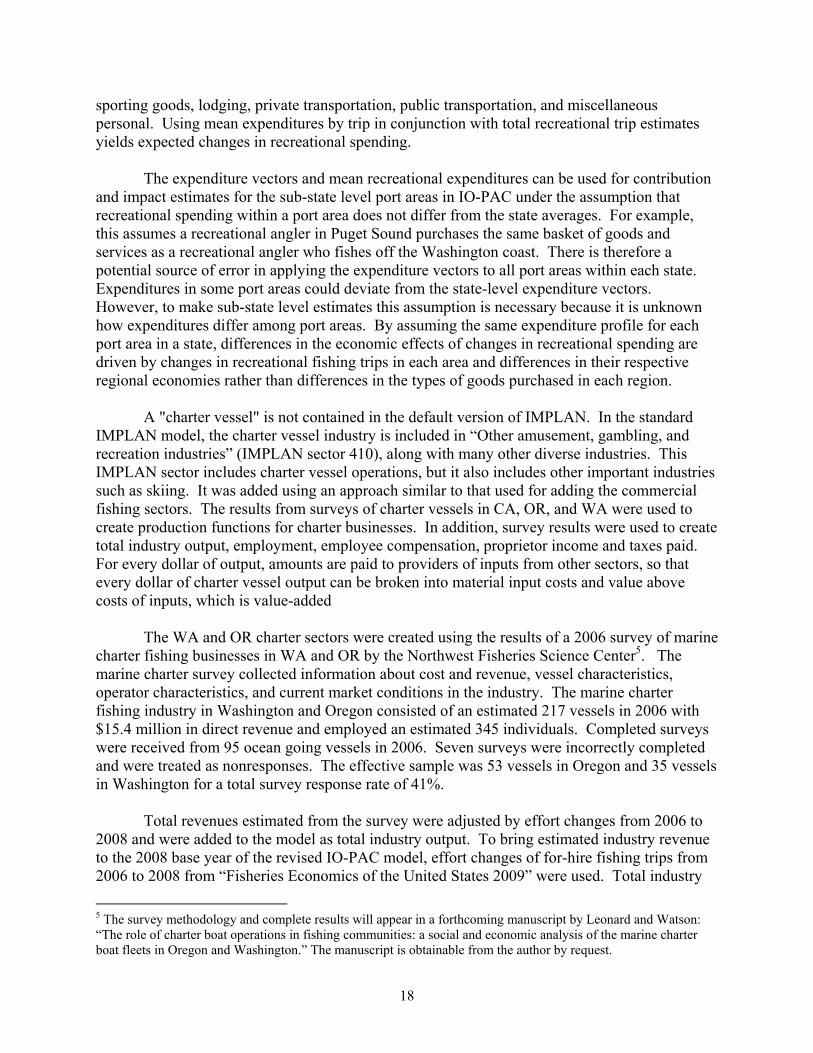
Angler expenditures in Table 11 were used to create expenditure vectors for calculating economic contribution and impacts associated with changes in recreational spending. Expenditures by category were divided by total trip expenditures by mode and state to apportion recreational spending among different IMPLAN and IO-PAC sectors. The expenditure vectors for West Coast charter and private boat anglers along with their associated IMPLAN and IO-PAC sectors are displayed in Table 124. The percentages represent the proportion of total recreational expenditures by mode on each expenditure category. For example, for each dollar of spending on charter boat fishing on the West Coast, $0.45 is spent on charter fees and $0.068 is spent on lodging.
Table 12. West Coast Expenditure Vector by Mode and Associated IMPLAN/IO-PAC Sectors
West Coast (%) IMPLAN/IO-PAC Sector (Basis) Expenditure Category Charter Private
Access and Parking 0.6 0.9 Other amusement and recreation (Industry) Auto Rental 1.5 0.1 Automotive equipment rental and leasing (Industry) Bait 0.2 4.8 Animal production, except cattle and poultry and eggs (Commodity) Boat and Equipment Rental 0.0 7.2 General and consumer goods rental (Industry) Boat Fuel 0.0 21.1 Petroleum refineries (Commodity) Catch Processing 0.2 0.2 Seafood product preparation and packaging (Industry) Charter Crew Tips 3.7 0.0 Charter vessels (Industry) Charter Fees 45.0 0.0 Charter vessels (Industry) Food from Grocery Stores 5.6 11.5 Personal consumption expenditure vector 1111 Food from Restaurants 6.8 6.8 Food services and drinking places (Industry) Gifts 2.1 1.4 All other miscellaneous manufacturing (Commodity) Ice 0.7 1.7 Soft drink and ice manufacturing (Commodity) Lodging 6.8 7.7 Hotels and motels, including casino hotels (Industry) Private Transport 14.5 20.2 Petroleum refineries (Commodity) Public Transport 1.8 1.6 Transit and ground passenger transportation (Industry) Tackle 9.2 14.8 Sporting goods and athletic goods mfg. (Commodity) Tournament Fees 1.3 0.3 Other amusement and recreation (Industry)
The expenditure vectors can be used to calculate contribution and impact estimates from recreational trip spending. To use the expenditure vector, effort estimates must be transformed to recreational spending. Effort estimates are mapped into recreational spending for each state using the expenditure estimates in Table 11 in conjunction with effort measured in number of trips obtained from Gentner and Steinback (2008). Expenditures by state were divided by trips to obtain state level mean expenditures per trip and mode. The mean expenditures by trip are then adjusted to meet the year of analysis by using Consumer Price Index data for the following goods and services: recreation, car rental, processed fish, motor fuel, food and beverages,
4 The same procedure for charter and private boat anglers could be performed for shoreside anglers, which would enable economic impact estimates for this segment. This has not been done because there has not been a need, as yet, to make impact estimates for shoreside anglers.
18
sporting goods, lodging, private transportation, public transportation, and miscellaneous personal. Using mean expenditures by trip in conjunction with total recreational trip estimates yields expected changes in recreational spending. The expenditure vectors and mean recreational expenditures can be used for contribution and impact estimates for the sub-state level port areas in IO-PAC under the assumption that recreational spending within a port area does not differ from the state averages. For example, this assumes a recreational angler in Puget Sound purchases the same basket of goods and services as a recreational angler who fishes off the Washington coast. There is therefore a potential source of error in applying the expenditure vectors to all port areas within each state. Expenditures in some port areas could deviate from the state-level expenditure vectors. However, to make sub-state level estimates this assumption is necessary because it is unknown how expenditures differ among port areas. By assuming the same expenditure profile for each port area in a state, differences in the economic effects of changes in recreational spending are driven by changes in recreational fishing trips in each area and differences in their respective regional economies rather than differences in the types of goods purchased in each region. A "charter vessel" is not contained in the default version of IMPLAN. In the standard IMPLAN model, the charter vessel industry is included in “Other amusement, gambling, and recreation industries” (IMPLAN sector 410), along with many other diverse industries. This IMPLAN sector includes charter vessel operations, but it also includes other important industries such as skiing. It was added using an approach similar to that used for adding the commercial fishing sectors. The results from surveys of charter vessels in CA, OR, and WA were used to create production functions for charter businesses. In addition, survey results were used to create total industry output, employment, employee compensation, proprietor income and taxes paid. For every dollar of output, amounts are paid to providers of inputs from other sectors, so that every dollar of charter vessel output can be broken into material input costs and value above costs of inputs, which is value-added The WA and OR charter sectors were created using the results of a 2006 survey of marine charter fishing businesses in WA and OR by the Northwest Fisheries Science Center5. The marine charter survey collected information about cost and revenue, vessel characteristics, operator characteristics, and current market conditions in the industry. The marine charter fishing industry in Washington and Oregon consisted of an estimated 217 vessels in 2006 with $15.4 million in direct revenue and employed an estimated 345 individuals. Completed surveys were received from 95 ocean going vessels in 2006. Seven surveys were incorrectly completed and were treated as nonresponses. The effective sample was 53 vessels in Oregon and 35 vessels in Washington for a total survey response rate of 41%. Total revenues estimated from the survey were adjusted by effort changes from 2006 to 2008 and were added to the model as total industry output. To bring estimated industry revenue to the 2008 base year of the revised IO-PAC model, effort changes of for-hire fishing trips from 2006 to 2008 from “Fisheries Economics of the United States 2009” were used. Total industry
5 The survey methodology and complete results will appear in a forthcoming manuscript by Leonard and Watson: “The role of charter boat operations in fishing communities: a social and economic analysis of the marine charter boat fleets in Oregon and Washington.” The manuscript is obtainable from the author by request.

19
output was apportioned to value added and material components as displayed in Table 13 along with their associated IMPLAN sectors. Some of the associated sectors indicate “Margined.” In I/O models, expenditures are expressed in terms of producer prices, which is the value of goods at the point of production rather than at the retail level. Consequently, for goods that are not produced at the time of service, such as gasoline, the prices paid by final consumers must be allocated to the portion going to the retailer, wholesaler, transportation, and manufacturing (Olson and Lindall, 1999). According to the production function, an average of 53% of each dollar generated by charter vessel operations is spent on inputs from other sectors. The remaining 47% is value added, which goes to employee compensation, proprietary income, taxes, and other income. The intermediate expenditures were translated into absorption coefficients, which are the percentages of each dollar of revenue spent on each input. For example, an absorption coefficient of 0.05 was calculated for insurance expenses, meaning that, on average, charter businesses spend 5 cents of each dollar of revenue on inputs from the insurance sector. In this same way, absorption coefficients were calculated for each input sector.
Table 13. Estimated 2006 Average WA and OR Charter Industry Production Function and Associated IMPLAN Sectors
Outlay Categories Allocation
(%) IMPLAN Sector Vessel Related
Proprietary Income 27.2 Proprietary Income Captain's Payments 8.6 Employee Compensation Other Crew Payments 3.2 Employee Compensation Office Labor and Other Labor 1.1 Employee Compensation Engine Overhaul 3.7 Ship building and repairing All Other Vessel Maintenance 3.8 Ship building and repairing Electronics Maintenance 0.8 Electronic equipment repair and maintenance Haulout 1.4 Ship building and repairing Moorage 2.0 Other amusement and recreation Purchase of New Gear 1.5 Sporting goods, hobby, book stores (Margined) Vessel Insurance 5.0 Insurance carriers Vessel Professional Services 0.6 Other miscellaneous prof. and tech. services Vessel Advertising 2.1 Advertising and related services Fuel 10.8 Petroleum refineries (Margined) Fishing Supplies 3.0 Sporting goods and athletic goods mfg. (Margined) Bait Expenses 1.2 Animal prod., except cattle, poultry (Margined) Food and Drink 0.1 PCE vector 1111 Taxes and Government Fees Domestic 6.6 Indirect Business Taxes Taxes and Government Fees Foreign 0.0 Indirect Business Taxes Commissions for Booking Agents 5.7 Travel arrangement and reservation services Telephone and Other Communications 1.1 Telecommunications

20
Other Vessel Related 8.4 Monetary authorities and depository credit
Booking Operation Related Labor for Shorebased Personnel 0.15 Employee Compensation Advertising 0.40 Advertising and related services Insurance 0.44 Insurance carriers Professional Service 0.07 All other miscellaneous prof. and tech. Association Fees 0.01 Civic, social, professional organizations Telephones 0.39 Telecommunications Other Office Expenses 0.65 All other miscellaneous mfg. (Margined) Lease/Loan Payments on Vehicles 0.04 Monetary authorities and depository credit Legal/Financial Services 0.01 All other miscellaneous prof. and tech. Other Booking Related 0.01 All other miscellaneous mfg. (Margined)
The CA charter sector was created using the results of a survey conducted by Pacific
States Marine Fisheries Commission (PSMFC) and Southwest Fisheries Science Center. The survey collected cost and earnings information for the year 2000 from the West coast charter and head boat fleet (PMFC, 2004). The population targeted by the survey consisted of vessels operating out of California, Oregon and Washington that provided ocean recreational fishing trips on a commercial basis during 1997-1998. Approximately 12% of the charter and head boats licensed to operate in California, Oregon and Washington were sampled using a stratified random sampling approach. Each stratum consisted of a particular combination of region and size class. Vessels were categorized according to the region of their home port: southern California (for homeports from the Mexican border to Point Conception), northern California (for homeports north of Point Conception to the Oregon border), Oregon, and Washington. Vessel size class was defined in terms of vessel length: "small" for lengths of 15-30 feet, "medium" for lengths of 31-49 feet, and "large" for lengths greater than 49 feet.
To develop a single production function for charter vessel businesses in CA, a weighted average of the survey results was used. The cost and earnings data collected in the survey was weighted by category for Northern CA Large, Northern CA Medium, Northern CA Small, Southern CA Large etc. based on the relative frequency of the cohort in the total population. The weighted average cost function for CA charter businesses along with the assigned IMPLAN categories appears in Table 14.

21
Table 14. Estimated 2000 Average California Charter Industry Production Function and Associated IMPLAN Sectors
Outlay Categories Allocation
(%) IMPLAN Sector Proprietary Income 45.21 Proprietary Income Captain and crew 12.19 Employee Compensation
Labor for Shorebased Personnel 1.25 Employee Compensation
Engine Overhaul 1.21 Ship building and repairing
All Other Vessel Maintenance 3.57 Ship building and repairing
Electronics Maintenance 0.22 Electronic equipment repair and maintenance
Haulout 1.09 Ship building and repairing
Moorage 1.89 Other amusement and recreation
Purchase of Gear or Equipment 3.50 Sporting goods and athletic goods mfg. (Margined)
Insurance 1.16 Insurance carriers
Professional Services 0.37 Other miscellaneous prof. and tech. services
Advertising 1.31 Advertising and related services
Fuel 7.20 Petroleum refineries (Margined)
Supplies 2.27 Sporting goods and athletic goods mfg. (Margined)
Bait 5.18 Animal prod., except cattle, poultry (Margined)
Food and Drink 2.59 PCE vector 1111
Fees Paid to Domestic Governments 1.72 Indirect Business Taxes
Fees Paid to Foreign Governments 2.00 Indirect Business Taxes
Commissions Paid for Booking Trips 5.02 Travel arrangement and reservation services
Telephones 0.60 Telecommunications
Other 0.15 All other miscellaneous mfg. (Margined)
Other Office Expenses 0.32 All other miscellaneous mfg. (Margined) Landing Taxes 0.41 Indirect Business Taxes Mortgage for Vessel 4.32 Monetary authorities and depository credit Association Fees 0.23 Civic, social, professional organizations Lease or Loan of Motor Vehicles 0.25 Monetary authorities and depository credit
Total industry output for charter vessels in CA were estimated using weighted revenues from the survey. Average revenue in each stratum was weighted in the same manner as costs. The weighted average revenue estimate was then multiplied by the total number of charter vessels in CA in 2000 to estimate total industry revenue. The year 2000 estimate of industry output was then adjusted to 2008 by using effort changes of for-hire fishing trips in CA from 2000 to 2008 from Fisheries Economics of the United States 2009 (U.S. Dept. Commerce., 2011). Employment by charter vessels in CA was estimated by dividing total industry output in 2008 by the weighted average output per employee collected in the survey. The weighted average output per employee was estimated through the same stratum weighting method discussed above.

22
5.6. Product Flow
The product flow of fishery resources is complex and there are few sources of data that can be used to accurately account for these transactions in an economic model. Product flow refers to the flow of fish from harvesters to processors, wholesale seafood dealers, restaurants, households, and other sources of demand for fish. Like other fishery IO models (Kirkley et al. 2004, Steinback and Thunberg 2006), IO-PAC relies on simplifying assumptions. The assumptions about the flow of fish in IO-PAC are changed in the revision. For the state and West Coast level study areas, the revisions involve different product flow assumptions for groundfish trawl fish from other gear/species combinations. For port level models, groundfish trawl fish is treated the same as all other fish, and a new approach of using IMPLAN to develop product flow assumptions is used. The collections data by the Washington Department of Revenue (WDOR) Enhanced Food Fish Tax is no longer used.
For fish harvested with groundfish individual fishing quota (IFQ), the assumptions about product flow are driven by data collected through the EDC program. Under trawl rationalization, all IFQ fish sold by harvesters must be received by an entity with a First Receivers License. Those with Licenses are required to complete an EDC survey, so there is no harvested fish that is bypassing these first receivers. As described above, these first receivers are treated as processors. Hence, for the West Coast as whole and the state level study areas, all groundfish trawl quota fish flows to “processors” as defined here. None goes directly to other businesses and households that demand fish without going through the processing channel.
Due to cross hauling, it is possible that fish landed in a port, will not be processed therein. At this time we are unable to quantify this cross-hauling activity for either IFQ or non-IFQ fish. Consequently, we handle both in the same manner. Because we currently cannot quantify the cross-hauling activity, IMPLAN data about processor demand for fish within a study area (port group) are utilized. The IMPLAN commodity balance sheets were used in the last version of IO-PAC for this same purpose.
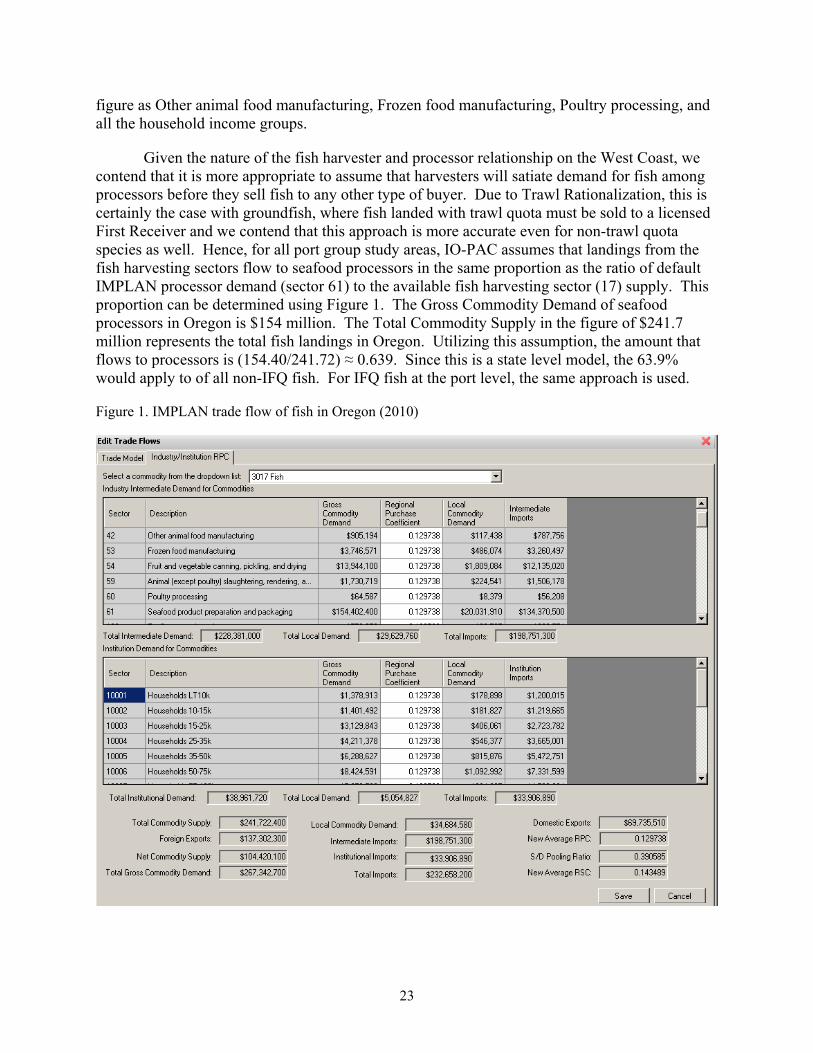
The revision uses the trade flow information in IMPLAN differently because the previous approach underestimates the amount of fish that flows from harvesters to processors. In the last version of IO-PAC, it was assumed that processor demand for fish from harvesters followed the econometrically derived regional purchase coefficient (RPC) in IMPLAN. The primary issue with this approach is that processor demand for fish from harvesters is equivalent to all other sources of fish demand (households, restaurants, grocery stores, hospitals, etc.). All agents of demand are treated the same. They all source the same proportion of their demand for fish from harvesters within the study area. This issue is exemplified by examining the demand for harvested fish in Oregon. Figure 1 was generated by constructing a default IMPLAN model for each study area, then viewing the Industry/Institution RPC tab under the Edit Trade Flows function in IMPLAN. Figure 1 indicates that Gross Commodity Demand for fish among processors in the state of Oregon is $154,402,400. Essentially, this indicates that in order to support their level of production in Oregon, processors needed $154 million in raw fish. The Local Commodity Demand column indicates that $20 million of this demand for raw fish was sourced from harvesters in Oregon. The reason 12.9% of demand was fulfilled by harvesters in Oregon, is that the RPC of 0.129738 applies to all sources of demand, which are shown in the
23
figure as Other animal food manufacturing, Frozen food manufacturing, Poultry processing, and all the household income groups.
Given the nature of the fish harvester and processor relationship on the West Coast, we contend that it is more appropriate to assume that harvesters will satiate demand for fish among processors before they sell fish to any other type of buyer. Due to Trawl Rationalization, this is certainly the case with groundfish, where fish landed with trawl quota must be sold to a licensed First Receiver and we contend that this approach is more accurate even for non-trawl quota species as well. Hence, for all port group study areas, IO-PAC assumes that landings from the fish harvesting sectors flow to seafood processors in the same proportion as the ratio of default IMPLAN processor demand (sector 61) to the available fish harvesting sector (17) supply. This proportion can be determined using Figure 1. The Gross Commodity Demand of seafood processors in Oregon is $154 million. The Total Commodity Supply in the figure of $241.7 million represents the total fish landings in Oregon. Utilizing this assumption, the amount that flows to processors is (154.40/241.72) ≈ 0.639. Since this is a state level model, the 63.9% would apply to of all non-IFQ fish. For IFQ fish at the port level, the same approach is used.
Figure 1. IMPLAN trade flow of fish in Oregon (2010)
24
6. Model Construction
The revisions to IO-PAC construction are done to reduce effort involved in making changes to fishing sector production functions over time and simplify the process of building numerous port level models. The original version of IO-PAC modified IMPLAN Version 2 software. IMPLAN Version 3 software is used for in the IO-PAC revision. Version 3 provides a new method for importing changes in expenditures made by fishing vessels and recreational anglers. Expenditure changes can now be imported into IMPLAN using EXCEL templates provided by IMPLAN. Model construction in IO-PAC is constructed through the use of several of these EXCEL templates. With the change, the modeling is done primarily using spreadsheets rather than with modifications to the IMPLAN database. The change permits easy modification of production functions used in the model, and also changes in study areas can be accomplished easily. The ease in changing production functions is important because the survey data from which they are built are continually being updated. The ease in changing study areas is important because study areas of interest often deviate from those used in groundfish management. For example, the new approach permits an easy shift to study areas of interest in salmon management. The following discussion borrows content from the Version 3.0 User’s Guide (MIG, 2010).
In IMPLAN Version 3, contributions and impacts are estimated by setting up activities of
different types. Activities are groupings of one or more Events that represent spending changes within a study area. Activities come in six different types: industry change, commodity change, labor income change, household spending change, industry spending pattern, and institutional spending pattern. Each activity type is appropriate for different types of analysis. By enabling spending changes of six different types, IMPLAN Version 3 is more flexible than Version 2, but skill by the analyst is more critical in determining which type of activity is most appropriate for a particular estimate. The activity types used in IO-PAC are briefly described below.
6.1. IMPLAN Activity Types
Industry Change is used to estimate the economic impact or contribution of a particular industry, where industry refers to a group of establishments that engage in similar types of economic activity. The most widespread industry classification scheme is the North American Industrial Classification System (NAICS). IMPLAN has its own industry classification scheme where each group consists of one or more NAICS categories. An example of an industry change is to estimate the effect of a $1 million change in demand among “wood window and door” manufacturers in a particular study area.
Commodity Change is used to estimate the economic impact or contribution of a particular good or service. Commodities may be produced by one or more industries and institutions, where institutions are households and governments. All industries in IMPLAN have a primary commodity of the same name as the industry. Thus, the primary commodity of wood window and door manufacturers is the commodity “Wood windows and doors”. However, wood window and door manufacturers also produce the commodity “Wood kitchen cabinets and

25
countertops.” An impact or contribution estimate due to a demand change for a particular commodity will affect all industries that produce the commodity. For example, shocking the commodity “wood windows and doors” will affect wood window and door manufacturers, but it will also affect the industry “sawmills and wood preservation.”
It is important to note that multipliers used to develop estimates are produced for each endogenous industry or institution in IMPLAN. The effective multiplier for a commodity-based estimate is a weighted combination of the multipliers of the affected industries and institutions. The weighting among industries for a particular commodity is the respective market share for the commodity. The government institutional sectors (State and Local Government, Federal Govt. Non-Defense, etc.) are often treated as exogenous. As a result, their institutional contribution to production is treated as a leakage in impact/contribution estimates. This is a principle difference between industry-based versus commodity-based estimates.
Labor Income Change is used to estimate how changes in employee compensation or proprietor income will affect the economy. This would be the appropriate approach if one wanted to estimate the impact of increased payments to employees in a study area.
Industry Spending Patterns are particularly useful in modeling the fishing industry with primary cost earnings data collected from participants. The following was taken from Version 3.0 User’s Guide (MIG, 2010).
“Industry Spending Patterns allow you to import an Industry’s production function, or build an Industry from data about its expenditures. This Activity type works with coefficients of total budget spending, allowing you to use Level to create a series of estimates about the impacts of different expenditures to a single Industry. One thing to remember when using Industry Spending patterns is that their coefficients typically do not include their labor income spending, and therefore the coefficients sum to less than 1.00. To ensure that the full impact of spending in an Industry is captured, you will need to create a Labor Income impact to compliment your Industry Spending pattern.” Institution Spending Patterns are useful in modeling the change in households or
government spending. In IO-PAC, we use the State and Local Government Non-Education spending pattern to model the effect of taxes paid by fishing industry participants. This marks a departure from the last version of IO-PAC in which taxes were shifted to the value-added account “Indirect business taxes.” Because of changes in the IMPLAN software, this approach is no longer possible.
6.1. Importing Fishery-Specific Information All of the above activity types can be created in EXCEL and imported into the IMPLAN
software. For the industry additions in IO-PAC, the procedure involves mapping the production function information in Tables 7, 8, 13 and 14 into IMPLAN commodities using the bridge information displayed in Appendix A. Recreational effort is mapped into IMPLAN commodities and industries as shown in Table 12.

26
Figure 2 displays an example of an Industry Spending Pattern activity EXCEL template that is imported into IMPLAN. After the activity is imported into IMPLAN the “Local Direct Purchase” that is set to 100% on the import must be set to the “SAM Model Value” using the IMPLAN interface. All of these SAM model values will be unique to the study area in question. The Large Groundfish Trawler activity is now ready to estimate the indirect and induced effects of goods and services purchased by the Large Groundfish Trawl vessels. The effects of payments to captain, crew, and proprietors using the analysis by parts approach.

27
Figure 2. Large Groundfish Trawler industry spending pattern example
Activity Type Activity Name Actiity LevelIndustry Spending Pattern Large Groundfish Trawler 1
Sector Event Value Local Direct Purchase
3001 0.00000093 100%3002 0.00000553 100%3003 0.00033032 100%3004 0.00020865 100%3005 0.00001093 100%3006 0.00000951 100%3010 0.00000296 100%3013 0.00009052 100%3015 0.00000200 100%3017 0.00775418 100%3027 0.00000015 100%3041 0.00024154 100%3042 0.00003284 100%3043 0.00005496 100%3044 0.00003994 100%3045 0.00000112 100%3046 0.00006533 100%3047 0.00023512 100%3048 0.00007519 100%3050 0.00005003 100%3051 0.00022556 100%3052 0.00019185 100%3053 0.00051625 100%3054 0.00074862 100%3055 0.00061542 100%3056 0.00021462 100%3057 0.00012303 100%3058 0.00007312 100%3059 0.00164051 100%3060 0.00040442 100%3062 0.00075784 100%3063 0.00042171 100%3064 0.00003310 100%3065 0.00032730 100%3066 0.00018928 100%3067 0.00007958 100%3068 0.00022747 100%3069 0.00027572 100%3070 0.00976184 100%3083 0.00024055 100%3085 0.00021683 100%3105 0.00112477 100%

28
Figure 2. Large Groundfish Trawler industry spending pattern example (Continued)
Activity Type Activity Name Actiity Level Activity YearIndustry Spending Pattern Large Groundfish Trawler 1 2010
Sector Event Value Local Direct
Purchase3107 0.00508185 100%3109 0.00066741 100%3115 0.06619659 100%3138 0.00245623 100%3141 0.00000244 100%3142 0.00152794 100%3149 0.00023378 100%3150 0.00018634 100%3216 0.00020329 100%3225 0.00210726 100%3227 0.00012873 100%3256 0.00021006 100%3259 0.00034217 100%3266 0.00014568 100%3271 0.00028796 100%3283 0.00133483 100%3290 0.14267499 100%3319 0.06811651 100%3321 0.00000141 100%3323 0.00005121 100%3324 0.01079769 100%3326 0.03849354 100%3329 0.00048528 100%3330 0.00118954 100%3332 0.00000710 100%3333 0.00120790 100%3334 0.00002567 100%3335 0.00028480 100%3337 0.00083260 100%3339 0.00002267 100%3340 0.00001297 100%3354 0.01136448 100%3357 0.04634027 100%3393 0.00087277 100%3394 0.00145541 100%3410 0.00677249 100%3416 0.00414619 100%3425 0.00867350 100%3436 0.00009212 100%

29
6.1. Analysis by Parts
In typical IO analysis, a shock to aggregate demand is placed on one of the industry sectors or commodities that are included in the model. Total economic impacts or contributions are then estimated as the backward linked effect of a demand change on the target industry or commodity. To calculate the estimate, the direct effect of the demand change is multiplied with the respective industry multipliers.
As explained by Manshel (2012) “Analysis-by-parts (ABP) does not start with an impact on a
target industry sector or commodity. Instead, we will specify the goods and services the target industry purchases in order to satisfy a demand or production level. The purchase of these goods and services from local sources actually represent the first round of indirect purchases by the target industry. In addition to the goods and services (first part) we need to analyze the impact of the payroll (second part) of our target industry necessary to meet the new demand or production level.”
In ABP the indirect and induced effects of goods and services purchased by a fishing vessel
sector is the “first part” of calculating the economic impact of a given level fishery harvest. The “second part” is payments to captain, crew, and proprietors. The impact of payments to captain, crew, and owners for a given level of harvest is estimated separately using the Labor Income Activity described above. The sum of these two impacts is the total indirect and induced effects of a given level of fishery harvest. To these indirect and induced effects the direct effects must be added to reach the total effects of a given level of harvest. An example of the approach is shown below.
In IO-PAC, there are a few additional wrinkles in the ABP approach. First, on the commercial side because we are modeling the effect to both processors and harvesters, the ABP must be done for both. Additionally, the treatment tax revenue paid by harvesters is one additional “part” needed to estimate each impact for state and West Coast level study areas. Taxes are part of the production function of the commercial fishing harvesters. These taxes paid are not part of their industry spending patterns. For state and West Coast study areas, these taxes are assumed to be endogenous. The implication is that government spending will be affected by changes in tax payments from fishery participants. These payments are assumed to be subsequently spent by state and local governments. State and local government spending is expected to follow the State and Local Government Non-Education institutional spending pattern that is contained in IMPLAN.
7. Impact Estimation
IO-PAC can be used to assess the impact of a given fishery management action when an externally derived, exogenous assessment of how the action will affect the gross output of industries or commodities that are included in the model is available. With an exogenous estimate of the effect of a management action on fish harvest, IO-PAC will estimate the backward-linked impacts of the action on the economy. On the commercial side, economic impacts can be made on a commodity or industry basis.

30
IO models are designed to estimate the backward linked effects of a change in demand on a given industry or change in demand for a given commodity. For commercial vessel landings, IO-PAC utilizes a technique outlined by Steinback (2004) to use IO models for a change in production rather than a change in demand. If we were using the IO model in the standard way to estimate the backward linked impact of a shock to processed seafood demand, we would run a single direct commodity effect on processed seafood. The backward linked effect of that change in processed seafood demand would hit every firm involved in the production and distribution of seafood. A margin would hit the retailers, wholesalers, and processors. Harvesters would be hit as an indirect effect, because they supply the processors with a production input. The processor multiplier would have an embedded indirect effect of a change in harvester landings. The approach outlined by Steinback (2004) involves exogenously shocking the relevant seafood sectors (harvesters and processors) and setting their regional purchase coefficients (RPCs) to 0 to avoid double counting and feedback effects. By following this approach we are tricking the IO model to give us the economic impact of a change in "demand" for seafood at the processor and harvester stages of production separately. Because the RPC on harvesters is set to 0, there is no indirect effect on harvesters from a change in processor production. Because the indirect effect on harvesters of a shock to processors is absent, the two effects can be summed without double counting.
With a given change in commercially harvested fish, how are the economic impacts estimated? One must decide whether a shock is more appropriately targeted on a commodity or industry sector included in the model. The appropriateness of commodity versus industry shocks depends on the research question.6 Assuming the appropriate target is the Large Groundfish Trawlers (LGT) industry sector, the impacts are estimated as follows. First, the LGT revenue is run through their production function. The LGT production function is in the form of an industry spending pattern imported into IMPLAN. The function can be seen using the “Setup Activities” screen in IMPLAN (Figure 3). The activity is named “Large Groundfish Trawler.” Choosing the activity will cause the production function information specific to LGTs to show up in the events window. The “Sum of Event Values” at the bottom of Figure 3 shows the total share of LGT output that is used for factors of production excluding labor, so 45% of LGT revenue is used for inputs such as fuel, insurance, etc. The exogenous change in LGT harvest is entered in the “Level” cell. In this example, $1 million in revenue is entered.
6 See Leonard and Watson (2011) for a more detailed discussion of commodity versus industry impacts.

31
Figure 3. Large Groundfish Trawler industry spending pattern activity
Second, employee compensation and proprietary income is shocked with the same $1 million. The labor effect is contained in the activity “LGT Labor.” It is imported as a Labor Income Change. The labor income in the event is set to the proportion of total industry output (TIO) among LGTs that is paid to employees (captain and crew) and proprietors (vessel owners). Figure 4 indicates that among LGTs the shares paid to employees and proprietor are 0.39 and 0.11 respectively. Importing labor income as a share of TIO, allows the “Level” to be shocked with the same exogenous revenue run through the LGT spending pattern. In this example, we shocked LGT revenue by $1 million.

32
Figure 4. Large Groundfish Trawler labor income
Third, since the study area for this model is the whole West Coast, we import the institution spending pattern for State and Local Government Non-Education (SLG). The share of industry output paid in taxes is treated as endogenous in the state level and West Coast study areas. The base institution spending pattern for SLG is put in EXCEL and coefficients for each of the commodity purchases’ are scaled so that the sum of commodity purchases equals the share of TIO paid in taxes among LGTs. This enables the “Level” to be shocked with the same exogenous revenue run through the LGT spending pattern. In this example, we shocked LGT revenue by $1 million.
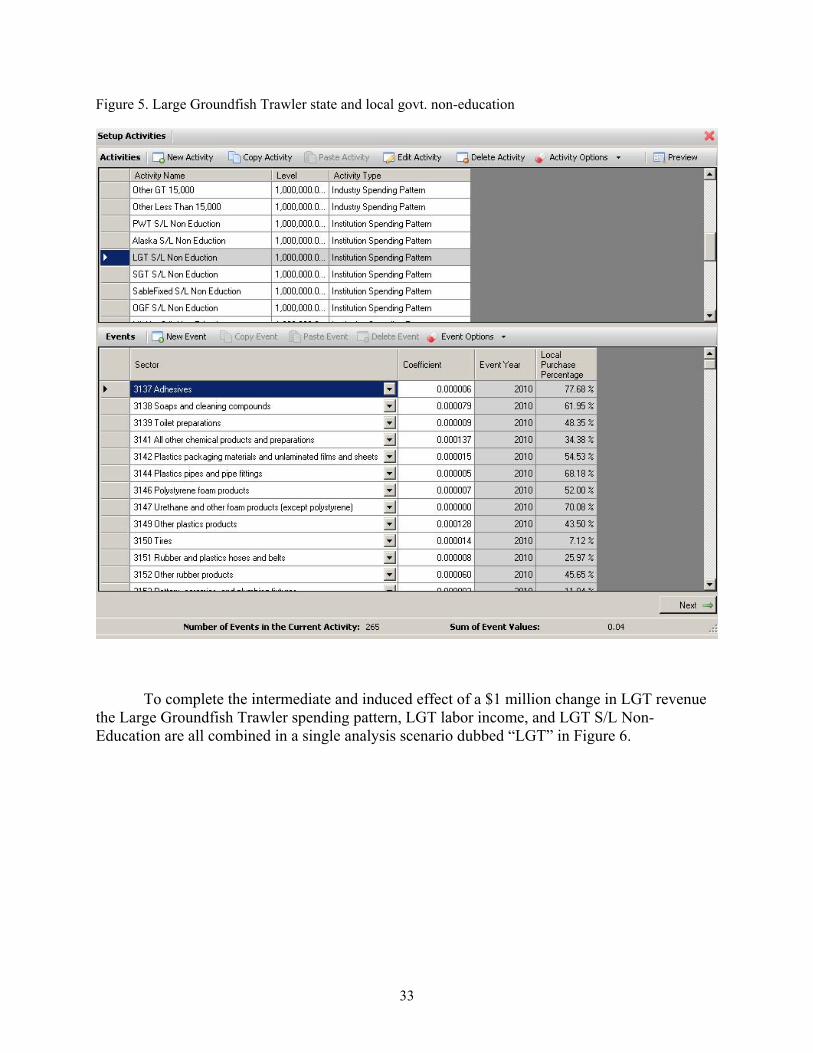
33
Figure 5. Large Groundfish Trawler state and local govt. non-education
To complete the intermediate and induced effect of a $1 million change in LGT revenue the Large Groundfish Trawler spending pattern, LGT labor income, and LGT S/L Non-Education are all combined in a single analysis scenario dubbed “LGT” in Figure 6.

34
Figure 6. Large Groundfish Trawler impact scenario
The analysis by parts results indicate the total indirect and induced effects of a $1 million change in LGT revenue. The impact results for the West Coast study are for an increase in output of $1.37 million and an employment change of 9.5 jobs. This is the total indirect and induced effect of a $1.0 million change in LGT harvest. To this amount, the direct effects on harvesters must be added (Steinback et. al, 2008). The direct output and employment of LGTs are $1.0 million and 8.4, respectively. Altogether, the direct, indirect, and induced effect on output is $2.37 million and on employment is 17.9 jobs.
After estimating sales by seafood processors, the analysis by parts approach must be conducted in the same manner as for harvesters. Estimated sales changes for seafood processors are made by using product flow in IMPLAN for the default seafood processing sector (71) and markup margin information obtained through the EDC program. For all port level study areas, it is assumed that landings from the fish harvesting sectors flows to seafood processors in the same proportion as the default IMPLAN intermediate processor demand (sector 61) to fish harvesting supply (17) ratio. This value is determined by constructing a default IMPLAN model for the study area of interest, then examining the commodity balance sheet for the harvested fish (commodity 3017). For the West Coast example here, it is assumed that 100% is processed. Fish landings that are purchased by the processing sector in each study area are converted into revenue changes by applying the margins derived from the EDC data (Table 10). These producer values are then entered as the change in direct sales for the seafood processing sector. For each study area, ΔLk represents the change in total fish landings among vessel classification k, p represents the ratio of processor demand (sector 61) of the commodity fish to the available fish harvesting supply (sector 17), and mj represents the markup for species j, then the change in sales for seafood processors (ΔPS) is given by
(11) )()( jmpLPSk j
k

35
In our example of a $1.0 million change for LGT, assume that the landings are comprised only of sablefish. For the West Coast it is assumed that 100% of the sablefish is processed. Table 10 indicates that the markup for sablefish is 1.61, so for a $1.0 million increase in sablefish delivered to processors, processor revenue is $1.61 million. The analysis by parts approach is used to estimate the impact of the $1.61 million in the same manner as for harvesters. The total output and employment change resulting from a $1.61 million change in processor revenue are $2.6 million and 18.53, respectively.
The results from the analysis by parts results for both LGTs and processors are combined to reach the total change resulting from $1.0 million change on LGT sablefish landings. Because LGTs and processor effects are separated as a result of our breaking the link between processors and harvesters, the results of each can be added together without double counting. The sum of both the LGT and processor effects is $4.95 million in economic output and 36 jobs.
On the recreational side, recreational spending vectors for private and charter vessel effort are created in EXCEL and imported into IMPLAN as commodity and industry change vectors. The commodity change and industry change vectors are scaled so that the sum of all affected commodities and industries equals one. Because the vectors are scaled, a change in recreational spending is entered using the “Level” under “Set Up Activities” in IMPLAN A snapshot of private boat recreational commodity purchases is shown Figure 7. A hypothetical expenditure change of $1.0 million is entered in the “Level.” Notice that the sum of event values near the bottom of the figure is 0.75. This indicates that 75% of every dollar in expenditure entered in the “Level” will be distributed to the commodity categories. The other 25% is accounted for in the industry changes for private boat recreational fishing. 25% of each dollar in the “Level” will be distributed to one of the industry categories. The total effect of the $1.0 million change is done by creating an “Activity Scenario” that includes both the commodity changes and industry changes. In this $1.0 million example, the total economic output estimate is $1.88 million and 14.5 jobs.
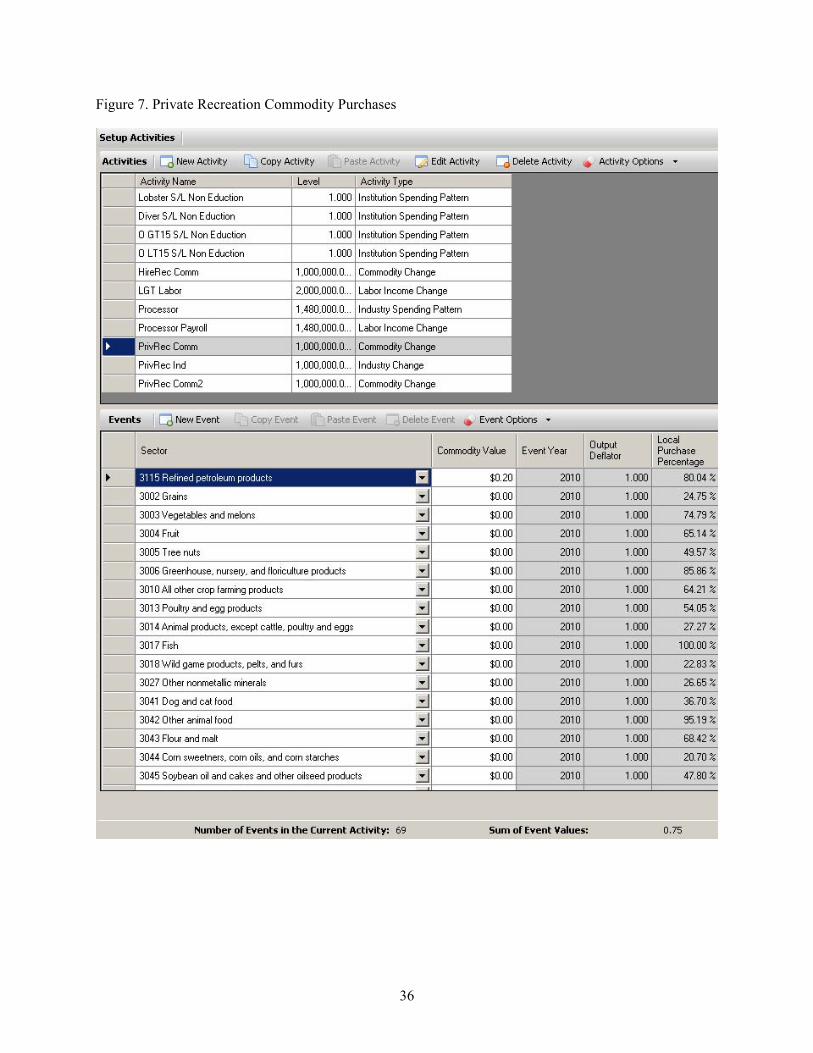
36
Figure 7. Private Recreation Commodity Purchases

37
8. Discussion
The revision of IO-PAC is intended to make use of the latest commercial fishery cost earnings data collected by the Northwest Fisheries Science Center, incorporate more recent IMPLAN data, add a recreational component that can be used for contribution and impact estimates resulting from recreational fishing trips, add separate mothership and catcher-processor sectors, and migrate IO-PAC to IMPLAN version 3.
Since the first version of IO-PAC was completed (Leonard and Watson, 2010), the voluntary cost earning surveys used to develop the production functions for the commercial fishing sectors in the model have been reprised. The IO-PAC revision incorporates these latest survey results. Because of the expanded scope and increased detail of the more recent surveys, incorporating the more recent data has the added benefit of likely increasing the accuracy of IO-PAC, especially for vessel classifications that were previously not covered or partially covered.
The revision to IO-PAC increases the baseline IMPLAN data from 2006 to 2010. The IMPLAN data are based on economic relationships in 2010 as opposed to 2006 before the revision. Impacts of management actions in succeeding years are determined by converting the estimated changes in gross revenues to year 2010 dollars before the impacts are estimated. IMPLAN then converts the impact estimates back to the year of the input data (through 2030). This process accounts for the effects of inflation on the impact estimates. The economy wide data that is contained in IMPLAN is slow to change. Technical change and demand remain in the economy as a whole remain relatively stable. As a result, the 2010 IMPLAN data will be suitable for use in IO-PAC for several years to come7.
The inclusion of a recreational component permits the revised version of IO-PAC to be used for recreational fishing contribution and impact estimates. The inclusion of the recreational component was enabled through the use of recreational expenditure data for 2006 (Gentner and Steinback, 2008) and charter vessel cost earnings data collected by the PSMFC (2004) and the NWFSC in 2006.
The revision also includes shoreside processor data collected through the EDC program and changes the method of assessing the proportion of harvested fish that is passed to processors. The inclusion of the EDC data likely reduces the error in estimating processor impacts. Prior to the EDC, estimates where made using non-species specific production function margins (mark-up) for seafood processors. A limitation to the prior approach is that a dollar of any species will generate the same revenue to processors. While less obvious, the prior approach was also prone to error because the default production functions contained in IMPLAN are based on Economic 7 Opinions differ as to how frequently the input output data should be update. Based on the CIE review of IO-PAC completed in October 2009, the opinion of reviewers was every 3-5 years. The Benchmark Input-Output Table constructed by Bureau of Economic Analysis is updated every five years.

38
Census data for processors in the entire United States. If seafood production practices on the West Coast differ from those of the United States as a whole, this approach is prone to error.
The current revision includes a substantial change in model construction that migrates IO-PAC to IMPLAN version 3 software. This migration reduces the effort in making production function changes when newer cost earnings data are available and in creating models for different study areas. The real advantage of the new approach is that once the production functions for the different fishery sectors are completed in a model for one study area, such as the West Coast, they can be imported into an alternative study area with click of a button. Models for all 22 study areas included in the model can be completed in a couple of days rather than weeks. Additionally, the new approach permits customised study areas to be completed with minimal effort.
There are several areas where the revised IO-PAC can potentially be further improved. First, IO-PAC relies on a weighted average production function for the shoreside commercial vessels on the West Coast that are not currently covered by NWFSC cost earnings surveys. Second, for the at-sea fleet, which includes motherships and catcher-processors, IO-PAC does not currently include a production function due to their historical exclusion from the NWFSC’s voluntary cost earnings surveys.
On the recreational side, IO-PAC’s expenditure estimates are not port specific and were made based on expenditures that occurred in 2006. For port level impacts, estimates from IO-PAC may understate or overstate the effects of changes in recreational fishing effort if port area expenditures of recreational anglers differ from state level estimates. Additionally, recreational expenditures may have changed since 2006, both in the level of spending per trip and the basket of goods and services purchased. To the extent that mean recreational trip expenditures have changed since 2006, there is potential for error in the estimates.
Lastly, the charter vessel sector created for CA is based on cost earnings data from 2000 while WA and OR are based on cost earnings data from 2006. Although this represents the most recent data available, there is the potential for error if the cost and earnings of vessels operating as charter vessels has changed since the data were collected.
There are several improvements planned for IO-PAC to address these issues. Many of the planned improvements to IO-PAC will be enabled through the use of data collected in the mandatory EDC program.8 It is expected that data collected through the EDC will lead to improvements in the vessel production functions in IO-PAC. Unlike the voluntary cost earnings surveys, nearly all of the vessels that participate in the West Coast groundfish fishery are expected to complete an EDC survey. This will lead to improvements in the specification of production functions currently covered by the voluntary cost earnings surveys, and increased coverage to sectors not previously covered by the voluntary efforts such as motherships and catcher-processors. Additionally, the EDC will provide the data necessary to construct unique production functions for mothership and catcher-processor sectors.
8 The regulations detailing the Economic Data Collection program (50 CFR 660.114) are available online at: http://www.nwfsc.noaa.gov/research/divisions/fram/economic_data.cfm.

39
Additional planned improvements include updated recreational expenditure estimates and updated charter cost earnings data. The 2011 National Marine Recreational Fishing Expenditure Survey9 is currently being compiled. The data is expected to be available in the next couple of months. On the charter recreational front, in 2013 cost earnings surveys of California vessels will be completed by the Southwest Fisheries Science Center and the NWFWSC will complete a survey of those in WA and OR.
9 See additional information online at http://www.st.nmfs.noaa.gov/st5/documents/Nationwide_brochure.pdf

40
References
CFR (Code of Federal Regulations). 2010. 50 CFR § 660.114. Trawl fishery—economic data collection program. Online at http://ecfr.gpoaccess.gov/cgi/t/text/textidx?c=ecfr&sid=6e3adf5fe27 94843765901aa0c829f4c&rgn=div8&view=text&node=50:11.0.1.1.1.4.1.5&idno=50 [accessed 29 December 2011].
Gentner, Brad, and Scott Steinback. 2008. The Economic Contribution of Marine Angler Expenditures in the United States, 2006. U.S. Dep. Commerce, NOAA Tech. Memo. NMFSF/ SPO-94, 301 p.
Leonard, J., and P. Watson. 2011. Description of the input-output model for Pacific Coast fisheries. U.S. Dept. Commer., NOAA Tech. Memo. NMFS-NWFSC-111, 64 p.
MIG. 2010. Version 3.0 User’s Guide. 502 2nd St., Ste 301, PO Box 837, Hudson, WI 54016.
PSMFC (Pacific States Marine Fisheries Commission). 2004. West Coast Charter Boat Survey Summary Report, 2000. 205 SE Spokane St., Suite 100, Portland, OR 97202.
Radtke, H. D., and S. W. Davis. 2000. Description of the U.S. West Coast commercial fishing fleet and seafood processors. Report prepared for Pacific States Marine Fisheries Commission, Portland, OR.
Steinback, S. R. 2004. Using ready-made regional input-output models to estimate backward-linkage effects of exogenous output shocks. The Rev. Reg. Stud. 34(1):57–71.
Steinback, S. R., and E. M. Thunberg. 2006. Northeast regional commercial fishing input-output model. U.S. Dept. Commer., NOAA Tech. Memo. NMFS-NEFSC-188.
U.S. Dept. Commerce. 2011. Fisheries Economics of the United States, 2009. NOAA Tech. Memo. NMFS-NWFSC-118, 172 p.
Watson, P., J. Wilson, D. Thilmany, and S. Winter. 2007. Determining economic contributions and impacts: What is the difference and why do we care? J. Reg. Anal. Policy 37(2):140–146.

41
Appendix A: Bridge between Expenditures and IMPLAN Sectors
Factor expenditures by harvesters and seafood wholesalers were allocated to IMPLAN sectors. The following lists represent the bridge between harvester and seafood wholesaler expenditures and IMPLAN sectors. The main difference between these allocations and those presented in Leonard and Watson (2011) is the movement to a new industry classification system in IMPLAN.
Harvester Expenditures
Fuel and lubricant expenses were allocated based on the IMPLAN default margin table for sector 115 (petroleum refineries).
Sector Title Proportion 3115 Refined petroleum products 0.393794
3319 Wholesale trade distribution services 0.361077
3333 Rail transportation services 0.006754 3334 Water transportation services 0.005192 3335 Truck transportation services 0.008658 3337 Pipeline transportation services 0.004953
3326 Retail Services - Gasoline stations 0.219571
Total 1.000000
Food and beverage expenses were allocated based on the IMPLAN personal consumption expenditure vector 1111. This vector represents the national average expenditure pattern for groceries. However, following the approach of Steinback and Thunberg (2005), purchases associated with the two default seafood sectors (i.e., commercial fishing and seafood product preparation and packaging) were reallocated to sector 60 (frozen food manufacturing), believed to better reflect likely consumption habits aboard commercial fishing vessels.
Sector Title Proportion3001 Oilseeds 6.36E-05 3002 Grains 0.000379 3003 Vegetables and melons 0.022642 3005 Tree nuts 0.000749 3004 Fruit 0.014302 3006 Greenhouse, nursery, and floriculture products 0.000652 3010 All other crop farming products 0.000203 3013 Poultry and egg products 0.006205

42
3015 Forest, timber, and forest nursery products 0.000137 3027 Other nonmetallic minerals 1.00E-05 3041 Dog and cat food 0.016556 3042 Other animal food 0.002251 3043 Flour and malt 0.003767 3044 Corn sweetners, corn oils, and corn starches 0.002738 3045 Soybean oil and cakes and other oilseed products 7.65E-05 3046 Shortening and margarine and other fats and oils products 0.004478 3047 Breakfast cereal products 0.016116 3048 Raw and refined sugar from sugar cane 0.005154 3050 Chocolate cacao products and chocolate confectioneries 0.003429 3051 Chocolate confectioneries from purchased chocolate 0.015461 3052 Nonchocolate confectioneries 0.01315 3053 Frozen foods 0.035386 3054 Canned, pickled and dried fruits and vegetables 0.051314 3055 Fluid milk and butter 0.042184 3056 Cheese 0.014711 3057 Dry, condensed, and evaporated dairy products 0.008433 3058 Ice cream and frozen desserts 0.005012 3059 Processed animal (except poultry) meat and rendered byproducts 0.112448 3060 Processed poultry meat products 0.027721 3062 Bread and bakery products 0.051946 3063 Cookies, crackers, and pasta 0.028906 3064 Tortillas 0.002269 3065 Snack foods including nuts, seeds and grains, and chips 0.022435 3066 Coffee and tea 0.012974 3067 Flavoring syrups and concentrates 0.005455 3068 Seasonings and dressings 0.015592 3069 All other manufactured food products 0.018899 3070 Soft drinks and manufactured ice 0.06019 3141 All other chemical products and preparations 0.000167 3319 Wholesale trade distribution services 0.098877 3332 Air transportation services 0.000487 3333 Rail transportation services 0.002832 3334 Water transportation services 0.001729 3335 Truck transportation services 0.013268 3339 Couriers and messengers services 0.001554 3340 Warehousing and storage services 0.000889 3321 Retail Services - Furniture and home furnishings 9.66E-05 3323 Retail Services - Building material and garden supply 0.001584 3324 Retail Services - Food and beverage 0.196583 3326 Retail Services - Gasoline stations 0.016591 3329 Retail Services - General merchandise 0.006296 3330 Retail Services - Miscellaneous 0.00834 3436 Noncomparable foreign imports 0.006314
Ice expenses were allocated based on the IMPLAN default margin table for sector 70 (soft drink and ice manufacturing).
Sector Title Proportion

43
3070 Soft drinks and manufactured ice 0.628331 3319 Wholesale trade distribution services 0.10275 3333 Rail transportation services 0.000222 3334 Water transportation services 3.14E-05 3335 Truck transportation services 0.006453 3324 Retail Services - Food and beverage 0.193154 3326 Retail Services - Gasoline stations 0.069058
Total 1.000000
Repair and maintenance expenses for vessel gear and equipment were allocated to sector 290, which includes ship building and repairing.
Sector Title Proportion 3290 Ships 1.00
Total 1.00
Moorage expenses were allocated to sector 410, which includes the activities of marinas. Marinas usually offer mooring, dockage, and haul out services for a fee.
Sector Title Proportion 3410 Other amusement and recreation 1.00
Total 1.00
Insurance expenses for vessels were allocated to sector 357, which includes establishments primarily engaged in underwriting and assuming the risk of insurance policies.
Sector Title Proportion 3357 Insurance 1.00
Total 1.00
Interest and financial services were allocated to sector 354, which includes establishments primarily engaged in financial services.
Sector Title Proportion 3354 Monetary authorities and depository credit services 1.00
Total 1.00
Purchases and leases of permits were allocated to IMPLAN’s value-added sector, other income.
Sector Title Proportion Value-added Other Income 1.00
Total 1.00
Enforcement expenses were allocated to sector 416, which includes electronic and precision equipment repair and maintenance.
Sector Title Proportion
3416 Electronic and precision equipment repairs and maintenance 1.00

44
Total 1.00
Dues were allocated to sector 425, which includes civic, social, professional, and similar organizations.
Sector Title Proportion 3425 Civic, social, and professional services 1.00
Total 1.00
Moorage expenses were allocated to sector 410, which includes the activities of marinas. Marinas usually offer mooring, dockage, and haul out services for a fee.
Sector Title Proportion 3410 Other amusement and recreation 1.00
Total 1.00
Freight supplies expenses were allocated using the default IMPLAN margin table for sector 126 (paperboard container manufacturing).
Sector Title Proportion 3107 Paperboard containers 0.581083 3319 Wholesale trade distribution services 0.016356 3332 Air transportation services 0.000463 3333 Rail transportation services 0.026539 3335 Truck transportation services 0.130381 3330 Retail Services - Miscellaneous 0.245178
Total 1.000000
Offloading expenses were allocated to sector 410, which includes the activities of marinas. Marinas usually offer mooring, dockage, and haul out services for a fee.
Sector Title Proportion 3410 Other amusement and recreation 1.00
Total 1.00
Truck transportation was allocated to sector 335, truck transportation.
Sector Title Proportion 3335 Truck transportation services 1.00
Total 1.00
All other vessel expenditures were allocated according to proportions contained in the production function of the default commercial fishing sector in IMPLAN. This allocation scheme is identical to that developed by Steinback and Thunberg (2006) for the miscellaneous trip supplies cost category in the Northeast Region Commercial Fishing Input-Output Model. They summed the absorption coefficients associated with the manufacturing sectors that produce the commodities used in the commercial fishing production function and allocated the commodity expenditures to the appropriate manufacturing industries. Additionally, their

45
estimates include average wholesale, transportation, and retail margins across all the manufacturing sectors since the majority of these purchases occur at the retail level.
Sector Title Proportion 3083 Curtains and linens 0.008560 3085 All other textile products 0.007716 3105 Paper from pulp 0.040025 3107 Paperboard containers 0.180838 3109 All other paper bag and coated and treated paper 0.023750 3138 Soaps and cleaning compounds 0.047259 3138 Soaps and cleaning compounds 0.040146
3142 Plastics packaging materials and unlaminated films and sheets 0.054372
3149 Other plastics products 0.008319 3150 Tires 0.006631
3216 Air conditioning, refrigeration, and warm air heating equipment 0.007234
3225 Other engine equipment 0.074987 3227 Air and gas compressors 0.004581
3256 Watches, clocks, and other measuring and controlling devices 0.007475
3259 Electric lamp bulbs and parts 0.012176 3266 Power, distribution, and specialty transformers 0.005184 3271 Primary batteries 0.010247 3283 Motor vehicle parts 0.047500 3333 Rail transportation services 0.001000 3319 Wholesale trade distribution services 0.161000 3323 Retail Services - Building material and garden supply 0.001000 3324 Retail Services - Food and beverage 0.185000 3326 Retail Services - Gasoline stations 0.013000 3329 Retail Services - General merchandise 0.014000 3330 Retail Services - Miscellaneous 0.038000
Total 1.000000
Tax expenditures for state and West Coast models were allocated to IMPLAN’s State and Local Government Non-Education expenditure vector.
Sector Title Proportion Institution Spending Pattern State and Local Government Non-Education 1.00
Total 1.00
Wages and salaries of employees (captain and crew) were allocated to the value-added sector, employee compensation.
Sector Title Proportion Value-added Employee compensation 1.00
Total 1.00
Vessel residuals were allocated to the value-added sector, proprietary income.

46
Sector Title Proportion Value-added Proprietary income 1.00
Total 1.00
Seafood Processors
Seafood processor purchases were allocated as follows.
Additives
Commodity Title Proportion 3046 Shortening and margarine and other fats and oils products 0.5860
3059 Processed animal (except poultry) meat and rendered byproducts 0.1989
3045 Soybean oil and cakes and other oilseed products 0.1428 3044 Corn sweeteners, corn oils, and corn starches 0.0077 3126 Other basic organic chemicals 0.0647
Total 1.000000
Custom processing was allocated to the processed seafood commodity.
Sector Title Proportion 3061 Seafood products 1.0000
Total 1.00
Electrical utility expenses
Sector Title Proportion 3031 Electricity, and distribution services 1.0000
Total 1.00
Freight expenses
Sector Title Proportion 3335 Truck transportation services 0.853 3333 Rail transportation services 0.039 3332 Air transportation services 0.108
Total 1.00
Insurance expenses
Sector Title Proportion 3357 Insurance 1.0000
Total 1.00

47
Natural gas and propane gas expenses
Sector Title Proportion
3032 Natural gas, and distribution services 0.9924
3020 Oil and natural gas 0.0076 Total 1.00
Offsite storage and freezing
Sector Title Proportion 3340 Warehousing and storage services 1.000
Total 1.00
Packaging
Sector Title Proportion 3107 Paperboard containers 0.8034 3108 Coated and laminated paper, packaging paper and plastics film 0.1392 3105 Paper from pulp 0.0091 3146 Polystyrene foam products 0.0048 3142 Plastics packaging materials and unlaminated films and sheets 0.0435
Total 1.000000
Production supplies
Sector Title Proportion 3327 Retail Services - Clothing and clothing accessories 0.2941 3325 Retail Services - Health and personal care 0.2206 3329 Retail Services - General merchandise 0.4853
Total 1.000000
Rental or lease of buildings, job-site trailers, and other structures
Sector Title Proportion
3360 Real estate buying and selling, leasing, managing, and related services 1.0000
Total 1.00
Rental or lease of processing machinery or equipment
Sector Title Proportion 3365 Commercial and industrial machinery and 1.0000
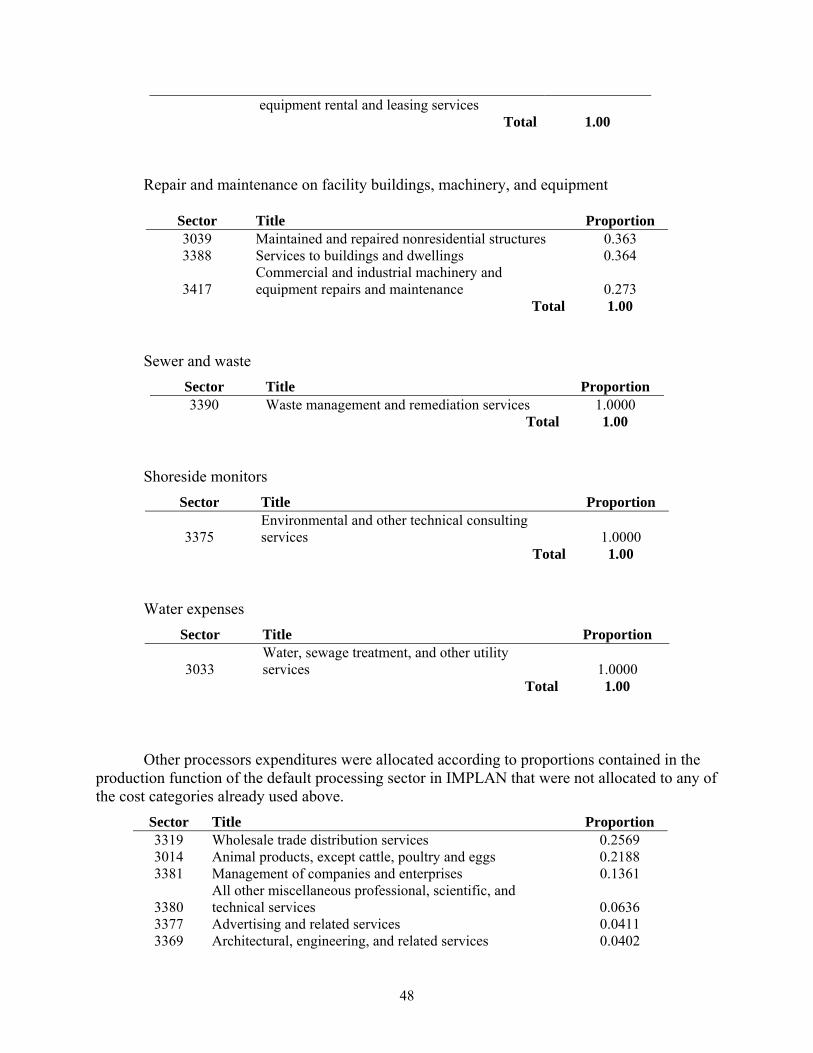
48
equipment rental and leasing services Total 1.00
Repair and maintenance on facility buildings, machinery, and equipment
Sector Title Proportion 3039 Maintained and repaired nonresidential structures 0.363 3388 Services to buildings and dwellings 0.364
3417 Commercial and industrial machinery and equipment repairs and maintenance 0.273
Total 1.00
Sewer and waste
Sector Title Proportion 3390 Waste management and remediation services 1.0000
Total 1.00
Shoreside monitors
Sector Title Proportion
3375 Environmental and other technical consulting services 1.0000
Total 1.00
Water expenses
Sector Title Proportion
3033 Water, sewage treatment, and other utility services 1.0000
Total 1.00
Other processors expenditures were allocated according to proportions contained in the production function of the default processing sector in IMPLAN that were not allocated to any of the cost categories already used above.
Sector Title Proportion 3319 Wholesale trade distribution services 0.2569 3014 Animal products, except cattle, poultry and eggs 0.2188 3381 Management of companies and enterprises 0.1361
3380 All other miscellaneous professional, scientific, and technical services 0.0636
3377 Advertising and related services 0.0411 3369 Architectural, engineering, and related services 0.0402

49
3354 Monetary authorities and depository credit intermediation services 0.0294
3190 Metal cans, boxes, and other metal containers (light gauge) 0.0189 3351 Telecommunications 0.0170 3366 Leasing of nonfinancial intangible assets 0.0135 3362 Automotive equipment rental and leasing services 0.0132 3374 Management, scientific, and technical consulting services 0.0125 3367 Legal services 0.0119
3368 Accounting, tax preparation, bookkeeping, and payroll services 0.0106
3413 Restaurant, bar, and drinking place services 0.0097
3338 Scenic and sightseeing transportation services and support activities for transportation 0.0084
3376 Scientific research and development services 0.0074
3356 Securities, commodity contracts, investments, and related services 0.0068
3414 Automotive repair and maintenance services, except car washes 0.0061
3149 Other plastics products 0.0047
3373 Other computer related services, including facilities management 0.0047
3425 Civic, social, and professional services 0.0043 3118 Petroleum lubricating oils and greases 0.0042 3411 Hotels and motel services, including casino hotels 0.0041 3021 Coal 0.0041 3202 Other fabricated metals 0.0040 3112 All other converted paper products 0.0035 3355 Nondepository credit intermediation and related services 0.0034 3372 Computer systems design services 0.0030
3416 Electronic and precision equipment repairs and maintenance 0.0028
3386 Business support services 0.0026 3138 Soaps and cleaning compounds 0.0025
3236 Computer terminals and other computer peripheral equipment 0.0022
3375 Environmental and other technical consulting services 0.0021
3432 Products and services of State & Local Govt enterprises (except electric utilities) 0.0021
3433 Used and secondhand goods 0.0019 3418 Personal and household goods repairs and maintenance 0.0019 3352 Data processing- hosting- ISP- web search portals 0.0018 3384 Office administrative services 0.0015 3148 Plastics bottles 0.0014 3336 Transit and ground passenger transportation services 0.0014
3363 General and consumer goods rental services except video tapes and discs 0.0014
3382 Employment services 0.0010 3389 Other support services 0.0009 3405 Independent artists, writers, and performers 0.0008 3247 Other electronic components 0.0008 3216 Air conditioning, refrigeration, and warm air heating 0.0007

50
equipment 3320 Retail Services - Motor vehicle and parts 0.0006 3283 Motor vehicle parts 0.0006 3387 Investigation and security services 0.0006 3331 Retail Services - Nonstore, direct and electronic sales 0.0005 3106 Paperboard from pulp 0.0005 3324 Retail Services - Food and beverage 0.0005 3415 Car wash services 0.0004 3195 Machined products 0.0004
3404 Promotional services for performing arts and sports and public figures 0.0004
3228 Material handling equipment 0.0003 3323 Retail Services - Building material and garden supply 0.0003 3407 Fitness and recreational sports center services 0.0003 3239 Other communications equipment 0.0003 3141 All other chemical products and preparations 0.0002 3403 Spectator sports 0.0002 3326 Retail Services - Gasoline stations 0.0002 3410 Other amusements and recreation 0.0002 3266 Power, distribution, and specialty transformers 0.0002 3330 Retail Services - Miscellaneous 0.0002 3163 Other concrete products 0.0002 3259 Electric lamp bulbs and parts 0.0002 3322 Retail Services - Electronics and appliances 0.0002 3321 Retail Services - Furniture and home furnishings 0.0002 3370 Specialized design services 0.0001 3328 Retail Services - Sporting goods, hobby, book and music 0.0001 3237 Telephone apparatus 0.0001 3238 Broadcast and wireless communications equipment 0.0001 3402 Performing arts 0.0000 3313 Office supplies (except paper) 0.0000
Total 1.000000
Wages and salaries of employees were allocated to the value-added sector, employee compensation.
Sector Title Proportion Value-added Employee compensation 1.00
Total 1.00
Processor residuals were allocated to the value-added sector, proprietary income.
Sector Title Proportion Value-added Proprietary income 1.00
Total 1.00