Embed Size (px)
Citation preview

1
Inpatient Glucose Control:How Low Should We Go?
A. Keith CryarDivision of Endocrinology
Scott and White Clinic

2
Diabetes in Hospitalized Patients
• Fourth most common co-morbid condition among hospitalized patients
• 10–12% of all hospital discharges
• 29% of all cardiac surgery patients
• 1–3 days longer hospital stay
Hogan P, et al. Diabetes Care. 2003;26:917–932.

3
The Increasing Rate of Diabetes Among Hospitalized Patients
Hospitalizations for Diabetes as a Listed Diagnosis
0
1
2
3
4
5
1991 1992 1993 1994 1995 1996 1997 1998 1999 2000 2001
Hospital Discharges (millions)
48%↑
Available at: http://www.cdc.gov/diabetes/statistics/dmany/fig1.htm, June 15, 2004.

4
Hospital Costs Account for Majority of Total Costs of Diabetes
Per Capita Healthcare Expenditures (2002)
0
1,000
2,000
3,000
4,000
5,000
6,000
7,000
Inpatient Nursing Home Physician'sOffice
OutpatientPrescription
Insulin andSupplies
Dollars
Diabetes Without diabetes
Hogan P, et al. Diabetes Care. 2003;26:917–932.

5
Higher Costs:Diabetes in Hospitalized Patients
• Higher rate of hospitalization
• Longer stays
• More procedures, medications
• Chronic complications
• More arteriosclerotic disease
• More infections

6
Hyperglycemia in Patients With Undiagnosed Diabetes
• Hyperglycemia occurred in 38% of patients admitted to the hospital
• 26% had known history of diabetes• 12% had no history of diabetes
• Newly discovered hyperglycemia was associated with:• Higher in-hospital mortality rate (16%) compared with patients
with a history of diabetes (3%) and patients with normoglycemia (1.7%; both P < 0.01)
• Longer hospital stays; higher admission rates to intensive care units
• Less chance to be discharged to home (required more transitional or nursing home care)
Umpierrez GE, et al. J Clin Endocrinol Metab. 2002;87:978–982.

7
Hyperglycemia Is an Independent Marker of Inpatient Mortality in Patients With Undiagnosed Diabetes
P < 0.01
1.73
16
02468
1012141618
In-hospital Mortality Rate
(%)
Newly Discovered
Hyperglycemia
Patients With History of Diabetes
Patients With
Normoglycemia
P < 0.01
Adapted from Umpierrez GE, et al. J Clin Endocrinol Metab. 2002;87:978–982.

8
Associations Between Glucose Levels and Inpatient Outcomes
• Hyperglycemia is a risk factor for• Mortality in critically ill patients • Complications of myocardial infarction• Complications of strokes • Complications of vascular and cardiac surgery

9
Intensive Glucose Management in Critically Ill Patients
• Hyperglycemia in the ICU is a common problem, caused by insulin resistance, and is considered an adaptive mechanism
• Historically, hyperglycemia has been treated only at very high levels
• Evidence suggests a close correlation between hyperglycemia and clinical outcome

10
Hospital Mortality Rate and Mean Glucose Levels in Critically Ill Patients
0
5
10
15
20
25
30
35
40
45
80–99 100–119 120–139 140–159 160–179 180–199 200–249 250–299 > 300
Mortality Rate (%)
Mean Glucose Value (mg/dL)
Retrospective review of 1,826 consecutive intensive care unit patients at The Stamford Hospital in Stamford, Connecticut. Krinsley JS. Mayo Clin Proc. 2003;78:1471–1478.

11
Mean Glucose Values (mg/dL)
• Survivors: 137.9
• Nonsurvivors: 172.0
p < 0.0001
Retrospective review of 1,826 consecutive intensive care unit patients at The Stamford Hospital in Stamford, Connecticut. Krinsley JS. Mayo Clin Proc. 2003;78:1471–1478.

12
Intensive Insulin Therapy in Critically Ill Surgical Patients
• Setting: surgical intensive care unit in University Hospital, Leuven, Belgium
• Hypothesis: normalization of blood glucose levels with insulin therapy can improve prognosis of patients with hyperglycemia or insulin resistance
• Design: prospective, randomized, controlled study
• Conventional: insulin when blood glucose > 215 mg/dL
• Intensive: insulin when glucose > 110 mg/dL and maintained at 80–110 mg/dL
van den Berghe G, et al. N Engl J Med. 2001;345:1359–1367.

13
Intensive Insulin Therapy in Critically Ill Surgical Patients
No serious hypoglycemic events.5.2%0.8%% BG < 40 mg/dL
100%39%% receiving insulin
103153Mean AM blood glucose achieved (mg/dL)
IntensiveConventional
van den Berghe G, et al. N Engl J Med. 2001;345:1359–1367.

14
Intensive Insulin Therapy in Critically Ill Surgical Patients Improves Survival
100
Intensive treatment96
92Survival in ICU (%) Conventional treatment
88
84
80
00
20 40 60 80 100 120 140 160Days After Admission
Conventional: insulin when blood glucose > 215 mg/dL.Intensive: insulin when glucose > 110 mg/dL and maintained at 80–110 mg/dL.
van den Berghe G, et al. N Engl J Med. 2001;345:1359–1367.Copyright ©2001 Massachusetts Medical Society. All rights reserved.

15
Intensive Insulin Therapy in Critically Ill Surgical Patients: Morbidity and Mortality Benefits
• Intensive therapy to achieve blood glucose levels of 80–110 mg/dL reduced mortality (-34%), sepsis (-46%), dialysis (-41%), blood transfusion (-50%), and polyneuropathy (-44%)
van den Berghe G, et al. N Engl J Med. 2001;345:1359–1367.
-60
-50
-40
-30
-20
-10
0
Reduction(%)
Mortality Sepsis Dialysis PolyneuropathyBlood
Transfusion
34%
46%41%
44%50%
N = 1,548

16
Safety of Insulin Infusion
• A titration algorithm achieved and maintained blood glucose levels at < 110 mg/dL
• Insulin requirements were highest and most variable during first 6 hours of intensive care
• Normoglycemia was reached within 24 hours with a mean daily insulin dose of 77 IU; maintained with 94 IU on day 7
• Blood glucose was monitored every 4 hours by ABG • Statistically significant, but clinically harmless,
hypoglycemia was observed briefly • 5.2% of intensive insulin-treated patients• 0.8% of conventionally treated patients
van den Berghe G, et al. N Engl J Med. 2001;345:1359–1367.

17
“Effect of an intensive glucose management protocol on the mortality
of critically ill adult patients”
Krinsley JS. Mayo Clin Proc. 2004;79:992–1000.

18
Study Design
• “Before-and-after” design
• University-affiliated community hospital
• Mixed medical/surgical/cardiac ICU
• Medical and surgical house staff, but no fellows or research nurses
Krinsley JS. Mayo Clin Proc. 2004;79:992–1000

19
Treatment Goals
• Blood glucose < 140 mg/dL
• Overview• Frequent FSG checks• Insulin IV infusion if > 200 twice in a row• Intensive regular insulin coverage otherwise
Krinsley JS. Mayo Clin Proc. 2004;79:992–1000

20
Mortality
• Baseline hospital mortality rate = 20.9%
• Treatment hospital mortality rate = 14.8%• 6.1% absolute reduction• 29.3% relative reduction
• p = 0.002
Krinsley JS. Mayo Clin Proc. 2004;79:992–1000

21
New Renal Insufficiency
• Defined as • baseline SCr < 1.5 with maximum > 2.5 • baseline > 1.5 with maximum 2X baseline
• Baseline group—12 patients
• Treatment group—3 patients• p = 0.034
Krinsley JS. Mayo Clin Proc. 2004;79:992–1000

22
Transfusion Requirements
• Patients requiring PRBC transfusion• Baseline 25.2%• Treatment 20.5%
• 18.7% relative reduction; p = 0.035
• Units per patient: 3.8 vs. 3.3; p = 0.169• Excludes patients admitted with acute GI bleed (50,
44)
Krinsley JS. Mayo Clin Proc. 2004;79:992–1000

23
ICU Length of Stay
p = 0.011
No difference in post-ICU LOS
3.23.6Mean LOS (days)
1.61.9Median LOS (days)
TreatmentBaseline
Krinsley JS. Mayo Clin Proc. 2004;79:992–1000

24
Incidence of Hypoglycemia
• Percentage of glucose values < 40 mg/dL• Baseline—0.35% • Treatment—0.34%
• No Adverse Clinical Consequences
Krinsley JS. Mayo Clin Proc. 2004;79:992–1000

25
Summary: Glycemic Control in Critically Ill Patients
• Prospective, randomized data show a strong correlation between intensive insulin therapy (goal < 110 mg/dL) and improved outcomes in critically ill patients with hyperglycemia
• Data reproducible in medical/surgical units(goal < 140 mg/dL)
• Intervention is simple, safe, and inexpensive

26
Cardiac Surgery and Diabetes
• Patients with diabetes comprise 29% of surgical population
• Associated with:• Longer stay• Greater infection rate• Higher operative mortality• Worse long-term prognosis

27
Diabetes in Open Heart Surgery Portland St. Vincent Medical Center
2467 diabetic patients
• Control Group
• N = 968
• 1987–1991
• SubQ Insulin q 4 h
• Goal 200 mg/dL
• All Mean BG’s < 200 47%
• Study Group
• N = 1499
• 1991–1997
• IV Insulin
• Goal 150–200 mg/dL
• All Mean BG’s < 200 84%
Furnary et al, The 34th Meeting of The Society of Thoracic Surgeons New Orleans, LA January 26, 1998

28
Portland Diabetic Project: Incidence of DSWI and Impact of Implementation
of Insulin Infusion Protocols
4.0
CII3.0
Patients withoutdiabetes
Patients with diabetes DSWI(%) 2.0
1.0
0.087 88 89 90 91 92 93 94 95 96 97
YearDSWI = deep sternal wound infection; CII = continuous insulin infusion.
Furnary AP, et al. Ann Thorac Surg. 1999;67:352–362

29
Portland Diabetic Project:Rate of Deep Sternal Wound Infection Rates With
Different Insulin Protocols
0.0
0.5
1.0
1.5
2.0
SQI CII
Deep Wound Infection Rate (%)
2.0%
0.8%
P = 0.01
Furnary AP, et al. Ann Thorac Surg. 1999;67:352–362.

30
Glucose Control Lowers Risk of Wound Infection in Patients With Diabetes After Cardiac Surgery
0
10
20
30
40
50
60
70
100–150 150–200 200–250 250–300
Deep Wound Infection Rate (%)
13% 16%25%
67%
Day 1 Blood Glucose (mg/dL)
P = 0.002
Zerr KJ, et al. Ann Thorac Surg. 1997;63:356–361

31
Impact of Deep Sternal Wound Infection
• Additional cost per patient was $26,400
• Additional length of stay was 16 days
• Mortality increase 5 times
Furnary AP, et al. Ann Thorac Surg. 1999;67:352–360.

32
Portland Diabetes Project: Mortality
10
CII
Patients withoutdiabetes
8
Patients with diabetes 6Mortality
(%)4
2
087 88 89 90 91 92 93 94 95 96 97 98 99 00 01
Year
Furnary AP, et al. J Thorac Cardiovasc Surg. 2003;125:1007–1021

33
Portland Diabetes Project:Mortality Versus Hyperglycemia
1.8%
5.0%
Blood Glucose < 200 Blood Glucose > 200
(N = 2,110) Glucose goal < 200 mg/dL
P = 0.001
6.1
4.9
3.7
2.4
1.2
0.0
Mortality(%)
Furnary AP, et al. Circulation. 1999;18:3113 (abstract).

34
CII Reduces Mortality in Patients With Diabetes Undergoing Cardiovascular Surgery
0
2
4
6
8
10
12
14
16
< 150 150–175 175–200 200–225 225–250 > 250
Mortality(%)
Average Postoperative Glucose (mg/dL)
Cardiac-related mortality
Noncardiac-related mortality
0.9% 1.3%2.3%
4.1%
6.0%
14.5%
Furnary AP, et al. J Thorac Cardiovasc Surg. 2003;125:1007–1021

35
Summary • Diabetes mellitus is a risk factor for mortality after
cardiac surgery • Preoperative hyperglycemia is an independent predictor
of deep sternal wound infection and total length of hospital stay after open heart surgery
• Incidence of deep wound infection is reduced after insulin protocol implementation to maintain mean blood glucose levels < 200 mg/dL in postoperative period
• Continuous insulin infusion should be standard of care for glycometabolic control in patients with diabetes undergoing cardiac surgery

36
Hyperglycemia and Risk of Infection in General Surgery Patients
• One hundred initially uninfected patients with diabetes undergoing elective surgery
• Stratified into 2 groups• All glucose values < 220 mg/dL• At least one glucose values > 220 mg/dL
• Glucose > 220 mg/dL on postoperative day 1 is • A sensitive predictor of nosocomial infection• Associated with
• 2.7 times higher rate of infection• Excluding minor UTI, 5.9 times higher rate of severe infection
Pomposelli JJ, et al. J Parenter Enteral Nutr. 1998;22:77–81.

37
Hyperglycemia and Acute MI
• Diabetes is an independent risk factor for mortality in acute MI
• The higher the serum glucose, the greater the risk for mortality
Braunwald E. N Engl J Med. 1997;337:1360–1369. 2. Malmberg K. Eur Heart J. 1988;9:259–264. Norhammar A, et al. Eur Heart J. 2003;24:838–844 4. Mukamal KJ, et al. Diabetes Care. 2001;24:1422–1427.Malmberg K, et al. Circulation. 1999;99:2626–2632. 6. Lewis EF, et al. J Am Coll Cardiol. 2003;42:1446–1453.Wahab NN, et al. J Am Coll Cardiol. 2002;40:1748–1754. 8. Bolk J, et al. Int J Cardiol. 2001;79:207–214.Norhammar A, et al. J Am Coll Cardiol. 2004;43:585–591.

38
Hyperglycemia and Mortality in Post-MI Patients
• Diabetes confers a doubling of risk for early mortality in MI • This increased risk occurs despite advances in cardiac care1
• 1-year mortality in patients with diabetes is higher (especially in younger patients)2,3
• Long-term mortality and hyperglycemia• Diabetes and long-term survival following acute MI:
comparable to risk of having had prior MI but no diabetes4
• Total long-term mortality correlates with glucose5
• Cholesterol and Recurrent Events trial (CARE): diabetes is a major predictor of late CHF and death in survivors of MI6
1. Braunwald E. N Engl J Med. 1997;337:1360–1369. 2. Malmberg K. Eur Heart J. 1988;9:259–264. 3. Norhammar A, et al. Eur Heart J. 2003;24:838–844 4. Mukamal KJ, et al. Diabetes Care. 2001;24:1422–1427. 5. Malmberg K, et al. Circulation. 1999;99:2626–2632. 6. Lewis EF, et al. J Am Coll Cardiol. 2003;42:1446–1453.

39
Hyperglycemia and Mortality in Post-MI Patients
• Admission glucose level is predictive of outcome• Admission blood glucose relates to hospital
mortality and risk for CHF in MI1
• Admission plasma glucose level predicts 1-year mortality following acute MI2
• Meta-analyses: hyperglycemia (> 110 mg/dL) with or without a prior diagnosis of diabetes increases in-hospital mortality and CHF in MI patients3
1. Wahab NN, et al. J Am Coll Cardiol. 2002;40:1748–1754, 2. Bolk J, et al. Int J Cardiol. 2001;79:207–214. 3. Capes SE, et al. Lancet. 2000;355:773–778.

40
Diabetes and Long-term Survival Following Acute MI: Comparability of Risk With Prior MI
PatientsAlive
FollowingAcute MI
(%)Patients without diabetes = 1,525Patients with diabetes = 396
No diabetes No diabetes No diabetes with prior MINo diabetes with prior MIDiabetesDiabetesDiabetes with prior MIDiabetes with prior MI
65432100.0
0.2
0.4
0.6
0.8
1.0 NIH ONSET STUDY
YearsMI = myocardial infarction; NIH = National Institutes of Health.
Mukamal KJ, et al. Diabetes Care 2001;24:1422–1427

41
Admission Blood Glucose Relates to Hospital Mortality and Risk for CHF in MI
CHF = congestive heart failure; MI = myocardial infarction; DM = diabetes mellitus.
(n = 1,078) (n = 135) (n = 167) (n = 282)(n = 282)
0
10
20
30
40
8.1%
23.7%
18.3% 18.8%
0
10
20
30
40
13.3%
32.6%
18.9%
35.5%
- DM≤ 198 mg/dL
- DM> 198 mg/dL
+ DM≤ 198 mg/dL
+ DM> 198 mg/dL
- DM≤ 198 mg/dL
- DM> 198 mg/dL
+ DM≤ 198 mg/dL
+ DM> 198 mg/dL
In-hospital Mortality CHF
P < 0.0001
PercentagePercentage
Wahab NN, et al for the CONS Investigators. J Am Coll Cardiol. 2002;40:1748–1754

42
Admission Plasma Glucose Level Following Acute MI Independently Predicts 1-year Mortality
Even in Absence of Diabetes
0
10
20
30
40
50
< 100 mg/dL 101–150 mg/dL 151–198 mg/dL > 198 mg/dL
Glucose Levels
Mortality (%)
Bolk J, et al. Int J Cardiol. 2001;79:207–214.

43
In Patients With Unstable Angina,Higher Event Rates in Patients With Diabetes
Independent predictors for composite primary endpoint (death or MI)
RR 95% CI
2.61 (1.88–3.60)
1.80 (1.35–2.40)
1.84 (1.34–2.54)
0.69 (0.53–0.90)
1.37 (1.05–1.80)
1.22 (1.02–1.48)0.5
Diabetes
Previous MI
Troponin T > 0.03 µg/L
Invasive strategy
ST-depression > 1 mm
Age years
Norhammar A, et al. J Am Coll Cardiol. 2004;43:585–591
CI = confidence interval, RR = risk ratio.
1 4

Overview of GIK Therapy for Acute MI: A 30-year Perspective
MRCMRC 21.4 23.6 -5.1 41.519681968
PentecostPentecost 15.0 16.0 -0.5 6.519681968
HjermannHjermann 10.6 20.0 -4.8 6.8 P = 0.0719711971
RogersRogers 6.5 12.3 -1.9 2.419831983
HengHeng 8.3 0.0 0.6 0.219771977
SatlerSatler 0.0 0.0 0.0 0.019871987GIKGIK ControlControl OO--EE VarianceVarianceMortality Rate (%)Mortality Rate (%)StudyStudy
GIK BetterGIK Better Placebo BetterPlacebo BetterOdds Ratio and Odds Ratio and ClsClsYearYear
StanleyStanley 7.3 16.4 -2.5 2.819781978
All Patients 16.1 21.0 -24.0 70.4 P = 0.004MittraMittra 11.8 28.3 -7.0 6.8 P = 0.00719651965
PilcherPilcher 13.9 29.3 -2.6 3.419671967
1GIK = glucose–insulin–potassium; MI = myocardial infarction; CI = confidence interval.Fath-Ordoubadi F, Beatt KJ. Circulation. 1997;96:1152–1156

45
The Effect of Pre-procedure FPG on RestenosisAfter Percutaneous Coronary Intervention
N = 162 with T2DM followed X9 months
12.7 16.0
42.1
31.3
605550454035302520151050
% TVR
p = 0.03p = 0.01
A1C < 7%Glucose < 135
A1C ≥ 7%Glucose < 135
A1C < 7%Glucose > 135
A1C ≥ 7%Glucose > 135
J Am Coll Cardiol. 2004;43(suppl A): Abstract 1062-43.

46
Diabetes and Insulin–Glucose Infusion in Acute MI Study (First DIGAMI)
• Prospective, randomized trial of 620 patients with acute MI and diabetes (blood glucose > 200 mg/dL)
• Intensive insulin therapy (glucose target of 126–180 mg/dL) or conventional treatment
• Intensive insulin treatment: IV insulin for > 24 hours, multiple daily injections (4/day for > 3 months)
• Stratification into 4 groups according to risk (high/low) and previous diabetes treatment (insulin/no insulin)
High risk: age > 70, previous MI, history of CHF, current treatment with digitalis.
Malmberg K, et al. J Am Coll Cardiol. 1995;26:57–65.Malmberg Kl. BMJ. 1997;314:1512–1515.
47
First DIGAMI: Insulin Therapy Improves Outcomes in Patients With MI
Standard treatment
IV insulin 48 hours, then 4 injections daily
(N = 620)Risk reduction (28%)P = 0.011
All subjects
P = 0.0004
Low-risk and not previously on insulin70 70
Malmberg K, et al. BMJ. 1997;314:1512–1515
0
3020
40
10
5060
0 1Follow-up (years)
2 3 4 5
(N = 272)60Risk reduction (51%)
5040Mortality
(%) 3020100
0 1 2 3 4 5Follow-up (years)
DIGAMI = Diabetes and Insulin-Glucose Infusion in Acute Myocardial Infarction.

48
First DIGAMI: Insulin Therapy Improves Long-term Survival in Patients With MI
All Patients
Control Patients IGI Patients MortalityIn-hospital 11% 9% ↓ 18% (p = NS)3 months 16% 12% ↓ 21% (p = NS)1 year 26% 19% ↓ 29% (p = 0.03)Total (3.4 years) 44% 33% ↓ 28% (p = 0.01)
DIGAMI = Diabetes and Insulin-Glucose Infusion in Acute Myocardial Infarction; IGI = insulin–glucose infusion.
Malmberg K, et al. J Am Coll Cardiol. 1995;26:57–65; Malmberg K. BMJ. 1997;314:1512–1515.

49
First DIGAMI: Subgroup AnalysisShort- and Long-term Benefits in
Patients With Diabetes• Significant mortality benefits evident prior to hospital discharge
Control Patients IGI Patients Mortality
In-hospital 12% 5% ↓ 58% (p < 0.05)
3 months 14% 7% ↓ 52% (p < 0.05)
1 year 18% 9% ↓ 52% (p < 0.02)
DIGAMI = Diabetes and Insulin-Glucose Infusion in Acute Myocardial Infarction; IGI = insulin–glucose infusion.

50
Glycemic Control in Patients With Acute MI
• First DIGAMI• Underscores the importance of early and
aggressive glucose control, regardless of prior diabetes status
Malmberg K. BMJ. 1997;314:1512–1515.
DIGAMI = Diabetes and Insulin-Glucose Infusion in Acute Myocardial Infarction; MI = myocardial infarction.

51
Cost-Effectiveness in First DIGAMI
For every 9 patients treated with intensive insulin regimen, one life was saved
DIGAMI = Diabetes and Insulin-Glucose Infusion in Acute Myocardial Infarction.
Almbrand B, et al. Eur Heart J. 2000;21:733–739.

52
Second DIGAMI
• Results were not confirmatory
• However:• Statistically powered for 3000, but only 1200
recruited• Did not achieve the glucose control needed• Entering diabetics were better controlled• Protocol violations with additional insulin
therapy in the control group

53
Hyperglycemia andAcute Myocardial Infarction: Summary
• Hyperglycemia increases in-hospital mortality and CHF in MI patients, regardless of previous diabetes history
• Mortality after MI is reduced by insulin therapy
• Results of DIGAMI• Underscore the importance of early and aggressive
glucose control, regardless of prior diabetes status• Insulin therapy is cost-effective
CHF = congestive heart failure; MI = myocardial infarction; DIGAMI = Diabetes and Insulin-Glucose Infusion in Acute Myocardial Infarction.

54
Link Between High Blood Glucose and Poor Outcomes: Potential Mechanisms
Transcription factors
Metabolic stress response↑ Stress hormones and peptides
GlucoseInsulin
FFAKetonesLactate
Cellular injury/apoptosisInflammation
Tissue damageAltered tissue/wound repair
AcidosisInfarction/ischemia
Immune dysfunction Reactive O2 species
Infection dissemination Secondary mediators
Prolonged hospital stayDisability
Death
From Clement S, et al. Diabetes Care 2004;27:553–591

55
Candidate Mechanisms for Insulin’s Protective Effects
• Enhances synthesis of endothelial Nitric Oxide
• Suppresses FFA
• Inhibits proinflammatory cytokines

56
Nitric Oxide• Inhibits
• Vascular smooth muscle cell growth and migration
• Platelet aggregation and thrombosis• Monocyte adhesion• Inflammation• Oxidation
• Under physiologic conditions, production from vascular endothelium contributes to coronary blood flow

57
FFA Causes Endothelial Dysfunctiony = 1361.182x r = 0.497 p < 0.005-0.310600
500
400Maximum ∆% in
Leg Blood Flow
300
200
100
00 1000 2000 3000 4000 5000 6000
FFAµmol
Change in LBF in response to the vasodilator methacholine chloride. Reprinted from Steinberg HO et al. J Clin Invest. 1997;100:1230-1239 with permission from the Copyright Clearance Center.”

58
Candidate Mechanism for Poor Outcome in Critically Ill: FFA
• Increased levels result in endothelial dysfunction
• Increased FFA associated with increased oxidative stress and cardiac sympathetic over-activity
1. Manzella D, et al. Diabetologia. 2002;45:1737–1738.2. Wilsson L, et al. Arterioscler Thromb Vasc Biol. 1998;18:1679–1685.

59
Pro-inflammatory Cytokines
• TNF-α, IL-6, IL-1, IL-2
• Data strongly suggest a cause/effect relationship as opposed to just a marker of inflammation

60
Insulin and Cytokines
• Hyperinsulinemia in the hyperglycemic environment leads to an increase in inflammatory cytokines
• Insulin deficiency in the hyperglycemic environment leads to a modest increase in inflammatory cytokines
• Hyperinsulinemia in the euglycemicenvironment suppresses inflammatory cytokines
Circ Res. 2000;87:746–752.Circulation. 2002;106:2067. Circulation. 2004;109:849.

61
Potential Benefits of Improving Glucose Control in the Hospital
• Reduce mortality• Reduce morbidity• Reduce costs of care
• Length of stay (LOS)• Cost of inpatient complications• Fewer rehospitalizations• Reduced extended care
• There is no evidence that the benefits observed in ICU settings disappear when patients are on regular floors

62
Insulin Therapy
• JCAHO considers insulin to be one of the 5 highest-risk medicines in the inpatient setting
• Primarily because the consequences of errors with insulin therapy can be catastrophic
JCAHO = Joint Commission on Accreditation of Hospitals Organization.

63
Glycemic Targets in Hospitalized Patients
• Intensive care unit• 110 mg/dL
• Medical/surgical floors• 110 mg/dL preprandial• 180 mg/dL maximal glucose• Values above 180 mg/dL are an indication to
monitor glucose levels more frequently to determine the direction of any glucose trend and the need for more intensive intervention
American Association of Clinical Endocrinologists Consensus

64
Indications for Intravenous Insulin Therapy: Summary
• Diabetic ketoacidosis• Nonketotic hyperosmolar
state• Critical care illness
(surgical, medical)• Postcardiac surgery• Myocardial infarction or
cardiogenic shock• NPO status in Type 1
diabetes
• Labor and delivery
• Glucose exacerbated by high-dose glucocorticoidtherapy
• Perioperative period
• After organ transplant
• Total parenteral nutrition therapy
American Association of Clinical Endocrinologists Consensus Conference

65
The Ideal IV Insulin Protocol
• Easily ordered (signature only or a minimal number of checks/circles)
• Effective (gets to goal quickly)
• Safe (minimal risk of hypoglycemia)
• Easily implemented

66
Various Protocols Exist• There are several protocols already proven to
be safe and effective • There is little justification in the efforts required to
develop an new institutional protocol
• DIGAMI (studied in acute MI setting)• van den Berghe (studied in critical care setting)• Portland protocol (used in surgical setting)• Markovitz (studied in postoperative heart
surgery patients)• Yale protocol (studied in medical intensive care
setting)

67
DIGAMI: Insulin RegimenInsulin drip: 80 U in 500 mL 5% dextrose (1 U/6 mL)
– Starting dose = 30 mL/h = 5 U/h – Subsequent rate adjustments:
Blood Glucose (mg/dL) Instructions≥ 270 8 U IV bolus, then ↑ drip by 1 U/h198–269 ↑ drip by 0.5 U/h126–197 Leave drip unchanged72–125 ↓ drip by 1 U/h≤ 71 Stop drip x 15 min.
When blood glucose > 156 mg/dL, restart drip ↓’d by 1 U/h
DIGAMI = Diabetes and Insulin-Glucose Infusion in Acute Myocardial Infarction.

68
DIGAMI: Insulin Regimen• Has the advantage of simplicity
• No provisions for individualized starting rates
• May be slow to get to target since initial rates and increases in the rates are small
• Rate adjustments fail to take into account the rate of change from previous
• Dilute insulin concentration requires higher volume infusions

69
Protocol of van den Berghe and Colleagues
Adjust insulin dose by 0.1–0.5 IU/hBG approaching normal range
Increase insulin dose by 0.5–1 IU/h110–140
Increase insulin dose by 1 IU/h> 140Measure glucoseevery 1–2 h until within normal range
Do not start insulin but continue BG monitoring every 4 h
< 110
Start insulin 1–2 IU/h220–110
Start insulin 2–4 IU/h> 220Measure glucoseon entry to ICU
ActionBlood Glucose Result (mg/dL)Test
van den Berghe G, et al. N Engl J Med. 2001;345:1359–1367.

70
Protocol of van den Berghe and Colleagues, continued
Stop insulin infusion, assure adequate baseline glucose intake, administer glucose per 10-g IV boluses and check BG within 1 h
< 40
Stop insulin infusion, assure adequate baseline glucose intake and check BG within 1 h
40–60
Reduce insulin dose and check BG within 1 h60–80
Reduce insulin dose by half and check more frequently
BG falling steeply
Insulin dose unchangedBG normal
Adjust insulin dose by 0.1–0.5 IU/hBG approaching normal range
Measure glucoseevery 4 h
ActionBlood Glucose Result (mg/dL)Test
van den Berghe G, et al. N Engl J Med. 2001;345:1359–1367.

71
Protocol of van den Berghe and Colleagues
• Has the advantage of simplicity
• Relies significantly on nursing experience• For example, there is no parameter to define if the
glucose is falling “steeply” and the rate needs to be halved
• May be slow to get to target for patients with high insulin requirements because the initial rates and increases in the rates are small (if the protocol is followed)

72
Portland Protocol for Continuous IV Insulin Infusion – Start up
86.516≥ 360
6.5512300–359
53.58240–299
3.524180–239
210120–179
10.5080–119
Type 1 DMPreoperatively
Type 2 DMPreoperatively
Initial Insulin Rate (Units/hour) (circle one)
Intravenous Insulin Bolus (U)
Blood Glucose (mg/dL)
Furnary AP, et al. Endocr Pract. 2004;10:21–33.

73
Portland Protocol for Continuous IV Insulin Infusion – Rate adjustments
If ≥ 30 mg/dL lower than last BG, keep same rate.If < 30 mg/dL lower than last test (OR if higher than last test), increase rate by 1 Unit/h Recheck BG in 30 minutes
151 - 180
If < 20 mg/dL lower than last test– increase rate by 0.5 units/h. If 20 - 80 mg/dL lower than last test – keep same rateIf more than 80 mg/dl lower – decrease rate by 25%.
111–150
Same rate -- EXCELLENT! You are in the Target Range!TITRATE DRIP AT WILL TO MAINTAIN BG in TARGET RANGE70–110
If ≥ last test result, continue current rate. If lower than last BG by 20 mg/dl or more, decrease rate by 50%If within 20 mg/dL of last BG, decrease rate by 0.5 units/hour.
60–69
Stop insulin; if previous BG >100, give 25 mL D50. Recheck BG in 30 minutesWhen BG > 60, restart with rate 50% of previous rate.
50–59
Stop insulin; give 25 mL D50; Recheck BG in 30 minutes. When blood glucose > 60, restart with rate 50% of previous rate.< 50
ActionBlood Glucose (mg/dL)
Furnary AP, et al. Endocr Pract. 2004;10:21–33. 73

Portland Protocol for Continuous IV Insulin Infusion – Provision for meal coverage
7 units SQ14 units SQ>10
6 units SQ12 units SQ8-10
5 units SQ10 units SQ6-8
4 units SQ8 units SQ4-6
3 units SQ6 units SQ2-4
2 units SQ4 units SQ 0-2
Eats < 50% of mealEats > 50% of mealDrip Rate

75
Portland Protocol for Continuous IV Insulin Infusion
• More complex and prescriptive than the van den Bergheprotocol
• Criteria for rate adjustments based on rate of rise or fall in the glucose
• Provision for meal coverage while on infusion• Available for various target ranges
• Not every area is ready for the published targets• They have also a floor insulin infusion protocol for patients
transitioning to the wards or not quite ill enough to warrant ICU admission

76
Protocol of Markovitz and Colleagues
Column 1 Column 2 Column 3 Column 4 Column 5 Column 6 CBG units/hr CBG units/hr CBG units/hr CBG units/hr CBG units/hr CBG units/hr < 70 off < 70 off < 70 off < 70 off < 70 off < 70 off 70- 79 off 70- 79 off 70- 79 off 70- 79 off 70- 79 0.5 70- 79 1 80- 89 off 80- 89 off 80- 89 off 80- 89 0.5 80- 89 1 80- 89 1.5 90- 99 off 90- 99 off 90- 99 0.5 90- 99 1 90- 99 1.5 90- 99 2 100-109 off 100-109 0.5 100-109 1 100-109 1.5 100-109 2 100-109 3 110-129 0.5 110-129 1 110-129 1.5 110-129 2 110-129 3 110-129 4 130-149 1 130-149 1.5 130-149 2 130-149 3 130-149 4 130-149 6 150-179 1.5 150-169 2 150-179 3 150-169 4 150-179 6 150-169 8 170-189 2.5 170-189 5 170-189 10 180-209 2 190-209 3 180-209 4 190-209 6 180-209 8 190-209 12 210-269 3 210-254 4 210-239 5 210-229 7 210-239 10 210-229 14 240-269 6 230-269 8 240-269 12 230-249 16 270-329 4 255-299 5 270-299 7 270-309 10 270-299 14 250-269 18 300-345 6 300-329 8 310-349 12 300-329 16 270-309 20 330-389 5 330-359 9 330-359 18 310-349 24 346-389 7 360-389 10 350-389 14 360-389 20 350-389 28 ≥ 390 6 ≥ 390 8 ≥ 390 11 ≥ 390 16 ≥ 390 22 ≥ 390 32
Adapted from Markovitz LJ, et al. Endocr Pract. 2002;8:10–18.

77
0
5
10
15
20
25
30
35
40
45
50 79 110 140 171 201 232 263 293 324 354 385 416 444 475
Blood Glucose (mg/dL)
Insulin Infusion Rate
(Units/h)
Column 1Column 2Column 3Column 4Column 5Column 6
Insulin Infusion Protocol Targeting Blood Glucose 80–110 mg/dL

78
Protocol of Markovitz and Colleagues
• Uses multiple columns of scales for varying degrees of insulin resistance
• Physician determines initial scale with nursing rules for moving to different columns
• Very simple to determine prescribed rate for nursing
• Logistical limitations on the number of scales and goals that can be supported
• Each range and sensitivity require another column
79
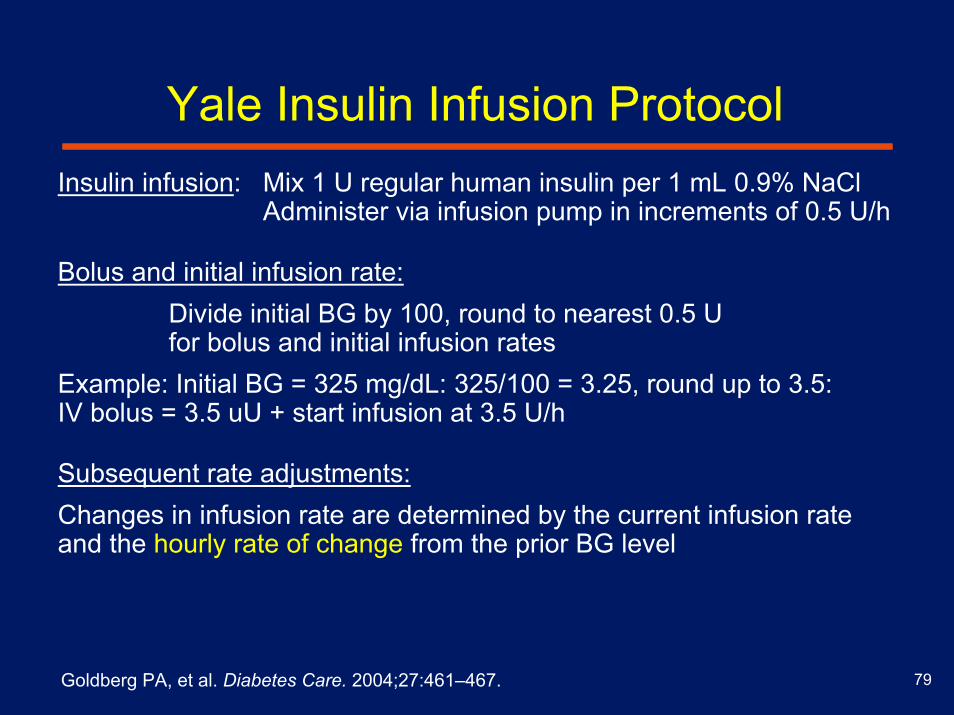
Yale Insulin Infusion ProtocolInsulin infusion: Mix 1 U regular human insulin per 1 mL 0.9% NaCl
Administer via infusion pump in increments of 0.5 U/h
Bolus and initial infusion rate:Divide initial BG by 100, round to nearest 0.5 U for bolus and initial infusion rates
Example: Initial BG = 325 mg/dL: 325/100 = 3.25, round up to 3.5: IV bolus = 3.5 uU + start infusion at 3.5 U/h
Subsequent rate adjustments:Changes in infusion rate are determined by the current infusion rate and the hourly rate of change from the prior BG level
Goldberg PA, et al. Diabetes Care. 2004;27:461–467.

80
Yale Insulin Infusion Protocol
• Individualized starting doses and highly responsive rate adjustments that compensate for insulin sensitivity and rate of glucose change
• Utilization requires substantial ongoing calculations to determine hourly rate of change
• May increase the likelihood of error in many clinical settings

81
Summary
• Several tested, safe protocols are available• Each has its own advantages and disadvantages
• Protocol development is time and resource intense:
• Consensus must be reached across multiple areas within the hospital, physician practice, nursing, pharmacy…
• The protocol then has to be tested for efficacy, safety, etc.
• Adoption of an established protocol is significantly more efficient

82
Use of Subcutaneous Insulin
• Effective insulin therapy must provide both basal and nutritional coverage to achieve target goals
• Hospitalized patients often require high insulin doses to achieve desired target glucose levels
• In addition to basal and nutritional insulin requirements, patients often require supplemental or correction insulin for treatment of unexpected hyperglycemia

83
Common Features Increasing Risk of Hypoglycemia in an Inpatient Setting
• Advanced age
• Decreased oral intake
• Chronic renal failure
• Liver disease
• Beta-blockers

84
Use of “Sliding Scale” Insulin Alone Is Discouraged
• Evidence does not support this technique without basal insulin because it has resulted in unacceptably high rates of
• Hyperglycemia• Hypoglycemia• Iatrogenic diabetic ketoacidosis in hospitalized
patients with Type 1 diabetes

85
Insulin Requirements in Health and Illness
Clement S, et al. Diabetes Care 2004;27:553–591
Units
CorrectionNutritionalPrandialBasal
Healthy Sick/Eating Sick/NPO

86
Constructing a profile for scheduled subcutaneous insulin
Lispro/ Aspart/ GlulysineSQ Regular
NPH Glargine
6 pm 12 am 6 am 12 pm

87
Example of Components of Standardized Subcutaneous Insulin Orders
NPH
Glargine
NPH
Glargine
NPH
Glargine
Give __ units:
NPH
Glargine
Basal insulin
Suggested lag times for prandial insulin:Lispro/aspart/glulysine —0–15 minutes before eatingRegular 30 minutes before eating.
Give __ units:
Lispro
Aspart
Regular
Give __ units:
Lispro
Aspart
Regular
Give __ units:
Lispro
Aspart
Regular
Give __ units:
Lispro
Aspart
Regular
Nutritionalinsulin
BedtimeDinnerLunchBreakfastInsulin

88
Factors Increasing Risk of Sub-optimal Glucose Control in an Inpatient Setting• Lack of coordination between dietary
and nursing leads to mistiming of insulin dosage with respect to food
• Inadequate glucose monitoring• Lack of coordination between transportation and nursing• Indecipherable orders• Separate locations for glucose results and insulin
administration records• Absent or poorly maintained glucose flow sheets
89
Core Knowledge for Physicians
• Impact of blood glucose on hospital outcomes
• Hospital targets for blood glucose
• Terminology: basal/nutritional/correction
• Insulin product knowledge
• Hypoglycemia prevention and treatment

90
Core Competencies for Nurses
• Bedside glucose monitoring technique
• Critical and target blood glucose values
• Insulin administration technique
• Optimum timing of SC insulin shots
• Hypoglycemia prevention and treatment
• Blood glucose and insulin dose documentation

91
Learning Objectives• Discuss the prevalence of hyperglycemia among
hospitalized patients • Discuss the impact of hyperglycemia on clinical outcome
and cost • Understand the background literature supporting
intensive glucose management • Understand the biochemical and physiological
mechanisms involved in intensive insulin therapy that reduce morbidity and mortality
• Compare existing protocols for achieving tight glucose control in an inpatient setting

92
The End
• Proceed to the post test
• Print the post test
• Complete the post test
• Return the post test to Dr. Sandra Oliver
407i TAMUII
93
Post test question 1
Which of the following correctly reflects the prevalence of hyperglycemia among hospitalized patients ?
1. Fourth most common co-morbid condition among hospitalized patients
2. 40-50% of all hospital discharges
3. 60% of all cardiac surgery patients
4. 7 days longer hospital stay

94
Post test question 2Which of the following is a false statement ?1. Diabetes mellitus is a risk factor for mortality after
cardiac surgery 2. Preoperative hyperglycemia is an independent
predictor of length of hospital stay after open heart surgery
3. Incidence of deep wound infection is increased after insulin protocol implementation to maintain mean blood glucose levels < 200 mg/dL in postoperative period
4. Continuous insulin infusion should be standard of care for glycometabolic control in patients with diabetes undergoing cardiac surgery

95
Post test question 3Evidence does not support use of sliding scale ALONE
because it results in unacceptably high rates of all the following except
1. Hyperglycemia
2. Hypoglycemia
3. Hypomagnesemia
4. Iatrogenic diabetic ketoacidosis in hospitalized patients with Type 1 diabetes

96
Post test question 4
Potential physiological mechanisms of hyperglycemia and poor outcomes includes all of the following except:
1. Accelerated catabolism
2. Increased transcription factors
3. Deceased FFA
4. Hypoinsulinemia.


![Reducing renal failure: how low do glucose levels need to go? · 2020-07-17 · VADT) [8–11] has added to our understanding of the relationship between glycemic control and kidney](https://img.dokumen.tips/doc/110x75/5f9934e064188827771f3e2f/reducing-renal-failure-how-low-do-glucose-levels-need-to-go-2020-07-17-vadt.jpg)