Embed Size (px)
Citation preview

Inorganic immersion fluids for ultrahigh numericalaperture 193 nm lithography
Jianming Zhou, Yongfa Fan, Anatoly Bourov, and Bruce W. Smith
Immersion lithography has become attractive since it can reduce critical dimensions by increasingnumerical aperture (NA) beyond unity. Among all the candidates for immersion fluids, those with higherrefractive indices and low absorbance are desired. Characterization of the refractive indices and absor-bance of various inorganic fluid candidates has been performed. To measure the refractive indices of thesefluids, a prism deviation angle method was developed. Several candidates have been identified for 193 nmapplication with refractive indices near 1.55, which is approximately 0.1 higher than that of water at thiswavelength. Cauchy parameters of these fluids were generated and approaches were investigated totailor the fluid absorption edges to be close to 193 nm. The effects of these fluids on photoresist perfor-mance were also examined with 193 nm immersion lithography exposure at various NAs. Half-pitch32 nm lines were obtained with phosphoric acid as the immersion medium at 1.5 NA. These fluids arepotential candidates for immersion lithography technology. © 2006 Optical Society of America
OCIS codes: 110.5220, 160.4760.
1. Introduction
As the required feature size of integrated circuits(ICs) decreases, various lithography methods havebeen studied. The critical dimension (CD) is propor-tional to the illumination wavelength and inverselyproportional to the numerical aperture (NA) of thelithography system.1 The current illumination sourcewavelength used for lithography is 193 nm. It is notpractical to reduce the CD size by wavelength reduc-tion due to the cost and material issues. The othermethod to reduce the CD is to increase the NA of theexposure tool. Immersion lithography has becomemore attractive since it can increase the NA by intro-ducing high refractive index media into the lithogra-phy system. As a convenient candidate, water wasreported as an immersion fluid by Smith et al. in2004.2 However, at 193 nm, the absolute refractiveindex of photoresist is typically 1.7 while the refrac-tive index of water is 1.436. The maximum NA islimited to the minimum of the refractive indices ofthe immersion media, the last lens element, and the
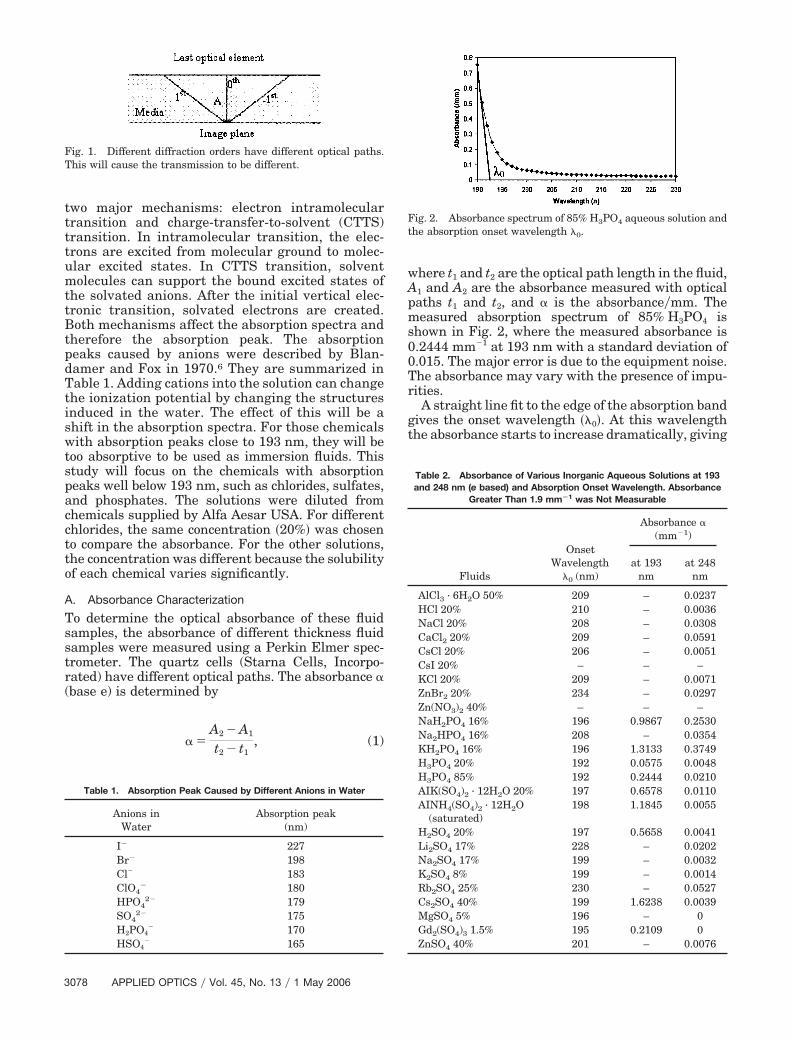
photoresist. To further increase the NA and reducereflection at the liquid–resist interface, it is necessaryto find an immersion fluid that has a refractive indexclose to 1.7. The absorbance of an immersion fluid iscritical and high absorbance is not desired due to tworeasons: (1) It will reduce the efficiency because ofenergy loss in the fluid. (2) As illustrated in Fig. 1, theoptical paths of different diffraction orders are differ-ent. Different optical paths will result in differenttransmission because transmission decreases expo-nentially with optical path length. This will eventu-ally reduce the modulation. Many research groupshave been pursuing immersion fluids with high indi-ces and low absorbance. Immersion fluids with indi-ces of refraction near 1.65 were reported by DupontCompany3 and Air Products and Chemicals, Incorpo-rated.4 However, comparing with water, the exposuretime was much longer due to high absorbance. In thispaper the optical properties of various inorganicfluids will be characterized and discussed, and theinterferometric immersion lithography results withthese fluids as immersion media will be presented.
2. Optical Properties of Inorganic Solutions
The refractive index of water can be changed byincorporating inorganic additives into it. However,the refractive index and the absorbance are corre-lated as described by Kramers–Kronig dispersionrelations.5 Increasing the fluid refractive index willcause the absorbance to increase as well. In inor-ganic solutions, the absorption peak is driven by
The authors are with the Microelectronic Engineering Depart-ment, Rochester Institute of Technology, 82 Lomb MemorialDrive, Rochester, New York 14623. J. Zhou’s e-mail address [email protected].
Received 20 July 2005; revised 4 October 2005; accepted 6 Oc-tober 2005.
0003-6935/06/133077-06$15.00/0© 2006 Optical Society of America
1 May 2006 � Vol. 45, No. 13 � APPLIED OPTICS 3077
two major mechanisms: electron intramoleculartransition and charge-transfer-to-solvent (CTTS)transition. In intramolecular transition, the elec-trons are excited from molecular ground to molec-ular excited states. In CTTS transition, solventmolecules can support the bound excited states ofthe solvated anions. After the initial vertical elec-tronic transition, solvated electrons are created.Both mechanisms affect the absorption spectra andtherefore the absorption peak. The absorptionpeaks caused by anions were described by Blan-damer and Fox in 1970.6 They are summarized inTable 1. Adding cations into the solution can changethe ionization potential by changing the structuresinduced in the water. The effect of this will be ashift in the absorption spectra. For those chemicalswith absorption peaks close to 193 nm, they will betoo absorptive to be used as immersion fluids. Thisstudy will focus on the chemicals with absorptionpeaks well below 193 nm, such as chlorides, sulfates,and phosphates. The solutions were diluted fromchemicals supplied by Alfa Aesar USA. For differentchlorides, the same concentration �20%� was chosento compare the absorbance. For the other solutions,the concentration was different because the solubilityof each chemical varies significantly.
A. Absorbance Characterization
To determine the optical absorbance of these fluidsamples, the absorbance of different thickness fluidsamples were measured using a Perkin Elmer spec-trometer. The quartz cells (Starna Cells, Incorpo-rated) have different optical paths. The absorbance �(base e) is determined by
� �A2 � A1
t2 � t1, (1)
where t1 and t2 are the optical path length in the fluid,A1 and A2 are the absorbance measured with opticalpaths t1 and t2, and � is the absorbance�mm. Themeasured absorption spectrum of 85% H3PO4 isshown in Fig. 2, where the measured absorbance is0.2444 mm�1 at 193 nm with a standard deviation of0.015. The major error is due to the equipment noise.The absorbance may vary with the presence of impu-rities.
A straight line fit to the edge of the absorption bandgives the onset wavelength ��0�. At this wavelengththe absorbance starts to increase dramatically, giving
Fig. 1. Different diffraction orders have different optical paths.This will cause the transmission to be different.
Fig. 2. Absorbance spectrum of 85% H3PO4 aqueous solution andthe absorption onset wavelength �0.
Table 1. Absorption Peak Caused by Different Anions in Water
Anions inWater
Absorption peak(nm)
I� 227Br� 198Cl� 183ClO4
� 180HPO4
2� 179SO4
2� 175H2PO4
� 170HSO4
� 165
Table 2. Absorbance of Various Inorganic Aqueous Solutions at 193and 248 nm (e based) and Absorption Onset Wavelength. Absorbance
Greater Than 1.9 mm�1 was Not Measurable
Fluids
OnsetWavelength
�0 (nm)
Absorbance �(mm�1)
at 193nm
at 248nm
AlCl3 · 6H2O 50% 209 – 0.0237HCl 20% 210 – 0.0036NaCl 20% 208 – 0.0308CaCl2 20% 209 – 0.0591CsCl 20% 206 – 0.0051CsI 20% – – –KCl 20% 209 – 0.0071ZnBr2 20% 234 – 0.0297Zn(NO3)2 40% – – –NaH2PO4 16% 196 0.9867 0.2530Na2HPO4 16% 208 – 0.0354KH2PO4 16% 196 1.3133 0.3749H3PO4 20% 192 0.0575 0.0048H3PO4 85% 192 0.2444 0.0210AIK(SO4)2 · 12H2O 20% 197 0.6578 0.0110AINH4(SO4)2 · 12H2O
(saturated)198 1.1845 0.0055
H2SO4 20% 197 0.5658 0.0041Li2SO4 17% 228 – 0.0202Na2SO4 17% 199 – 0.0032K2SO4 8% 199 – 0.0014Rb2SO4 25% 230 – 0.0527Cs2SO4 40% 199 1.6238 0.0039MgSO4 5% 196 – 0Gd2(SO4)3 1.5% 195 0.2109 0ZnSO4 40% 201 – 0.0076
3078 APPLIED OPTICS � Vol. 45, No. 13 � 1 May 2006

an indication of the wavelength limitations of thefluid. Table 2 shows the onset wavelength and theabsorbance at 193 and 248 nm of all these solutions.All the fluid concentrations shown in this table weremeasured in weight percentage. The absorbance ofsome fluids was not measurable because the maxi-mum absorbance that can be measured is 1.9 mm�1.At 248 nm most of the fluids have very low absor-bance. At 193 nm, only a few fluids are transparent.Table 2 also shows that the onset wavelength can bemodified by cations. Those solutions with an absor-bance of less than 0.5 mm�1 might be used as immer-sion media.
B. Refractive Index Characterization
A minimum deviation method was reported for thecharacterization of water and other lens materials byNIST.7,8 With this method the experimental setup ishighly symmetric and can measure refractive indexwith high accuracy. However, to obtain the refractiveindex spectrum, the system needs to be aligned tomaintain symmetry when the wavelength is changedbecause of dispersion. To measure the refractive in-
dex of fluids, a prism deviation angle method wasdeveloped by the author, which is different from theminimum deviation method. Accuracy of 0.001 can beachieved with this method. This accuracy is adequatefor immersion fluid refractive index characterization.A variable angle spectroscopic ellipsometer (VASE)(J. A. Woollam Company, Inc.) was modified. The toolwas originally designed to measure optical constantsof thin films. It also provides the ability to measuretransmission. The ellipsometer has precise �0.044mRad� goniometers, which make accurate measure-ments possible. Figure 3(a) shows the modifiedVASE. A prism fluid cell with nominal apex angle Aequal to 45° was mounted onto the sample stage. Thelight enters the prism cell from a monochromator.Figure 3(b) shows the optical path. The incident angle� could be adjusted by turning the goniometer of thesample stage. The outgoing light was collected by thedetector. The law of refraction describes the propa-gation of light when it passes through the interface oftwo transparent media. When the light travels fromair into the prism, and then travels from the prisminto the fluid, the refractive angle in the fluid is notrelated to the thickness and refractive index of theprism since the two surfaces of the prism cell areparallel. By applying Snell’s law at the first interfacewe obtain
nliquid � nair sin ��sin �1. (2)
The incident angle is � and the refracted angle in thefluid is �1. The refractive indices of the fluid and airare nliquid and nair. Similarly, at the second interface,the relationship is expressed as
nliquid sin �2 � nair sin�A � � � ��, (3)
where �2 is the incident angle in the fluid andA � � � � is the refracted angle in air, and � is thedeviated angle. By some mathematical manipulationthese two equations can be combined together to yield
nliquid � nair �2 sin2�A � � � ��
� �sin � � cos A sin�A � � � ��sin A �2�1�2
. (4)
Fig. 3. Experimental setup for refractive index measurement.(a) Modified Woollam variable angle spectroscopic ellipsometer.(b) Top view of optical path (not to scale).
Fig. 4. Refractive index of 85% phosphoric acid and the Cauchycurve fit.
Table 3. Uncertainties of Refractive Index Measurement
Source of Uncertainties ValueIndex
Uncertainty
Temperature uncertainty 0.5 °C 5 � 10�4
Apex angle measurement 0.01° 1.6 � 10�4
Deviation angle � uncertainty 0.03° 3.8 � 10�4
Combined uncertainty 10.4 � 10�4
1 May 2006 � Vol. 45, No. 13 � APPLIED OPTICS 3079

The refractive index of air is 1.0003 at 21.5 °C. Byturning the sample stage goniometer, the incidentangle � could be set accurately from the ellipsometerif a good alignment is achieved. The apex angle ofprism A was measured to be 44.72°. By measuring �for different wavelengths, the refractive index of theliquid could be calculated from Eq. (4).
The measurement of � is critical since it is themajor error source. With a Woollam ellipsometer,sweeping the detector angle allows the peak of thedeviated beam to be found by finding the angle ofmaximum intensity. However, � cannot be accuratelydefined by the detector arm because the finite size ofthe prism cell will cause translation beam deviationwithin the prism. This error can be calculated byoptical ray trace and can be well corrected. Duringmeasurement, the temperature and humidity of theenvironment were maintained to be 21.5 °C and 49%.Before measurement, each sample was mounted ontothe sample stage for a period every time to ensurethat it achieved equilibrium with the surroundingair. Table 3 shows the summary of uncertaintiesfor high-performance liquid chromatography (HPLC)grade water. The analysis is valid for the other fluidssince they are aqueous solutions and the measure-ment procedure is identical. Note that the tempera-ture variation contributes the largest uncertainty.The temperature dependence of HPLC grade waterwas reported to be �1 � 10�4 °C by Burnett andKaplan.8 However, it is an environment parameterthat cannot be precisely controlled in this experi-ment. The combined uncertainty was 0.001. The mea-sured refractive index of HPLC grade water is 1.436.The refractive index of water was reported to be 1.43662 at 193.39 nm by NIST. These two results matchwell.
By changing the illumination wavelength, a plot of
refractive index versus wavelength can be obtained.The Cauchy ABC parameters9 were generatedthrough least-squares fit. Then the refractive indexcan be predicted for other wavelengths. The mean-square error (MSE) of each of the Cauchy ABC pa-rameter fit falls in the range of 5–7 � 10�7, thisindicates good data fit. Figure 4 shows the measuredand fit refractive index of 85% phosphoric acid. Table4 summarizes the measured results. The refractiveindices of phosphoric acid and sulfuric acid with dif-ferent concentrations were measured. The resultshows that high concentration causes high refractiveindex. So the concentration of each of the other solu-tions listed in Table 4 was chosen to be close to theirsolubility limits. For sulfates, the 96% sulfuric acidshows the greatest change ��0.08� about the refrac-tive index, but this material is not suitable for im-mersion lithography due to its very aggressive
Fig. 5. Schematic diagram of the 193 nm interferometric immer-sion lithography system.
Table 4. Fluid Refractive Indices and Cauchy Parameters
Fluids
Refractive Indices Cauchy Parameters
193 nm 248 nm A B (10�3 �m2) C (10�4 �m4)
AlCl3 · 6H2O 50% 1.584 1.489 1.4101 2.4 1.52HCl 37% 1.583 1.487 1.3997 3.2 1.34CsCl 60% 1.561 1.466 1.3912 2.0 1.60H3PO4 20% 1.452 1.398 1.3486 1.8 0.77H3PO4 40% 1.475 1.420 1.3723 1.5 0.85H3PO4 85% 1.538 1.488 1.4316 2.8 0.42AIK(SO4)2 · 12H2O 20% 1.452 1.399 1.3468 2.1 0.69AlNH4(SO4)2 · 12H2O(saturated)
1.437 1.384 1.3329 2.0 0.71
H2SO4 20% 1.472 1.418 1.3635 2.2 0.68H2SO4 96% 1.516 1.469 1.4151 2.7 0.40Li2SO4 16% 1.456 1.403 1.3500 2.2 0.64Na2SO4 30% 1.479 1.423 1.3667 2.3 0.69NaHSO4 44% 1.473 1.418 1.3643 2.1 0.74RbSO4 25% 1.456 1.402 1.3500 2.1 0.70CsSO4 40% 1.481 1.422 1.3685 2.0 0.83ZnSO4 40% 1.482 1.424 1.3678 2.2 0.75H2O (HPLC) 1.436 1.379 1.3283 2.1 0.67
3080 APPLIED OPTICS � Vol. 45, No. 13 � 1 May 2006
chemical property. The other sulfates can cause thechange of index at approximately 0.02–0.05. Thechlorides show the greatest change about refractiveindex. The refractive index of 60% aluminum chlo-ride hexahydrate solution at 193 nm was found to be1.584, which is 0.148 higher than that of water. Phos-phoric acid has a refractive index of 1.538, which is0.102 higher than the refractive index of water. Forpotential application, the refractive indices at248 nm were also listed. This table also shows howthe absorption edges of different solutions are af-fected by different cations.
3. Interferometric Immersion Lithography Results
The interference of two mutually impinging coherentbeams forms a sinusoidal intensity distribution in theintersection. Interferometric lithography has beenwidely utilized as a tool for the evaluation of photore-sist materials10 and fabrication of periodic struc-tures.11 In order to best satisfy the mutual coherencerequirement, a symmetric interference system wasbuilt, as shown in Fig. 5. In this interferometer, alaser beam is expanded and TE polarized. The phasegrating serves as the beam splitter. The plus first andthe minus first diffraction orders are used as theinterference waves. They are directed perpendicu-larly into a quartz half ball and finally form the si-nusoidal intensity distribution at the center of the
half ball. The turning mirrors, combined with thephase grating pitch, define the beam’s arrival angle �on the wafer. The pitch of the grating is 600 nm,which results in the effective NA on the mask side tobe 0.16. On the image side, the effective NA isnquartz sin �. By changing the impinging angle, theresultant pitch size may vary.
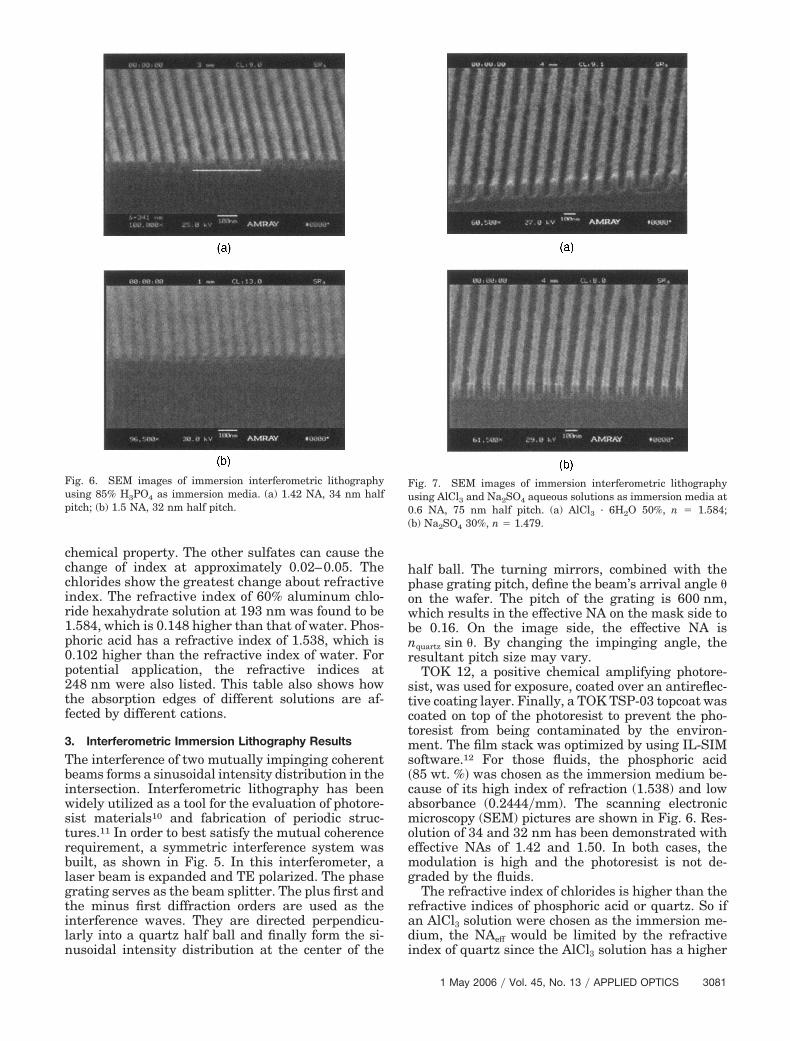
TOK 12, a positive chemical amplifying photore-sist, was used for exposure, coated over an antireflec-tive coating layer. Finally, a TOK TSP-03 topcoat wascoated on top of the photoresist to prevent the pho-toresist from being contaminated by the environ-ment. The film stack was optimized by using IL-SIMsoftware.12 For those fluids, the phosphoric acid�85 wt. %� was chosen as the immersion medium be-cause of its high index of refraction (1.538) and lowabsorbance (0.2444�mm). The scanning electronicmicroscopy (SEM) pictures are shown in Fig. 6. Res-olution of 34 and 32 nm has been demonstrated witheffective NAs of 1.42 and 1.50. In both cases, themodulation is high and the photoresist is not de-graded by the fluids.
The refractive index of chlorides is higher than therefractive indices of phosphoric acid or quartz. So ifan AlCl3 solution were chosen as the immersion me-dium, the NAeff would be limited by the refractiveindex of quartz since the AlCl3 solution has a higher
Fig. 6. SEM images of immersion interferometric lithographyusing 85% H3PO4 as immersion media. (a) 1.42 NA, 34 nm halfpitch; (b) 1.5 NA, 32 nm half pitch.
Fig. 7. SEM images of immersion interferometric lithographyusing AlCl3 and Na2SO4 aqueous solutions as immersion media at0.6 NA, 75 nm half pitch. (a) AlCl3 · 6H2O 50%, n � 1.584;(b) Na2SO4 30%, n � 1.479.
1 May 2006 � Vol. 45, No. 13 � APPLIED OPTICS 3081

refractive index than the quartz lens. However, theabsorbance is also high. The absorbance onset wave-length can be engineered by adding different cations,so it is still valuable to do some initial study to in-vestigate the feasibility of using chlorides as an im-mersion medium. For comparison, Na2SO4 solutionwas also used. The NA was set to be 0.6 to get 75 nmhalf-pitch images. The exposure time is approxi-mately ten times compared to phosphoric acid due tohigh absorbance. Figure 7 shows the SEM pictures.No significant degradation of photoresist perfor-mance was observed.
4. Conclusion
A number of inorganic solutions were studied ascandidates for 193 nm immersion lithography. Theprism deviation angle method was developed to mea-sure fluid refractive index. The index of refraction canbe changed by adding inorganic additives. With phos-phoric acid as the immersion medium, images of32 nm half-pitch were demonstrated, which exceedthe theoretical limit of 33.5 nm with water as theimmersion fluid at 193 nm. It is very likely that in thefuture, the quartz optical elements will be the bottle-neck of the effective NA. With higher index (1.6)fluids, the resolution limit can be pushed tosub-32 nm for 193 nm lithography.
References1. M. S. Hibbs, “System overview of optical steppers and scan-
ners,” in Microlithography Science and Technology, J. R.Sheats and B. W. Smith, eds. (Marcel Dekker, 1998), pp.1–108.
2. B. W. Smith, A. Bourov, Y. Fan, L. Zavyalova, N. Lafferty, andF. Cropanese, “Approaching the numerical aperture of waterimmersion lithography at 193-nm,” in Optical Microlithogra-phy XVII, B. W. Smith, ed., Proc. SPIE 5377, 273–284 (2004).
3. S. Peng, R. H. French, W. Qiu, R. C. Wheland, M. Yang, M. F.Lemon, and M. K. Crawford, “Second generation fluids for 193nm immersion lithography,” in Optical MicrolithographyXVIII, B. W. Smith, ed., Proc. SPIE 5754, 427–434 (2005).
4. B. Budhlall, G. Parris, P. Zhang, X. Gao, Z. Zarkov, and B.Ross, “High refractive index immersion fluids for 193 nm im-mersion lithography,” in Optical Microlithography XVIII,B. W. Smith, ed. Proc. SPIE 5754, 622–629 (2005).
5. G. Gauglitz and D. Moore, “Nomenclature, symbols, units, andtheir usage in spectrochemical analysis-XII. Laser-based mo-lecular spectrometer for chemical analysis: absorption,” PureAppl. Chem. 71, 2189–2204 (1999).
6. M. J. Blandamer and M. F. Fox, “Theory and applications ofcharge-transfer-to-solvent Spectra,” Chem. Rev. 70, 59–93(1970).
7. R. Gupta, J. H. Burnett, U. Gnesmann, and M. Waihout, “Ab-solute refractive indices and thermal coefficients of fused silicaand calcium fluoride near 193 nm,” Appl. Opt. 37, 5964–5968(1998).
8. J. Burnett and S. Kaplan, “Measurement of refractive indexand thermo-optic coefficient of water near 193 nm,” in OpticalMicrolithography XVI, A. Yen, ed., Proc. SPIE 5040, 1742–1749 (2003).
9. H.-J. Eichler, “Dispersion and absorption of light,” in Optics ofWaves and Particles, H. Niedrig, ed. (de Gruyter, 1999),pp. 187–280.
10. W. Hinsberg, F. A. Houle, J. Hoffnagle, M. Sanchez, G.Wallraff, M. Morrison, and S. Frank, “Deep-ultraviolet inter-ferometric lithography as a tool for assessment of chemicallyamplified photoresist performance,” J. Vac. Sci. Technol. B 16,3689–3694 (1998).
11. T. A. Savas, S. N. Shah, M. L. Schattenburg, J. M. Carter, andH. I. Smith, “Achromatic interferometric lithography for100-nm-period gratings and grids,” J. Vac. Sci. Technol. B 13,2732–2735 (1995).
12. Y. Fan, A. Bourov, L. Zavyalova, J. Zhou, A. Estroff, N.Lafferty, and B. W. Smith, “ILSim, a compact simulation toolfor interferometric lithography,” in Optical MicrolithographyXVIII, B. W. Smith, ed., Proc. SPIE 5754, 1805–1816 (2005).
3082 APPLIED OPTICS � Vol. 45, No. 13 � 1 May 2006


![2 LASER INTERFERENCE LITHOGRAPHY - uni-halle.de · 2 LASER INTERFERENCE LITHOGRAPHY (LIL) 9 2 LASER INTERFERENCE LITHOGRAPHY (LIL) Laser interference lithography [3~22] (LIL) is a](https://img.dokumen.tips/doc/110x75/5eae180eecc7e273a41a4e88/2-laser-interference-lithography-uni-hallede-2-laser-interference-lithography.jpg)