Embed Size (px)
Citation preview
Technical Report 1362 Innovative Tools to Assess Systems Thinking Ability Cory Adis Michelle Wisecarver Chelsey Raber Personnel Decisions Research Institutes, LLC
Alexander P. Wind Kristophor G. Canali U.S. Army Research Institute for the Behavioral and Social Sciences December 2017
United States Army Research Institute for the Behavioral and Social Sciences Approved for public release; distribution is unlimited.
U.S. Army Research Institute for the Behavioral and Social Sciences
Department of the Army Deputy Chief of Staff, G1
Authorized and approved for distribution:
MICHELLE SAMS, Ph.D. Director
Research accomplished under contract for the Department of the Army
Personnel Decisions Research Institutes, LLC
Technical review by
Randy J. Brou, U. S. Army Research Institute LisaRe Babin, U. S. Army Research Institute
NOTICES
DISTRIBUTION: This Technical Report has been submitted to the Defense Information Technical Center (DTIC). Address correspondence concerning reports to: U.S. Army Research Institute for the Behavioral and Social Sciences, ATTN: DAPE-ARI-ZXM, 6000 6th Street (Bldg. 1464 / Mail Stop: 5610), Fort Belvoir, Virginia 22060-5610.
FINAL DISPOSITION: This Technical Report may be destroyed when it is no longer needed. Please do not return it to the U.S. Army Research Institute for the Behavioral and Social Sciences.
NOTE: the findings in this Technical Report are not to be construed as an official Department of the Army position, unless so designated by other authorized documents.

i
REPORT DOCUMENTATION PAGE 1. REPORT DATE (DD-MM-YYYY) December 2017
2. REPORT TYPE Final
3. DATES COVERED (From – To) 09/01/2015 – 08/30/2016
4. TITLE AND SUBTITLE Innovative Tools to Assess Systems Thinking Ability
5a. CONTRACT/GRANT NUMBER W991NF-15-C-0208
5b. PROGRAM ELEMENT NUMBER 622785
6. AUTHOR(S) Cory Adis, Michelle Wisecarver, Chelsey Raber (Personnel Decisions Research Institutes, LLC), Alexander P. Wind, Kristophor G. Canali (U.S. Army Research Institute)
5c. PROJECT NUMBER A790
5d. TASK NUMBER
5e. WORK UNIT NUMBER 408
7. PERFORMING ORGANIZATION NAME(S) AND ADDRESS(ES) PDRI, LLC 100 South Ashley Drive, Suite 1120 Tampa, FL 33602
8. PERFORMING ORGANIZATION REPORT NUMBER
9. SPONSORING/MONITORING AGENCY NAME(S) AND ADDRESS(ES) U.S. Army Research Institute for the Behavioral and Social Sciences 6000 6th Street (Bldg. 1464 / Mail Stop: 5610) Fort Belvoir, Virginia 22060-5610
10. SPONSOR/MONITOR'S ACRONYM(S) ARI
11. SPONSORING/MONITORING Technical Report 1362
12. DISTRIBUTION AVAILABILITY STATEMENT Distribution Statement A: Approved for public release; distribution is unlimited.
13. SUPPLEMENTARY NOTES ARI Research POC: Alexander Wind, Personnel Assessment Research Unit
14. ABSTRACT Systems thinking ability (STA) is defined as a constellation of closely related abilities that enable individuals to (a) identify the elements of a system, (b) understand system relationships, (c) evaluate and revise system models, and (d) apply an integrated understanding of the system to a problem. Numerous jobs in the Army require Soldiers to work with or within systems. Given the pervasiveness of systems across Army jobs and requirements, the U.S. Army Research Institute for the Behavioral and Social Sciences (ARI) is exploring means to identify personnel who have an aptitude for systems thinking would be a useful tool for selection and classification. Five key cognitive attributes were identified as conceptually relevant to STA: Hierarchical Working Memory Capacity, Spatial Ability, Cognitive Flexibility, Pattern Recognition, and Cognitive Complexity. Assessment approaches were developed for each of five cognitive attributes identified and data was collected using a sample of workers from Amazon Mechanical Turk. Preliminary construct validation results indicated support for most measures. Convergent and discriminant relationships were generally significant and in the expected direction, though of moderate magnitude.
15. SUBJECT TERMS Systems thinking ability, cognitive attributes, working memory capacity, cognitive complexity, cognitive flexibility, pattern recognition, spatial ability SECURITY CLASSIFICATION OF:
19. LIMITATION OF ABSTRACT
Unlimited Unclassified
20. NUMBER OF PAGES
84
21. RESPONSIBLE PERSON Tonia S. Heffner 703-545-4408 16. REPORT
Unclassified 17. ABSTRACT Unclassified
18. THIS PAGE Unclassified
Standard Form 298 (Rev. 8-98)
ii
Technical Report 1362
Innovative Tools to Assess Systems Thinking Ability
Cory Adis Michelle Wisecarver
Chelsey Raber Personnel Decisions Research Institutes, LLC
Alexander P. Wind Kristophor G. Canali
U.S. Army Research Institute for the Behavioral and Social Sciences
Personnel Assessment Research Unit Tonia S. Heffner, Chief
December 2017
Army Project Number Personnel, Performance and 622785A790 Training Technology
Approved for public release; distribution is unlimited.
iii
INNOVATIVE TOOLS TO ASSESS SYSTEMS THINKING ABILITY
EXECUTIVE SUMMARY
Research Requirement:
Systems thinking ability (STA) is defined as a constellation of closely related abilities that enable individuals to (a) identify the elements of a system, (b) understand system relationships, (c) evaluate and revise system models, and (d) apply an integrated understanding of the system to a problem. Numerous jobs in the Army require Soldiers to work with or within systems, such as the complex sociocultural systems Soldiers encounter on deployments, the organizational systems officers lead and manage, and the complicated network of cyber systems Soldiers must protect and defend. Given the pervasiveness of systems across Army jobs and requirements, being able to identify personnel who have an aptitude for systems thinking would be a useful tool for selection and classification. This research develops and examines initial construct validity evidence for a measure of systems thinking ability (STA).
Approach:
The systems thinking process is largely driven by cognitive activities such as recognizing, identifying, defining, and describing models of the relationships between the elements of a system. Five key cognitive attributes conceptually relevant to STA were identified from the literature: Hierarchical Working Memory Capacity (HWMC), Spatial Ability (SA), Cognitive Flexibility (CF), Pattern Recognition (PR), and Cognitive Complexity (CC). Assessment approaches were developed for each of five cognitive attributes. HWMC was operationalized using a multi-level complex memory span task in which participants were asked to recall sequences of item locations at different levels of an organizational hierarchy. Four dimensions of Spatial Ability were measured using tasks that included shape searching, slicing 3-D shapes, interpreting fluid levels in a container, and taking various perspectives using photographs. The operationalization of Pattern Recognition required participants to identify anomalies in a factory-like setting. Cognitive Complexity used a dynamic object sorting task, and Cognitive Flexibility uses a scenario-based hypothesis formation task as well as a reaction time test for switching from a macro to a micro perspective. For all of the measures, with the exception of HWMC, multiple dimensions were captured: two each for Cognitive Flexibility and Pattern Recognition; three for Cognitive Complexity; and four for Spatial Ability.
Findings:
Data for the validation was collected using a sample of workers from Amazon Mechanical Turk. To be eligible to participate, workers were required to be 18-50 years of age, have normal color vision, and have access to a personal computer and internet connection. The number of participants ranged from 119 for Spatial Ability to 137 for Pattern Recognition. Participants could choose to take only one of the tests or multiple tests if they wanted, up to all five of the tests. Results generally provided support for the construct validity of these measures, although the level of support varied. Construct validity evidence was the strongest for HWMC, Extrinsic-dynamic SA, Micro/Macro Task Switching CF, and Abstract Grouping CC, and was
iv
the weakest for Extrinsic-static SA and scenario-based hypothesis formation task CF. Convergent and discriminant relationships were generally significant and in the expected direction, though of moderate magnitude. Only one dimension of Spatial Abilities failed to show convergence with related constructs.
Utilization and Dissemination of Findings:
Findings from this research provide initial psychometric and validity evidence for five cognitive assessment tools related to systems thinking. Several of the assessment tools may have applications beyond systems thinking to other military occupational specialties (MOS). For example, spatial ability is relevant to numerous MOS. While current Army cognitive testing already includes the Assembling Objects (AO) subtest, incorporating the STA Spatial Ability test would provide a more comprehensive assessment of the spatial abilities of incoming Soldiers. The next step for further development of the STA test will create a game-based assessment of STA that combines the five existing assessments within a unified game environment and expands STA to include three additional attributes: creativity, openness to information, and curiosity.
v
INNOVATIVE TOOLS TO ASSESS SYSTEMS THINKING ABILITY
CONTENTS
Page
SYSTEMS THINKING ABILITY 1
Defining Systems Thinking Ability (STA) 1
Identifying the Components of STA 3
Hierarchical Working Memory Capacity (HWMC) 6
Spatial Ability 10
Cognitive Flexibility 18
Pattern Recognition 22
Cognitive Complexity 25
Summary 28
METHOD 28
Participants 30
Measures 31
RESULTS 37
HWMC 37
Spatial Ability 38
Cognitive Flexibility 1 45
Cognitive Flexibility 2 47
Pattern Recognition 1 48
Pattern Recognition 2 49
Cognitive Complexity 50
DISCUSSION 53
Hierarchical Working Memory Capacity 54
Spatial Abilities 54
Cognitive Flexibility 56
Pattern Recognition 57
Cognitive Complexity 57
Conclusions 58
vi
REFERENCES 60
GLOSSARY OF TERMS 69
Appendix A: Construct Correlations A-1
LIST OF TABLES
TABLE 1. SYSTEMS THINKING ABILITY (STA) CONSTRUCTS 6
TABLE 2. DESCRIPTION OF WORKING MEMORY TESTS 7
TABLE 3. DESCRIPTION AND CLASSIFICATION OF SPATIAL ABILITY TESTS 11
TABLE 4. DESCRIPTION OF MEASURES FOR SA CONSTRUCT VALIDATION 17
TABLE 5. DESCRIPTION OF COGNITIVE FLEXIBILITY TESTS 19
TABLE 6. DESCRIPTION OF PATTERN RECOGNITION TESTS 23
TABLE 7. DESCRIPTION OF COGNITIVE COMPLEXITY TESTS 25
TABLE 8. CONSTRUCTS USED TO EXAMINE CONSTRUCT VALIDITY 29
TABLE 9. NUMBER OF PARTICIPANTS FOR EACH CONSTRUCT AND OVERLAP IN PARTICIPANTS BETWEEN CONSTRUCTS 31
TABLE 10. CONVERGENT AND DISCRIMINANT RELATIONSHIPS FOR HIERARCHICAL WORKING MEMORY 38
TABLE 11. SPATIAL ABILITY DIMENSION INTERCORRELATIONS 39
TABLE 12. CORRELATION MATRIX FOR INTRINSIC-STATIC SPATIAL ABILITY CONSTRUCT VALIDITY ANALYSIS 40
TABLE 13. CONVERGENT AND DISCRIMINANT RELATIONSHIPS FOR INTRINSIC-STATIC SPATIAL ABILITY 41
TABLE 14. CONVERGENT AND DISCRIMINANT RELATIONSHIPS FOR INTRINSIC-DYNAMIC SPATIAL ABILITY 42
TABLE 15. CONVERGENT AND DISCRIMINANT RELATIONSHIPS FOR EXTRINSIC-STATIC SPATIAL ABILITY 43
TABLE 16. CONVERGENT AND DISCRIMINANT RELATIONSHIPS FOR EXTRINSIC-DYNAMIC SPATIAL ABILITY 45
TABLE 17. CORRELATION MATRIX FOR COGNITIVE FLEXIBILITY CONSTRUCT VALIDITY ANALYSES 46
TABLE 18. CONVERGENT AND DISCRIMINANT RELATIONSHIPS FOR COGNITIVE FLEXIBILITY 1 47
TABLE 19. CONVERGENT AND DISCRIMINANT RELATIONSHIPS FOR COGNITIVE FLEXIBILITY 2 48
vii
TABLE 20. CONVERGENT AND DISCRIMINANT RELATIONSHIPS FOR PATTERN RECOGNITION 1 49
TABLE 21. CONVERGENT AND DISCRIMINANT RELATIONSHIPS FOR PATTERN RECOGNITION 50
TABLE 22. CORRELATION MATRIX FOR COGNITIVE COMPLEXITY CONSTRUCT VALIDITY ANALYSIS 52
TABLE 23. CONVERGENT AND DISCRIMINANT RELATIONSHIPS FOR COGNITIVE COMPLEXITY 53
LIST OF FIGURES
FIGURE 1. EXAMPLE HIERARCHICAL WORKING MEMORY STIMULI ......................... 10 FIGURE 2. INTRINSIC-STATIC SPATIAL ABILITY ASSESSMENT ................................... 15 FIGURE 3. INTRINSIC-DYNAMIC SPATIAL ABILITY ASSESSMENT .............................. 15 FIGURE 4. EXTRINSIC-STATIC SPATIAL ABILITY ASSESSMENT .................................. 16 FIGURE 5. EXTRINSIC-DYNAMIC SPATIAL ABILITY ASSESSMENT ............................. 16 FIGURE 6. EXAMPLE NAVON ................................................................................................. 24 FIGURE 7. HISTOGRAM OF HWMC SCORES ....................................................................... 37 FIGURE 8. HISTOGRAM OF INTRINSIC-STATIC SPATIAL ABILITY SCORES............... 39 FIGURE 9. HISTOGRAM OF INTRINSIC-DYNAMIC SPATIAL ABILITY SCORES ......... 42 FIGURE 10. HISTOGRAM OF EXTRINSIC-STATIC SPATIAL ABILITY SCORES ........... 43 FIGURE 11. HISTOGRAM OF EXTRINSIC-DYNAMIC SPATIAL ABILITY SCORES ...... 44 FIGURE 12. HISTOGRAM OF COGNITIVE FLEXIBILITY 1, FLEXIBLE THINKING SCORES ....................................................................................................................................... 46 FIGURE 13. HISTOGRAM OF COGNITIVE FLEXIBILITY 2, MENTAL SET SWITCHING SCORES ........................................................................................................ 47 FIGURE 14. HISTOGRAM OF PATTERN RECOGNITION ERRORS CAUGHT .................. 48 FIGURE 15. HISTOGRAM OF PATTERN RECOGNITION MEAN LATENCY ................... 48 FIGURE 16. HISTOGRAM OF PATTERN RECOGNITION SCORES .................................... 50 FIGURE 17. HISTOGRAM OF COGNITIVE COMPLEXITY OBJECT SORT1 SCORES ..... 51 FIGURE 18. HISTOGRAM OF COGNITIVE COMPLEXITY OBJECT SORT1 SCORES ..... 51 FIGURE 19. HISTOGRAM OF COGNITIVE COMPLEXITY CONCEPT SORT1 SCORES . 51
1
INNOVATIVE TOOLS TO ASSESS SYSTEMS THINKING ABILITY
Systems Thinking Ability
Numerous jobs in the Army require Soldiers to work with or within systems, such as the complex sociocultural systems Soldiers encounter on deployments, the organizational systems officers lead and manage, the systems thinking required in Army design methodology, and the complicated network of cyber systems Soldiers must protect and defend. Given the pervasiveness of systems across Army jobs and requirements, a means to identify personnel with an aptitude for systems thinking would be a useful tool for selection and classification. This research developed and conducted an initial construct validation for an innovative measure of systems thinking ability (STA). We first define systems thinking ability (STA), identify component constructs, and describe our measurement approach. We then describe the empirical results of an initial construct validity study.
Defining Systems Thinking Ability (STA)
A system can be defined as a set of interconnected elements organized in a coherent way that achieves a function or purpose (Meadows, 2008). The importance of thinking about systems has long been recognized across various scientific and applied domains, from engineering and biology to organizational processes (e.g., Flood & Jackson, 1991; Forrester, 1961; Jackson & Keyes, 1984; Midgley, 1997; Midgley, 2003; Mingers, 2006). Across the domains, multiple paradigms have emerged to address different types of systems, leading to unique perspectives on the systems thinking process. For example, when viewing systems as organisms (e.g., Von Bertalanffy, 1968; Miller, 1978), the systems thinking process involves recognizing the openness of the system to environmental inputs. When viewing systems as a series of feedback loops (e.g., Forrester, 1961; Senge, 1990), the systems thinking process involves identifying positive and negative feedback loops or estimating the accumulation of some quantity (stocks) based on inputs and outputs (flows). When viewing systems as the network of affected perspectives in a problem situation (e.g., Ackoff, 1981; Checkland, 1981; Churchman, 1968; Mason & Mitroff, 1981), the systems thinking process becomes one of identifying constituencies and integrating their perspectives on the problem situation.
Despite differences between the systems thinking paradigms, each has a similar objective; all of the paradigms provide a framework that takes a holistic approach to solving problems in a given domain (Rubenstein-Montano et al., 2001). For each paradigm, systems thinking requires identifying a problem situation as a system and leveraging an understanding of systems to gain further insights and capabilities. A number of other similarities emerge within this unifying objective. For example, each of the paradigms involves multiple elements – the components in aggregation systems, the parts that are in the organism systems, the elements in feedback loops, and various perspectives considered in systems as thinking perspectives. Therefore in each of the paradigms these elements must be identified and in some way related to each other. In each of the paradigms one must reach some understanding of relationships within the system and how the relationships can change. This is particularly prevalent in aggregation approaches, which examine the complex dynamics and adaptive behavior among the elements;

2
organism approaches, which focus on the relationships and properties of systems as a whole; and feedback loop approaches, which model the relationships that modify or stabilize the system.
Therefore, several broad themes emerge that suggest common aspects of systems thinking that are largely paradigm agnostic. These themes are useful because they provide a foundation from which we can identify abilities that are critical to successful systems thinking performance. The broad themes that emerge are:
(a) Identifying the elements of the system (b) Understanding dynamic relationships within the system (c) Determining and modeling how the elements are related and engaging in a process of
evaluating and revising one’s understanding of the system (d) Applying an integrated understanding of the system to the problem.
These themes correspond well to the elements of the Military Decision-Making Process (MDMP), or the problem solving cycle, which are described by Pretz, Naples, & Sternberg (2003, p. 3-4) as:
1. Recognize or identify the problem. 2. Define and represent the problem mentally. 3. Develop a solution strategy. 4. Organize knowledge about the problem. 5. Allocate mental and physical resources for solving the problem. 6. Monitor progress toward the goal. 7. Evaluate the solution for accuracy.
As such, a cognitive problem solving framework provides a useful theoretical foundation for understanding the systems thinking process, particularly in ill-defined situations, which present distinct challenges in identifying and representing problems in order to develop a solution strategy (e.g., Pretz et al., 2003). Elements of both systems thinking and problem solving reflect a cyclical process that moves from an initial problem state toward a goal state and requires representing relationships between their elements and monitoring the process as it progresses. In a sense, systems thinking can be considered a unique form of problem solving in which the problem requires building an understanding of the dynamic relationships that exist within the system.
The systems thinking and problem solving themes describe activities that are important for successful systems thinking performance. Accomplishing these activities will require a combination of knowledge, skills, and motivation (e.g., see Campbell, McCloy, Oppler, & Sager, 1993). While these proximal determinants of performance will vary from one systems thinking domain to another, a set of more distal determinants of performance, such as more basic abilities and personality characteristics, underlie the skills, and may predict effective performance across multiple systems thinking content domains. Abilities can be defined as relatively enduring basic capacities for performing a range of tasks. Abilities underlie knowledge and skills, which are more malleable and amenable to training. An assessment tool such as the Armed Services Vocational Aptitude Battery (ASVAB) measures a series of knowledges and abilities in 9 test areas: General Science; Arithmetic Reasoning; Word Knowledge; Paragraph Comprehension;
3
Mathematics Knowledge; Electronics Information; Auto and Shop Information; Mechanical Comprehension; and Assembling Objects. While these knowledges and abilities are highly important to overall Soldier performance and classification into many military occupational specialties (MOSs), they do not capture all of the abilities relevant to systems thinking.
We propose that there is a set of abilities that underlie effective performance of the different components of the systems thinking process. As such, these abilities are important predictors of an individual’s systems thinking skills and ultimately systems thinking performance. We refer to these abilities collectively as systems thinking ability.
Systems thinking ability (STA) can be defined as a constellation of closely related abilities that, when combined with knowledge and systems thinking skills, enable individuals to (a) identify the elements of a system, (b) understand system relationships, (c) evaluate and revise system models, and (d) apply an integrated understanding of the system to a problem. We next identify the conceptual elements of STA, related research, and their relevance to systems thinking.
Identifying the Components of STA
There has been little empirical research to link specific abilities to systems thinking performance, so identifying the abilities needed for STA will require leveraging what is known about the requirements of the systems thinking process and the cognitive problem solving foundation of systems thinking. As the rationale above describes, the systems thinking process requires a number of cognitive tasks such as recognizing, identifying, defining, and describing models of the relationships between the elements of a system. Because the systems thinking process is largely driven by cognitive activities, we first focus on identifying cognitive abilities that we expect to be required for effective performance in this process. We discuss key cognitive abilities that are likely to impact performance on systems thinking tasks, including abilities related to executive functions, abilities related to perspective-taking (particularly across levels of organization or hierarchy), and abilities that enable complex and flexible thought.
Executive functions facilitate the monitoring and adjusting of cognitive problem solving processes, and include cognitive flexibility (also referred to as set shifting), working memory updating, and inhibition (Diamond, 2013; Miyake et al., 2000). Of these executive functions, two are particularly relevant: (a) working memory, and (b) cognitive flexibility. Working memory updating involves monitoring for contextually relevant information and revising the information that is held in working memory (Miyake et al., 2000; Morris & Jones, 1990). It has been identified as relevant to successful problem solving (e.g., Hambrick & Engle, 2003). Many theories of working memory include separate components for processing visual/spatial information and auditory information (e.g., Baddeley, 1986). Visual/spatial working memory is the information processing mechanism responsible for dealing with information that is visual or spatial in nature. Given that systems thinking involves building, testing, and monitoring mental models that represent systems, visual/spatial working memory is particularly relevant to the tasks of building these mental and/or graphical representations of the systems. Mentally representing and storing information regarding the location of elements of a system is therefore particularly valuable.
4
Another aspect of working memory that may be relevant to systems thinking ability is being able to process information at a variety of different levels, using information both from micro components of the system as well as from the system as a whole. Understanding dynamic relationships operating at different levels might require focusing attention and remembering information at those levels. For example, diagnosing a computer network problem may involve simultaneously tracking network activity of many computers, communication of two or three computers, and applications on one specific computer terminal. Likewise, testing a model of a system may require understanding cause and effect relationships at different levels. We label this multi-level working memory construct hierarchical working memory capacity (HWMC). Individuals with larger hierarchical working memory capacities would be at an advantage when collecting information at multiple levels and forming an understanding of the system.
Related to HWMC, we also propose to include a measure of spatial ability, focusing on spatial visualization and understanding spatial relations (e.g., Carroll, 1993; Hegarty & Kozhevnikov, 1999), which relate to being able to understand, encode, and mentally manipulate objects. A common theme across systems thinking literatures is the ability to “see” the structure of systems, which may reflect this underlying aspect of systems thinking ability, and being able to represent problems mentally is a key element of problem solving (e.g., Pretz et al., 2003). Given the complexity of systems thinking and reliance on models to understand and describe these complexities within the systems, these aspects of spatial ability are logical elements of STA. Though not all systems are physical or spatial in nature, spatial analogies are often used to reason about non-spatial relationships (e.g., social status is often described in terms of vertical structure). Nevertheless, spatial ability may be more important for some forms of systems thinking than others.
While the ASVAB measures spatial ability using the Assembling Objects (AO) test, the ASVAB AO is specifically focused on measuring the ability to determine how an object will look when its parts are put together (see Defense Manpower Data Center, DMDC, ASVAB Technical Bulletin No. 2, Aug 2009 for a discussion of the factor structure of the AO); thus, the two are conceptually related but operationally distinct. Research has suggested there may be four dimensions of spatial reasoning: intrinsic-static, intrinsic-dynamic, extrinsic-static, and extrinsic-dynamic (Newcombe & Shipley, 2015; Uttal et al., 2013). The intrinsic-extrinsic dimension pertains to whether the task asks about objects themselves (intrinsic), or objects as they spatially relate to other objects (extrinsic). The static-dynamic dimension pertains to whether the task presents stationary stimuli (static), or the stimuli have actual, implied, or mentally simulated movement (dynamic). ASVAB AO captures the intrinsic/dynamic dimension. The extrinsic and dynamic characteristics are likely to be particularly important given that they capture spatial visualization and understanding spatial relations, but in an effort to obtain thorough coverage of the spatial ability construct we will plan to capture assessments across each of the four dimensions. It should be noted that spatial ability will require visual/spatial working memory, and thus the two measures should be correlated. Including both measures, however, will enable us to determine which of the two abilities (or both) are the most relevant to STA.
In cognitive psychology, cognitive flexibility is defined specifically as set shifting, which is the ability to switch between different mental tasks or shift attention back and forth between cognitive operations (Monsell, 2003; c.f. Martin & Rubin, 1995). For STA, this is a potential precursor to the mental shifts required for the perspective taking components of
5
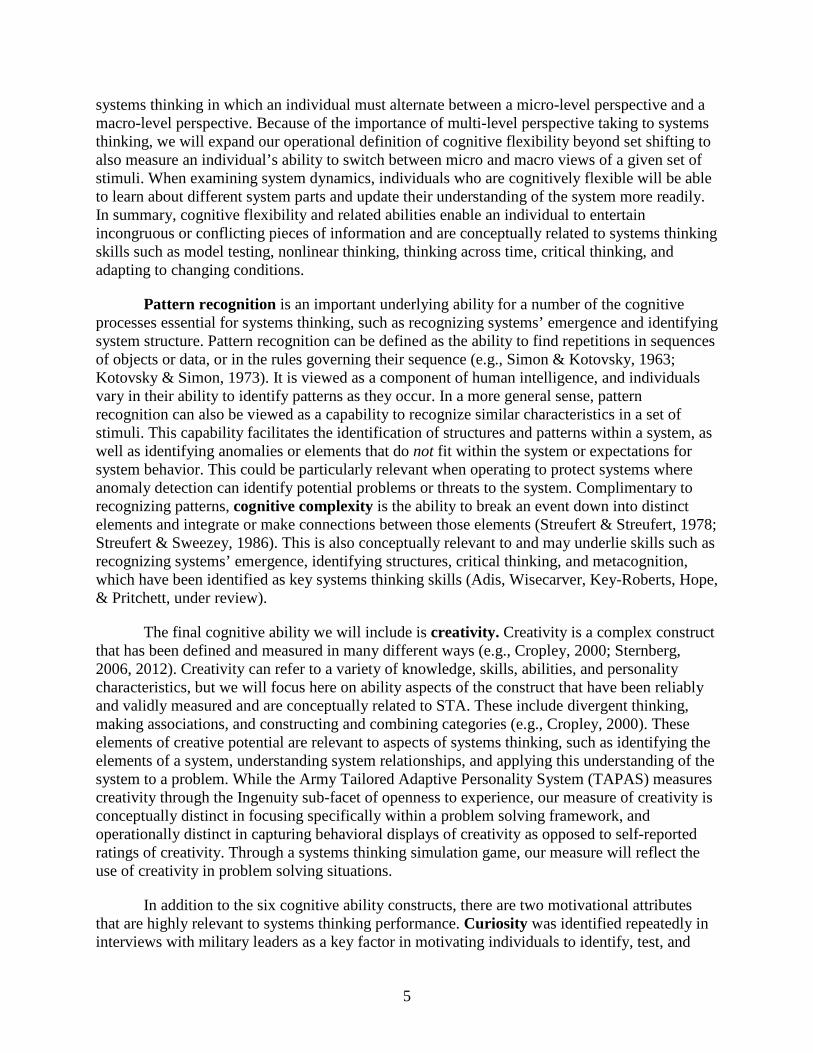
systems thinking in which an individual must alternate between a micro-level perspective and a macro-level perspective. Because of the importance of multi-level perspective taking to systems thinking, we will expand our operational definition of cognitive flexibility beyond set shifting to also measure an individual’s ability to switch between micro and macro views of a given set of stimuli. When examining system dynamics, individuals who are cognitively flexible will be able to learn about different system parts and update their understanding of the system more readily. In summary, cognitive flexibility and related abilities enable an individual to entertain incongruous or conflicting pieces of information and are conceptually related to systems thinking skills such as model testing, nonlinear thinking, thinking across time, critical thinking, and adapting to changing conditions.
Pattern recognition is an important underlying ability for a number of the cognitive processes essential for systems thinking, such as recognizing systems’ emergence and identifying system structure. Pattern recognition can be defined as the ability to find repetitions in sequences of objects or data, or in the rules governing their sequence (e.g., Simon & Kotovsky, 1963; Kotovsky & Simon, 1973). It is viewed as a component of human intelligence, and individuals vary in their ability to identify patterns as they occur. In a more general sense, pattern recognition can also be viewed as a capability to recognize similar characteristics in a set of stimuli. This capability facilitates the identification of structures and patterns within a system, as well as identifying anomalies or elements that do not fit within the system or expectations for system behavior. This could be particularly relevant when operating to protect systems where anomaly detection can identify potential problems or threats to the system. Complimentary to recognizing patterns, cognitive complexity is the ability to break an event down into distinct elements and integrate or make connections between those elements (Streufert & Streufert, 1978; Streufert & Sweezey, 1986). This is also conceptually relevant to and may underlie skills such as recognizing systems’ emergence, identifying structures, critical thinking, and metacognition, which have been identified as key systems thinking skills (Adis, Wisecarver, Key-Roberts, Hope, & Pritchett, under review).
The final cognitive ability we will include is creativity. Creativity is a complex construct that has been defined and measured in many different ways (e.g., Cropley, 2000; Sternberg, 2006, 2012). Creativity can refer to a variety of knowledge, skills, abilities, and personality characteristics, but we will focus here on ability aspects of the construct that have been reliably and validly measured and are conceptually related to STA. These include divergent thinking, making associations, and constructing and combining categories (e.g., Cropley, 2000). These elements of creative potential are relevant to aspects of systems thinking, such as identifying the elements of a system, understanding system relationships, and applying this understanding of the system to a problem. While the Army Tailored Adaptive Personality System (TAPAS) measures creativity through the Ingenuity sub-facet of openness to experience, our measure of creativity is conceptually distinct in focusing specifically within a problem solving framework, and operationally distinct in capturing behavioral displays of creativity as opposed to self-reported ratings of creativity. Through a systems thinking simulation game, our measure will reflect the use of creativity in problem solving situations.
In addition to the six cognitive ability constructs, there are two motivational attributes that are highly relevant to systems thinking performance. Curiosity was identified repeatedly in interviews with military leaders as a key factor in motivating individuals to identify, test, and
6
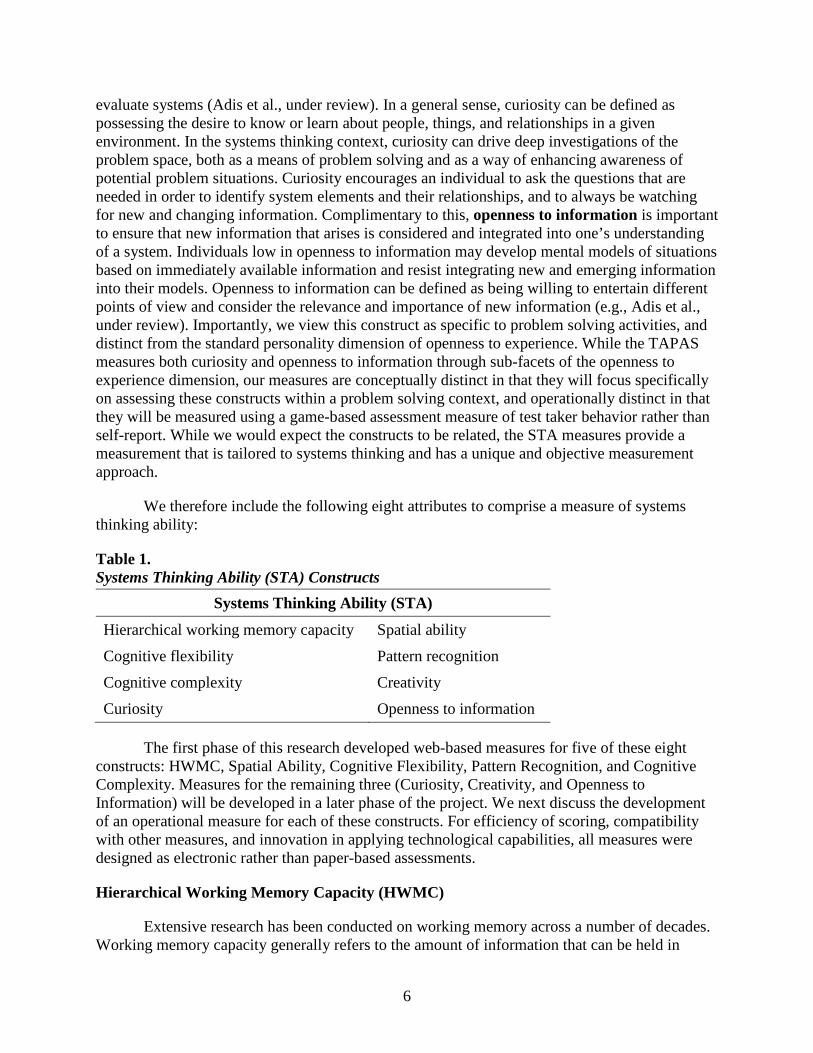
evaluate systems (Adis et al., under review). In a general sense, curiosity can be defined as possessing the desire to know or learn about people, things, and relationships in a given environment. In the systems thinking context, curiosity can drive deep investigations of the problem space, both as a means of problem solving and as a way of enhancing awareness of potential problem situations. Curiosity encourages an individual to ask the questions that are needed in order to identify system elements and their relationships, and to always be watching for new and changing information. Complimentary to this, openness to information is important to ensure that new information that arises is considered and integrated into one’s understanding of a system. Individuals low in openness to information may develop mental models of situations based on immediately available information and resist integrating new and emerging information into their models. Openness to information can be defined as being willing to entertain different points of view and consider the relevance and importance of new information (e.g., Adis et al., under review). Importantly, we view this construct as specific to problem solving activities, and distinct from the standard personality dimension of openness to experience. While the TAPAS measures both curiosity and openness to information through sub-facets of the openness to experience dimension, our measures are conceptually distinct in that they will focus specifically on assessing these constructs within a problem solving context, and operationally distinct in that they will be measured using a game-based assessment measure of test taker behavior rather than self-report. While we would expect the constructs to be related, the STA measures provide a measurement that is tailored to systems thinking and has a unique and objective measurement approach.
We therefore include the following eight attributes to comprise a measure of systems thinking ability:
Table 1. Systems Thinking Ability (STA) Constructs
Systems Thinking Ability (STA)
Hierarchical working memory capacity Spatial ability
Cognitive flexibility Pattern recognition
Cognitive complexity Creativity
Curiosity Openness to information
The first phase of this research developed web-based measures for five of these eight constructs: HWMC, Spatial Ability, Cognitive Flexibility, Pattern Recognition, and Cognitive Complexity. Measures for the remaining three (Curiosity, Creativity, and Openness to Information) will be developed in a later phase of the project. We next discuss the development of an operational measure for each of these constructs. For efficiency of scoring, compatibility with other measures, and innovation in applying technological capabilities, all measures were designed as electronic rather than paper-based assessments.
Hierarchical Working Memory Capacity (HWMC)
Extensive research has been conducted on working memory across a number of decades. Working memory capacity generally refers to the amount of information that can be held in
7
short-term memory storage while executive attention is divided between remembering items and some other executive cognitive processing. Specifically it can be defined as individual differences in the cognitive system responsible for storing information required for ongoing cognitive operations (Wilhelm, Hildebrandt, & Oberauer, 2013).
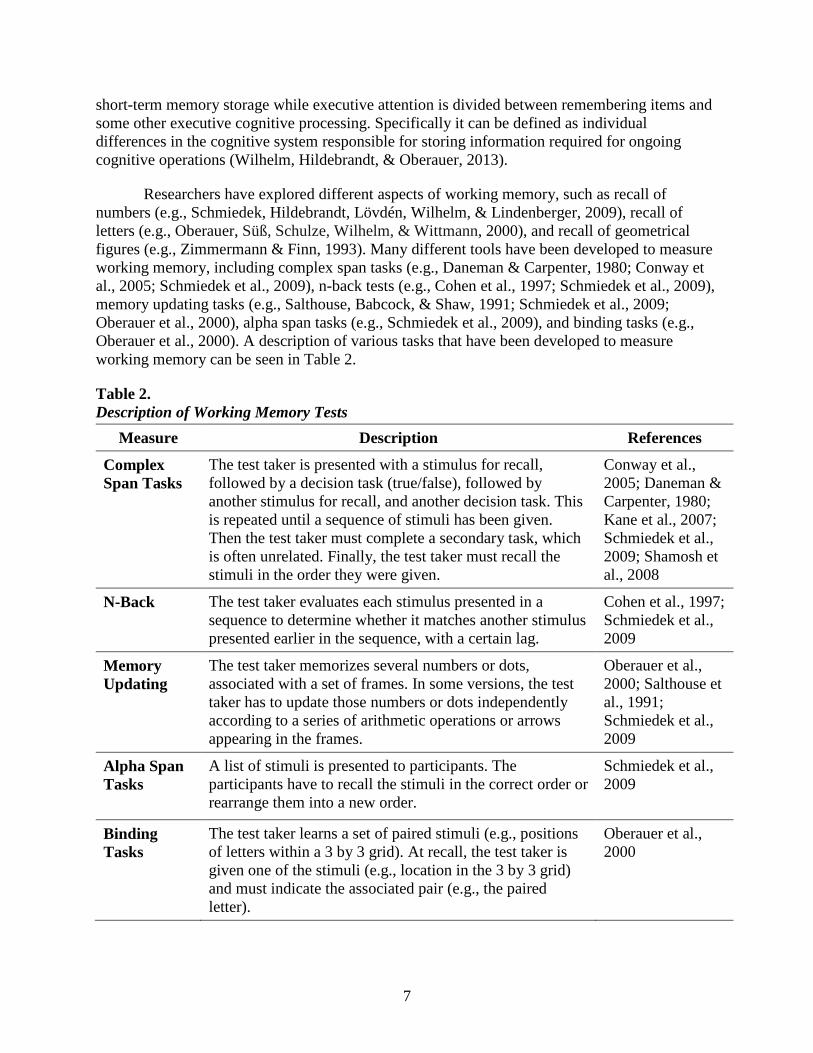
Researchers have explored different aspects of working memory, such as recall of numbers (e.g., Schmiedek, Hildebrandt, Lövdén, Wilhelm, & Lindenberger, 2009), recall of letters (e.g., Oberauer, Süß, Schulze, Wilhelm, & Wittmann, 2000), and recall of geometrical figures (e.g., Zimmermann & Finn, 1993). Many different tools have been developed to measure working memory, including complex span tasks (e.g., Daneman & Carpenter, 1980; Conway et al., 2005; Schmiedek et al., 2009), n-back tests (e.g., Cohen et al., 1997; Schmiedek et al., 2009), memory updating tasks (e.g., Salthouse, Babcock, & Shaw, 1991; Schmiedek et al., 2009; Oberauer et al., 2000), alpha span tasks (e.g., Schmiedek et al., 2009), and binding tasks (e.g., Oberauer et al., 2000). A description of various tasks that have been developed to measure working memory can be seen in Table 2.
Table 2. Description of Working Memory Tests
Measure Description References
Complex Span Tasks
The test taker is presented with a stimulus for recall, followed by a decision task (true/false), followed by another stimulus for recall, and another decision task. This is repeated until a sequence of stimuli has been given. Then the test taker must complete a secondary task, which is often unrelated. Finally, the test taker must recall the stimuli in the order they were given.
Conway et al., 2005; Daneman & Carpenter, 1980; Kane et al., 2007; Schmiedek et al., 2009; Shamosh et al., 2008
N-Back
The test taker evaluates each stimulus presented in a sequence to determine whether it matches another stimulus presented earlier in the sequence, with a certain lag.
Cohen et al., 1997; Schmiedek et al., 2009
Memory Updating
The test taker memorizes several numbers or dots, associated with a set of frames. In some versions, the test taker has to update those numbers or dots independently according to a series of arithmetic operations or arrows appearing in the frames.
Oberauer et al., 2000; Salthouse et al., 1991; Schmiedek et al., 2009
Alpha Span Tasks
A list of stimuli is presented to participants. The participants have to recall the stimuli in the correct order or rearrange them into a new order.
Schmiedek et al., 2009
Binding Tasks
The test taker learns a set of paired stimuli (e.g., positions of letters within a 3 by 3 grid). At recall, the test taker is given one of the stimuli (e.g., location in the 3 by 3 grid) and must indicate the associated pair (e.g., the paired letter).
Oberauer et al., 2000
8
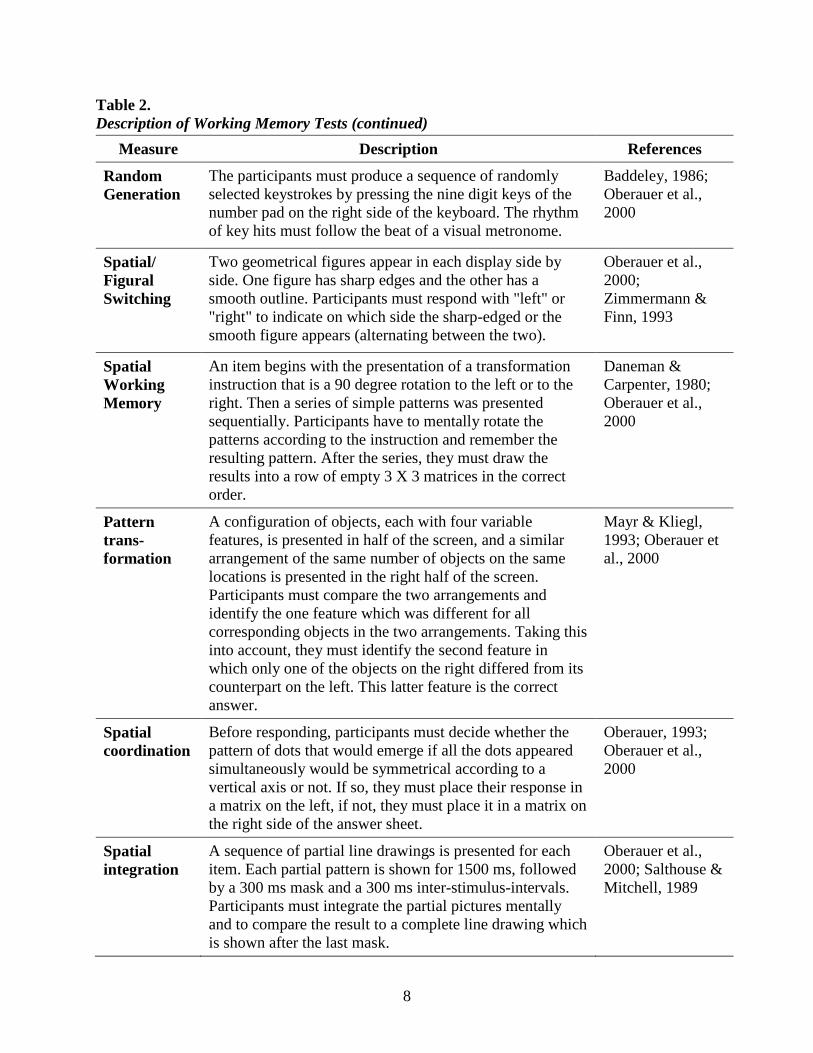
Table 2. Description of Working Memory Tests (continued)
Measure Description References
Random Generation
The participants must produce a sequence of randomly selected keystrokes by pressing the nine digit keys of the number pad on the right side of the keyboard. The rhythm of key hits must follow the beat of a visual metronome.
Baddeley, 1986; Oberauer et al., 2000
Spatial/ Figural Switching
Two geometrical figures appear in each display side by side. One figure has sharp edges and the other has a smooth outline. Participants must respond with "left" or "right" to indicate on which side the sharp-edged or the smooth figure appears (alternating between the two).
Oberauer et al., 2000; Zimmermann & Finn, 1993
Spatial Working Memory
An item begins with the presentation of a transformation instruction that is a 90 degree rotation to the left or to the right. Then a series of simple patterns was presented sequentially. Participants have to mentally rotate the patterns according to the instruction and remember the resulting pattern. After the series, they must draw the results into a row of empty 3 X 3 matrices in the correct order.
Daneman & Carpenter, 1980; Oberauer et al., 2000
Pattern trans-formation
A configuration of objects, each with four variable features, is presented in half of the screen, and a similar arrangement of the same number of objects on the same locations is presented in the right half of the screen. Participants must compare the two arrangements and identify the one feature which was different for all corresponding objects in the two arrangements. Taking this into account, they must identify the second feature in which only one of the objects on the right differed from its counterpart on the left. This latter feature is the correct answer.
Mayr & Kliegl, 1993; Oberauer et al., 2000
Spatial coordination
Before responding, participants must decide whether the pattern of dots that would emerge if all the dots appeared simultaneously would be symmetrical according to a vertical axis or not. If so, they must place their response in a matrix on the left, if not, they must place it in a matrix on the right side of the answer sheet.
Oberauer, 1993; Oberauer et al., 2000
Spatial integration
A sequence of partial line drawings is presented for each item. Each partial pattern is shown for 1500 ms, followed by a 300 ms mask and a 300 ms inter-stimulus-intervals. Participants must integrate the partial pictures mentally and to compare the result to a complete line drawing which is shown after the last mask.
Oberauer et al., 2000; Salthouse & Mitchell, 1989
9
Table 2. Description of Working Memory Tests (continued)
Measure Description References
Tracking
Ten identical small circles appear on the screen in a random arrangement. Subsets of two to five circles are flashed 10 times on the screen, and these are declared to be targets. All 10 circles move on random trajectories with about 70 mm/s. Participants must follow the targets while they move together with the distractors. After about 8 s, the circles stop, and numbers between 1 and 10 are assigned to them. Participants must type the numbers of the targets in free order.
Oberauer et al., 2000; Pylyshyn & Storm, 1988
Recall n-back
Rather than y/n responding to signify recognition of an n-back stimulus, test taker fills in the correct answer (letter, number, spatial location, etc.)
Dobbs & Rule, 1989
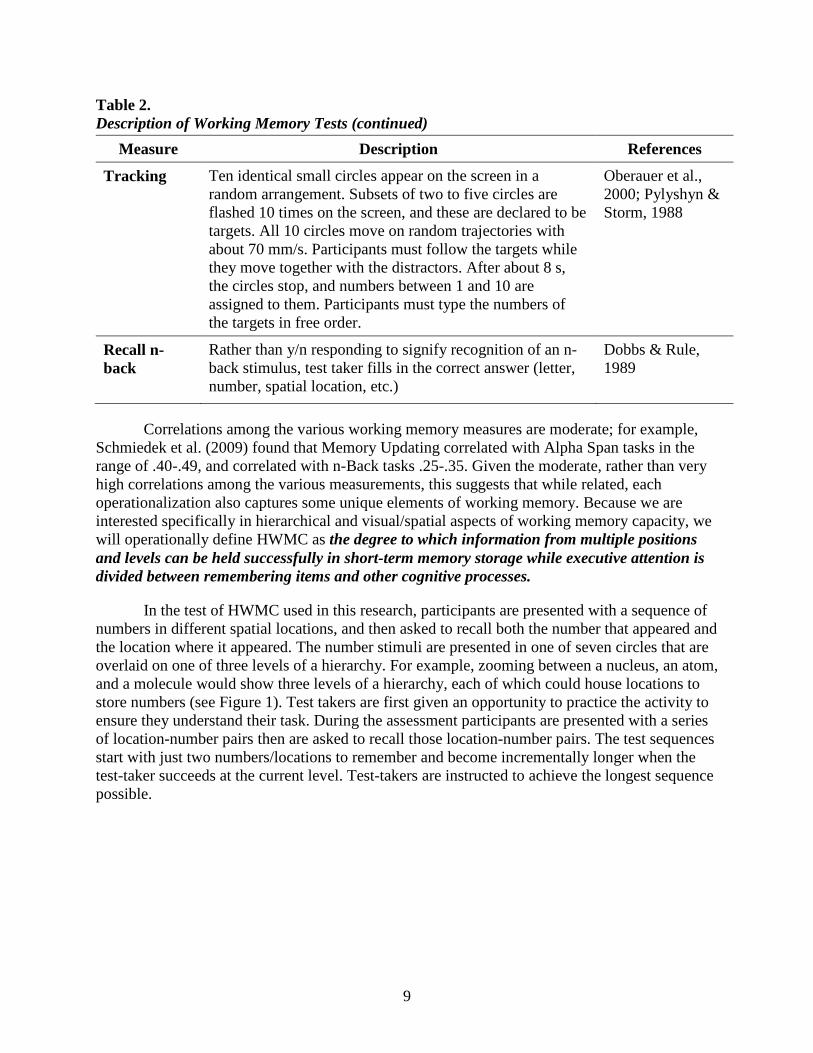
Correlations among the various working memory measures are moderate; for example, Schmiedek et al. (2009) found that Memory Updating correlated with Alpha Span tasks in the range of .40-.49, and correlated with n-Back tasks .25-.35. Given the moderate, rather than very high correlations among the various measurements, this suggests that while related, each operationalization also captures some unique elements of working memory. Because we are interested specifically in hierarchical and visual/spatial aspects of working memory capacity, we will operationally define HWMC as the degree to which information from multiple positions and levels can be held successfully in short-term memory storage while executive attention is divided between remembering items and other cognitive processes.
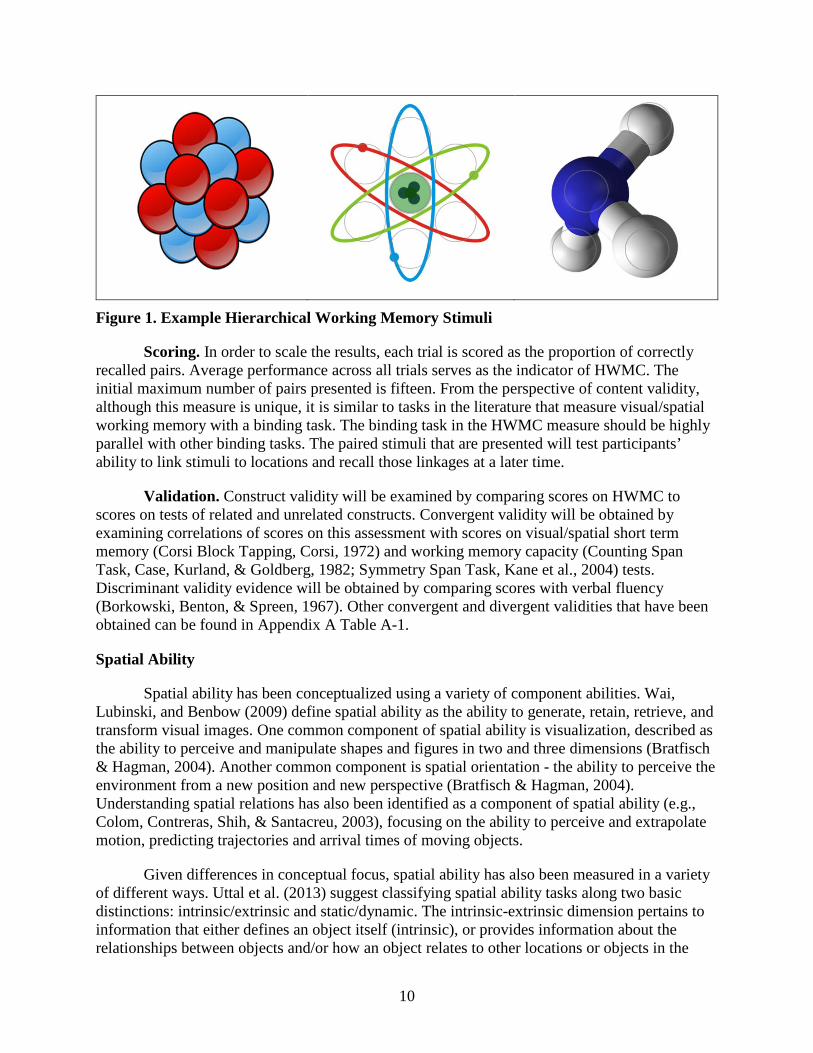
In the test of HWMC used in this research, participants are presented with a sequence of numbers in different spatial locations, and then asked to recall both the number that appeared and the location where it appeared. The number stimuli are presented in one of seven circles that are overlaid on one of three levels of a hierarchy. For example, zooming between a nucleus, an atom, and a molecule would show three levels of a hierarchy, each of which could house locations to store numbers (see Figure 1). Test takers are first given an opportunity to practice the activity to ensure they understand their task. During the assessment participants are presented with a series of location-number pairs then are asked to recall those location-number pairs. The test sequences start with just two numbers/locations to remember and become incrementally longer when the test-taker succeeds at the current level. Test-takers are instructed to achieve the longest sequence possible.
10
Figure 1. Example Hierarchical Working Memory Stimuli
Scoring. In order to scale the results, each trial is scored as the proportion of correctly recalled pairs. Average performance across all trials serves as the indicator of HWMC. The initial maximum number of pairs presented is fifteen. From the perspective of content validity, although this measure is unique, it is similar to tasks in the literature that measure visual/spatial working memory with a binding task. The binding task in the HWMC measure should be highly parallel with other binding tasks. The paired stimuli that are presented will test participants’ ability to link stimuli to locations and recall those linkages at a later time.
Validation. Construct validity will be examined by comparing scores on HWMC to scores on tests of related and unrelated constructs. Convergent validity will be obtained by examining correlations of scores on this assessment with scores on visual/spatial short term memory (Corsi Block Tapping, Corsi, 1972) and working memory capacity (Counting Span Task, Case, Kurland, & Goldberg, 1982; Symmetry Span Task, Kane et al., 2004) tests. Discriminant validity evidence will be obtained by comparing scores with verbal fluency (Borkowski, Benton, & Spreen, 1967). Other convergent and divergent validities that have been obtained can be found in Appendix A Table A-1.
Spatial Ability
Spatial ability has been conceptualized using a variety of component abilities. Wai, Lubinski, and Benbow (2009) define spatial ability as the ability to generate, retain, retrieve, and transform visual images. One common component of spatial ability is visualization, described as the ability to perceive and manipulate shapes and figures in two and three dimensions (Bratfisch & Hagman, 2004). Another common component is spatial orientation - the ability to perceive the environment from a new position and new perspective (Bratfisch & Hagman, 2004). Understanding spatial relations has also been identified as a component of spatial ability (e.g., Colom, Contreras, Shih, & Santacreu, 2003), focusing on the ability to perceive and extrapolate motion, predicting trajectories and arrival times of moving objects.
Given differences in conceptual focus, spatial ability has also been measured in a variety of different ways. Uttal et al. (2013) suggest classifying spatial ability tasks along two basic distinctions: intrinsic/extrinsic and static/dynamic. The intrinsic-extrinsic dimension pertains to information that either defines an object itself (intrinsic), or provides information about the relationships between objects and/or how an object relates to other locations or objects in the

11
environment (extrinsic). Thus, for example, intrinsic spatial information enables one to distinguish a fork from the knives and spoons within a drawer. Extrinsic spatial information enables one to determine that all the knives are lined up on the right side of the drawer and all the forks are on the left side of the drawer.
The static-dynamic dimension pertains to whether the task presents stationary stimuli (static), or if the stimuli in the task have actual, implied, or mentally simulated movement (dynamic). For example, both of the examples regarding the silverware used static information, as there was no movement involved or implied. In dynamic tasks objects require movement such as cutting, folding, or rotating. Determining whether a piece of furniture will fit through a doorway when rotated uses dynamic information.
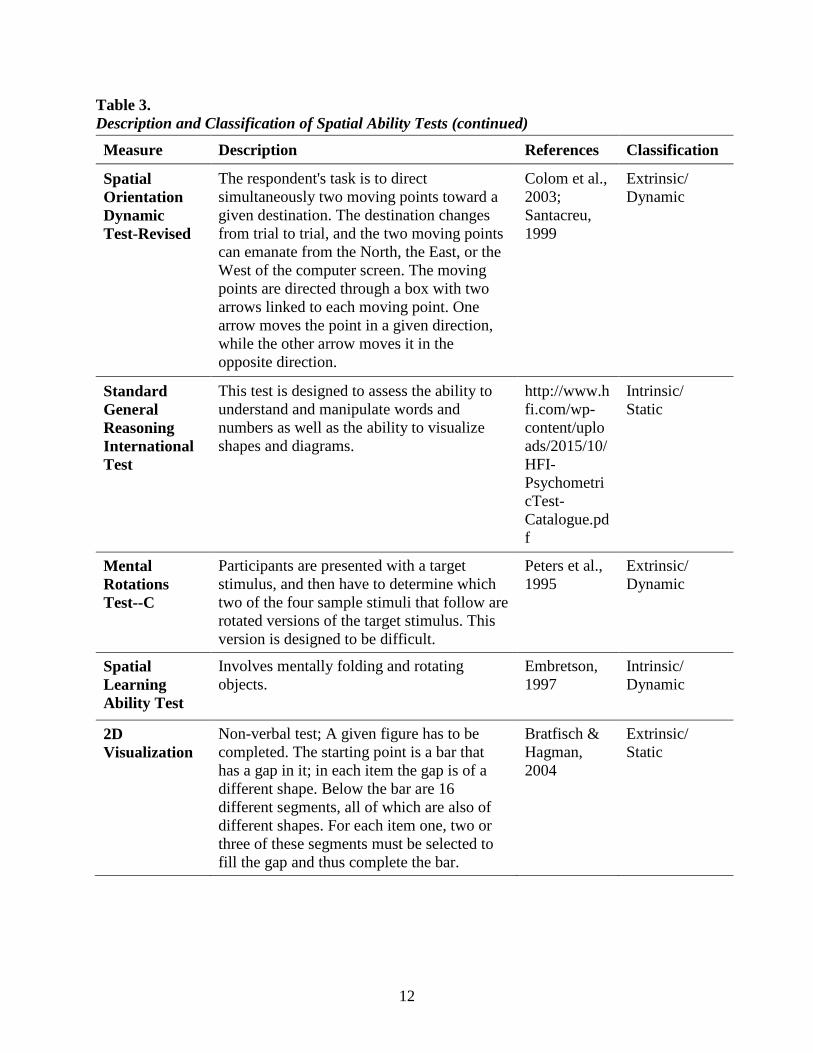
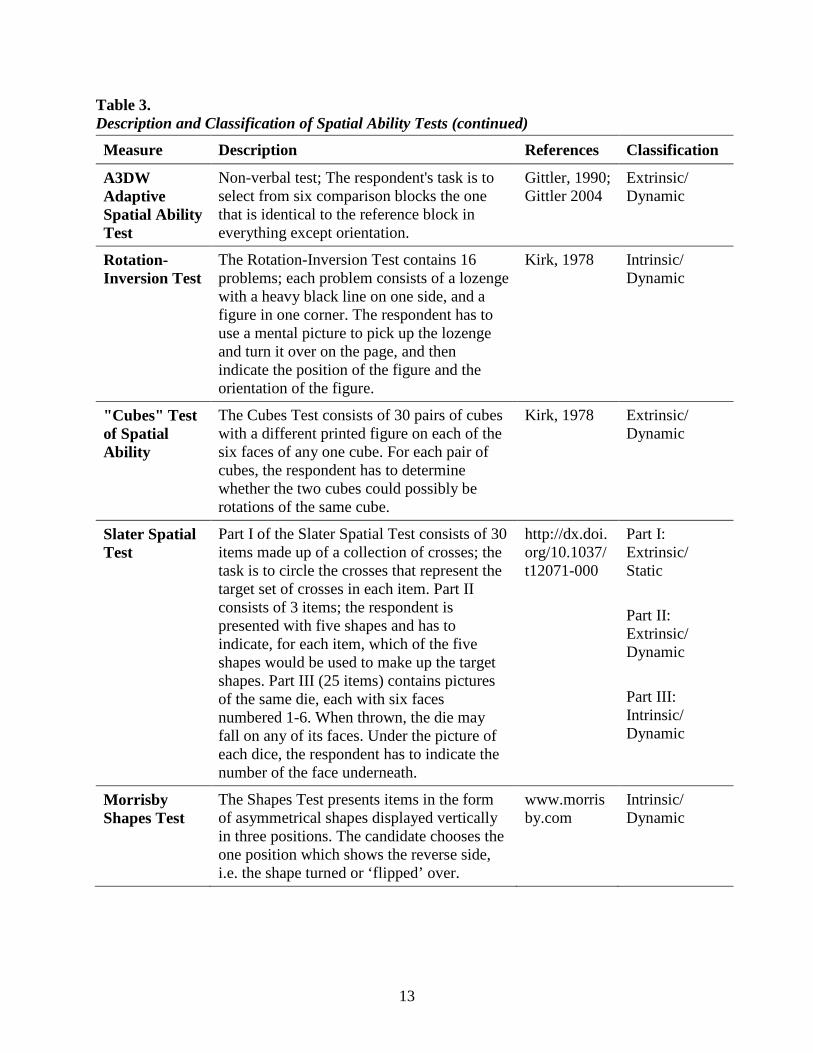
A description of some of the existing spatial ability tests can be seen in Table 3, as well as how they would be classified using this typology. The Army’s Assembling Objects (AO) test, for example, which measures the ability to determine how an object will look when its parts are put together (see DMDC, 2009) requires considering how the objects related to each other (extrinsic), and moving them around mentally to combine the pieces to form a larger shape (dynamic).
Table 3. Description and Classification of Spatial Ability Tests
Measure Description References Classification
Mental Rotations Test
This test measures the time it takes to make a decision after mentally manipulating some object. E.g., yes/no decision on whether two objects are symmetrical, with objects rotated relative to one another.
Shepard & Metzler, 1971; Vandenberg & Kuse, 1978
Intrinsic/ Dynamic
Mental Rotations Test 0-4
Respondents are directed to rapidly find 0-4 figures among four alternatives that are identical to a target figure.
Glück & Fabrizii, 2010
Extrinsic/ Static
Scales spc The task is to find mistakes in the copy of a pattern. Thereby the copy can be rotated, mirrored or rotated and mirrored.
www.cut-e.com/assessment-solutions
Intrinsic/ Dynamic
Mental Cutting Test
Participants must mentally cut three-dimensional geometrical figures (e.g., pyramids, cones) that are hollow. These figures must be cut by a plane or another geometrical figure and the two-dimensional mental-cut surfaces (e.g., triangles, rectangles) resulting from the given cutting operations must be determined.
Fay & Quaiser-Pohl, 1999; Quaiser-Pohl, 2003
Intrinsic/ Dynamic
12
Table 3. Description and Classification of Spatial Ability Tests (continued)
Measure Description References Classification
Spatial Orientation Dynamic Test-Revised
The respondent's task is to direct simultaneously two moving points toward a given destination. The destination changes from trial to trial, and the two moving points can emanate from the North, the East, or the West of the computer screen. The moving points are directed through a box with two arrows linked to each moving point. One arrow moves the point in a given direction, while the other arrow moves it in the opposite direction.
Colom et al., 2003; Santacreu, 1999
Extrinsic/ Dynamic
Standard General Reasoning International Test
This test is designed to assess the ability to understand and manipulate words and numbers as well as the ability to visualize shapes and diagrams.
http://www.hfi.com/wp-content/uploads/2015/10/HFI-PsychometricTest-Catalogue.pdf
Intrinsic/ Static
Mental Rotations Test--C
Participants are presented with a target stimulus, and then have to determine which two of the four sample stimuli that follow are rotated versions of the target stimulus. This version is designed to be difficult.
Peters et al., 1995
Extrinsic/ Dynamic
Spatial Learning Ability Test
Involves mentally folding and rotating objects.
Embretson, 1997
Intrinsic/ Dynamic
2D Visualization
Non-verbal test; A given figure has to be completed. The starting point is a bar that has a gap in it; in each item the gap is of a different shape. Below the bar are 16 different segments, all of which are also of different shapes. For each item one, two or three of these segments must be selected to fill the gap and thus complete the bar.
Bratfisch & Hagman, 2004
Extrinsic/ Static
13
Table 3. Description and Classification of Spatial Ability Tests (continued)
Measure Description References Classification
A3DW Adaptive Spatial Ability Test
Non-verbal test; The respondent's task is to select from six comparison blocks the one that is identical to the reference block in everything except orientation.
Gittler, 1990; Gittler 2004
Extrinsic/ Dynamic
Rotation-Inversion Test
The Rotation-Inversion Test contains 16 problems; each problem consists of a lozenge with a heavy black line on one side, and a figure in one corner. The respondent has to use a mental picture to pick up the lozenge and turn it over on the page, and then indicate the position of the figure and the orientation of the figure.
Kirk, 1978 Intrinsic/ Dynamic
"Cubes" Test of Spatial Ability
The Cubes Test consists of 30 pairs of cubes with a different printed figure on each of the six faces of any one cube. For each pair of cubes, the respondent has to determine whether the two cubes could possibly be rotations of the same cube.
Kirk, 1978 Extrinsic/ Dynamic
Slater Spatial Test
Part I of the Slater Spatial Test consists of 30 items made up of a collection of crosses; the task is to circle the crosses that represent the target set of crosses in each item. Part II consists of 3 items; the respondent is presented with five shapes and has to indicate, for each item, which of the five shapes would be used to make up the target shapes. Part III (25 items) contains pictures of the same die, each with six faces numbered 1-6. When thrown, the die may fall on any of its faces. Under the picture of each dice, the respondent has to indicate the number of the face underneath.
http://dx.doi.org/10.1037/t12071-000
Part I: Extrinsic/ Static Part II: Extrinsic/ Dynamic Part III: Intrinsic/ Dynamic
Morrisby Shapes Test
The Shapes Test presents items in the form of asymmetrical shapes displayed vertically in three positions. The candidate chooses the one position which shows the reverse side, i.e. the shape turned or ‘flipped’ over.
www.morrisby.com
Intrinsic/ Dynamic

14
Table 3. Description and Classification of Spatial Ability Tests (continued)
Measure Description References Classification
Verbal Test of Spatial Ability
Items were presented verbally (e.g., “Imagine that you are walking north. You turn right at the first corner, walk one block, and then turn left. In what direction are you facing?”), and required a verbal response.
Lohman, 2005
Extrinsic/ Dynamic
Assembling Objects
Measures the ability to figure out how an object will look when its parts are put together.
DMDC ASVAB Technical Bulletin No. 2, Aug 2009 (Part of ASVAB)
Intrinsic/ Dynamic
Card Rotation Test
Given the object on the left, the participant must check whether the object on the right is the same or different.
French et al., 1963
Extrinsic/ Static
Hidden Figures Test
The participant must select which one of the set of five geometric shapes is hidden in the figure below the set.
Ekstrom et al., 1976
Extrinsic/ Static
The Revised Minnesota Paper Form Board Test
Participants are shown geometric shapes and then must select which one of the five completed figures can be made from the shapes.
Likert & Quasha, 1995
Extrinsic/ Dynamic
The Punched Holes Test
The image on the left shows a sequence of folds in a piece of paper through which a hole or set of holes is punched. The participant must choose which of the five images on the right would correspond with the unfolded paper.
Ekstrom et al., 1976
Extrinsic/ Dynamic
The surface development test
The participant creates a mental image of the object on the right built from a flat pattern on the left, then they must determine which letters on the 3D image correspond with the numbers on the flat pattern.
Ekstrom et al., 1976
Extrinsic/ Dynamic
In order to encompass all four combinations of the intrinsic/extrinsic and static/dynamic dimensions in our conceptualization of spatial ability, we defined spatial ability as: the set of cognitive abilities that allows an individual to process visual stimuli among distractors, understand a visual scene, and accurately encode and mentally manipulate visual objects or spatial relationships. Given that previous measures of SA have captured only some of the four SA dimensions, we developed a measure of Spatial Ability (SA) that is comprehensive in
15
capturing these dimensions. The measure uses four sets of items that focus on one of the four dimensions of spatial reasoning: intrinsic-static, intrinsic-dynamic, extrinsic-static, and extrinsic-dynamic (Newcombe & Shipley, 2015; Uttal et al., 2013). Each subdimension is tested in sequence through four phases of the SA measure.
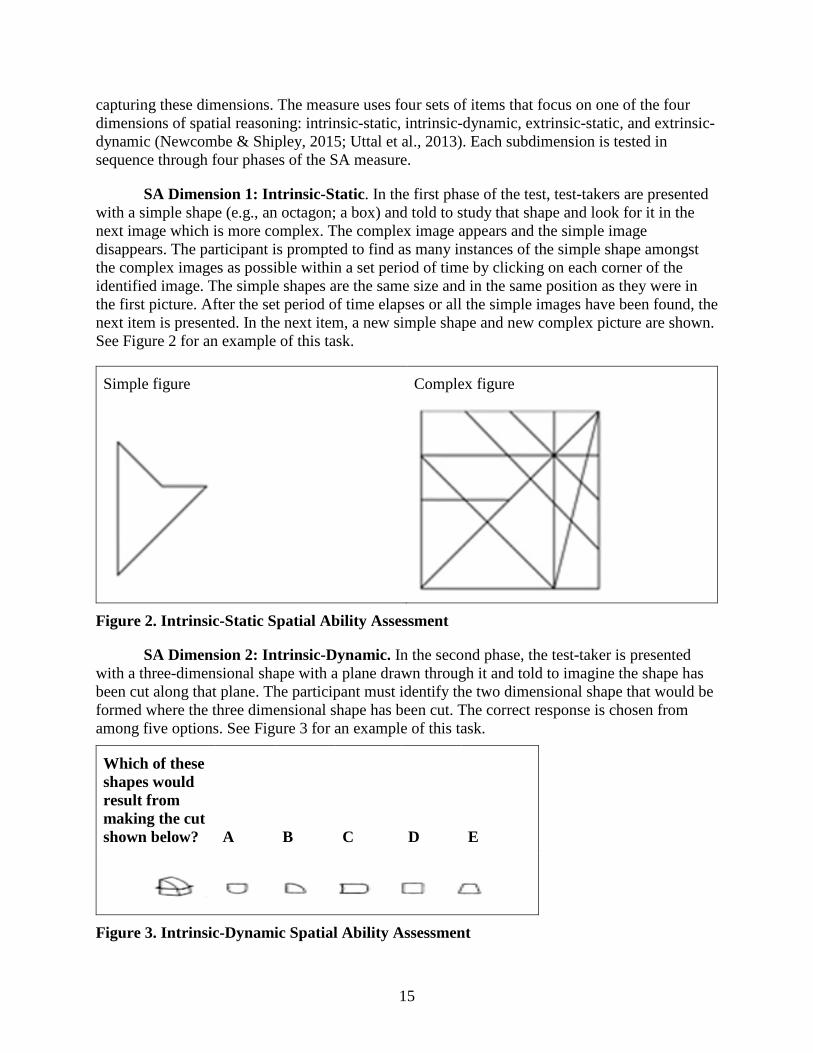
SA Dimension 1: Intrinsic-Static. In the first phase of the test, test-takers are presented with a simple shape (e.g., an octagon; a box) and told to study that shape and look for it in the next image which is more complex. The complex image appears and the simple image disappears. The participant is prompted to find as many instances of the simple shape amongst the complex images as possible within a set period of time by clicking on each corner of the identified image. The simple shapes are the same size and in the same position as they were in the first picture. After the set period of time elapses or all the simple images have been found, the next item is presented. In the next item, a new simple shape and new complex picture are shown. See Figure 2 for an example of this task.
Simple figure Complex figure
Figure 2. Intrinsic-Static Spatial Ability Assessment
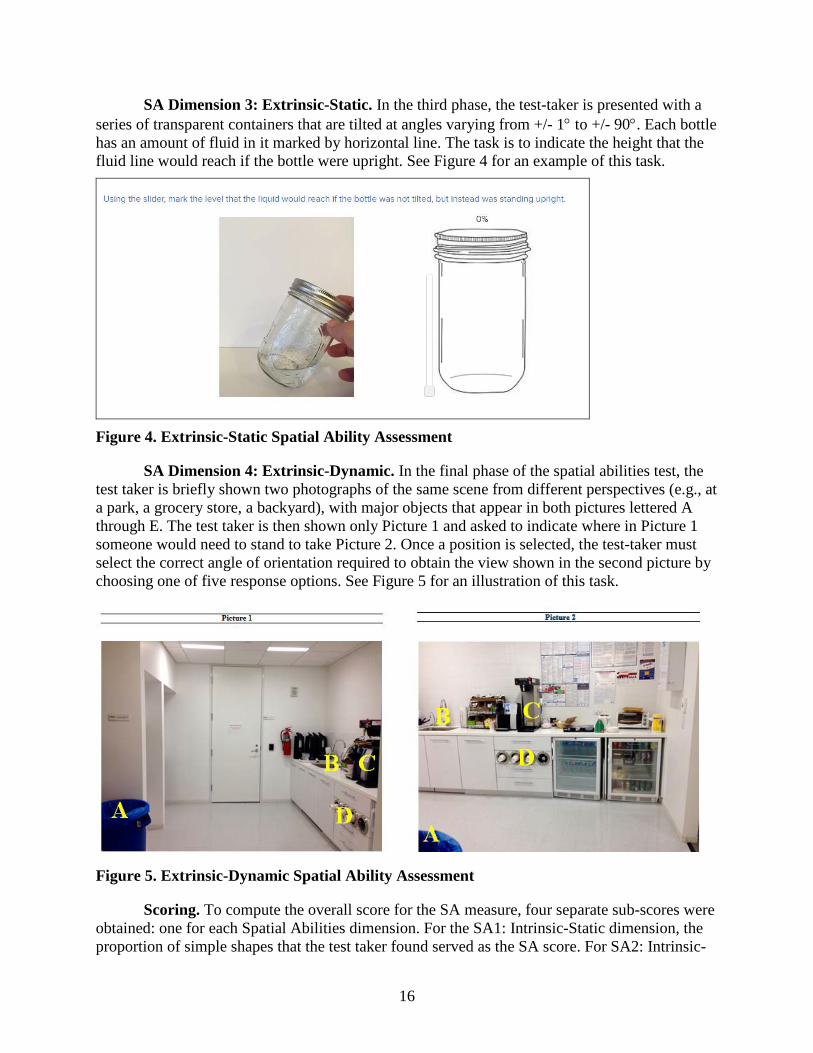
SA Dimension 2: Intrinsic-Dynamic. In the second phase, the test-taker is presented with a three-dimensional shape with a plane drawn through it and told to imagine the shape has been cut along that plane. The participant must identify the two dimensional shape that would be formed where the three dimensional shape has been cut. The correct response is chosen from among five options. See Figure 3 for an example of this task.
Which of these shapes would result from making the cut shown below? A B C D E
Figure 3. Intrinsic-Dynamic Spatial Ability Assessment
16
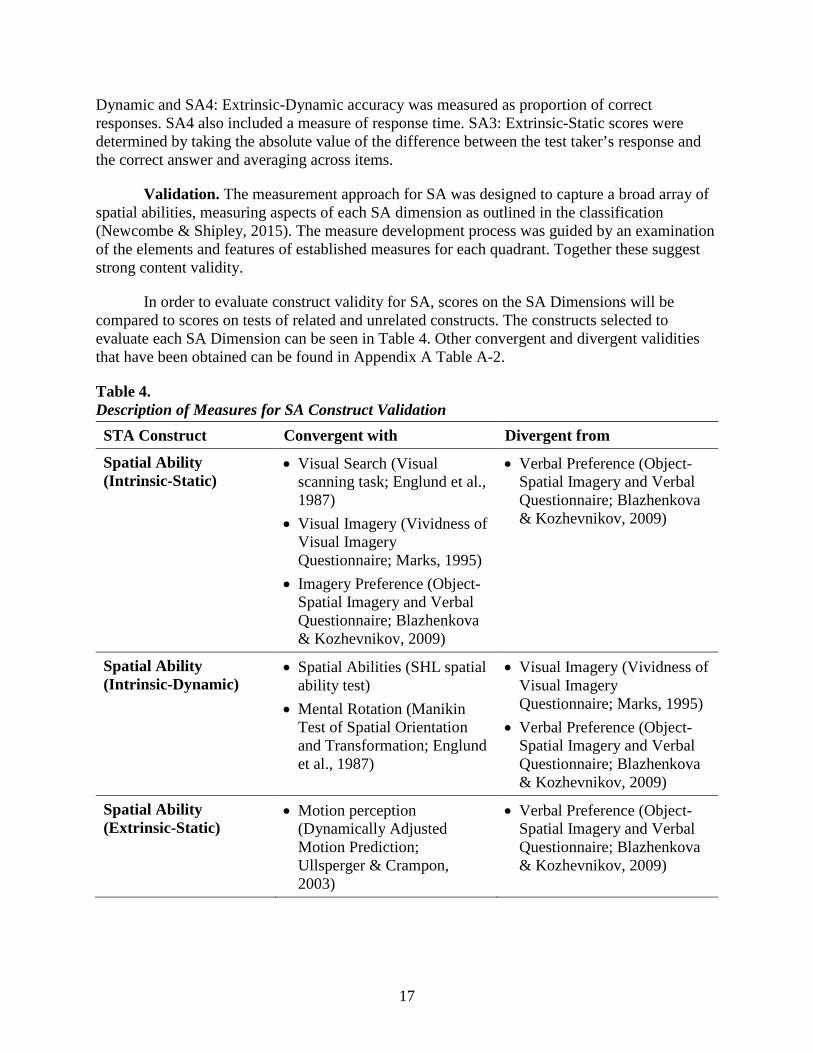
SA Dimension 3: Extrinsic-Static. In the third phase, the test-taker is presented with a series of transparent containers that are tilted at angles varying from +/- 1° to +/- 90°. Each bottle has an amount of fluid in it marked by horizontal line. The task is to indicate the height that the fluid line would reach if the bottle were upright. See Figure 4 for an example of this task.
Figure 4. Extrinsic-Static Spatial Ability Assessment
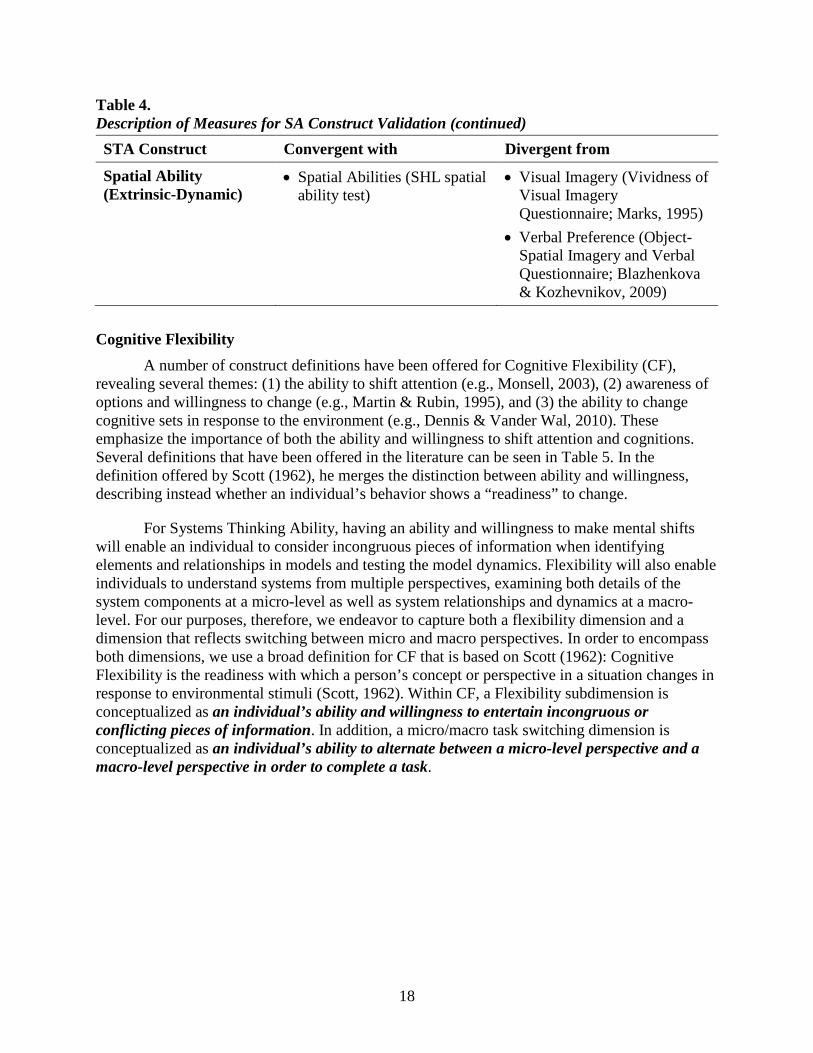
SA Dimension 4: Extrinsic-Dynamic. In the final phase of the spatial abilities test, the test taker is briefly shown two photographs of the same scene from different perspectives (e.g., at a park, a grocery store, a backyard), with major objects that appear in both pictures lettered A through E. The test taker is then shown only Picture 1 and asked to indicate where in Picture 1 someone would need to stand to take Picture 2. Once a position is selected, the test-taker must select the correct angle of orientation required to obtain the view shown in the second picture by choosing one of five response options. See Figure 5 for an illustration of this task.
Figure 5. Extrinsic-Dynamic Spatial Ability Assessment
Scoring. To compute the overall score for the SA measure, four separate sub-scores were obtained: one for each Spatial Abilities dimension. For the SA1: Intrinsic-Static dimension, the proportion of simple shapes that the test taker found served as the SA score. For SA2: Intrinsic-
17
Dynamic and SA4: Extrinsic-Dynamic accuracy was measured as proportion of correct responses. SA4 also included a measure of response time. SA3: Extrinsic-Static scores were determined by taking the absolute value of the difference between the test taker’s response and the correct answer and averaging across items.
Validation. The measurement approach for SA was designed to capture a broad array of spatial abilities, measuring aspects of each SA dimension as outlined in the classification (Newcombe & Shipley, 2015). The measure development process was guided by an examination of the elements and features of established measures for each quadrant. Together these suggest strong content validity.
In order to evaluate construct validity for SA, scores on the SA Dimensions will be compared to scores on tests of related and unrelated constructs. The constructs selected to evaluate each SA Dimension can be seen in Table 4. Other convergent and divergent validities that have been obtained can be found in Appendix A Table A-2.
Table 4. Description of Measures for SA Construct Validation STA Construct Convergent with Divergent from
Spatial Ability (Intrinsic-Static)
• Visual Search (Visual scanning task; Englund et al., 1987)
• Visual Imagery (Vividness of Visual Imagery Questionnaire; Marks, 1995)
• Imagery Preference (Object-Spatial Imagery and Verbal Questionnaire; Blazhenkova & Kozhevnikov, 2009)
• Verbal Preference (Object-Spatial Imagery and Verbal Questionnaire; Blazhenkova & Kozhevnikov, 2009)
Spatial Ability (Intrinsic-Dynamic)
• Spatial Abilities (SHL spatial ability test)
• Mental Rotation (Manikin Test of Spatial Orientation and Transformation; Englund et al., 1987)
• Visual Imagery (Vividness of Visual Imagery Questionnaire; Marks, 1995)
• Verbal Preference (Object-Spatial Imagery and Verbal Questionnaire; Blazhenkova & Kozhevnikov, 2009)
Spatial Ability (Extrinsic-Static)
• Motion perception (Dynamically Adjusted Motion Prediction; Ullsperger & Crampon, 2003)
• Verbal Preference (Object-Spatial Imagery and Verbal Questionnaire; Blazhenkova & Kozhevnikov, 2009)
18
Table 4. Description of Measures for SA Construct Validation (continued) STA Construct Convergent with Divergent from
Spatial Ability (Extrinsic-Dynamic)
• Spatial Abilities (SHL spatial ability test)
• Visual Imagery (Vividness of Visual Imagery Questionnaire; Marks, 1995)
• Verbal Preference (Object-Spatial Imagery and Verbal Questionnaire; Blazhenkova & Kozhevnikov, 2009)
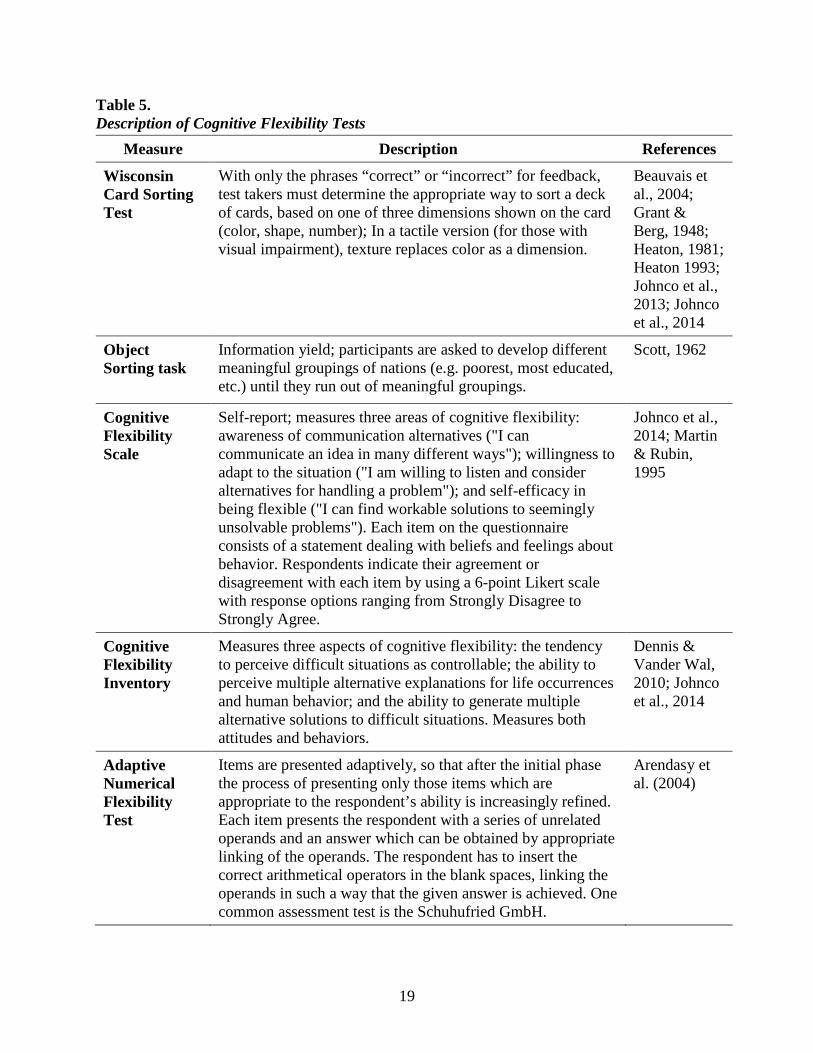
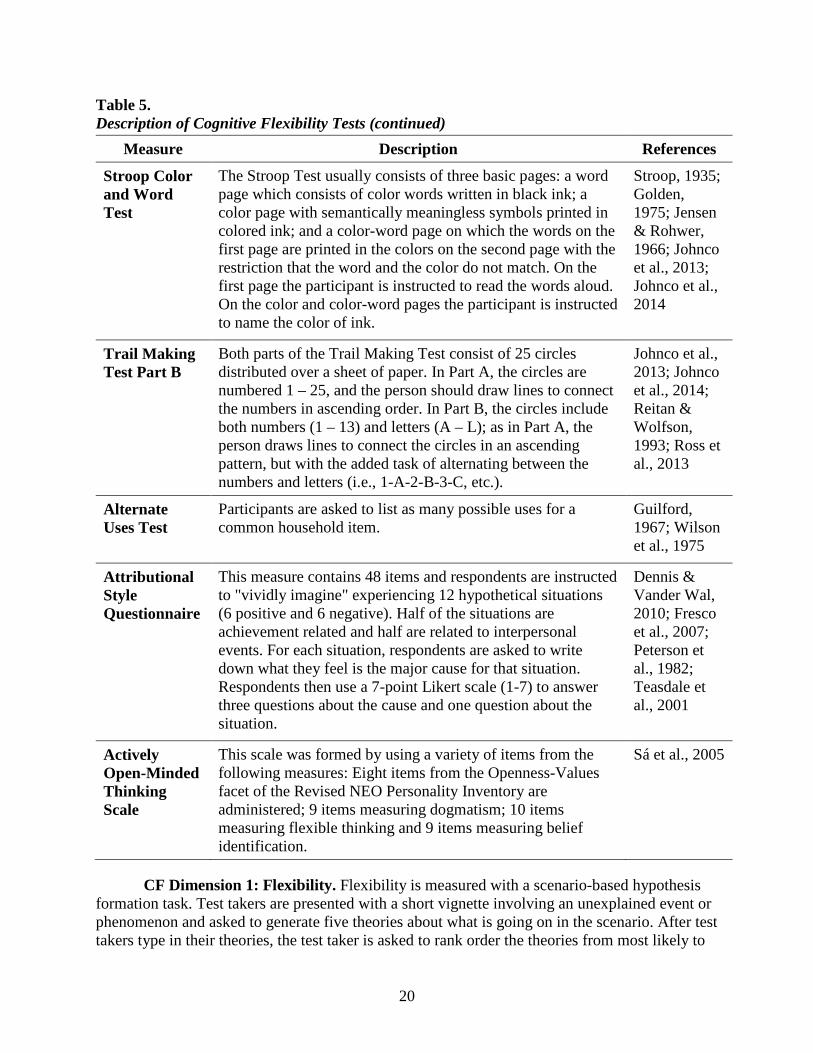
Cognitive Flexibility A number of construct definitions have been offered for Cognitive Flexibility (CF),
revealing several themes: (1) the ability to shift attention (e.g., Monsell, 2003), (2) awareness of options and willingness to change (e.g., Martin & Rubin, 1995), and (3) the ability to change cognitive sets in response to the environment (e.g., Dennis & Vander Wal, 2010). These emphasize the importance of both the ability and willingness to shift attention and cognitions. Several definitions that have been offered in the literature can be seen in Table 5. In the definition offered by Scott (1962), he merges the distinction between ability and willingness, describing instead whether an individual’s behavior shows a “readiness” to change.
For Systems Thinking Ability, having an ability and willingness to make mental shifts will enable an individual to consider incongruous pieces of information when identifying elements and relationships in models and testing the model dynamics. Flexibility will also enable individuals to understand systems from multiple perspectives, examining both details of the system components at a micro-level as well as system relationships and dynamics at a macro-level. For our purposes, therefore, we endeavor to capture both a flexibility dimension and a dimension that reflects switching between micro and macro perspectives. In order to encompass both dimensions, we use a broad definition for CF that is based on Scott (1962): Cognitive Flexibility is the readiness with which a person’s concept or perspective in a situation changes in response to environmental stimuli (Scott, 1962). Within CF, a Flexibility subdimension is conceptualized as an individual’s ability and willingness to entertain incongruous or conflicting pieces of information. In addition, a micro/macro task switching dimension is conceptualized as an individual’s ability to alternate between a micro-level perspective and a macro-level perspective in order to complete a task.
19
Table 5. Description of Cognitive Flexibility Tests
Measure Description References
Wisconsin Card Sorting Test
With only the phrases “correct” or “incorrect” for feedback, test takers must determine the appropriate way to sort a deck of cards, based on one of three dimensions shown on the card (color, shape, number); In a tactile version (for those with visual impairment), texture replaces color as a dimension.
Beauvais et al., 2004; Grant & Berg, 1948; Heaton, 1981; Heaton 1993; Johnco et al., 2013; Johnco et al., 2014
Object Sorting task
Information yield; participants are asked to develop different meaningful groupings of nations (e.g. poorest, most educated, etc.) until they run out of meaningful groupings.
Scott, 1962
Cognitive Flexibility Scale
Self-report; measures three areas of cognitive flexibility: awareness of communication alternatives ("I can communicate an idea in many different ways"); willingness to adapt to the situation ("I am willing to listen and consider alternatives for handling a problem"); and self-efficacy in being flexible ("I can find workable solutions to seemingly unsolvable problems"). Each item on the questionnaire consists of a statement dealing with beliefs and feelings about behavior. Respondents indicate their agreement or disagreement with each item by using a 6-point Likert scale with response options ranging from Strongly Disagree to Strongly Agree.
Johnco et al., 2014; Martin & Rubin, 1995
Cognitive Flexibility Inventory
Measures three aspects of cognitive flexibility: the tendency to perceive difficult situations as controllable; the ability to perceive multiple alternative explanations for life occurrences and human behavior; and the ability to generate multiple alternative solutions to difficult situations. Measures both attitudes and behaviors.
Dennis & Vander Wal, 2010; Johnco et al., 2014
Adaptive Numerical Flexibility Test
Items are presented adaptively, so that after the initial phase the process of presenting only those items which are appropriate to the respondent’s ability is increasingly refined. Each item presents the respondent with a series of unrelated operands and an answer which can be obtained by appropriate linking of the operands. The respondent has to insert the correct arithmetical operators in the blank spaces, linking the operands in such a way that the given answer is achieved. One common assessment test is the Schuhufried GmbH.
Arendasy et al. (2004)
20
Table 5. Description of Cognitive Flexibility Tests (continued)
Measure Description References
Stroop Color and Word Test
The Stroop Test usually consists of three basic pages: a word page which consists of color words written in black ink; a color page with semantically meaningless symbols printed in colored ink; and a color-word page on which the words on the first page are printed in the colors on the second page with the restriction that the word and the color do not match. On the first page the participant is instructed to read the words aloud. On the color and color-word pages the participant is instructed to name the color of ink.
Stroop, 1935; Golden, 1975; Jensen & Rohwer, 1966; Johnco et al., 2013; Johnco et al., 2014
Trail Making Test Part B
Both parts of the Trail Making Test consist of 25 circles distributed over a sheet of paper. In Part A, the circles are numbered 1 – 25, and the person should draw lines to connect the numbers in ascending order. In Part B, the circles include both numbers (1 – 13) and letters (A – L); as in Part A, the person draws lines to connect the circles in an ascending pattern, but with the added task of alternating between the numbers and letters (i.e., 1-A-2-B-3-C, etc.).
Johnco et al., 2013; Johnco et al., 2014; Reitan & Wolfson, 1993; Ross et al., 2013
Alternate Uses Test
Participants are asked to list as many possible uses for a common household item.
Guilford, 1967; Wilson et al., 1975
Attributional Style Questionnaire
This measure contains 48 items and respondents are instructed to "vividly imagine" experiencing 12 hypothetical situations (6 positive and 6 negative). Half of the situations are achievement related and half are related to interpersonal events. For each situation, respondents are asked to write down what they feel is the major cause for that situation. Respondents then use a 7-point Likert scale (1-7) to answer three questions about the cause and one question about the situation.
Dennis & Vander Wal, 2010; Fresco et al., 2007; Peterson et al., 1982; Teasdale et al., 2001
Actively Open-Minded Thinking Scale
This scale was formed by using a variety of items from the following measures: Eight items from the Openness-Values facet of the Revised NEO Personality Inventory are administered; 9 items measuring dogmatism; 10 items measuring flexible thinking and 9 items measuring belief identification.
Sá et al., 2005
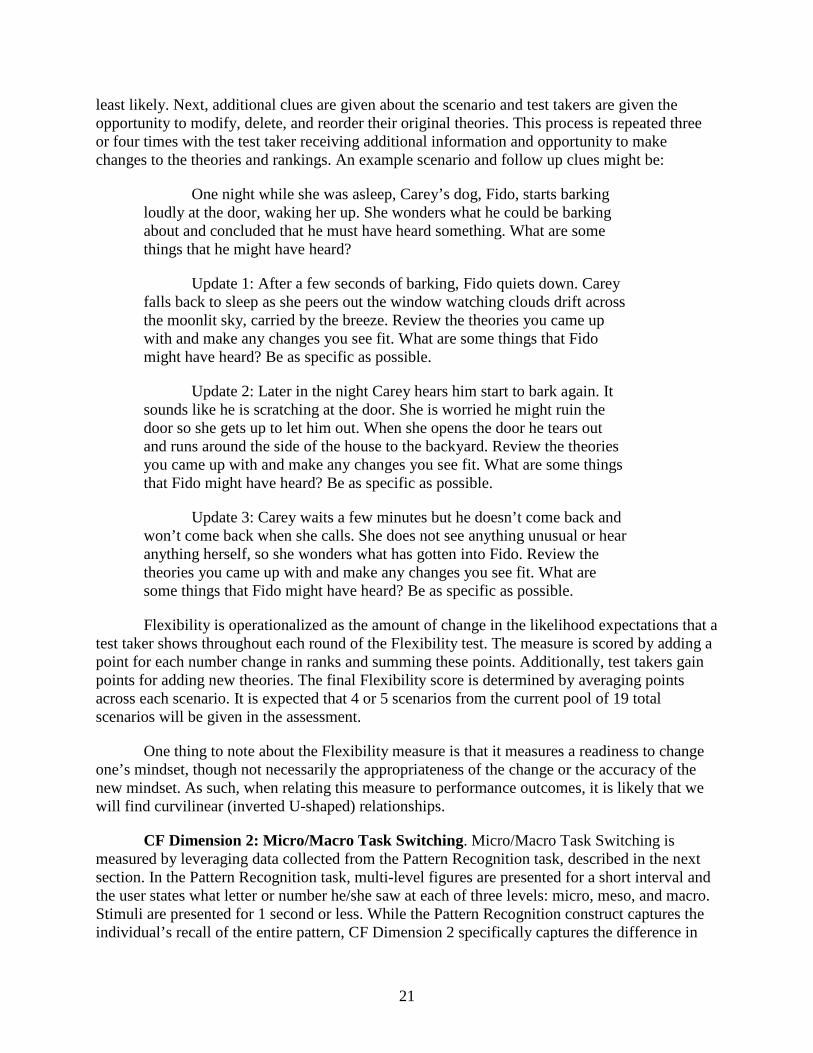
CF Dimension 1: Flexibility. Flexibility is measured with a scenario-based hypothesis formation task. Test takers are presented with a short vignette involving an unexplained event or phenomenon and asked to generate five theories about what is going on in the scenario. After test takers type in their theories, the test taker is asked to rank order the theories from most likely to
21
least likely. Next, additional clues are given about the scenario and test takers are given the opportunity to modify, delete, and reorder their original theories. This process is repeated three or four times with the test taker receiving additional information and opportunity to make changes to the theories and rankings. An example scenario and follow up clues might be:
One night while she was asleep, Carey’s dog, Fido, starts barking loudly at the door, waking her up. She wonders what he could be barking about and concluded that he must have heard something. What are some things that he might have heard?
Update 1: After a few seconds of barking, Fido quiets down. Carey falls back to sleep as she peers out the window watching clouds drift across the moonlit sky, carried by the breeze. Review the theories you came up with and make any changes you see fit. What are some things that Fido might have heard? Be as specific as possible.
Update 2: Later in the night Carey hears him start to bark again. It sounds like he is scratching at the door. She is worried he might ruin the door so she gets up to let him out. When she opens the door he tears out and runs around the side of the house to the backyard. Review the theories you came up with and make any changes you see fit. What are some things that Fido might have heard? Be as specific as possible.
Update 3: Carey waits a few minutes but he doesn’t come back and won’t come back when she calls. She does not see anything unusual or hear anything herself, so she wonders what has gotten into Fido. Review the theories you came up with and make any changes you see fit. What are some things that Fido might have heard? Be as specific as possible.
Flexibility is operationalized as the amount of change in the likelihood expectations that a test taker shows throughout each round of the Flexibility test. The measure is scored by adding a point for each number change in ranks and summing these points. Additionally, test takers gain points for adding new theories. The final Flexibility score is determined by averaging points across each scenario. It is expected that 4 or 5 scenarios from the current pool of 19 total scenarios will be given in the assessment.
One thing to note about the Flexibility measure is that it measures a readiness to change one’s mindset, though not necessarily the appropriateness of the change or the accuracy of the new mindset. As such, when relating this measure to performance outcomes, it is likely that we will find curvilinear (inverted U-shaped) relationships.
CF Dimension 2: Micro/Macro Task Switching. Micro/Macro Task Switching is measured by leveraging data collected from the Pattern Recognition task, described in the next section. In the Pattern Recognition task, multi-level figures are presented for a short interval and the user states what letter or number he/she saw at each of three levels: micro, meso, and macro. Stimuli are presented for 1 second or less. While the Pattern Recognition construct captures the individual’s recall of the entire pattern, CF Dimension 2 specifically captures the difference in

22
individual’s average reaction time and reaction times when stimuli change from one level (i.e., micro, meso, macro) to another. Participants’ reaction times are measured for responses at each level. A block of micro-level responses is elicited, and then the task switches to eliciting macro-level responses, or vice versa. The first new level (micro- or macro-) after the switch is the reaction time of interest for this measure. Users who are able to switch between levels with a quicker reaction time are considered more cognitively flexible.
Validation. Construct validity will be demonstrated by comparing scores on the CF assessment to scores on tests of related and unrelated constructs. For the Flexibility subdimension, convergent validity will be assessed by comparing scores on this assessment with scores on self-reported cognitive flexibility scales (Cognitive Flexibility Inventory, Dennis & Vander Wall, 2010; and Actively Open-Minded Thinking Scale, Stanovich & West, 2007). Discriminant validity will be examined by comparing scores on this assessment with scores on risk taking (Risk Taking Questionnaire, de Haan et al., 2011). For the Micro/Macro Task Switching subdimension, convergent validity will be assessed using a mental set switching task (Wisconsin Card Sorting Task; Berg, 1948), and discriminant validity will be assessed by comparing results to a pattern recognition task that also uses multi-level figures. A detailed list of correlations that have been obtained for CF measures can be found in Appendix A, Table A-3.
Pattern Recognition Pattern Recognition (PR) has been defined as “the ability to find repetitions in sequences
of objects or data, or in the rules governing their sequence” (e.g., Simon & Kotovsky, 1963; Kotovsky & Simon, 1973). In a general sense, it can be thought of as the ability to detect deviations in systematic processes. Previous measures have included: (1) the presentation of shapes, letters, numbers, or geometric forms after which the test taker needs to identify which item comes next to complete the pattern correctly (e.g. Doninger, Simon, & Schweiger, 2008; Kotovsky & Simon, 1973; Naglieri & Insko, 1986; Simon & Kotovsky, 1963), (2) recognition of patterns of hand gestures (Hanlon et al., 2005), and (3) identification of missing pieces from pictures (e.g., Dinsmore, Baggetta, Doyle, & Loughlin, 2014; Wechsler, 1999). A detailed description of existing PR measures can be seen in Table 6.
Conceptually, PR is an important underlying ability for a number of the cognitive processes essential for systems thinking, such as recognizing systems emergence and identifying system structures. PR can facilitate the identification of structures and patterns within a system, as well as identify anomalies or elements that do not fit within the system or expectations for system behavior. This could be particularly relevant when operating to protect systems in which anomaly detection can identify potential problems or threats to the system.
Two critical elements in PR, therefore, are anomaly detection and object recognition. In order to encompass both components, we use a broad definition for PR: the ability to find repetitions or deviations in sequences of objects or data, or in the rules governing their sequence (Simon & Kotovsky, 1963; Kotovsky & Simon, 1973).

23
Table 6. Description of Pattern Recognition Tests
Measure Description References
Pattern Completion and Serial Pattern tasks
Pattern Completion requires the individual to examine the directions and shapes in a diagram to determine which of six options accurately completes the pattern (can be done with letters and numbers). Serial Reasoning requires the individual to discover the order in which variables appear in the matrix diagram and decide which option completes the matrix according to the order of appearance.
Kotovsky & Simon, 1973; Naglieri & Insko, 1986; Simon & Kotovsky, 1963
Rock, Paper, Scissors Task
For RPS, illustrations of hand signals for R, P, and S were used as objects to resemble the childhood game that uses hand signals. On each trial, two objects were presented simultaneously, one centered on the left side of the screen and one centered on the right side of the screen. The participant was asked to choose which of the two objects was correct.
Hanlon et al., 2005
MindStreams Problem Solving test
Participants are presented with an incomplete pattern consisting of three squares containing simple geometric forms in a particular configuration. Six additional squares containing geometric forms are presented along the bottom of the screen. Responses with the keyboard number pad indicate which of the six forms best completes the pattern. The spatial relationships among the simple geometric forms become more complex as the test progresses, and the test is adaptive in that it terminates early when performance is poor.
Doninger et al., 2008
Block Pattern Analysis Test
At the top center of the page lies a 2 X 2 or 3 X 3 square with numbers designating the various sections. Beneath the grid are two red-and-white designs that are highly similar to each other, differing on only one segment. Participants are presented with each plate and are instructed to identify (with reference to the numbered key) the segment that causes the two patterns to appear different.
Caplan & Caffery, 1992
WAIS-III -Pattern Recognition
Participants are directed to examine each picture and then choose the missing piece from the five choices below the picture.
Dinsmore et al., 2014; Wechsler, 1999
24
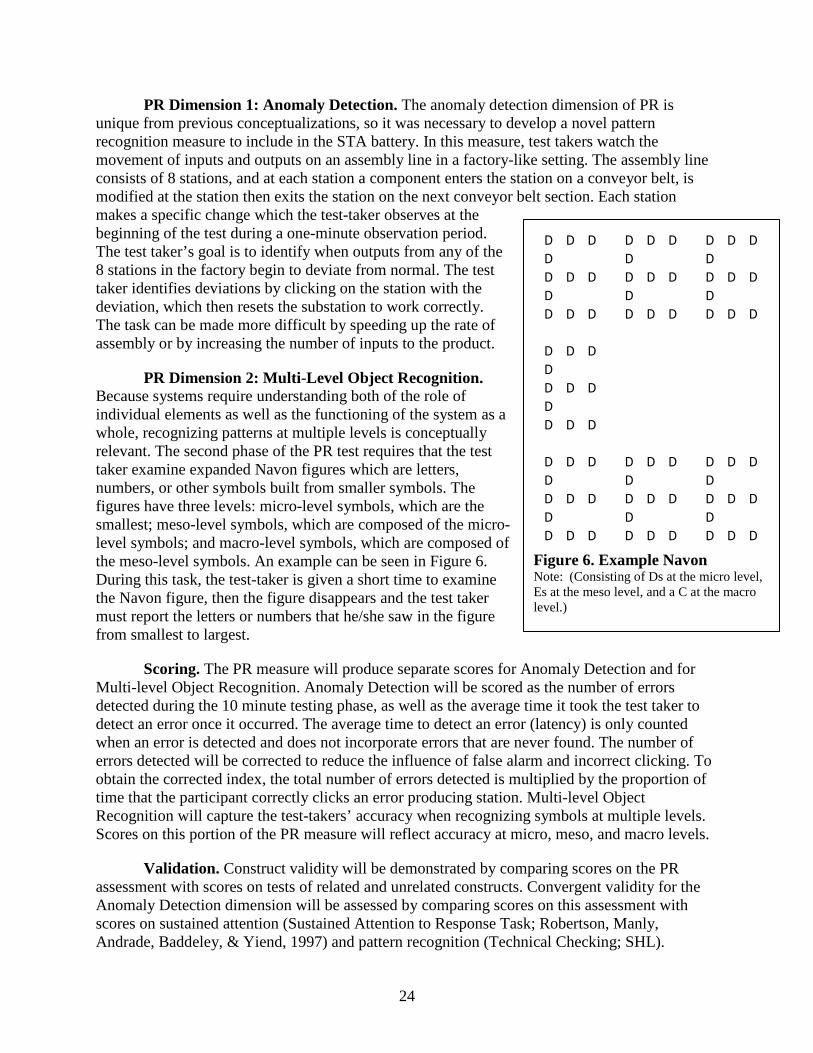
PR Dimension 1: Anomaly Detection. The anomaly detection dimension of PR is unique from previous conceptualizations, so it was necessary to develop a novel pattern recognition measure to include in the STA battery. In this measure, test takers watch the movement of inputs and outputs on an assembly line in a factory-like setting. The assembly line consists of 8 stations, and at each station a component enters the station on a conveyor belt, is modified at the station then exits the station on the next conveyor belt section. Each station makes a specific change which the test-taker observes at the beginning of the test during a one-minute observation period. The test taker’s goal is to identify when outputs from any of the 8 stations in the factory begin to deviate from normal. The test taker identifies deviations by clicking on the station with the deviation, which then resets the substation to work correctly. The task can be made more difficult by speeding up the rate of assembly or by increasing the number of inputs to the product.
PR Dimension 2: Multi-Level Object Recognition. Because systems require understanding both of the role of individual elements as well as the functioning of the system as a whole, recognizing patterns at multiple levels is conceptually relevant. The second phase of the PR test requires that the test taker examine expanded Navon figures which are letters, numbers, or other symbols built from smaller symbols. The figures have three levels: micro-level symbols, which are the smallest; meso-level symbols, which are composed of the micro-level symbols; and macro-level symbols, which are composed of the meso-level symbols. An example can be seen in Figure 6. During this task, the test-taker is given a short time to examine the Navon figure, then the figure disappears and the test taker must report the letters or numbers that he/she saw in the figure from smallest to largest.
Scoring. The PR measure will produce separate scores for Anomaly Detection and for Multi-level Object Recognition. Anomaly Detection will be scored as the number of errors detected during the 10 minute testing phase, as well as the average time it took the test taker to detect an error once it occurred. The average time to detect an error (latency) is only counted when an error is detected and does not incorporate errors that are never found. The number of errors detected will be corrected to reduce the influence of false alarm and incorrect clicking. To obtain the corrected index, the total number of errors detected is multiplied by the proportion of time that the participant correctly clicks an error producing station. Multi-level Object Recognition will capture the test-takers’ accuracy when recognizing symbols at multiple levels. Scores on this portion of the PR measure will reflect accuracy at micro, meso, and macro levels.
Validation. Construct validity will be demonstrated by comparing scores on the PR assessment with scores on tests of related and unrelated constructs. Convergent validity for the Anomaly Detection dimension will be assessed by comparing scores on this assessment with scores on sustained attention (Sustained Attention to Response Task; Robertson, Manly, Andrade, Baddeley, & Yiend, 1997) and pattern recognition (Technical Checking; SHL).
D D D D D D D D D D D D D D D D D D D D D D D D D D D D D D D D D D D D D D D D D D D D D D D D D D D D D D D D D D D D D D D D D D D D D D D D D D D D D
Figure 6. Example Navon Note: (Consisting of Ds at the micro level, Es at the meso level, and a C at the macro level.)

25
Discriminant validity will be demonstrated for each dimension using the other PR dimension. For the Multi-level Object Recognition dimension, discriminant validity will also be demonstrated using processing speed (Rapid Visual Information Processing task; Wesnes, Warburton, & Matz, 1983). A description of construct correlations that have been obtained using other measures can be seen in Appendix A, Table A-4.
Cognitive Complexity Cognitive Complexity (CC) has been defined in multiple ways, with some concepts
focusing on how individuals structure their social worlds (e.g. Carraher & Buckley, 1996) and construe social behavior (e.g. Bieri, 1966), and others focusing on the extent to which an individual is able to separate an event into distinct elements and make connections between those elements (e.g. Streufert & Streufert, 1978; Streufert & Sweezey, 1986; Vannoy, 1965; Scott, 1962; Bieri, 1966). A description of various definitions and assessments that have been developed to measure CC can be seen in Table 7.
Table 7. Description of Cognitive Complexity Tests
Measure Description References
Object Sort task
Participants first list and group their own sets of countries; then they are confronted with a standard list and asked to group that. Following two more interpolated tasks (assessing knowledge of premiers and attitudes toward the countries), their first (free) list is again presented along with the first group made from it and participants are asked if they want to add any other nations to the original list.
Bieri, 1955; O'Keefe & Sypher, 1981
Cognitive Complexity Scale
The Cognitive Complexity Scale consists of a matrix across the top of which participants list a certain number of persons in their own social environment. The participant is asked successively to consider three of these persons at a time and to decide in what important personal way two of them are alike and different from the third. In this manner, a series of constructs or modes of perceiving others is formed which is assumed to be relatively characteristic of him as an individual. Each time a construct is formed, check marks are placed in the grid under the names of the persons perceived as similar in some way and the name of the construct is entered next to the grid. After all these sorts have been completed, and a certain number of constructs established, the individual is asked to go through each construct row again and check all the other persons in that row, in addition to the two already checked, whom he considers that particular construct applies to most.
O'Keefe & Sypher, 1981; Menasco & Curry, 1978
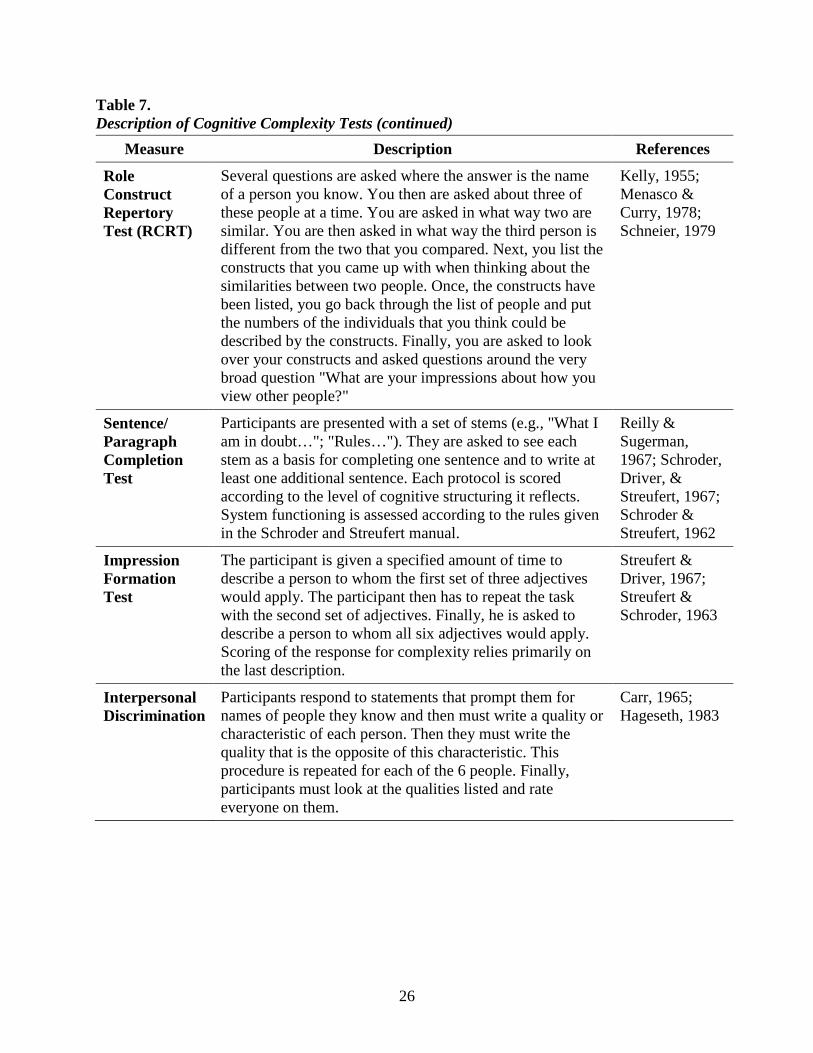
26
Table 7. Description of Cognitive Complexity Tests (continued)
Measure Description References
Role Construct Repertory Test (RCRT)
Several questions are asked where the answer is the name of a person you know. You then are asked about three of these people at a time. You are asked in what way two are similar. You are then asked in what way the third person is different from the two that you compared. Next, you list the constructs that you came up with when thinking about the similarities between two people. Once, the constructs have been listed, you go back through the list of people and put the numbers of the individuals that you think could be described by the constructs. Finally, you are asked to look over your constructs and asked questions around the very broad question "What are your impressions about how you view other people?"
Kelly, 1955; Menasco & Curry, 1978; Schneier, 1979
Sentence/ Paragraph Completion Test
Participants are presented with a set of stems (e.g., "What I am in doubt…"; "Rules…"). They are asked to see each stem as a basis for completing one sentence and to write at least one additional sentence. Each protocol is scored according to the level of cognitive structuring it reflects. System functioning is assessed according to the rules given in the Schroder and Streufert manual.
Reilly & Sugerman, 1967; Schroder, Driver, & Streufert, 1967; Schroder & Streufert, 1962
Impression Formation Test
The participant is given a specified amount of time to describe a person to whom the first set of three adjectives would apply. The participant then has to repeat the task with the second set of adjectives. Finally, he is asked to describe a person to whom all six adjectives would apply. Scoring of the response for complexity relies primarily on the last description.
Streufert & Driver, 1967; Streufert & Schroder, 1963
Interpersonal Discrimination
Participants respond to statements that prompt them for names of people they know and then must write a quality or characteristic of each person. Then they must write the quality that is the opposite of this characteristic. This procedure is repeated for each of the 6 people. Finally, participants must look at the qualities listed and rate everyone on them.
Carr, 1965; Hageseth, 1983
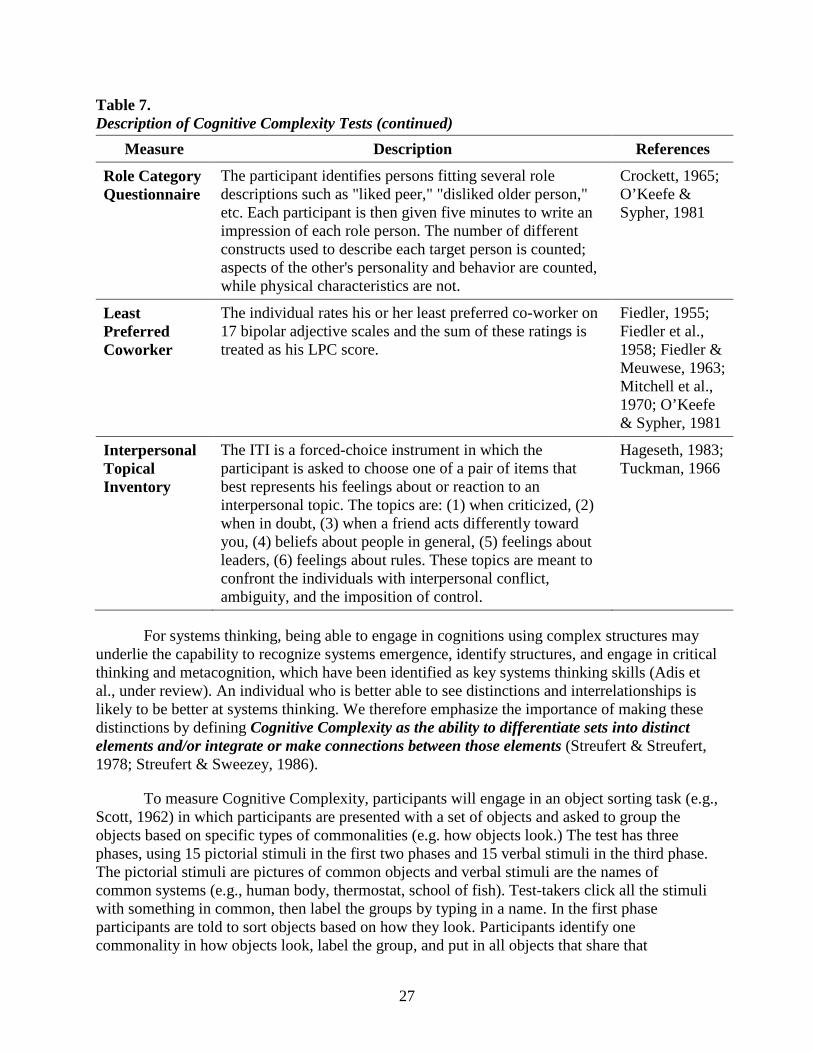
27
Table 7. Description of Cognitive Complexity Tests (continued)
Measure Description References
Role Category Questionnaire
The participant identifies persons fitting several role descriptions such as "liked peer," "disliked older person," etc. Each participant is then given five minutes to write an impression of each role person. The number of different constructs used to describe each target person is counted; aspects of the other's personality and behavior are counted, while physical characteristics are not.
Crockett, 1965; O’Keefe & Sypher, 1981
Least Preferred Coworker
The individual rates his or her least preferred co-worker on 17 bipolar adjective scales and the sum of these ratings is treated as his LPC score.
Fiedler, 1955; Fiedler et al., 1958; Fiedler & Meuwese, 1963; Mitchell et al., 1970; O’Keefe & Sypher, 1981
Interpersonal Topical Inventory
The ITI is a forced-choice instrument in which the participant is asked to choose one of a pair of items that best represents his feelings about or reaction to an interpersonal topic. The topics are: (1) when criticized, (2) when in doubt, (3) when a friend acts differently toward you, (4) beliefs about people in general, (5) feelings about leaders, (6) feelings about rules. These topics are meant to confront the individuals with interpersonal conflict, ambiguity, and the imposition of control.
Hageseth, 1983; Tuckman, 1966
For systems thinking, being able to engage in cognitions using complex structures may underlie the capability to recognize systems emergence, identify structures, and engage in critical thinking and metacognition, which have been identified as key systems thinking skills (Adis et al., under review). An individual who is better able to see distinctions and interrelationships is likely to be better at systems thinking. We therefore emphasize the importance of making these distinctions by defining Cognitive Complexity as the ability to differentiate sets into distinct elements and/or integrate or make connections between those elements (Streufert & Streufert, 1978; Streufert & Sweezey, 1986).
To measure Cognitive Complexity, participants will engage in an object sorting task (e.g., Scott, 1962) in which participants are presented with a set of objects and asked to group the objects based on specific types of commonalities (e.g. how objects look.) The test has three phases, using 15 pictorial stimuli in the first two phases and 15 verbal stimuli in the third phase. The pictorial stimuli are pictures of common objects and verbal stimuli are the names of common systems (e.g., human body, thermostat, school of fish). Test-takers click all the stimuli with something in common, then label the groups by typing in a name. In the first phase participants are told to sort objects based on how they look. Participants identify one commonality in how objects look, label the group, and put in all objects that share that
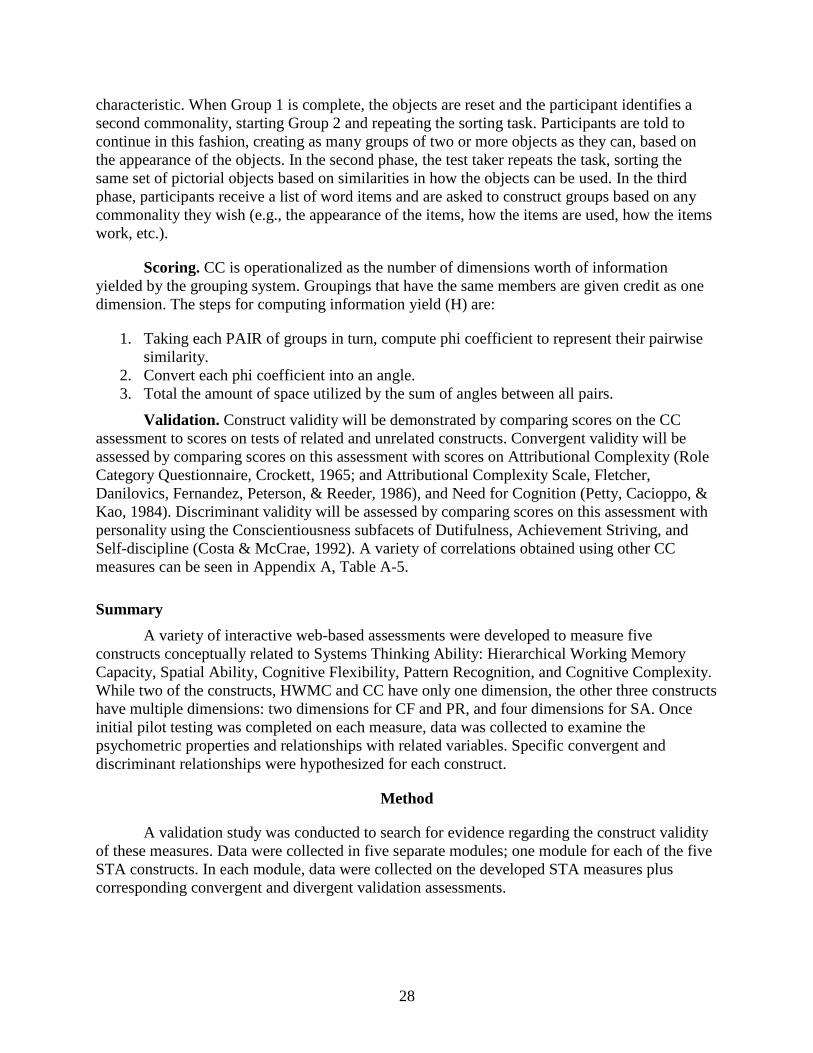
28
characteristic. When Group 1 is complete, the objects are reset and the participant identifies a second commonality, starting Group 2 and repeating the sorting task. Participants are told to continue in this fashion, creating as many groups of two or more objects as they can, based on the appearance of the objects. In the second phase, the test taker repeats the task, sorting the same set of pictorial objects based on similarities in how the objects can be used. In the third phase, participants receive a list of word items and are asked to construct groups based on any commonality they wish (e.g., the appearance of the items, how the items are used, how the items work, etc.).
Scoring. CC is operationalized as the number of dimensions worth of information yielded by the grouping system. Groupings that have the same members are given credit as one dimension. The steps for computing information yield (H) are:
1. Taking each PAIR of groups in turn, compute phi coefficient to represent their pairwise similarity.
2. Convert each phi coefficient into an angle. 3. Total the amount of space utilized by the sum of angles between all pairs.
Validation. Construct validity will be demonstrated by comparing scores on the CC assessment to scores on tests of related and unrelated constructs. Convergent validity will be assessed by comparing scores on this assessment with scores on Attributional Complexity (Role Category Questionnaire, Crockett, 1965; and Attributional Complexity Scale, Fletcher, Danilovics, Fernandez, Peterson, & Reeder, 1986), and Need for Cognition (Petty, Cacioppo, & Kao, 1984). Discriminant validity will be assessed by comparing scores on this assessment with personality using the Conscientiousness subfacets of Dutifulness, Achievement Striving, and Self-discipline (Costa & McCrae, 1992). A variety of correlations obtained using other CC measures can be seen in Appendix A, Table A-5.
Summary A variety of interactive web-based assessments were developed to measure five
constructs conceptually related to Systems Thinking Ability: Hierarchical Working Memory Capacity, Spatial Ability, Cognitive Flexibility, Pattern Recognition, and Cognitive Complexity. While two of the constructs, HWMC and CC have only one dimension, the other three constructs have multiple dimensions: two dimensions for CF and PR, and four dimensions for SA. Once initial pilot testing was completed on each measure, data was collected to examine the psychometric properties and relationships with related variables. Specific convergent and discriminant relationships were hypothesized for each construct.
Method
A validation study was conducted to search for evidence regarding the construct validity of these measures. Data were collected in five separate modules; one module for each of the five STA constructs. In each module, data were collected on the developed STA measures plus corresponding convergent and divergent validation assessments.
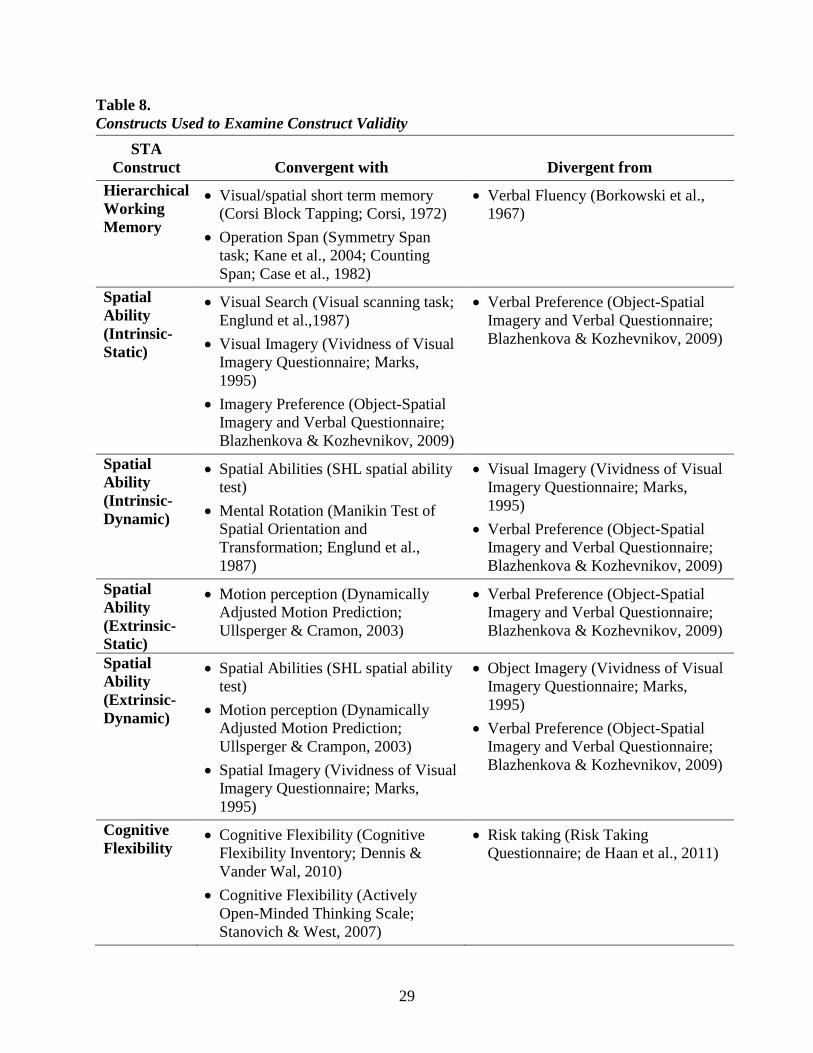
29
Table 8. Constructs Used to Examine Construct Validity
STA Construct Convergent with Divergent from
Hierarchical Working Memory
• Visual/spatial short term memory (Corsi Block Tapping; Corsi, 1972)
• Operation Span (Symmetry Span task; Kane et al., 2004; Counting Span; Case et al., 1982)
• Verbal Fluency (Borkowski et al., 1967)
Spatial Ability (Intrinsic-Static)
• Visual Search (Visual scanning task; Englund et al.,1987)
• Visual Imagery (Vividness of Visual Imagery Questionnaire; Marks, 1995)
• Imagery Preference (Object-Spatial Imagery and Verbal Questionnaire; Blazhenkova & Kozhevnikov, 2009)
• Verbal Preference (Object-Spatial Imagery and Verbal Questionnaire; Blazhenkova & Kozhevnikov, 2009)
Spatial Ability (Intrinsic-Dynamic)
• Spatial Abilities (SHL spatial ability test)
• Mental Rotation (Manikin Test of Spatial Orientation and Transformation; Englund et al., 1987)
• Visual Imagery (Vividness of Visual Imagery Questionnaire; Marks, 1995)
• Verbal Preference (Object-Spatial Imagery and Verbal Questionnaire; Blazhenkova & Kozhevnikov, 2009)
Spatial Ability (Extrinsic-Static)
• Motion perception (Dynamically Adjusted Motion Prediction; Ullsperger & Cramon, 2003)
• Verbal Preference (Object-Spatial Imagery and Verbal Questionnaire; Blazhenkova & Kozhevnikov, 2009)
Spatial Ability (Extrinsic-Dynamic)
• Spatial Abilities (SHL spatial ability test)
• Motion perception (Dynamically Adjusted Motion Prediction; Ullsperger & Crampon, 2003)
• Spatial Imagery (Vividness of Visual Imagery Questionnaire; Marks, 1995)
• Object Imagery (Vividness of Visual Imagery Questionnaire; Marks, 1995)
• Verbal Preference (Object-Spatial Imagery and Verbal Questionnaire; Blazhenkova & Kozhevnikov, 2009)
Cognitive Flexibility
• Cognitive Flexibility (Cognitive Flexibility Inventory; Dennis & Vander Wal, 2010)
• Cognitive Flexibility (Actively Open-Minded Thinking Scale; Stanovich & West, 2007)
• Risk taking (Risk Taking Questionnaire; de Haan et al., 2011)
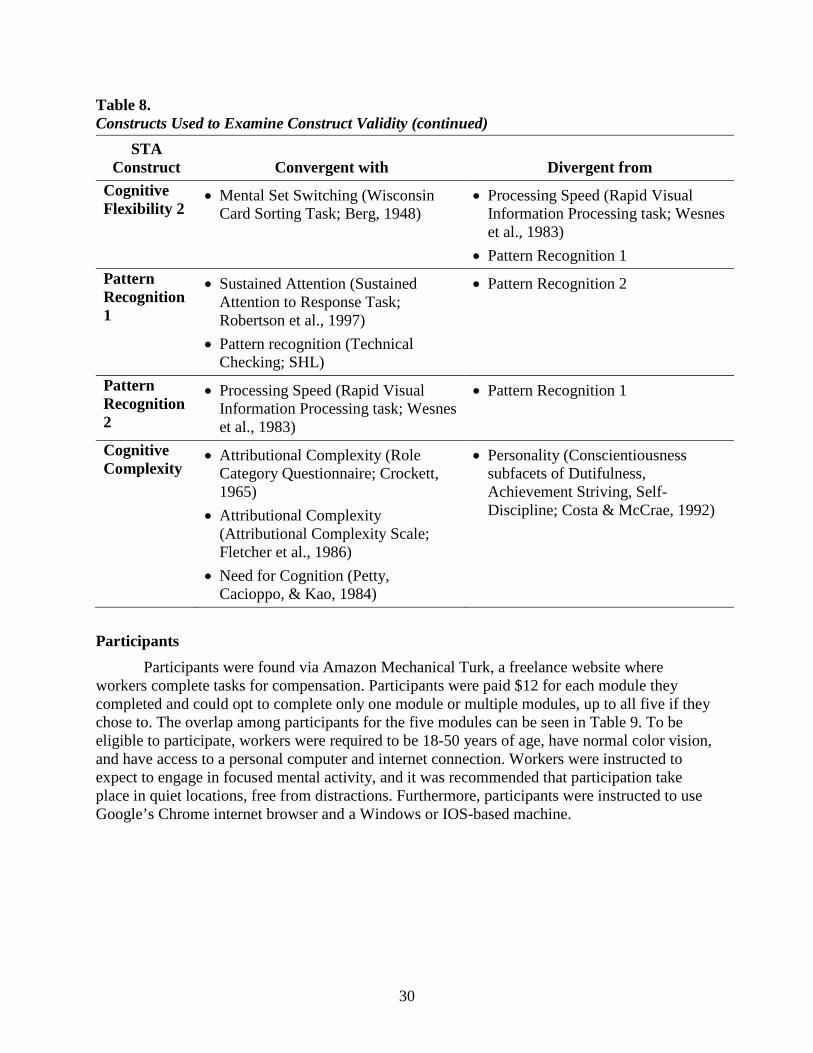
30
Table 8. Constructs Used to Examine Construct Validity (continued)
STA Construct Convergent with Divergent from
Cognitive Flexibility 2
• Mental Set Switching (Wisconsin Card Sorting Task; Berg, 1948)
• Processing Speed (Rapid Visual Information Processing task; Wesnes et al., 1983)
• Pattern Recognition 1 Pattern Recognition 1
• Sustained Attention (Sustained Attention to Response Task; Robertson et al., 1997)
• Pattern recognition (Technical Checking; SHL)
• Pattern Recognition 2
Pattern Recognition 2
• Processing Speed (Rapid Visual Information Processing task; Wesnes et al., 1983)
• Pattern Recognition 1
Cognitive Complexity
• Attributional Complexity (Role Category Questionnaire; Crockett, 1965)
• Attributional Complexity (Attributional Complexity Scale; Fletcher et al., 1986)
• Need for Cognition (Petty, Cacioppo, & Kao, 1984)
• Personality (Conscientiousness subfacets of Dutifulness, Achievement Striving, Self-Discipline; Costa & McCrae, 1992)
Participants Participants were found via Amazon Mechanical Turk, a freelance website where
workers complete tasks for compensation. Participants were paid $12 for each module they completed and could opt to complete only one module or multiple modules, up to all five if they chose to. The overlap among participants for the five modules can be seen in Table 9. To be eligible to participate, workers were required to be 18-50 years of age, have normal color vision, and have access to a personal computer and internet connection. Workers were instructed to expect to engage in focused mental activity, and it was recommended that participation take place in quiet locations, free from distractions. Furthermore, participants were instructed to use Google’s Chrome internet browser and a Windows or IOS-based machine.
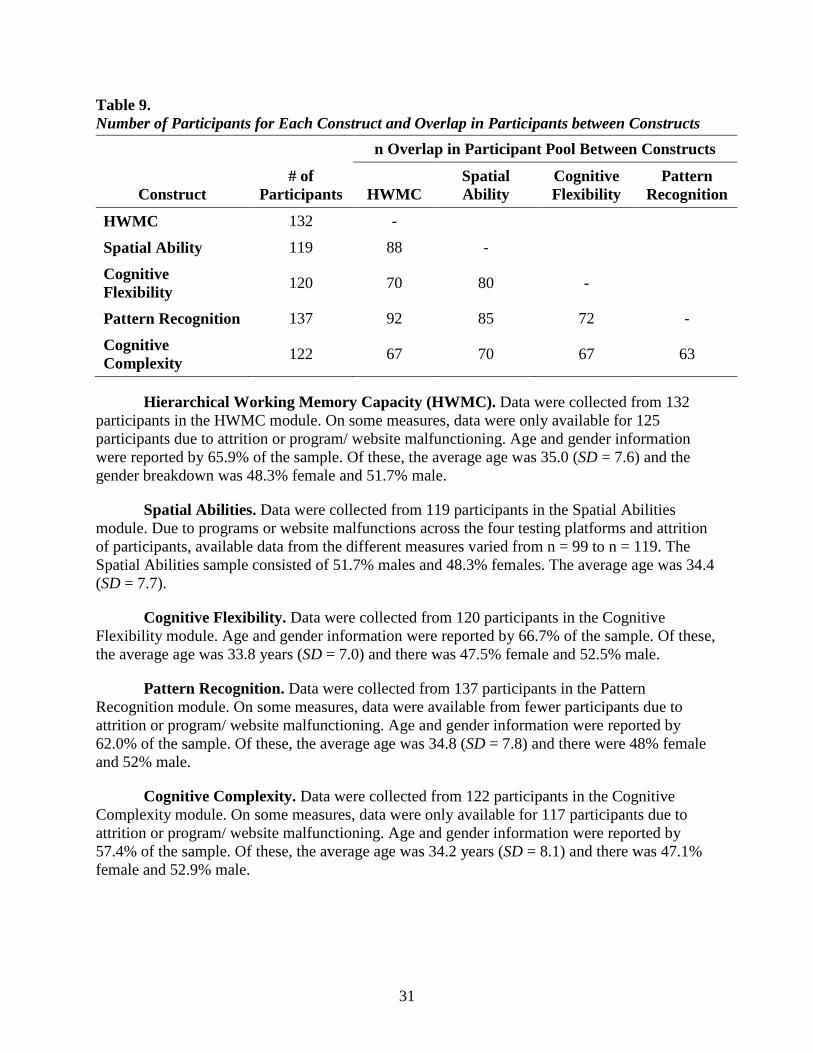
31
Table 9. Number of Participants for Each Construct and Overlap in Participants between Constructs
Construct # of
Participants
n Overlap in Participant Pool Between Constructs
HWMC Spatial Ability
Cognitive Flexibility
Pattern Recognition
HWMC 132 -
Spatial Ability 119 88 -
Cognitive Flexibility 120 70 80 -
Pattern Recognition 137 92 85 72 -
Cognitive Complexity 122 67 70 67 63
Hierarchical Working Memory Capacity (HWMC). Data were collected from 132 participants in the HWMC module. On some measures, data were only available for 125 participants due to attrition or program/ website malfunctioning. Age and gender information were reported by 65.9% of the sample. Of these, the average age was 35.0 (SD = 7.6) and the gender breakdown was 48.3% female and 51.7% male.
Spatial Abilities. Data were collected from 119 participants in the Spatial Abilities module. Due to programs or website malfunctions across the four testing platforms and attrition of participants, available data from the different measures varied from n = 99 to n = 119. The Spatial Abilities sample consisted of 51.7% males and 48.3% females. The average age was 34.4 (SD = 7.7).
Cognitive Flexibility. Data were collected from 120 participants in the Cognitive Flexibility module. Age and gender information were reported by 66.7% of the sample. Of these, the average age was 33.8 years (SD = 7.0) and there was 47.5% female and 52.5% male.
Pattern Recognition. Data were collected from 137 participants in the Pattern Recognition module. On some measures, data were available from fewer participants due to attrition or program/ website malfunctioning. Age and gender information were reported by 62.0% of the sample. Of these, the average age was 34.8 (SD = 7.8) and there were 48% female and 52% male.
Cognitive Complexity. Data were collected from 122 participants in the Cognitive Complexity module. On some measures, data were only available for 117 participants due to attrition or program/ website malfunctioning. Age and gender information were reported by 57.4% of the sample. Of these, the average age was 34.2 years (SD = 8.1) and there was 47.1% female and 52.9% male.
32
Measures Measures were administered electronically using one of four web-based platforms: PDRI
testing software, SHL testing software, the Inquisit program by Millisecond Software, and SurveyMonkey. For each module, the STA Assessments were delivered with PDRI’s testing software and the validation measures were delivered with a combination of the other three platforms.
Hierarchical Working Memory Capacity Module. Five measures were administered as part of the HWMC Module: STA HWMC, the Corsi Block Tapping task, two WMC tasks, and verbal fluency.
STA working memory measure. In the Hierarchical Working Memory Capacity assessment, participants were presented with a series of location-number pairs then are asked to recall those location-number pairs. The locations where the stimuli were presented appear at different levels of a hierarchy. For example, zooming between a nucleus, an atom, and a molecule would show three levels of a hierarchy, each of which could house locations to store numbers. Participants had to recall the number and locations at the end of the trial. This assessment was described in greater detail previously.
Visual/spatial short term memory. The Corsi Block Tapping task was used to measure short-term memory (Corsi, 1972). In this task, the participant sees squares on the screen light up one at a time during the presentation phase. Then, during the recall phase, the participant must click on the blocks in the exact order in which they lit up. Additionally, a version of the test was used where the participant must click the blocks in the reverse order in which they were presented. A score is given based on the number of correctly indicated squares in a row during the recall phase.
Working memory capacity. Working memory capacity was measured with the Counting Span task (Case et al., 1982) and the Symmetry Span task (Kane et al., 2004). These two measures are complex span tasks because they require the participant to make judgments or decisions in addition to remembering a span of digits or letters. In the Counting Span task, participants are shown an image of green and yellow dots and told to count the green dots. This repeats a variable number of times (increasing with performance) until the end of the trial where participants must recall the number of green dots for each image. Scores are determined based on how many green dot counts are correctly recalled. In the Symmetry Span task, participants are shown a simple picture of colors in boxes in a grid and asked to judge if the image is symmetrical around the vertical axis. After each judgment, the participant is given a number to remember and then shown another image to repeat the cycle. At the end of the task, the participant must recall the list of numbers.
Verbal Fluency. The Working Memory module also included a measure of Verbal Fluency (Borkowski et al., 1967) to demonstrate the discriminant validity of the STA Working Memory measure developed. In this task, participant are given a letter and asked to generate as many words that start with that letter as they can in two minutes.
Spatial Abilities Module. Seven measures were administered as part of the Spatial Abilities Module: STA Spatial Abilities, a visual scanning task, the Vividness of Visual Imagery
33
Questionnaire, the Object-Spatial Imagery and Verbal Questionnaire, the SHL Spatial Abilities Test, a mental rotation task, and the Dynamically Adjusted Motion Prediction Task.
STA Spatial Ability. Four separate Spatial Ability assessments were developed in Phase I. These four measures correspond to the four types of Spatial Abilities identified by Uttal et al., 2013. Uttal et al. described Spatial Abilities as composed of two dimensions: intrinsic versus extrinsic and static versus dynamic. These assessments were described previously.
Visual search. A visual scanning task (Englund et al., 1987) was administered to test participants’ ability to find visual stimulus targets among a field of distractors. Specifically, the task presents a column of random letters and asks the participant to respond as soon as they detect the letter “K” in the column. After detecting the letter, the participant enters the row in which the letter was found. This process of detecting the “K” and indicating the row are timed; if the participant does not respond within a set amount of time, the next trial is presented.
Visual imagery. We measured participants’ reports of the potency of their visual imagery using the Vividness of Visual Imagery Questionnaire (Marks, 1973, 1995). This questionnaire consisted of 32 items measured on a 5-point Likert scale. Example items include: “Think of the items mentioned in the following questions and rate the vividness of your imagination," “The sun is rising above the horizon into a hazy sky,” and “The sky clears and surrounds the sun with blueness.” Previous research has found internal consistency (Cronbach’s alpha) for this scale of about .92 (Allbutt, Ling, Heffernan, & Shafiullah, 2008; Campos & Perez-Fabello, 2009; Morrison & Wallace (2001).
Imagery/verbal preference. Participants’ preferences for thinking verbally or through imagery were measured with the Object-Spatial Imagery and Verbal Questionnaire (Blazhenkova & Kozhevnikov, 2009). This questionnaire consists of 33 items divided into three orthogonal dimensions: 10 for the verbal dimension, 12 for the object visual dimension, and 11 for the spatial visual dimension. Participants were asked to report the extent to which they agreed with statements on a 1-5 Likert scale. Example items include: “When reading fiction, I usually form a clear and detailed mental picture of a scene or room that has been described,” “I have difficulty expressing myself in writing” (reversed), and “I can easily sketch a blueprint for a building I am familiar with.” Blazhenkova and Kozhevnikov (2009) found an internal consistency of α = .85 for the Object dimension, α = .79 for the Spatial Dimension, and α = .74 for the Verbal dimension. Test-retest reliability was reported as r = .75 for Object, r = .84 for Spatial, and r = .73 for Verbal.
SHL Spatial Abilities. A test of Spatial Abilities developed by testing company SHL was used to get a general spatial ability test score. This test includes 22 multiple-choice questions of three types: 1) determine which of the answer options contains the rotated version of the original image, 2) determine which of the answer options displays the folded/unfolded version of the original image, or 3) count the number of objects within the image. Questions are delivered in a computer adaptive manner. Correct responses are chosen from among four response options. Reliability is estimated to be .949 (CEB, 2014-2015).
Mental rotation. A test of mental rotation abilities was administered using an Inquisit test designed after the Manikin Test of Spatial Orientation and Transformation (Englund et al.,
34
1987). This test shows respondents an image of a person holding a green circle and a square. This image appears within a surrounding border that is either a green circle or a red square. The task is to indicate as quickly as possible which hand is holding the shape that matches the surrounding shape. The person in the image can be facing forward or backward, and be upside-down or upright.
Motion perception. Participants’ motion perception abilities are measured with the Dynamically Adjusted Motion Prediction task (Ullsperger & Cramon, 2003). This measure shows participants two objects moving toward a goal location at different speeds. Before these objects reach the goal, they disappear from view. The participants’ task is to estimate which object will reach the goal first.
Cognitive Flexibility Module. Five measures were administered as part of the Cognitive Flexibility Module: STA Cognitive Flexibility, the Cognitive Flexibility Inventory, the Actively Open-Minded Thinking Scale, Risk Taking Questionnaire, and Wisconsin Card Sort.
STA Cognitive Flexibility. Two assessments were developed to capture Cognitive Flexibility. The first measures a flexible personality or style as it pertains to thinking of alternative solutions to problems. For this measure, a set of 20 scenarios was developed and administered in sets of eight. The second assessment measures flexibility in executive functioning, in the sense of efficiency of task switching. This was measured using the multi-level figure detection task developed for Pattern Recognition. The assessment was configured to deliver multi-level figures at 250 milliseconds and record responses to only one level of the figure in blocks of 10. For example, respondents were asked to respond to the meso-level only for 10 trials, then to the micro-level for 10 more trials. Cognitive Flexibility was assessed by examining reaction times in response to shifting the level of the stimuli that are presented. These measures were described previously.
Cognitive Flexibility Inventory. In addition to the STA Cognitive Flexibility measure, a self-report Cognitive Flexibility Inventory (Dennis & Vander Wal, 2010) was administered. This questionnaire consisted of 20 items measured on a 1-7 Likert scale. Example items include: “I like to look at difficult situations from many different angles;” “I seek additional information not immediately available before attributing causes to behavior;” and “When encountering difficult situations, I become so stressed that I cannot think of a way to resolve the situation (reversed).” Dennis and Vander Wal report high internal consistency (coefficient alpha = .91) and high test-retest reliability (alpha at Time 1 = .90; Time 2 = .91).
Actively Open-Minded Thinking Scale. A scale developed by Stanovich and West (2007; the Actively Open-Minded Thinking Scale) was also administered as a Cognitive Flexibility measure. Stanovich and West (1998) describe actively open-minded thinking as a tendency toward analyzing options and alternative perspectives, questioning assumptions, and welcoming differences of opinion and belief. This scale consists of 41 items and responses were measured on a 1-6 Likert scale. Example items include: “I tend to classify people as either for me or against me (reversed);” “A person should always consider new possibilities;” and “Changing your mind is a sign of weakness (reversed)”. Stanovich and colleagues report internal consistency reliability of about .83 (Stanovich & West, 2007; West, Toplak, & Stanovich, 2008).
35
Risk Taking Questionnaire. Risk taking behavior was administered because it was expected to show divergence from Cognitive Flexibility. We used the Risk Taking Questionnaire (de Haan et al., 2011), which contains 18 items and measures responses on a yes/no scale. Example items include: “I often try new things just for fun or thrills, even if most people think it is a waste of time;” and “I like to think about things for a long time before I make a decision (reversed)”. Reliability information reported by de Haan and colleagues included internal consistency (alpha) of .87 and test-retest reliability after 2-4 weeks of .94.
Wisconsin Card Sort. In order to assess Cognitive Flexibility in the sense of efficiency of task switching, an electronic version of the Wisconsin Card Sorting task (Berg, 1948; Grant & Berg, 1948) was administered. In this mental set-switching test, test takers must determine the appropriate way to sort a deck of cards, based on one of three dimensions shown on the card (color, shape, number). The test starts with one rule for sorting the cards (e.g., based on their color), but the rule changes to one of the other dimensions after an undetermined number of trials. Test takers receive only the feedback that they were “correct” or “incorrect.” As quickly as possible after a rule change, the test taker must use the correct/incorrect feedback to learn what new rule is governing.
Pattern Recognition Module. Four measures were administered as part of the Pattern Recognition Module: STA Pattern Recognition, the Sustained Attention to Response Task, an SHL pattern recognition task, and the Rapid Visual Information Processing task.
STA Pattern Recognition. Two assessments of Pattern Recognition were developed. In the first, participants watch a factory-like setting, tracking inputs and outputs on a conveyer belt, with the goal of identifying when behavior begins to deviate or when abnormal activity occurs. In the second assessment, participants are given a short time (i.e., 900 msec) to examine a multi-level Navon figure and then when the figure disappears participants are asked to report the letters or numbers that they saw in the figure from smallest to largest. These assessments were described in greater detail previously.
Sustained Attention. Participants’ ability to sustain their attention on a task was measured with the Sustained Attention to Response Task (Robertson et al., 1997). This task is a continuous performance vigilance test in which participants monitor the screen and hit the spacebar when they see a symbol (any digit except “3”) in a target location. If the symbol is a “3”, the participant is NOT supposed to hit the spacebar.
Pattern recognition. A pattern recognition test called Technical Checking (SHL) was used to assess convergent validity of the STA Pattern Recognition assessment. Technical Checking is a computer-adaptive multiple-choice test that requires test takers to read a rule card and apply rules quickly and accurately in order to select the correct choice. The rule card has rules such as, “if symbol 1 is a circle, set switch 1 to 90 degrees. If symbol 2 is a square, set switch 2 to 180 degrees.” Participants are then shown a set of symbols and asked to select the choice that shows the switches in the correct positions. Participants answer as many of these multiple-choice questions as they can in five minutes. Reported test-retest reliability is r =.76 (CEB, 2014-2015).
36
Processing Speed. Processing speed was measured with the Rapid Visual Information Processing task (Wesnes et al., 1983). In this task, participants watch the screen as single digit numbers are flashed on the center. The task is to respond by hitting the spacebar if three consecutive odd numbers or three consecutive even numbers are shown. Numbers are flashed on the screen at a rate of 100 numbers per minute.
Cognitive Complexity Module. Five measures were administered as part of the Cognitive Complexity Module: STA Cognitive Complexity, two attributional complexity measures, Need for Cognition, and Conscientiousness.
STA Cognitive Complexity. An object sorting task in the style of Scott (1962) was used to measure Cognitive Complexity. Sorting was conducted three different ways: 1) a set of objects sorted based on how they look (10 minutes), 2) the same set of objects sorted based on how they function (15 minutes), and 3) a set of systems-related words or phrases sorted by appearance, function, or other conceivable ways (15 minutes). This measure is described in more detail previously.
Attributional complexity measures. Two measures were used to assess attributional complexity. The first, the Role Category Questionnaire (Crockett, 1965), asks respondents to identify one person whom the respondent likes and one person whom the respondent dislikes. The respondent then describes these individuals. The instructions stated to describe the individuals as fully as possible by writing down defining characteristics, in particular, habits, beliefs, mannerisms, and ways of treating others. Two raters with graduate degrees in I/O Psychology counted the number of constructs listed by participants when describing a person they liked and a person they disliked for the 119 usable responses to this measure. Initial rater agreement on the counts for Like and Dislike was 92%. The raters then engaged in consensus discussions to achieve agreement on the remaining items.
In addition to the Role Category Questionnaire, attributional complexity was also measured with the Attributional Complexity Scale (Fletcher et al., 1986). The scale measures the complexity with which a person tends to think about human behavior. The scale consists of 28 items, which are measured on a -3 to +3 Likert scale. Example items include: “I believe it is important to analyze and understand our own thinking processes;” “I think a lot about the influence that I have on other people's behavior;” and “I have found that the relationships between a person's attitudes, beliefs, and character traits are usually simple and straightforward (reversed)." Fletcher and colleagues reported internal consistency reliability using coefficient alpha of .85 and test-retest reliability over a period of 18 days of .80.
Need for Cognition. Need for cognition (Petty, Cacioppo, & Kao, 1984) was also measured as a construct similar to, but distinct from Cognitive Complexity. This scale consists of 18 items measured on a 7-point Likert scale. Example items include: “I would prefer complex to simple problems;” and “Thinking is not my idea of fun (reversed).” Petty et al. reported internal consistency (coefficient alpha) of .90.
Conscientiousness. Personality measures such as conscientiousness were expected to show discriminant validity with Cognitive Complexity. The conscientiousness subfacets of dutifulness, achievement striving, self-discipline were assessed (Costa & McCrae, 2008). Each
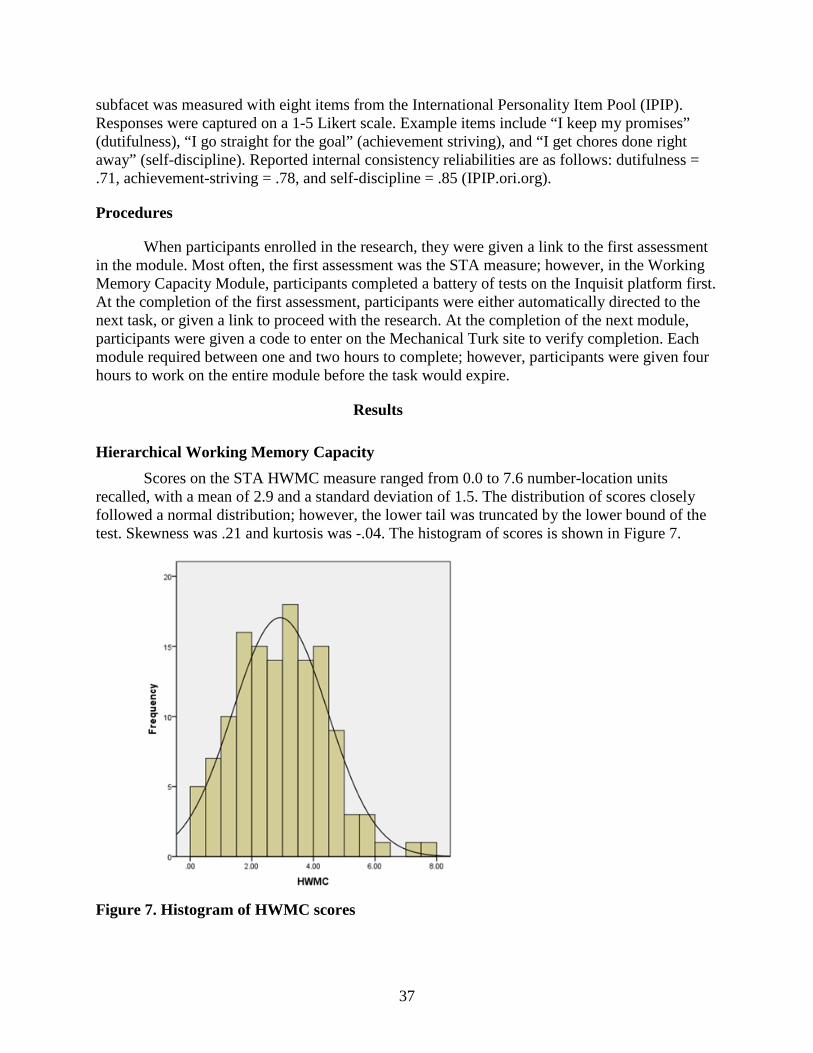
37
subfacet was measured with eight items from the International Personality Item Pool (IPIP). Responses were captured on a 1-5 Likert scale. Example items include “I keep my promises” (dutifulness), “I go straight for the goal” (achievement striving), and “I get chores done right away” (self-discipline). Reported internal consistency reliabilities are as follows: dutifulness = .71, achievement-striving = .78, and self-discipline = .85 (IPIP.ori.org).
Procedures
When participants enrolled in the research, they were given a link to the first assessment in the module. Most often, the first assessment was the STA measure; however, in the Working Memory Capacity Module, participants completed a battery of tests on the Inquisit platform first. At the completion of the first assessment, participants were either automatically directed to the next task, or given a link to proceed with the research. At the completion of the next module, participants were given a code to enter on the Mechanical Turk site to verify completion. Each module required between one and two hours to complete; however, participants were given four hours to work on the entire module before the task would expire.
Results
Hierarchical Working Memory Capacity Scores on the STA HWMC measure ranged from 0.0 to 7.6 number-location units
recalled, with a mean of 2.9 and a standard deviation of 1.5. The distribution of scores closely followed a normal distribution; however, the lower tail was truncated by the lower bound of the test. Skewness was .21 and kurtosis was -.04. The histogram of scores is shown in Figure 7.
Figure 7. Histogram of HWMC scores
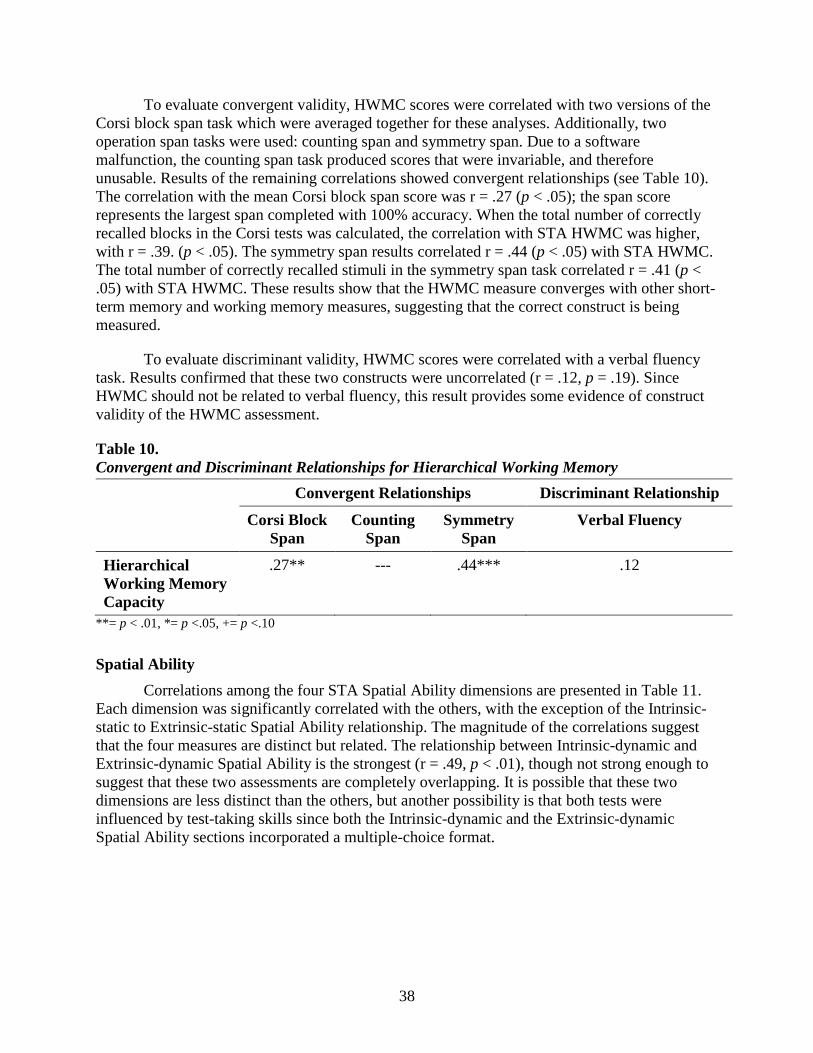
38
To evaluate convergent validity, HWMC scores were correlated with two versions of the Corsi block span task which were averaged together for these analyses. Additionally, two operation span tasks were used: counting span and symmetry span. Due to a software malfunction, the counting span task produced scores that were invariable, and therefore unusable. Results of the remaining correlations showed convergent relationships (see Table 10). The correlation with the mean Corsi block span score was r = .27 (p < .05); the span score represents the largest span completed with 100% accuracy. When the total number of correctly recalled blocks in the Corsi tests was calculated, the correlation with STA HWMC was higher, with r = .39. (p < .05). The symmetry span results correlated r = .44 (p < .05) with STA HWMC. The total number of correctly recalled stimuli in the symmetry span task correlated r = .41 (p < .05) with STA HWMC. These results show that the HWMC measure converges with other short-term memory and working memory measures, suggesting that the correct construct is being measured.
To evaluate discriminant validity, HWMC scores were correlated with a verbal fluency task. Results confirmed that these two constructs were uncorrelated (r = .12, p = .19). Since HWMC should not be related to verbal fluency, this result provides some evidence of construct validity of the HWMC assessment.
Table 10. Convergent and Discriminant Relationships for Hierarchical Working Memory
Convergent Relationships Discriminant Relationship
Corsi Block Span
Counting Span
Symmetry Span
Verbal Fluency
Hierarchical Working Memory Capacity
.27** --- .44*** .12
**= p < .01, *= p <.05, += p <.10
Spatial Ability Correlations among the four STA Spatial Ability dimensions are presented in Table 11.
Each dimension was significantly correlated with the others, with the exception of the Intrinsic-static to Extrinsic-static Spatial Ability relationship. The magnitude of the correlations suggest that the four measures are distinct but related. The relationship between Intrinsic-dynamic and Extrinsic-dynamic Spatial Ability is the strongest (r = .49, p < .01), though not strong enough to suggest that these two assessments are completely overlapping. It is possible that these two dimensions are less distinct than the others, but another possibility is that both tests were influenced by test-taking skills since both the Intrinsic-dynamic and the Extrinsic-dynamic Spatial Ability sections incorporated a multiple-choice format.
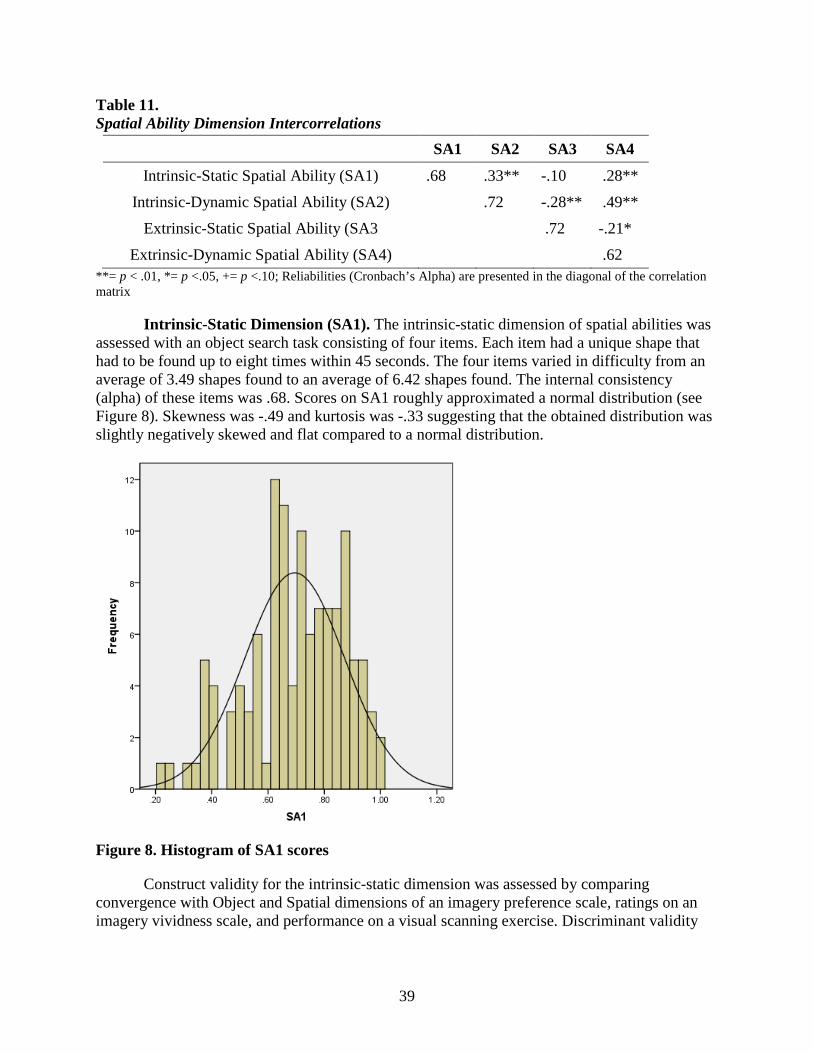
39
Table 11. Spatial Ability Dimension Intercorrelations
SA1 SA2 SA3 SA4
Intrinsic-Static Spatial Ability (SA1) .68 .33** -.10 .28**
Intrinsic-Dynamic Spatial Ability (SA2)
.72 -.28** .49**
Extrinsic-Static Spatial Ability (SA3
.72 -.21*
Extrinsic-Dynamic Spatial Ability (SA4)
.62 **= p < .01, *= p <.05, += p <.10; Reliabilities (Cronbach’s Alpha) are presented in the diagonal of the correlation matrix
Intrinsic-Static Dimension (SA1). The intrinsic-static dimension of spatial abilities was assessed with an object search task consisting of four items. Each item had a unique shape that had to be found up to eight times within 45 seconds. The four items varied in difficulty from an average of 3.49 shapes found to an average of 6.42 shapes found. The internal consistency (alpha) of these items was .68. Scores on SA1 roughly approximated a normal distribution (see Figure 8). Skewness was -.49 and kurtosis was -.33 suggesting that the obtained distribution was slightly negatively skewed and flat compared to a normal distribution.
Figure 8. Histogram of SA1 scores
Construct validity for the intrinsic-static dimension was assessed by comparing convergence with Object and Spatial dimensions of an imagery preference scale, ratings on an imagery vividness scale, and performance on a visual scanning exercise. Discriminant validity
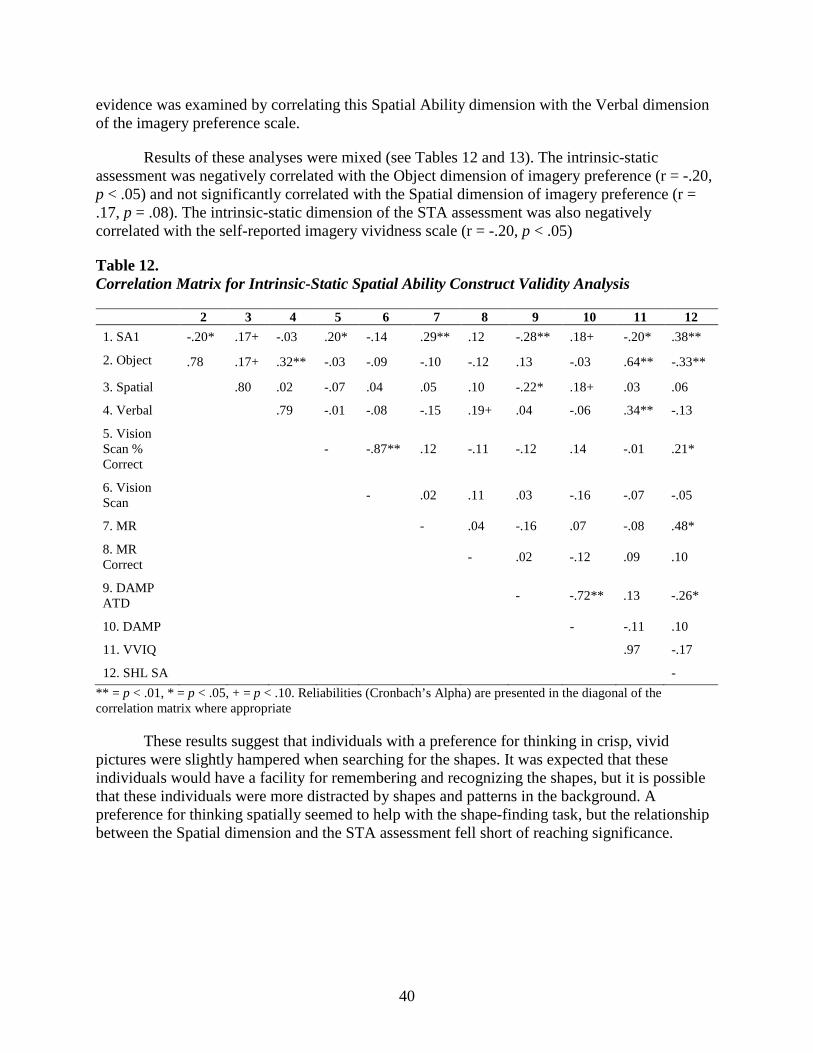
40
evidence was examined by correlating this Spatial Ability dimension with the Verbal dimension of the imagery preference scale.
Results of these analyses were mixed (see Tables 12 and 13). The intrinsic-static assessment was negatively correlated with the Object dimension of imagery preference (r = -.20, p < .05) and not significantly correlated with the Spatial dimension of imagery preference (r = .17, p = .08). The intrinsic-static dimension of the STA assessment was also negatively correlated with the self-reported imagery vividness scale (r = -.20, p < .05)
Table 12. Correlation Matrix for Intrinsic-Static Spatial Ability Construct Validity Analysis
2 3 4 5 6 7 8 9 10 11 12 1. SA1 -.20* .17+ -.03 .20* -.14 .29** .12 -.28** .18+ -.20* .38**
2. Object .78 .17+ .32** -.03 -.09 -.10 -.12 .13 -.03 .64** -.33**
3. Spatial .80 .02 -.07 .04 .05 .10 -.22* .18+ .03 .06
4. Verbal .79 -.01 -.08 -.15 .19+ .04 -.06 .34** -.13
5. Vision Scan % Correct
- -.87** .12 -.11 -.12 .14 -.01 .21*
6. Vision Scan - .02 .11 .03 -.16 -.07 -.05
7. MR - .04 -.16 .07 -.08 .48*
8. MR Correct - .02 -.12 .09 .10
9. DAMP ATD - -.72** .13 -.26*
10. DAMP - -.11 .10
11. VVIQ .97 -.17
12. SHL SA - ** = p < .01, * = p < .05, + = p < .10. Reliabilities (Cronbach’s Alpha) are presented in the diagonal of the correlation matrix where appropriate
These results suggest that individuals with a preference for thinking in crisp, vivid pictures were slightly hampered when searching for the shapes. It was expected that these individuals would have a facility for remembering and recognizing the shapes, but it is possible that these individuals were more distracted by shapes and patterns in the background. A preference for thinking spatially seemed to help with the shape-finding task, but the relationship between the Spatial dimension and the STA assessment fell short of reaching significance.
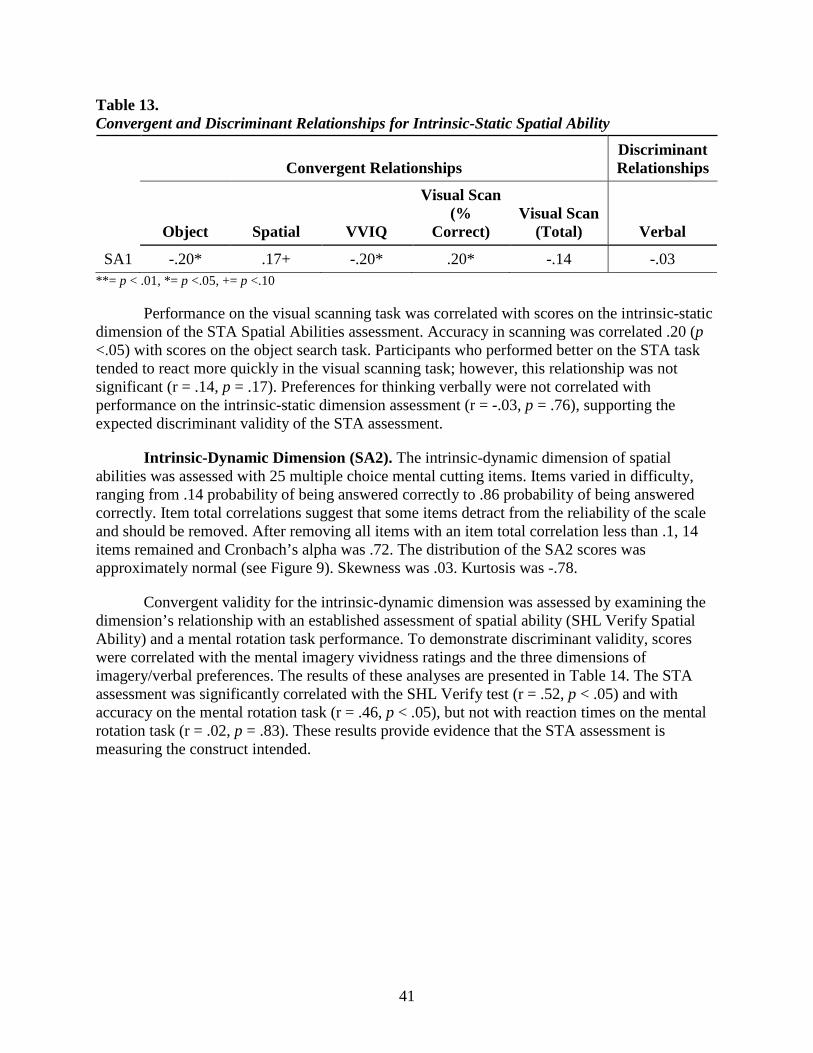
41
Table 13. Convergent and Discriminant Relationships for Intrinsic-Static Spatial Ability
Convergent Relationships
Discriminant Relationships
Object Spatial VVIQ
Visual Scan (%
Correct) Visual Scan
(Total) Verbal
SA1 -.20* .17+ -.20* .20* -.14 -.03 **= p < .01, *= p <.05, += p <.10
Performance on the visual scanning task was correlated with scores on the intrinsic-static dimension of the STA Spatial Abilities assessment. Accuracy in scanning was correlated .20 (p <.05) with scores on the object search task. Participants who performed better on the STA task tended to react more quickly in the visual scanning task; however, this relationship was not significant (r = .14, p = .17). Preferences for thinking verbally were not correlated with performance on the intrinsic-static dimension assessment (r = -.03, p = .76), supporting the expected discriminant validity of the STA assessment.
Intrinsic-Dynamic Dimension (SA2). The intrinsic-dynamic dimension of spatial abilities was assessed with 25 multiple choice mental cutting items. Items varied in difficulty, ranging from .14 probability of being answered correctly to .86 probability of being answered correctly. Item total correlations suggest that some items detract from the reliability of the scale and should be removed. After removing all items with an item total correlation less than .1, 14 items remained and Cronbach’s alpha was .72. The distribution of the SA2 scores was approximately normal (see Figure 9). Skewness was .03. Kurtosis was -.78.
Convergent validity for the intrinsic-dynamic dimension was assessed by examining the dimension’s relationship with an established assessment of spatial ability (SHL Verify Spatial Ability) and a mental rotation task performance. To demonstrate discriminant validity, scores were correlated with the mental imagery vividness ratings and the three dimensions of imagery/verbal preferences. The results of these analyses are presented in Table 14. The STA assessment was significantly correlated with the SHL Verify test (r = .52, p < .05) and with accuracy on the mental rotation task (r = .46, p < .05), but not with reaction times on the mental rotation task (r = .02, p = .83). These results provide evidence that the STA assessment is measuring the construct intended.

42
Figure 9. Histogram of SA2 scores
Discriminant validity evidence was found through the lack of correlation between this dimension of STA Spatial Abilities and Imagery preferences (Object r = -.14, p =.14; Spatial r = .09, p = .34) as well as imagery vividness (r = -.07, p = .51). There was a significant correlation between the intrinsic-dynamic dimension of the STA assessment and preference for Verbal thinking; however, this relationship was negative and small (r = -.20, p < .05). Taken together, these results support the divergence of this dimension from visual imagery constructs.
Table 14. Convergent and Discriminant Relationships for Intrinsic-Dynamic Spatial Ability
Convergent Relationships Discriminant Relationships
SHL Spatial Ability
MR # Correct
MR Reaction Time Object Spatial Verbal VVIQ
SA2 .52** .46** .02 -.14 .09 -.20* -.07 **= p < .01, *= p <.05, += p <.10
Extrinsic-Static Dimension (SA3). The extrinsic-static dimension of spatial abilities was assessed using 48 items. Participants judged the fullness of a jar tilted at different angles. True fullness amounts were known and scores were determined by taking the absolute value of the distance of a response from the true fullness. As such, higher scores reflect less accurate judgments. The average accuracy was 8.6 percentage points away from the true fullness (S.D. = 1.6), and the internal consistency reliability was .72. Item difficulty was partially determined by both the true fullness of the jar and the angle in which it was shown. Accuracy was highest on the jars that were least full and decreased monotonically with increasing fullness (r = -.62, p < .01). Accuracy was also highest when the jars were shown at slight angles and decreased monotonically with increasing angles of presentation (r = -.47, p < .01). Once combined, the SA3
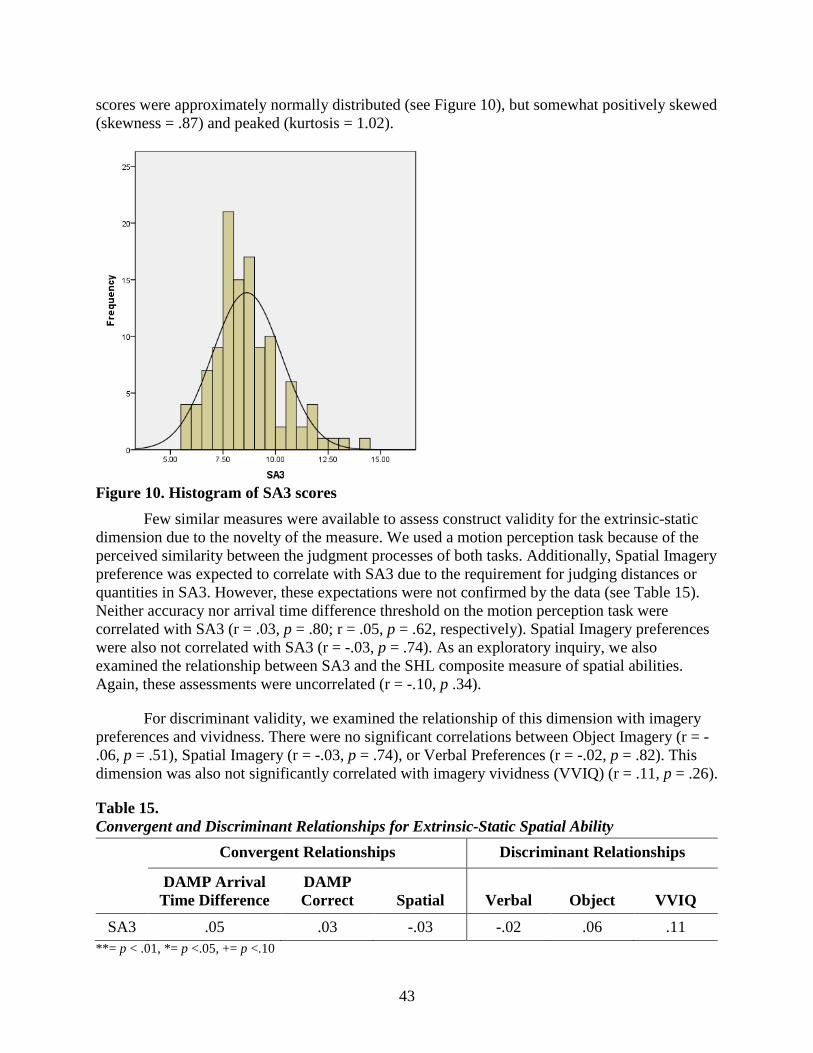
43
scores were approximately normally distributed (see Figure 10), but somewhat positively skewed (skewness = .87) and peaked (kurtosis = 1.02).
Figure 10. Histogram of SA3 scores
Few similar measures were available to assess construct validity for the extrinsic-static dimension due to the novelty of the measure. We used a motion perception task because of the perceived similarity between the judgment processes of both tasks. Additionally, Spatial Imagery preference was expected to correlate with SA3 due to the requirement for judging distances or quantities in SA3. However, these expectations were not confirmed by the data (see Table 15). Neither accuracy nor arrival time difference threshold on the motion perception task were correlated with SA3 (r = .03, p = .80; r = .05, p = .62, respectively). Spatial Imagery preferences were also not correlated with SA3 (r = -.03, p = .74). As an exploratory inquiry, we also examined the relationship between SA3 and the SHL composite measure of spatial abilities. Again, these assessments were uncorrelated (r = -.10, p .34).
For discriminant validity, we examined the relationship of this dimension with imagery preferences and vividness. There were no significant correlations between Object Imagery (r = -.06, p = .51), Spatial Imagery (r = -.03, p = .74), or Verbal Preferences (r = -.02, p = .82). This dimension was also not significantly correlated with imagery vividness (VVIQ) (r = .11, p = .26).
Table 15. Convergent and Discriminant Relationships for Extrinsic-Static Spatial Ability
Convergent Relationships Discriminant Relationships
DAMP Arrival Time Difference
DAMP Correct Spatial Verbal Object VVIQ
SA3 .05 .03 -.03 -.02 .06 .11 **= p < .01, *= p <.05, += p <.10
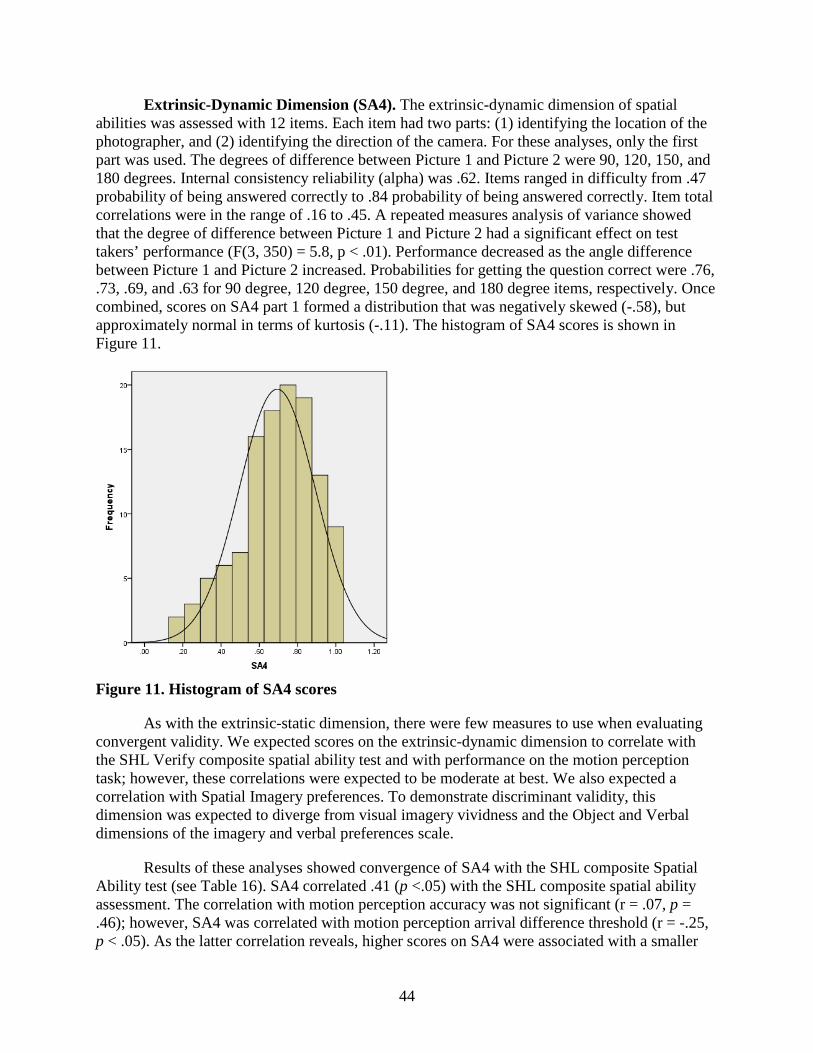
44
Extrinsic-Dynamic Dimension (SA4). The extrinsic-dynamic dimension of spatial abilities was assessed with 12 items. Each item had two parts: (1) identifying the location of the photographer, and (2) identifying the direction of the camera. For these analyses, only the first part was used. The degrees of difference between Picture 1 and Picture 2 were 90, 120, 150, and 180 degrees. Internal consistency reliability (alpha) was .62. Items ranged in difficulty from .47 probability of being answered correctly to .84 probability of being answered correctly. Item total correlations were in the range of .16 to .45. A repeated measures analysis of variance showed that the degree of difference between Picture 1 and Picture 2 had a significant effect on test takers’ performance (F(3, 350) = 5.8, p < .01). Performance decreased as the angle difference between Picture 1 and Picture 2 increased. Probabilities for getting the question correct were .76, .73, .69, and .63 for 90 degree, 120 degree, 150 degree, and 180 degree items, respectively. Once combined, scores on SA4 part 1 formed a distribution that was negatively skewed (-.58), but approximately normal in terms of kurtosis (-.11). The histogram of SA4 scores is shown in Figure 11.
Figure 11. Histogram of SA4 scores
As with the extrinsic-static dimension, there were few measures to use when evaluating convergent validity. We expected scores on the extrinsic-dynamic dimension to correlate with the SHL Verify composite spatial ability test and with performance on the motion perception task; however, these correlations were expected to be moderate at best. We also expected a correlation with Spatial Imagery preferences. To demonstrate discriminant validity, this dimension was expected to diverge from visual imagery vividness and the Object and Verbal dimensions of the imagery and verbal preferences scale.
Results of these analyses showed convergence of SA4 with the SHL composite Spatial Ability test (see Table 16). SA4 correlated .41 (p <.05) with the SHL composite spatial ability assessment. The correlation with motion perception accuracy was not significant (r = .07, p = .46); however, SA4 was correlated with motion perception arrival difference threshold (r = -.25, p < .05). As the latter correlation reveals, higher scores on SA4 were associated with a smaller
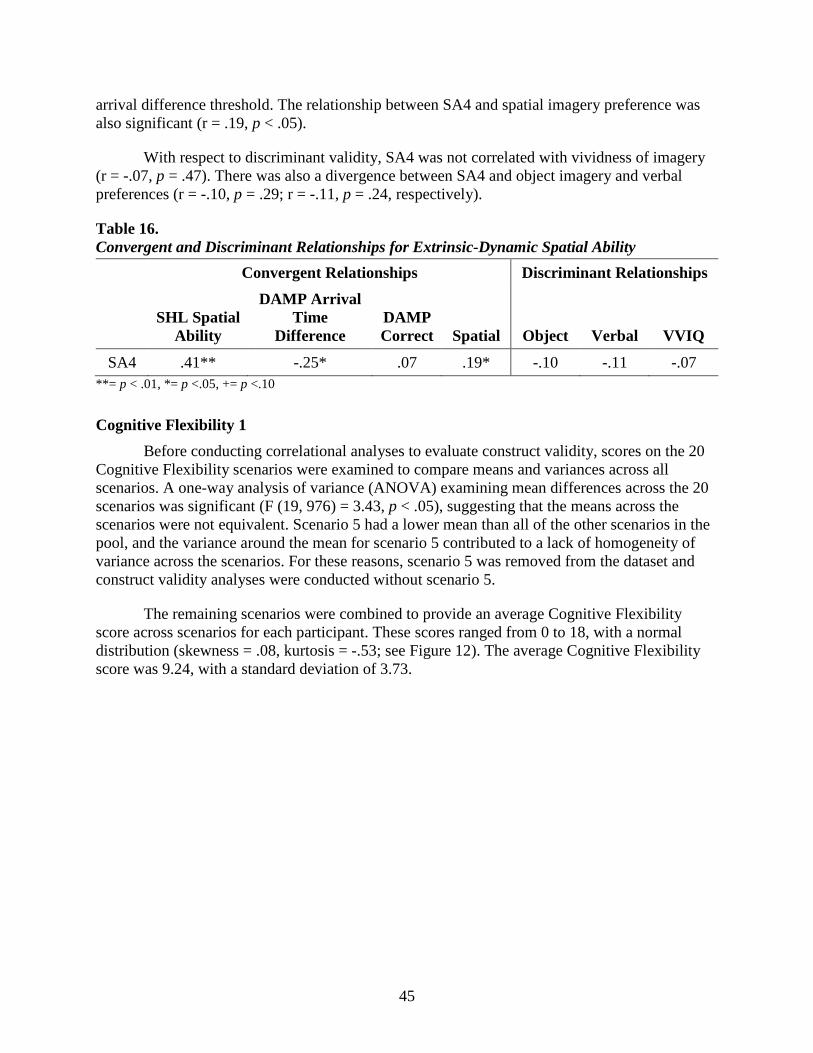
45
arrival difference threshold. The relationship between SA4 and spatial imagery preference was also significant (r = .19, p < .05).
With respect to discriminant validity, SA4 was not correlated with vividness of imagery (r = -.07, p = .47). There was also a divergence between SA4 and object imagery and verbal preferences (r = -.10, p = .29; r = -.11, p = .24, respectively).
Table 16. Convergent and Discriminant Relationships for Extrinsic-Dynamic Spatial Ability
Convergent Relationships Discriminant Relationships
SHL Spatial Ability
DAMP Arrival Time
Difference DAMP Correct Spatial Object Verbal VVIQ
SA4 .41** -.25* .07 .19* -.10 -.11 -.07 **= p < .01, *= p <.05, += p <.10
Cognitive Flexibility 1 Before conducting correlational analyses to evaluate construct validity, scores on the 20
Cognitive Flexibility scenarios were examined to compare means and variances across all scenarios. A one-way analysis of variance (ANOVA) examining mean differences across the 20 scenarios was significant (F (19, 976) = 3.43, p < .05), suggesting that the means across the scenarios were not equivalent. Scenario 5 had a lower mean than all of the other scenarios in the pool, and the variance around the mean for scenario 5 contributed to a lack of homogeneity of variance across the scenarios. For these reasons, scenario 5 was removed from the dataset and construct validity analyses were conducted without scenario 5.
The remaining scenarios were combined to provide an average Cognitive Flexibility score across scenarios for each participant. These scores ranged from 0 to 18, with a normal distribution (skewness = .08, kurtosis = -.53; see Figure 12). The average Cognitive Flexibility score was 9.24, with a standard deviation of 3.73.
46
Figure 12. Histogram of Cognitive Flexibility 1, Flexible Thinking Scores
Convergent validity evidence was expected from correlations with the Cognitive Flexibility Inventory and the Actively Open-Minded Thinking scale. Correlations among these constructs are shown in Table 17.
Table 17. Correlation Matrix for Cognitive Flexibility Construct Validity Analyses
1+ 2 3 4
1. STA Cognitive Flexibility 1 - .03 .20* -.02
2. Cognitive Flexibility Inventory .91 .34** .05
3. Actively Open-Minded Thinking .93 -.11
4. Risk Taking .84 +Reliabilities (Cronbach’s Alpha) are presented in the diagonal of the correlation matrix.
The STA Cognitive Flexibility 1 assessment was significantly correlated with Active Open-Minded Thinking (r = .20, p < .05). The STA Cognitive Flexibility 1 assessment, however, was not significantly correlated with the Cognitive Flexibility Inventory (r = .03, p = .57); this may be because the Cognitive Flexibility Inventory had a distribution that was heavily negatively skewed, indicating that respondents tended to select the two most positively worded response options in most cases. The distribution of responses suggests that this inventory may be participant to socially desirable responding. The Actively Open-Minded Thinking scale was also negatively skewed, though not to the same degree. Actively Open-Minded Thinking and the Cognitive Flexibility Inventory correlated .34.
Evidence of discriminant validity was expected from a lack of correlation between the STA Cognitive Flexibility 1 assessment and a Risk-Taking Questionnaire (see Table 18). Results
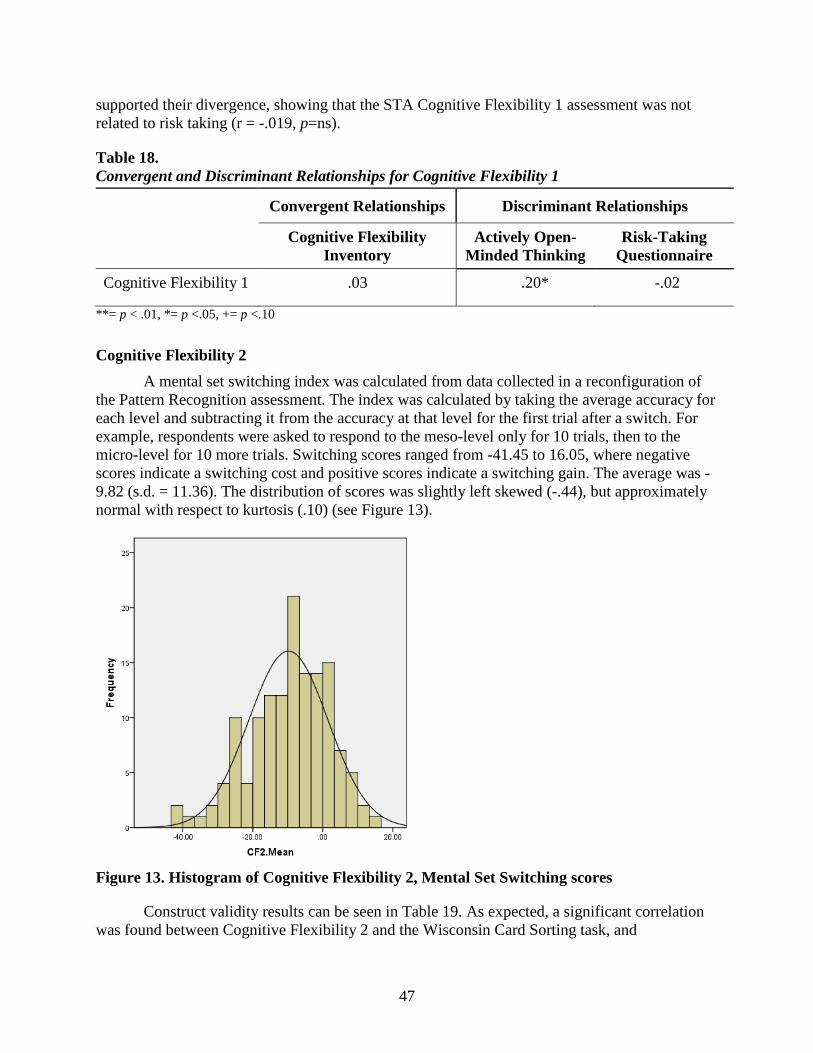
47
supported their divergence, showing that the STA Cognitive Flexibility 1 assessment was not related to risk taking (r = -.019, p=ns).
Table 18. Convergent and Discriminant Relationships for Cognitive Flexibility 1
Convergent Relationships Discriminant Relationships
Cognitive Flexibility Inventory
Actively Open-Minded Thinking
Risk-Taking Questionnaire
Cognitive Flexibility 1 .03 .20* -.02
**= p < .01, *= p <.05, += p <.10
Cognitive Flexibility 2 A mental set switching index was calculated from data collected in a reconfiguration of
the Pattern Recognition assessment. The index was calculated by taking the average accuracy for each level and subtracting it from the accuracy at that level for the first trial after a switch. For example, respondents were asked to respond to the meso-level only for 10 trials, then to the micro-level for 10 more trials. Switching scores ranged from -41.45 to 16.05, where negative scores indicate a switching cost and positive scores indicate a switching gain. The average was -9.82 (s.d. = 11.36). The distribution of scores was slightly left skewed (-.44), but approximately normal with respect to kurtosis (.10) (see Figure 13).
Figure 13. Histogram of Cognitive Flexibility 2, Mental Set Switching scores
Construct validity results can be seen in Table 19. As expected, a significant correlation was found between Cognitive Flexibility 2 and the Wisconsin Card Sorting task, and
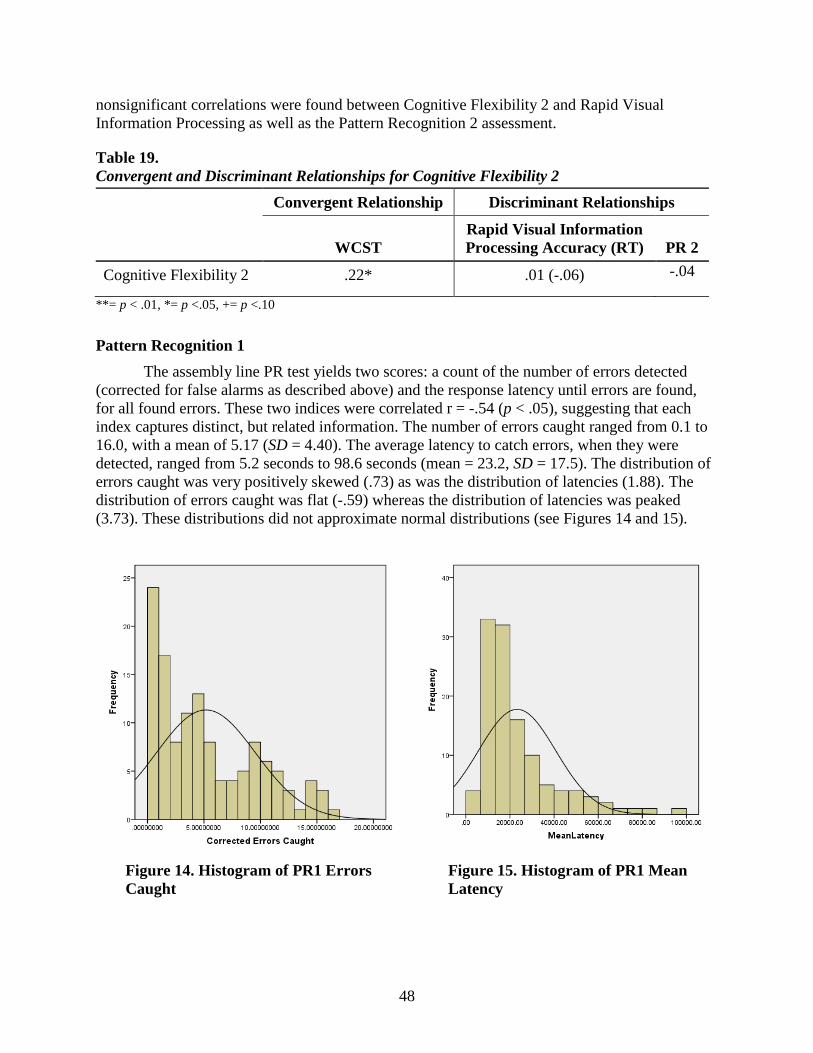
48
nonsignificant correlations were found between Cognitive Flexibility 2 and Rapid Visual Information Processing as well as the Pattern Recognition 2 assessment.
Table 19. Convergent and Discriminant Relationships for Cognitive Flexibility 2
Convergent Relationship Discriminant Relationships
WCST
Rapid Visual Information Processing Accuracy (RT) PR 2
Cognitive Flexibility 2 .22* .01 (-.06) -.04
**= p < .01, *= p <.05, += p <.10
Pattern Recognition 1 The assembly line PR test yields two scores: a count of the number of errors detected
(corrected for false alarms as described above) and the response latency until errors are found, for all found errors. These two indices were correlated r = -.54 (p < .05), suggesting that each index captures distinct, but related information. The number of errors caught ranged from 0.1 to 16.0, with a mean of 5.17 (SD = 4.40). The average latency to catch errors, when they were detected, ranged from 5.2 seconds to 98.6 seconds (mean = 23.2, SD = 17.5). The distribution of errors caught was very positively skewed (.73) as was the distribution of latencies (1.88). The distribution of errors caught was flat (-.59) whereas the distribution of latencies was peaked (3.73). These distributions did not approximate normal distributions (see Figures 14 and 15).
Figure 14. Histogram of PR1 Errors Caught
Figure 15. Histogram of PR1 Mean Latency
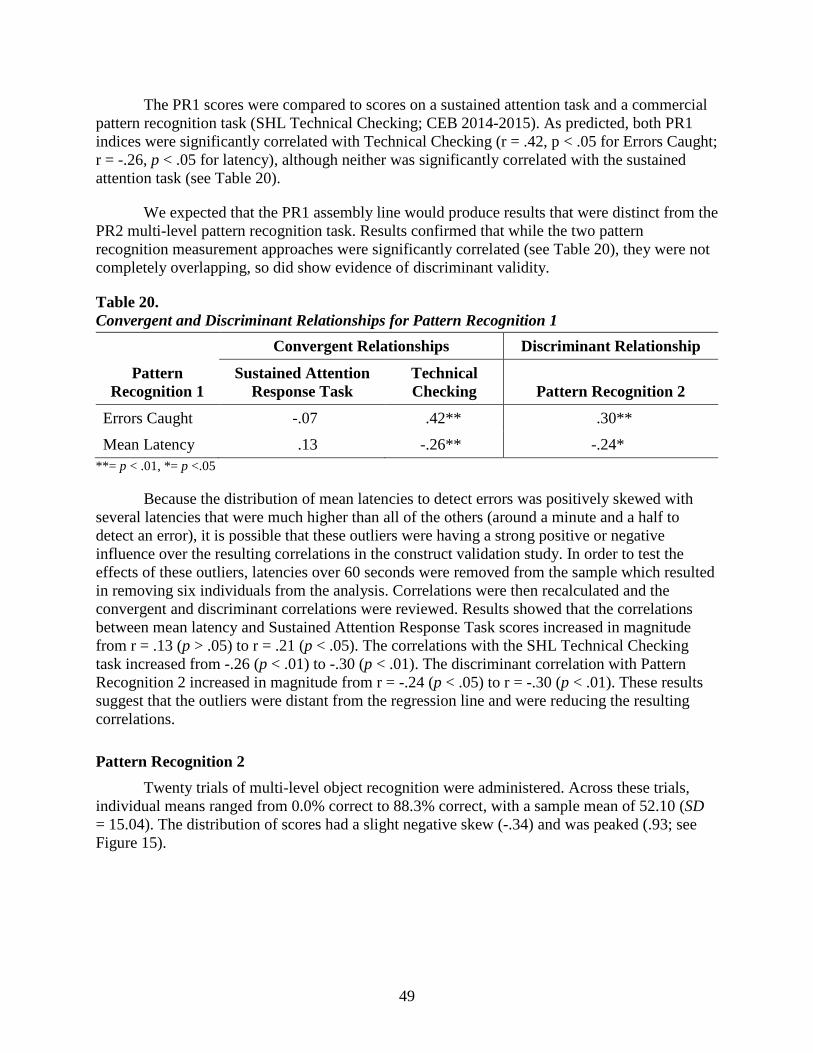
49
The PR1 scores were compared to scores on a sustained attention task and a commercial pattern recognition task (SHL Technical Checking; CEB 2014-2015). As predicted, both PR1 indices were significantly correlated with Technical Checking (r = .42, p < .05 for Errors Caught; r = -.26, p < .05 for latency), although neither was significantly correlated with the sustained attention task (see Table 20).
We expected that the PR1 assembly line would produce results that were distinct from the PR2 multi-level pattern recognition task. Results confirmed that while the two pattern recognition measurement approaches were significantly correlated (see Table 20), they were not completely overlapping, so did show evidence of discriminant validity.
Table 20. Convergent and Discriminant Relationships for Pattern Recognition 1
Convergent Relationships Discriminant Relationship
Pattern Recognition 1
Sustained Attention Response Task
Technical Checking Pattern Recognition 2
Errors Caught -.07 .42** .30**
Mean Latency .13 -.26** -.24* **= p < .01, *= p <.05
Because the distribution of mean latencies to detect errors was positively skewed with several latencies that were much higher than all of the others (around a minute and a half to detect an error), it is possible that these outliers were having a strong positive or negative influence over the resulting correlations in the construct validation study. In order to test the effects of these outliers, latencies over 60 seconds were removed from the sample which resulted in removing six individuals from the analysis. Correlations were then recalculated and the convergent and discriminant correlations were reviewed. Results showed that the correlations between mean latency and Sustained Attention Response Task scores increased in magnitude from r = .13 (p > .05) to r = .21 (p < .05). The correlations with the SHL Technical Checking task increased from -.26 (p < .01) to -.30 (p < .01). The discriminant correlation with Pattern Recognition 2 increased in magnitude from r = -.24 (p < .05) to r = -.30 (p < .01). These results suggest that the outliers were distant from the regression line and were reducing the resulting correlations.
Pattern Recognition 2 Twenty trials of multi-level object recognition were administered. Across these trials,
individual means ranged from 0.0% correct to 88.3% correct, with a sample mean of 52.10 (SD = 15.04). The distribution of scores had a slight negative skew (-.34) and was peaked (.93; see Figure 15).

50
Figure 16. Histogram of PR2 scores
PR 2 requires perceiving and recognizing information in a short amount of time, so we expected that scores would be related to participants’ visual processing speeds. Beyond this convergent relationship, there are few other existing measures with which to compare PR2.
Results showed that PR2 was significantly related to rapid information processing accuracy (r = .29, p < .05), but not rapid information processing speed (r = .02, p = ns). As noted previously, PR2 was significantly correlated with both measures of PR1, but at a level that suggests they are distinct constructs.
Table 21. Convergent and Discriminant Relationships for Pattern Recognition
Convergent Relationships Discriminant Relationships
Rapid Visual Information Processing (Accuracy)
Rapid Visual Information
Processing (RT)
Pattern Recognition 1
(Errors Caught)
Pattern Recognition 1
(Mean Latency)
Pattern Recognition 2
.29** .02 .30** -.24*
Cognitive Complexity The STA Cognitive Complexity assessment consisted of three different sorting activities:
1) a set of objects sorted based on how they look (CC1), 2) the same set of objects sorted based on how they are used (CC2), and 3) a set of systems-related words or phrases sorted by
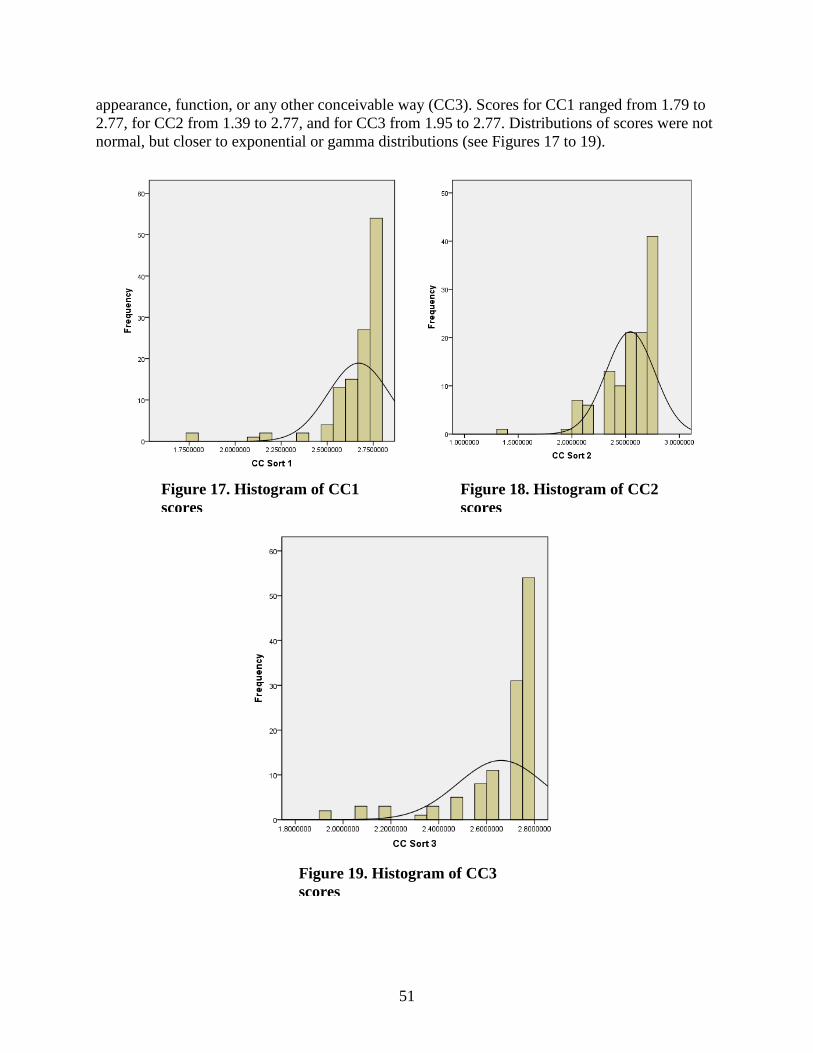
51
appearance, function, or any other conceivable way (CC3). Scores for CC1 ranged from 1.79 to 2.77, for CC2 from 1.39 to 2.77, and for CC3 from 1.95 to 2.77. Distributions of scores were not normal, but closer to exponential or gamma distributions (see Figures 17 to 19).
Figure 17. Histogram of CC1 scores
Figure 18. Histogram of CC2 scores
Figure 19. Histogram of CC3 scores
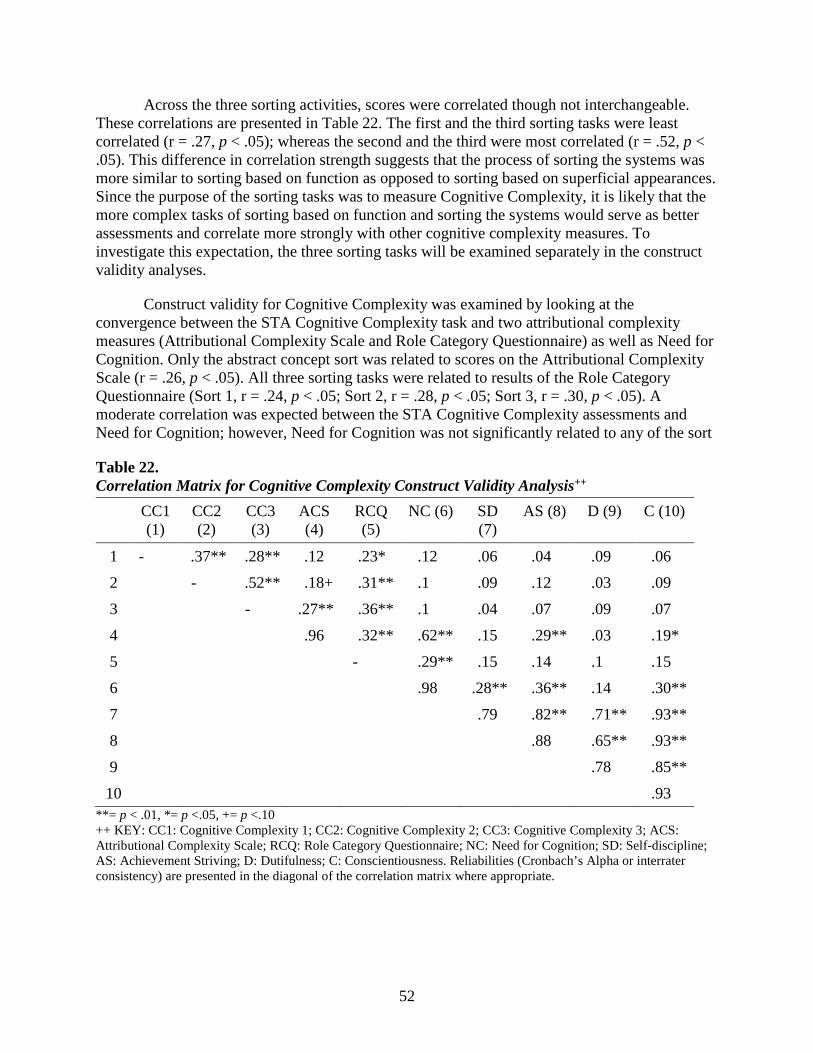
52
Across the three sorting activities, scores were correlated though not interchangeable. These correlations are presented in Table 22. The first and the third sorting tasks were least correlated (r = .27, p < .05); whereas the second and the third were most correlated (r = .52, p < .05). This difference in correlation strength suggests that the process of sorting the systems was more similar to sorting based on function as opposed to sorting based on superficial appearances. Since the purpose of the sorting tasks was to measure Cognitive Complexity, it is likely that the more complex tasks of sorting based on function and sorting the systems would serve as better assessments and correlate more strongly with other cognitive complexity measures. To investigate this expectation, the three sorting tasks will be examined separately in the construct validity analyses.
Construct validity for Cognitive Complexity was examined by looking at the convergence between the STA Cognitive Complexity task and two attributional complexity measures (Attributional Complexity Scale and Role Category Questionnaire) as well as Need for Cognition. Only the abstract concept sort was related to scores on the Attributional Complexity Scale (r = .26, p < .05). All three sorting tasks were related to results of the Role Category Questionnaire (Sort 1, r = .24, p < .05; Sort 2, r = .28, p < .05; Sort 3, r = .30, p < .05). A moderate correlation was expected between the STA Cognitive Complexity assessments and Need for Cognition; however, Need for Cognition was not significantly related to any of the sort
Table 22. Correlation Matrix for Cognitive Complexity Construct Validity Analysis++
CC1 (1)
CC2 (2)
CC3 (3)
ACS (4)
RCQ (5)
NC (6) SD (7)
AS (8) D (9) C (10)
1 - .37** .28** .12 .23* .12 .06 .04 .09 .06
2 - .52** .18+ .31** .1 .09 .12 .03 .09
3 - .27** .36** .1 .04 .07 .09 .07
4 .96 .32** .62** .15 .29** .03 .19*
5 - .29** .15 .14 .1 .15
6 .98 .28** .36** .14 .30**
7 .79 .82** .71** .93**
8 .88 .65** .93**
9 .78 .85**
10 .93 **= p < .01, *= p <.05, += p <.10 ++ KEY: CC1: Cognitive Complexity 1; CC2: Cognitive Complexity 2; CC3: Cognitive Complexity 3; ACS: Attributional Complexity Scale; RCQ: Role Category Questionnaire; NC: Need for Cognition; SD: Self-discipline; AS: Achievement Striving; D: Dutifulness; C: Conscientiousness. Reliabilities (Cronbach’s Alpha or interrater consistency) are presented in the diagonal of the correlation matrix where appropriate.

53
Discriminant validity was obtained by correlating the STA Cognitive Complexity assessment with the personality dimension of conscientiousness and three of its subfacets (achievement striving, dutifulness, and self-discipline). As expected, none of these correlations was significant, ranging from r = .03 to r = .12. These convergent and discriminant relationships can be seen in Table 23.
In order to ensure that outliers were not driving the obtained correlations, we conducted an additional analysis by dropping scores less than 1.9 and reexamined all correlations. Overall, this had very little impact on the results but tended to strengthen the observed relationships. The correlation between CC2 and ACS became significant (r = .19, p < .05), but all other significance tests were unchanged. The lowest scores on the three sorts appeared to dampen the correlations with convergent constructs.
Taken together, the results for Cognitive Complexity provide some evidence for the construct validity of the assessment. Some convergent validity evidence was found that shows that Cognitive Complexity is related to other constructs that are similar. Additionally, some discriminant validity evidence shows that Cognitive Complexity was not related to constructs that should not be related.
Table 23. Convergent and Discriminant Relationships for Cognitive Complexity++
Convergent Relationships Discriminant Relationships
++ ACS RCQ NC Self-
Discipline Achievement
Striving Dutifulness Conscientiousness
CC 1 .12 .23* .12 .06 .04 .09 .06
CC 2 .18+ .31** .10 .09 .12 .03 .09
CC 3 .27** .36** .10 .04 .07 .09 .07 **= p < .01, *= p <.05, += p <.10 ++KEY: CC1: Cognitive Complexity; CC2: Cognitive Complexity; CC3: Cognitive Complexity; ACS: Attributional Complexity Scale; RCQ: Role Category Questionnaire; NC: Need for Cognition
Discussion
Interactive web-based measures were developed for five constructs: Hierarchical Working Memory Capacity, Spatial Ability, Cognitive Flexibility, Pattern Recognition, and Cognitive Complexity. The measurement approach for each construct was based on existing measures where possible, but each measure was tailored to fit the proposed definition of the construct and some measures were tailored to capture the multilevel characteristic of the systems context. For all of the measures, with the exception of HWMC, multiple dimensions were captured: two each for Cognitive Flexibility and Pattern Recognition (CF1, CF2, PR1, PR2); three for Cognitive Complexity (CC1, CC2, CC3); and four for Spatial Ability (SA1-SA4). Results generally provided support for the construct validity of these measures, although the level of support varied. Construct validity evidence was the strongest for HWMC, Extrinsic-dynamic (SA4), Micro/Macro Task Switching (CF2), and Abstract Grouping (CC3), and was the
54
weakest for Extrinsic-static (SA3) and scenario-based hypothesis formation task (CF1). Results related to each of the five constructs will be discussed.
Hierarchical Working Memory Capacity The STA HWMC measure was designed using a traditional location-number memory
binding task, with the novel addition of a three-level hierarchy for the location component. The purpose of introducing the hierarchy in the operationalization was to mimic the nature of the multiple levels of understanding that are required when working with systems. Results showed that STA HWMC produced scores that were correlated with performance on other short-term (Corsi Block Tapping test) and working memory (Symmetry Span) tasks. These initial results suggest that the STA HWMC measure is effective at measuring working memory capacity.
Additional research is needed to more fully determine how HWMC relates to other working memory tasks, such as n-back updating or alpha span tasks. The present research helped to establish initial construct validity evidence, but further research is needed to determine the place of HWMC in the nomological network of working memory constructs and operationalizations.
In addition, criterion-related research is needed to examine whether the hierarchical configuration of the HWMC test provides incremental improvement over working memory capacity tests that do not have that characteristic. Researchers have identified mode dependent differences in performance within individuals for different working memory tests (e.g. verbal versus spatial); however, hierarchically arranged stimuli have not been examined. Additional research should determine if this form of working memory helps predict systems thinking performance better than established working memory capacity measures.
Prior to further testing, some modifications to the scoring of the test would be useful. Test takers in this sample remembered just under 3 location-number pairs on average and the distribution of scores showed that they were truncated at the lower tail. This, combined with subjective reports from test takers, suggests that the current configuration of the HWMC test was very difficult. Modifying the test to expand discrimination of the lower scores would be useful. One way this could be accomplished is by having future versions of the test track location and number recall separately, so that partial credit can be given if only numbers or locations (but not both) elements were recalled correctly.
Finally, this measurement approach does not enable testing reliability through an internal consistency approach, so future research should examine the stability of scores using a test-retest approach to reliability. Working memory capacity is expected to be a stable, trait-like construct, so scores should be consistent over time. Overall, the STA HWMC measure shows a high level of potential as an effective working memory capacity measure.
Spatial Abilities Spatial Ability was assessed using four measures grounded in the two-by-two taxonomy
of spatial abilities identified by Newcombe and Shipley (2015) that uses intrinsic/extrinsic and static/dynamic dimensions. Psychometric evaluation of the four measures (SA1-SA4) indicated that all four measures had adequate internal consistency, with Cronbach’s alphas ranging from
55
.62 to .73. Internal consistency has been cited by some as evidence of construct validity (e.g., Cascio & Aguinis, 2005).
Previous research has not measured all four quadrants of this classification at once and information about the orthogonality of the dimensions was not available. Our results suggest that there is some correlation between the dimensions with the operationalizations we developed. The magnitudes of the correlations ranged from about .10 (SA1 and SA3) to .49 (SA2 and SA4), with an average of .28. Only the correlation between SA1 and SA3 was not significant. The moderate correlations suggest that the Spatial Abilities dimensions are distinct but related aspects of spatial abilities. Additional research is necessary to determine the incremental validity of each dimension over each other and over other existing measures when predicting various criteria of interest. With the creation of the STA Spatial Abilities assessment, all four Spatial Ability dimensions can administered to test-takers and results can be compared. This has not been possible until now, since no existing Spatial Ability assessments cover all four dimensions.
Results from the construct validity study showed that most of the expected convergent and discriminant relationships were supported across the four dimensions. Though SA1 and SA3 did not show convergent validity, they did show discriminant validity evidence. SA1 was expected to correlate with object imagery preferences and self-reported vividness of imagery. These results were in the opposite direction of expectations – object imagery preference and vividness were negatively correlated with scores on SA1. This unexpected result suggests that object imagery interferes with the visual search process. It is possible that individuals who are more oriented to object imagery were more distracted by the complex patterns in the search field than were individuals who are less oriented to object imagery. The visual search task in SA1 should have also been correlated with spatial imagery preferences, but this correlation did not reach significance in our research. This is perhaps driven by low sample size. Performance on a visual scanning task was significantly related to SA1 scores. In conjunction, these results suggest that performance on SA1 is rooted in seeing and recognizing stimuli quickly and not related to thinking in vivid pictures or thinking in spatial relationships. Further research is needed to examine the criterion-related validity of SA1 for STA. Given these characteristics, however, it might be that SA1 is not as relevant to STA as other dimensions of spatial ability.
SA3 was not significantly correlated with any convergent validity constructs. In part, this reflects the fact that there were few existing automated measures of extrinsic-static spatial abilities with which to compare the new measure. SA3 did correlate with SA2 (r = -.28) and SA4 (r = -.21), suggesting that some aspects of spatial ability are being measured (note the negative relationship is expected and due to how SA3 is scored). More research is needed to determine if the SA3 assessment is measuring anything useful or if the approach to measurement needs to be modified.
Scores on the SA2 and SA4 assessments were significantly correlated with convergent constructs and not correlated or inversely correlated with discriminant constructs. Therefore, initial construct validity evidence for SA2 and SA4 has been obtained. The next step for the development of these two dimensions is to establish adaptive algorithms to administer SA assessments more efficiently. In the present research, item difficulties and discrimination functions were obtained. However, additional items need to be created and tested to further establish item-characteristic curves.
56
Additional items might be useful across all four dimensions because every dimension, with the exception of SA3, showed a truncated distribution on the tail end with higher scores. This suggests that these assessments were not difficult enough to effectively differentiate between the highest performing test-takers. Creating more difficult items in subsequent research should remedy this issue.
Overall, results suggest a high degree of promise for the construct validity of the STA Spatial Ability assessment. Future research should improve the measures by introducing additional items and collecting additional data to support reliability and validity evidence. Another analysis that could be conducted to bolster content validity evidence is to perform a sorting task on the set of all measures using psychologists familiar with the Newcombe and Shipley classification. In addition to providing more validity evidence, this could be used to examine the content of SA3 more closely. This type of rating approach could also be used to help identify other potential operationalizations of the extrinsic-static and other SA dimensions.
Cognitive Flexibility Two Cognitive Flexibility assessments were created and examined for construct validity.
Both assessments showed some convergent and discriminant validity evidence. The hypothesized convergent relationships for both assessments were significant, though the magnitudes of the correlations were small. These results suggest that the STA measures are in line with existing measurement approaches, but not identical to those approaches.
For both CF1 and CF2, the STA measurement approaches provide structural improvements over traditional measurement approaches. In this study, the distributions of both self-report CF tests were heavily skewed in the positive direction indicating that most participants indicated that they were very cognitively flexible. The distribution of the STA CF1 scores was much more normal, a quality that is important in selection and classification contexts. The scenario-based approach of STA CF1 may enable the measure to overcome socially desirable responding and test taker faking.
Similarly, STA CF2 scores were more normally distributed than the Wisconsin Card Sort results that were used as a mental set switching comparison. The Wisconsin Card Sorting task was developed for clinical settings and is not great at differentiating among clinically normal individuals due to the high performance of most test-takers from a non-clinical as opposed to clinical population.
Next steps for CF1 include additional testing of the scenarios to obtain reliability information. In the current research, 20 scenarios were used, but no single participant completed all 20. Therefore, internal consistency or split half reliability could not be calculated. Scores on the different scenarios should be compared in future research to identify the strengths and weaknesses of each scenario in eliciting cognitive flexibility.
In addition, a version of CF1 should be developed that can be automatically scored for accuracy in addition to scoring for changes. The present study began to populate a database of responses to each scenario, which can then be analyzed with latent semantic analysis and evaluated for accuracy. More data collections are necessary to further populate this database with
57
typical responses and obtain evaluative ratings on these responses. Then computer algorithms can be trained to differentiate between adequate and inadequate responses so that the test can be scored automatically for the quality of responses.
For the STA CF2 measure, an important next step includes exploring ways that the test can be shortened. In the current study, 130 trials were used in which the test-taker responded to one level of the 3-level figure. Blocks of ten trials were completed with the test-taker responding to one level before the level was switched in the next block. By examining the switching costs across trials, and experimenting with block lengths, we may be able to reach a stable estimate of CF2 in fewer than 130 trials.
Pattern Recognition Pattern recognition scores for the anomaly detection task (PR1) were significantly
correlated with convergent constructs and significantly but not strongly correlated with discriminant constructs. This was true for both the number of errors caught and the average response time to detect an error once it occurred. The distribution of the mean latencies to respond showed that there were a number of outliers in which latencies to respond were very high. When these outliers were removed, the magnitude of the correlations increased and all remained significant.
Pattern recognition scores for the anomaly detection task (PR1) and Multi-level Object Recognition (PR2) were used to demonstrate discriminant validity with each other. While results showed they were significantly correlated, the correlations between PR1 and PR2 were moderate (r = .30 and -.24 for Errors Caught and Mean Response Latency, respectively), indicating that these are not identical aspects of pattern recognition. While the present validation results are promising, additional research is needed to continue to establish construct validity, and identify the place of both PR1 and PR2 in the nomological network of the Pattern Recognition construct.
As mentioned, the distributions for both of these metrics were positively skewed and did not approximate a normal distribution, which may pose problems for distinguishing between individuals at the extremes. In future research there are a number of actions that could be taken to modify the stimuli for each test to increase the distribution of scores at the low end. For PR1 the positive skew indicated that a large number of participants did not catch any or only a few errors. The assembly task can be made easier by slowing down the rate of assembly or by decreasing the number of inputs to the product. As a useful next step, modifications to the test procedures and/or stimuli should be made in order to generate a more normal distribution.
Cognitive Complexity The STA Cognitive Complexity assessment showed good convergent and discriminant
validity evidence. The three sorting rounds were each related to one measure of attributional complexity (Role Category Questionnaire) and CC 3 (systems phrases) was also related to the other measure of attributional complexity (Attributional Complexity Scale). None of the scores from the sorting activity were related to conscientiousness, suggesting that results were not driven by test-takers’ diligence on the task.
58
The three sorts related differently to the convergent constructs, suggesting either that the sorts capture different dimensions of Cognitive Complexity, or that some sorts are stronger measures of cognitive complexity than others. It is possible that the assigned time limits (10 minutes for CC1, 15 minutes for CC2 and CC3) introduced a confound that was driving these differences; however, CC2 was not as strongly related to other constructs as CC3, and these two sorts had the same time limits. An examination of the actual time spent on each sorting round suggests that time was not a factor in the complexity of the sorting activity. Of the 123 participants that completed the sorting activity, only five spent more than nine minutes on CC1. The average time spend on each sorting round was 3.27 minutes, 3.57 minutes, and 5.87 minutes, respectively. This further suggests that the imposed time limits were not responsible for the different relationship among the sorting rounds and other constructs.
Object sorting is a promising measurement approach for a construct domain that does not have many good measures. Attributional complexity is measured through a number of self-report questionnaires, but problems with faking prohibit reliance on self-report. The object sorting task we developed helps to reduce the likelihood of faking. Additionally, the object sorting task diverges from the standard attributional complexity approach to measuring cognitive complexity, and enables measuring aspects of cognitive complexity that do not pertain to person perception. While the literature on cognitive complexity has many measures of attributional complexity, it lacks other approaches to measuring complexity that are easy to administer and score.
Additional research should explore expanding the objects that are used in the pictorial sorts. The objects that were used were chosen randomly and should have had few outwardly apparent connections. Other sets of object may be more conducive to identifying relationships and may require test-takers to put less time into completing the sorting activities. This would be beneficial in reducing required testing time.
Another next step is to develop automated methods to evaluate the relevance of the group labels generated by participants. This research allowed us to develop an initial database of group labels and common sorts; however, more data are needed in order to develop an automated scoring mechanism. Once a sufficient database of labels and sorts is developed, computer algorithms can be trained to recognize the relevance of different groups that a test taker can create. This will enable us to adjust the scores of individuals who devise categories that are nonsensical. Moving toward this should improve the strength of the measure and produce a test that can be automatically scored and delivered.
Conclusions Our objective in this research was to develop innovative measures of cognitive abilities
that may be required for effective systems thinking. Initial psychometric and construct validity analyses suggest that these measures warrant further development and testing. Measures for all five constructs showed promise. Future research should make modifications to strengthen the measures further and establish predictive validity with systems thinking performance. Beyond systems thinking performance, it is likely that a number of these measures could be useful in other Army assessment situations. For example, while the current ASVAB includes the Assembling Objects (AO) subtest, AO measures only the intrinsic-dynamic, and to a lesser extent, extrinsic-dynamic quadrants of spatial ability. Incorporating the STA Spatial Ability test

59
would provide a more comprehensive assessment of the spatial abilities of incoming Soldiers. Other STA constructs such as cognitive flexibility and cognitive complexity could be relevant predictors in domains such as special operations or cyber warfare that require complex and adaptive problem-solving.
60
References
Ackoff, R. (1981). Creating the corporate future: Plan or be planned for. New York: John Wiley & Sons.
Adis, C., Wisecarver, M., Key-Roberts, M., Hope, T., & Pritchett, S. (under review). Building sociocultural systems thinking capabilities. (ARI Technical Report). Fort Belvoir, VA: U.S. Army Research Institute for the Behavioral and Social Sciences.
Allbutt, J., Ling, J., Heffernan, T. M., & Shafiullah, M. (2008). Self-report imagery questionnaire scores and subtypes of social-desirable responding: auditory imagery, visual imagery, and thinking style. Journal of Individual Differences, 29, 181-188.
Arendasy, M., Sommer, M., & Gluck, J. (2004). Dimensionality and differential validity of change problems: On the effects of strategy use. Zeitschrift für Pädagogische Psychologie, 18, 231-243.
Baddeley, A. D. (1986). Working memory. Oxford, England: Clarendon Press.
Beauvais, J. E., Woods, S. P., Delaney, R. C., & Fein, D. (2004). Development of a Tactile Wisconsin Card Sorting Test. Rehabilitation Psychology, 49, 282-287.
Berg, E. A., (1948). A simple objective technique for measuring flexibility in thinking. Journal of General Psychology, 39, 15-22.
Bieri, J. (1955). Cognitive complexity-simplicity and predictive behavior. The Journal of Abnormal and Social Psychology, 51, 263-268.
Bieri, J. (1966). Cognitive complexity and personality development. In O. J. Harvey (Ed.), Experience, structure and adaptability (pp. 13- 37). New York: Springer.
Blazhenkova, O., & Kozhevnikov, M. (2009). The new object-spatial-verbal cognitive style model: Theory and measurement. Applied Cognitive Psychology, 23, 638-663.
Borkowski, J. G., Benton, A. L., & Spreen, O. (1967). Word fluency and brain damage. Neuropsychologia, 5, 135-140.
Bratfisch, O., & Hagman, E. (2004). Visualization Version 23.00: Manual. Modling, Sweden: Schuhfried.
Campbell, J.P., McCloy, R.A., Oppler, S.H., & Sager, C.E. (1993). A theory of performance. In N.Schmitt, W.C. Borman, & Associates (Eds.), Personnel selection in organizations (pp. 35-70). San Francisco: Jossey-Bass.
Campos, A., & Pérez-Fabello, M. J. (2009). Psychometric quality of a revised version Vividness of Visual Imagery Questionnaire. Perceptual and Motor Skills, 108, 798-802.
Caplan, B., & Caffery, D. (1992). Fractionating block design: Development of a test of visuospatial analysis. Neuropsychology, 6, 385-394.
Carr, J. E. (1965). The role of conceptual organization in interpersonal discrimination. The Journal of Psychology, 59, 159-176.
61
Carraher, S. M., & Buckley, M. R. (1996). Cognitive complexity and the perceived dimensionality of pay satisfaction. Journal of Applied Psychology, 81, 102-109.
Carroll, J. B. (1993). Human cognitive abilities: A survey of factor-analytic studies. Cambridge, England: Cambridge University Press.
Cascio, W. F., & Aguinis, H. (2005). Applied psychology in human resource management. Upper Saddle River, NJ: Prentice Hall.
Case, R., Kurland, D. M., & Goldberg, J. (1982). Operational efficiency and the growth of short-term memory span. Journal of experimental child psychology, 33, 386-404.
CEB SHL Talent Measurement. (2014-2015). Verify – Technical Checking Technical Manual.
Checkland, P.B. (1981). Systems thinking, systems practice. Chichester, UK, Wiley.
Churchman, C. W. (1968). The systems approach. New York: Delta/Dell Publishing.
Cohen, J. D., Perlstein, W. M., Braver, T. S., Nystrom, L. E., Noll, D. C., Jonides, J., & Smith, E. E. (1997). Temporal dynamics of brain activation during a working memory task. Nature, 386, 604-608.
Colom, R., Contreras, M. J., Shih, P. C., & Santacreu, J. (2003). The assessment of spatial ability with a single computerized test. European Journal of Psychological Assessment, 19, 92-100.
Conway, A. R. A., Kane, M. J., Bunting, M. F., Hambrick, D. Z., Wilhelm, O., & Engle, R. W. (2005). Working memory span tasks: A methodological review and user’s guide. Psychonomic Bulletin & Review, 12, 769-786.
Corsi, P.M., (1972). Human memory and the medial temporal region of the brain (doctoral thesis). Retrieved from ProQuest Dissertations and Theses database. NK14430.
Costa, P. T., & McCrae, R. R. (1992). Revised NEO personality Inventory (NEO-PI-R) and NEO Five-Factor Inventory (NEO-FFI) professional manual. Odessa, FL: Psychological Assessment Resources. Available at http://www.sjdm.org/dmidi/NEO-FFI.html.
Costa, P. T., & McCrae, R. R. (2008). The revised neo personality inventory (neo-pi-r). The SAGE handbook of personality theory and assessment, 2, 179-198.
Crockett, W. H. (1965). Cognitive complexity and impression formation. Progress in Experimental Personality Research, 2, 47-53.
Cropley, A.J. (2000). Defining and measuring creativity: Are creativity tests worth using? Roeper Review, 23, 72-81.
Cut-e. (n.d.). Retrieved 05/26/2017 from https://www.cut-e.com/assessment-solutions/.
Daneman, M., & Carpenter, P. A. (1980). Individual differences in working memory and reading. Journal of Verbal Learning and Verbal Behavior, 19, 450-466.
Defense Manpower Data Center (2009). CAT-ASVAB Forms 1 and 2 (Technical Bulletin No. 2). Seaside, CA: Defense Manpower Data Center.

62
de Haan, L., Kuipers, E., Kuerten, Y., van Laar, M., Olivier, B,. & Verster, J.C. (2011). The RT 18: a new screening tool to test young adult risk-taking behavior. International Journal of General Medicine, 4, 575-584.
Dennis, J. P., & Vander Wal, J. S. (2010). The cognitive flexibility inventory: Instrument development and estimates of reliability and validity. Cognitive Therapy and Research, 34, 241-253.
Diamond, A. (2013). Executive functions. Annual Review of Psychology, 64, 135-168.
Dinsmore, D. L., Baggetta, P., Doyle, S., & Loughlin, S. M. (2014). The role of initial learning, problem features, prior knowledge, and pattern recognition on transfer success. The Journal of Experimental Education, 82, 121-141.
Dobbs, A. R., & Rule, B. G. (1989). Adult age differences in working memory. Psychology and Aging, 4, 500-503.
Doninger, G. M., Simon, E. S., & Schweiger, A. (2008). Adjustment of cognitive scores with a co-normed estimate of premorbid intelligence: Implementation using MindStreams computerized testing. Applied Neuropsychology, 15, 250-263.
Ekstrom, R. B., French, J. W., Harman, H. H. & Dermen, D. (1976). Manual for kit of factor-referenced cognitive tests. Princeton, NJ: Educational Testing Service.
Embretson, S. E. (1997). The factorial validity of scores from a cognitively designed test: The Spatial Learning Ability Test. Educational and Psychological Measurement, 57, 99-107.
England, C. (2004). Naglieri Nonverbal Ability Test-Individual Administration [Review of the Naglieri Nonverbal Ability Test-Individual Administration]. Mental Measurements Yearbook, Vol. 16. NE: The Buros Institute of Mental Measurements.
Englund, C. E., Reeves, D. L., Shingledecker, C. A., Thorne, D. R., Wilson, K. P., & Hegge, F. W. (1987). Unified tri-service cognitive performance assessment battery (UTC-PAB) I. Design and Specification of the Battery. Report Number 87-10. Naval Health Research Center. San Diego: CA.
Fay, E., & Quaiser-Pohl, C. (1999). Schnitte-Ein Test zur Erfassung des räumlichen Vorstellungsvermögens. Frankfut, Germany: Swets Test Services.
Fiedler, F. E. (1955). The influence of leader-keyman relations on combat crew effectiveness. The Journal of Abnormal and Social Psychology, 51, 227.
Fiedler, F. E., & Meuwese, W. A. T. (1963). Leader's contribution to task performance in cohesive and uncohesive groups. The Journal of Abnormal and Social Psychology, 67, 83.
Fiedler, F. E., Dodge, J. S., Jones, R. E., & Hutchins, E. B. (1958). Interrelations among measures of personality adjustment in nonclinical populations. The Journal of Abnormal and Social Psychology, 56, 345.Fletcher, G. J., Danilovics, P., Fernandez, G., Peterson, D., & Reeder, G. D. (1986). Attributional complexity: An individual differences measure. Journal of Personality and Social Psychology, 51, 875-884.
Flood, R. L., & Jackson, M. C. (1991). Creative problem solving: Total systems intervention. Chichester, UK: Wiley.
63
Forrester, J. W. (1961). Industrial dynamics. Cambridge, MA: MIT Press.
French, J., Ekstrom, R., & Price, L. (1963). Kit of reference tests for cognitive factors. Princeton, NJ: Educational Testing Service.
Fresco, D. M., Rytwinski, N. K., & Craighead, L. W. (2007). Explanatory flexibility and negative life events interact to predict depression symptoms. Journal of Social and Clinical Psychology, 26, 595-608.
Gittler, G. (1990). Dreidimensionaler Würfeltest (3DW). Ein Rasch-skalierter Test zur Messung des räumlichen Vorstellungsvermögens (Test folder incl. manual, test booklet and answer sheet). Weinheim: Beltz Test GmbH.
Gittler, G. (2004). Adaptive Spatial Ability Test: Test Label AD3W Version 23.00: Manual. Modling, Sweden: Schuhfried.
Glück, J., & Fabrizii, C. (2010). Gender differences in the mental rotations test are partly explained by response format. Journal of Individual Differences, 31, 106.
Golden, C. J. (1975). A group version of the Stroop Color and Word Test. Journal of Personality Assessment, 39, 386-388.
Grant, D. A., & Berg, E. (1948). A behavioral analysis of degree of reinforcement and ease of shifting to new responses in a Weigl-type card-sorting problem. Journal of Experimental Psychology, 38, 404-411.
Guilford, J. P. (1967). The nature of human intelligence. New York: McGraw-Hill.
Hageseth, J. A. (1983). Relationships among cognitive complexity variables. Psychological Reports, 52, 473-474.
Hambrick, D. Z., & Engle, R. W. (2003). The role of working memory in problem solving. In J. E. Davidson and R. J. Sternberg (Eds.), The psychology of problem solving (pp. 176-206). Cambridge, UK: Cambridge University Press.
Hanlon, F. M., Weisend, M. P., Yeo, R. A., Huang, M., Lee, R. R., Thomas, R. J., & Cañive, J. M. (2005). A specific test of hippocampal deficit in schizophrenia. Behavioral Neuroscience, 119, 863-875.
Heaton, R. K. (1981). The Wisconsin Card Sorting Test manual. Odessa, TX: Psychological Assessment Resources Inc.
Heaton, R. K. (1993). Wisconsin Card Sorting Test: Computer version 2. Odessa, TX: Psychological Assessment Resources.
Hegarty, M., & Kozhevnikov, M. (1999). Types of visual-spatial representations and mathematical problem solving. Journal of Educational Psychology, 91, 684-689.
Jackson, M. C., & Keyes, P. (1984). Toward a system of systems methodologies. Journal of Operations Research Society, 35, 473-486.
Jensen, A. R., & Rohwer, W. D. (1966). The Stroop color-word test: A review. Acta Psychologica,25, 36-93.

64
Johnco, C., Wuthrich, V. M., & Rapee, R. M. (2013). The role of cognitive flexibility in cognitive restructuring skill acquisition among older adults. Journal of Anxiety Disorders, 27, 576-584.
Johnco, C., Wuthrich, V. M., & Rapee, R. M. (2014). The influence of cognitive flexibility on treatment outcome and cognitive restructuring skill acquisition during cognitive behavioural treatment for anxiety and depression in older adults: Results of a pilot study. Behaviour Research and Therapy, 57, 55-64.
Kane, M. J., Conway, A. R., Miura, T. K., & Colflesh, G. J. (2007). Working memory, attention control, and the N-back task: a question of construct validity. Journal of Experimental Psychology: Learning, Memory, and Cognition, 33, 615-622.
Kane, M. J., Hambrick, D. Z., Tuholski, S. W., Wilhelm, O., Payne, T. W., & Engle, R. W. (2004). The generality of working memory capacity: a latent-variable approach to verbal and visuospatial memory span and reasoning. Journal of Experimental Psychology: General, 133, 189-217.
Kelly, E. L. (1955). Consistency of the adult personality. American Psychologist, 10, 659-681.
Kirk, M. K. (1978). The standardization of the ASMT, Form AE: Technical report. Unpublished manuscript.
Kotovsky, K., & Simon, H. A. (1973b). Empirical tests of a theory of human acquisition of concepts for sequential patterns. Cognitive Psychology, 4, 399-424.
Likert, R., & Quasha, W. (1995). Revised Minnesota paper form board test manual (2nd ed.). San Antonio, TX: The Psychological Corporation.
Lohman, D. F. (2005). The role of nonverbal ability tests in identifying academically gifted students: An aptitude perspective. Gifted Child Quarterly, 49, 111-138.Marks, D. F. (1973). Visual imagery differences in the recall of pictures. British journal of Psychology, 64, 17-24.
Marks, D. F. (1995). New directions for mental imagery research. Journal of Mental Imagery, 19, 153-167.
Martin, M. M., & Rubin, R. B. (1995). A new measure of cognitive flexibility. Psychological reports, 76, 623-626.
Mason, R. O., & Mitroff, I. I. (1981). Challenging strategic planning assumptions. Wiley: Chichester.
Mayr, U., & Kliegl, R. (1993). Sequential and coordinative complexity: Age-based processing limitations in figural transformations. Journal of Experimental Psychology: Learning, Memory and Cognition, 19, 1297-1320.
Meadows, D. H. (2008). Thinking in systems. White River Junction, VT: Chelsea Green Publishing.
Menasco, M. B., & Curry, D. J. (1978). An assessment of the role construct repertory test. Applied Psychological Measurement, 2, 361-369.
65
Midgley, G. (1997). Mixing methods: Developing systemic interventions. In J. Mingers and A. Gill (Eds.), Multimethodology: The theory and practice of combining management science methodologies. Chichester, UK: Wiley.
Midgley, G. (2003). Systems thinking (Vol 1-4). Thousand Oaks, CA: Sage Publications.
Miller, J. G. (1978). Living systems. New York: McGraw-Hill.
Mingers, J. C. (2006). Realizing systems thinking: Knowledge and action in management sciences. New York: Springer.
Mitchell, T. R., Biglan, A., Oncken, G. R., & Fiedler, F. E. (1970). The contingency model: Criticism and suggestions. Academy of Management Journal, 13, 253-267.
Miyake, A., Friedman, N. P., Emerson, M. J., Witzki, A. H., Howerter, A., & Wager, T. D. (2000). The unity and diversity of executive functions and their contributions to complex “frontal lobe” tasks: a latent variable analysis. Cognitive Psychology, 41, 49–100.
Monsell, S. (2003). Task switching. Trends in Cognitive Science, 7(3), 134-140.
Morris, N., & Jones, D. M. (1990). Memory updating in working memory: The role of the central executive. British Journal of Psychology, 81, 111-121.
Morrison, R. G., & Wallace, B. (2001). Imagery vividness, creativity, and the visual arts. Journal of Mental Imagery, 25, 135-152.
Naglieri, J. A., & Insko, W. R. (1986). Construct validity of the Matrix Analogies Test-Expanded Form. Journal of Psychoeducational Assessment, 4, 243-255.
Newcombe, N. S., & Shipley, T. F. (2015). Thinking about spatial thinking: New typology, new assessments. In J. S. Gero (Ed.), Studying visual and spatial reasoning for design creativity. New York, NY: Springer.
O'Keefe, D. J., & Sypher, H. E. (1981). Cognitive complexity measures and the relationship of cognitive complexity to communication. Human Communication Research, 8, 72-92.
Oberauer, K. (1993). The coordination of cognitiveoperations – A study on the relation between intelligence and working memory. Zeitschrift fúr Psychologie, 201, 57-84.
Oberauer, K., Süß, H. M., Schulze, R., Wilhelm, O., & Wittmann, W. W. (2000). Working memory capacity—facets of a cognitive ability construct. Personality and Individual Differences, 29, 1017-1045.
Peters, M., Laeng, B., Latham, K., Jackson, M., Zaiyouna, R., & Richardson, C. (1995). A redrawn Vandenberg and Kuse mental rotations test-different versions and factors that affect performance. Brain and cognition, 28, 39-58.
Peterson, C., Semmel, A., Von Baeyer, C., Abramson, L. Y., Metalsky, G. I., & Seligman, M. E. (1982). The attributional style questionnaire. Cognitive Therapy and Research, 6, 287-299.
Petty, R. E., Cacioppo, J. T., & Kao, C. F. (1984). The efficient assessment of need for cognition. Journal of Personality Assessment, 48, 306-307.
66
Pretz, J. E., Naples, A. J., & Sternberg, R. J. (2003). Recognizing, defining, and representing problems. In J. E. Davidson and R. J. Sternberg (Eds.), The Psychology of Problem Solving (pp. 3-30). Cambridge, UK: Cambridge University Press.
Pylyshyn, Z. W., & Storm, R. W. (1988). Tracking multiple independent targets: Evidence for a parallel tracking mechanism. Spatial Vision, 3, 179-197.
Quaiser-Pohl, C. (2003). The mental cutting test" Schnitte" and the picture rotation test-two new measures to assess spatial ability. International Journal of Testing, 3, 219-231.
Reilly, D. H., & Sugerman, A. A. (1967). Conceptual complexity and psychological differentiation in alcoholics. The Journal of Nervous and Mental Disease, 144, 14-17.
Reitan, R. M., & Wolfson, D. (1993). The Halstead-Reitan Neuropsychological Battery. Tuscan, AZ:.Theory and clinical interpretation Neuropsychology Press.
Robertson, I. H., Manly, T., Andrade, J., Baddeley, B. T., & Yiend, J. (1997). Oops!': performance correlates of everyday attentional failures in traumatic brain injured and normal subjects. Neuropsychologia, 35, 747-758.
Ross, S. A., Allen, D. N., & Goldstein, G. (2013). Factor structure of the Halstead-Reitan Neuropsychological Battery: A review and integration. Applied Neuropsychology: Adult, 20, 120-135.
Rubenstein-Montano, B., Liebowitz, J., Buchwalter, J., McCaw, D., Newman, B., Rebeck, K., & Team, T. K. M. M. (2001). A system thinking framework for knowledge management. Decision Support Systems, 31, 5-16.
Sá, W. C., Kelley, C. N., Ho, C., & Stanovich, K. E. (2005). Thinking about personal theories: Individual differences in the coordination of theory and evidence. Personality and Individual Differences, 38, 1149-1161.
Salthouse, T. A., & Mitchell, D. R. D. (1989). Structural and operational capacities in integrative spatial ability. Psychology and Aging, 4, 18-25.
Salthouse, T. A., Babcock, R. L., & Shaw, R. J. (1991). Effects of adult age on structural and operational capacities in working memory. Psychology and Aging, 6, 118-127.
Santacreu, J. (1999). CTT, cross-trajectories test. Technical Report. Madrid, Spain: Universidad Autónoma de Madrid.
Schmiedek, F., Hildebrandt, A., Lövdén, M., Wilhelm, O., & Lindenberger, U. (2009). Complex span versus updating tasks of working memory: the gap is not that deep. Journal of Experimental Psychology: Learning, Memory, and Cognition, 35, 1089.
Schneier, C. E. (1979). Measuring cognitive complexity: Developing reliability, validity, and norm tables for a personality instrument. Educational and Psychological Measurement, 39, 599-612.
Schroder, H. M., & Streufert, S. (1962). The measurement of four systems of personality structure varying in level of abstractness. (Sentence completion method). Princeton University, NJ.
Schroder, H. M., Driver, M. J., & Streufert, S. (1967). Human information processing. New York: Holt, Rinehart & Winston.
67
Scott, W. A. (1962). Cognitive complexity and cognitive flexibility. Sociometry, 25, 405-414.
Senge, P. M. (1990). The fifth discipline: The art and practice of the learning organization. London: Random House.
Shamosh, N. A., DeYoung, C. G., Green, A. E., Reis, D. L., Johnson, M. R., Conway, A. R., & Gray, J. R. (2008). Individual differences in delay discounting relation to intelligence, working memory, and anterior prefrontal cortex. Psychological Science, 19, 904-911.
Shepard, R. N., & Metzler, J. (1971). Mental rotation of three-dimensional objects. Science, 171, 701-703.
Simon, H. A., & Kotovsky, K. (1963). Human acquisition of concepts for sequential patterns. Psychological Review, 70, 534-546.
Standard General Reasoning International Test (n.d.). Retrieved 06/05/2017 from http://www.hfi.com/wp-content/uploads/2015/10/HFI-PsychometricTest-Catalogue.pdf
Stanovich, K. E., & West, R. F. (1998). Individual differences in rational thought. Thinking and Reasoning, 4, 289-317.
Stanovich, K. E., & West, R. F. (2007). Natural myside bias is independent of cognitive ability. Thinking & Reasoning, 13, 225-247.
Sternberg, R. J. (2006). The nature of creativity. Creativity Research Journal, 18, 87-98.
Sternberg, R. J. (2012). The assessment of creativity: An investment-based approach. Creativity Research Journal, 24, 3-12.
Streufert, S., & Driver, M. J. (1967). Impression formation as a measure of the complexity of conceptual structure. Educational and Psychological Measurement. 27, 1025-1039.
Streufert, S., & Schroder, H. M. (1963). The measurement of four systems of personality structure varying in level of abstractness: Impression formation method. Princeton University: ONR Technical Report.
Streufert, S., & Streufert, S. C. (1978). Behavior in the complex environment. Oxford, England: VH Winston & Sons.
Streufert, S., & Sweezey, R. W. (Eds.). (1986). Complexity, managers, and organizations. Orlando, FL: Academic.
Stroop, J. R. (1935). Studies of interference in serial verbal reactions. Journal of Experimental Psychology, 18, 643-662.
Teasdale, J. D., Scott, J., Moore, R. G., Hayhurst, H., Pope, M., & Paykel, E. S. (2001). How does cognitive therapy prevent relapse in residual depression? Evidence from a controlled trial. Journal of Consulting and Clinical Psychology, 69, 347.
The Morrisby Organization. (n.d.). Retrieved 05/26/2017 from https://www.morrisby.com
Tuckman, B. W. (1966). Integrative complexity: Its measurement and relation to creativity. Educational and Psychological Measurement. 26. 369-382.
68
Ullsperger, M., & Von Cramon, D. Y. (2003). Error monitoring using external feedback: specific roles of the habenular complex, the reward system, and the cingulate motor area revealed by functional magnetic resonance imaging. Journal of Neuroscience, 23(10), 4308-4314.
Uttal, D. H., Meadow, N. G., Tipton, E., Hand, L. L., Alden, A. R., Warren, C., & Newcombe, N. S. (2013). The malleability of spatial skills: A meta-analysis of training studies. Psychological Bulletin, 139, 352-402.
Vandenberg, S. G., & Kuse, A. R. (1978). Mental rotations, a group test of three-dimensional spatial visualization. Perceptual and Motor Skills, 47, 599-604.
Vannoy, J. S. (1965). Generality of cognitive complexity-simplicity as a personality construct. Journal of Personality and Social Psychology, 2, 385-396.
Von Bertalanffy, L. (1968). General systems theory: Foundations, development, applications. New York: George Braziller.
Wai, J., Lubinski, D., & Benbow, C. P. (2009). Spatial ability for STEM domains: Aligning over fifty years of cumulative psychological knowledge solidifies its importance. Journal of Educational Psychology, 101, 817-835.
Wechsler, D. (1999). Wechsler abbreviated scale of intelligence. New York: Psychological Corporation.
Wesnes, K., Warburton, D. M., & Matz, B. (1983). Effects of nicotine on stimulus sensitivity and response bias in a visual vigilance task. Neuropsychobiology, 9(1), 41-44.
West, R. F., Toplak, M. E., & Stanovich, K. E. (2008). Heuristics and biases as measures of critical thinking: Associations with cognitive ability and thinking dispositions. Journal of Educational Psychology, 100(4), 930-941.
Wilhelm, O., Hildebrandt, A. H., & Oberauer, K. (2013). What is working memory capacity, and how can we measure it? Frontiers in psychology, 4, 1-22.
Wilson, J. R., De Fries, J. C., Mc Clearn, G. E., Vandenberg, S. G., Johnson, R. C., & Rashad, M. N. (1975). Cognitive abilities: Use of family data as a control to assess sex and age differences in two ethnic groups. The International Journal of Aging and Human Development, 6, 261-276.
Zimmermann, P., & Finn, B. (1993). Testbatterie zur AufmerksamkeitspruÈ fung (TAP), Version 1.02. Handbuch [Test battery for attention (TAP). Version 1.02. Handbook]. WuÈ rselen, Vera Fimm/Psychologische Testsysteme.
69
Glossary of Terms
Cognitive Complexity: as the ability to differentiate sets into distinct elements and/or integrate or make connections between those elements.
Cognitive Flexibility: 1) an individual’s ability and willingness to entertain incongruous or conflicting pieces of information. 2) an individual’s ability to alternate between a micro-level perspective and a macro-level perspective in order to complete a task.
Hierarchical Working Memory Capacity: the degree to which information from multiple positions and levels can be held successfully in short-term memory storage while executive attention is divided between remembering items and other cognitive processes.
Pattern Recognition: the ability to find repetitions or deviations in sequences of objects or data, or in the rules governing their sequence.
Spatial Abilities: the set of cognitive abilities that allows an individual to process visual stimuli among distractors, understand a visual scene, and accurately encode and mentally manipulate visual objects or spatial relationships.
Systems Thinking Ability (STA): a constellation of closely related abilities that, when combined with knowledge and systems thinking skills, enable individuals to (a) identify the elements of a system, (b) understand system relationships, (c) evaluate and revise system models, and (d) apply an integrated understanding of the system to a problem.
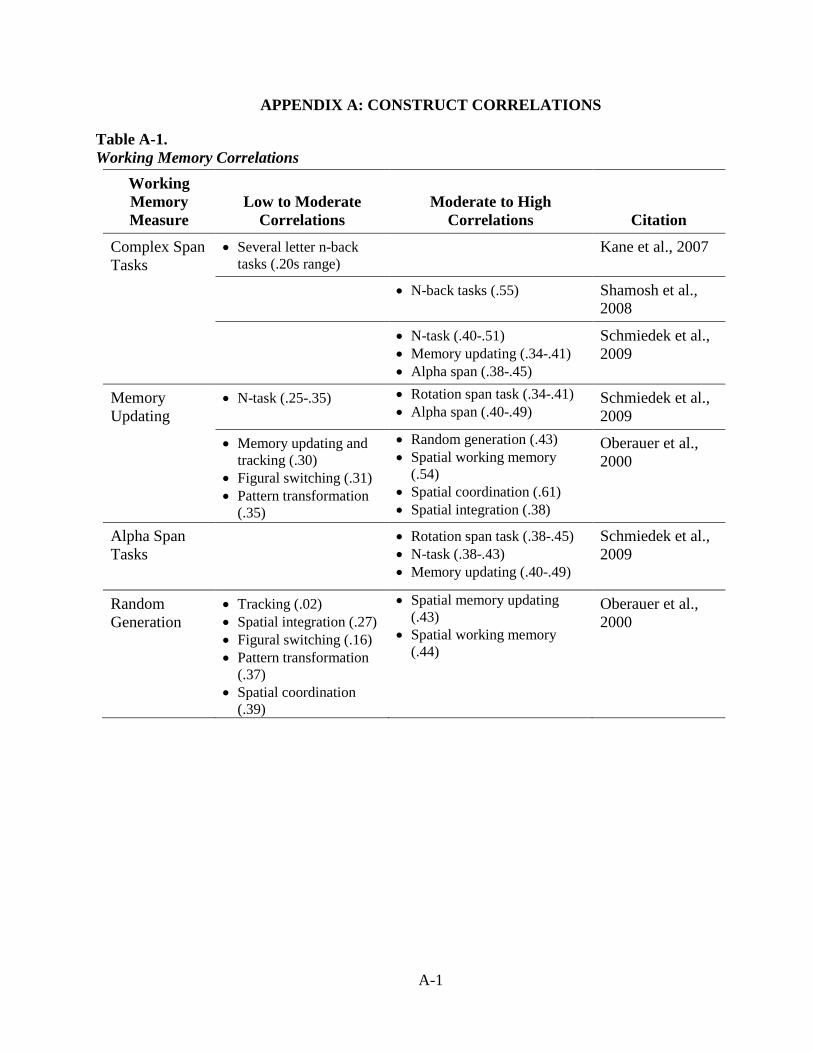
A A-1
A APPENDIX A: CONSTRUCT CORRELATIONS
Table A-1. Working Memory Correlations
Working Memory Measure
Low to Moderate Correlations
Moderate to High Correlations Citation
Complex Span Tasks
• Several letter n-back tasks (.20s range)
Kane et al., 2007
• N-back tasks (.55) Shamosh et al., 2008
• N-task (.40-.51) • Memory updating (.34-.41) • Alpha span (.38-.45)
Schmiedek et al., 2009
Memory Updating
• N-task (.25-.35) • Rotation span task (.34-.41) • Alpha span (.40-.49)
Schmiedek et al., 2009
• Memory updating and tracking (.30)
• Figural switching (.31) • Pattern transformation
(.35)
• Random generation (.43) • Spatial working memory
(.54) • Spatial coordination (.61) • Spatial integration (.38)
Oberauer et al., 2000
Alpha Span Tasks
• Rotation span task (.38-.45) • N-task (.38-.43) • Memory updating (.40-.49)
Schmiedek et al., 2009
Random Generation
• Tracking (.02) • Spatial integration (.27) • Figural switching (.16) • Pattern transformation
(.37) • Spatial coordination
(.39)
• Spatial memory updating (.43)
• Spatial working memory (.44)
Oberauer et al., 2000
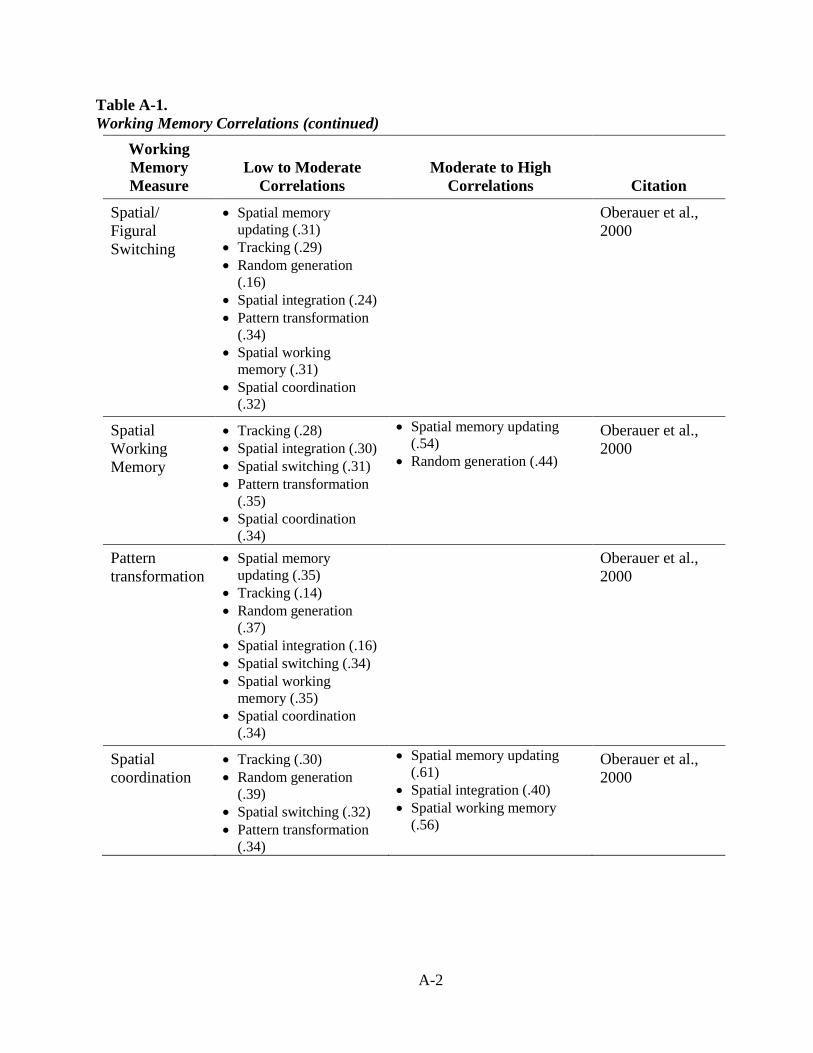
A A-2
Table A-1. Working Memory Correlations (continued)
Working Memory Measure
Low to Moderate Correlations
Moderate to High Correlations Citation
Spatial/ Figural Switching
• Spatial memory updating (.31)
• Tracking (.29) • Random generation
(.16) • Spatial integration (.24) • Pattern transformation
(.34) • Spatial working
memory (.31) • Spatial coordination
(.32)
Oberauer et al., 2000
Spatial Working Memory
• Tracking (.28) • Spatial integration (.30) • Spatial switching (.31) • Pattern transformation
(.35) • Spatial coordination
(.34)
• Spatial memory updating (.54)
• Random generation (.44)
Oberauer et al., 2000
Pattern transformation
• Spatial memory updating (.35)
• Tracking (.14) • Random generation
(.37) • Spatial integration (.16) • Spatial switching (.34) • Spatial working
memory (.35) • Spatial coordination
(.34)
Oberauer et al., 2000
Spatial coordination
• Tracking (.30) • Random generation
(.39) • Spatial switching (.32) • Pattern transformation
(.34)
• Spatial memory updating (.61)
• Spatial integration (.40) • Spatial working memory
(.56)
Oberauer et al., 2000
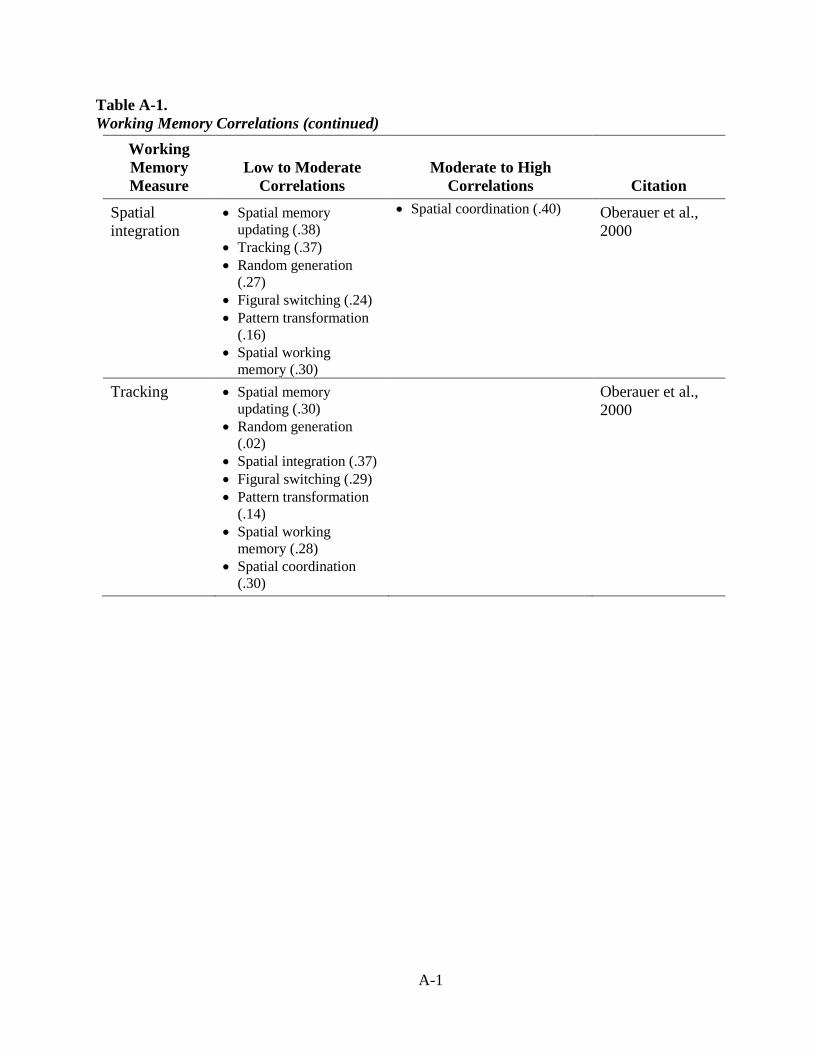
A A-1
Table A-1. Working Memory Correlations (continued)
Working Memory Measure
Low to Moderate Correlations
Moderate to High Correlations Citation
Spatial integration
• Spatial memory updating (.38)
• Tracking (.37) • Random generation
(.27) • Figural switching (.24) • Pattern transformation
(.16) • Spatial working
memory (.30)
• Spatial coordination (.40) Oberauer et al., 2000
Tracking
• Spatial memory updating (.30)
• Random generation (.02)
• Spatial integration (.37) • Figural switching (.29) • Pattern transformation
(.14) • Spatial working
memory (.28) • Spatial coordination
(.30)
Oberauer et al., 2000
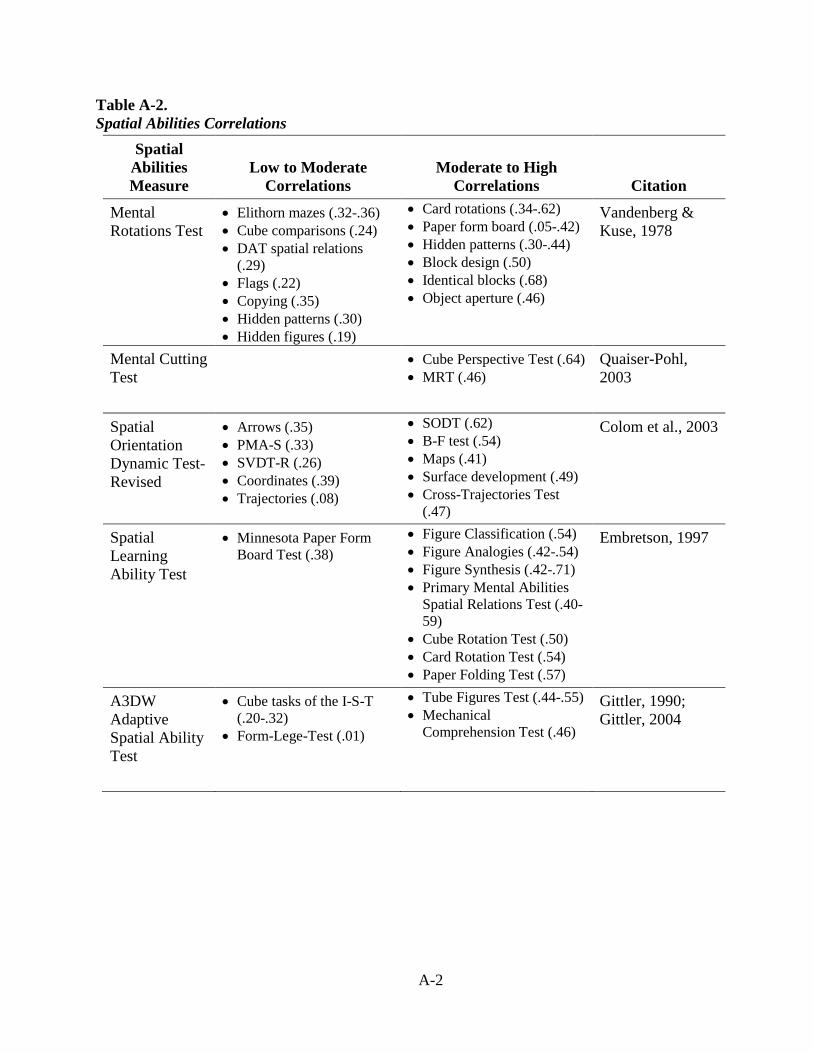
A A-2
Table A-2. Spatial Abilities Correlations
Spatial Abilities Measure
Low to Moderate Correlations
Moderate to High Correlations Citation
Mental Rotations Test
• Elithorn mazes (.32-.36) • Cube comparisons (.24) • DAT spatial relations
(.29) • Flags (.22) • Copying (.35) • Hidden patterns (.30) • Hidden figures (.19)
• Card rotations (.34-.62) • Paper form board (.05-.42) • Hidden patterns (.30-.44) • Block design (.50) • Identical blocks (.68) • Object aperture (.46)
Vandenberg & Kuse, 1978
Mental Cutting Test
• Cube Perspective Test (.64) • MRT (.46)
Quaiser-Pohl, 2003
Spatial Orientation Dynamic Test-Revised
• Arrows (.35) • PMA-S (.33) • SVDT-R (.26) • Coordinates (.39) • Trajectories (.08)
• SODT (.62) • B-F test (.54) • Maps (.41) • Surface development (.49) • Cross-Trajectories Test
(.47)
Colom et al., 2003
Spatial Learning Ability Test
• Minnesota Paper Form Board Test (.38)
• Figure Classification (.54) • Figure Analogies (.42-.54) • Figure Synthesis (.42-.71) • Primary Mental Abilities
Spatial Relations Test (.40-59)
• Cube Rotation Test (.50) • Card Rotation Test (.54) • Paper Folding Test (.57)
Embretson, 1997
A3DW Adaptive Spatial Ability Test
• Cube tasks of the I-S-T (.20-.32)
• Form-Lege-Test (.01)
• Tube Figures Test (.44-.55) • Mechanical
Comprehension Test (.46)
Gittler, 1990; Gittler, 2004
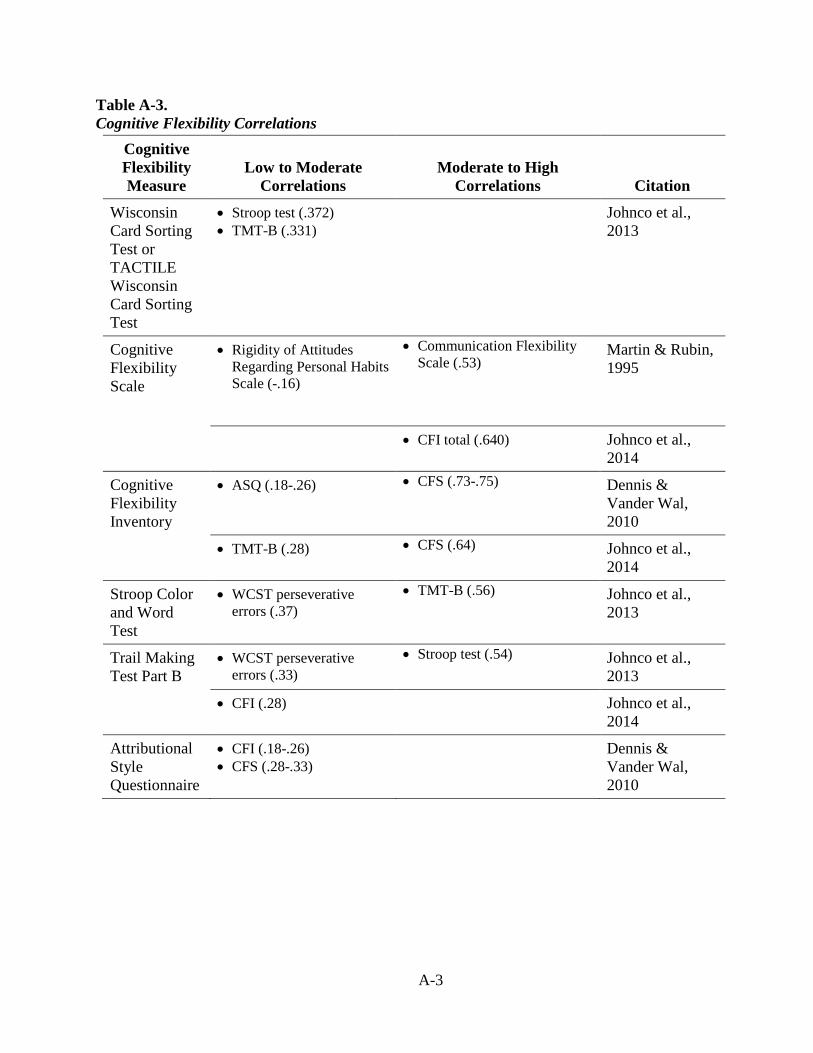
A A-3
Table A-3. Cognitive Flexibility Correlations
Cognitive Flexibility Measure
Low to Moderate Correlations
Moderate to High Correlations Citation
Wisconsin Card Sorting Test or TACTILE Wisconsin Card Sorting Test
• Stroop test (.372) • TMT-B (.331)
Johnco et al., 2013
Cognitive Flexibility Scale
• Rigidity of Attitudes Regarding Personal Habits Scale (-.16)
• Communication Flexibility Scale (.53)
Martin & Rubin, 1995
• CFI total (.640) Johnco et al., 2014
Cognitive Flexibility Inventory
• ASQ (.18-.26) • CFS (.73-.75) Dennis & Vander Wal, 2010
• TMT-B (.28) • CFS (.64) Johnco et al., 2014
Stroop Color and Word Test
• WCST perseverative errors (.37)
• TMT-B (.56) Johnco et al., 2013
Trail Making Test Part B
• WCST perseverative errors (.33)
• Stroop test (.54) Johnco et al., 2013
• CFI (.28) Johnco et al., 2014
Attributional Style Questionnaire
• CFI (.18-.26) • CFS (.28-.33)
Dennis & Vander Wal, 2010
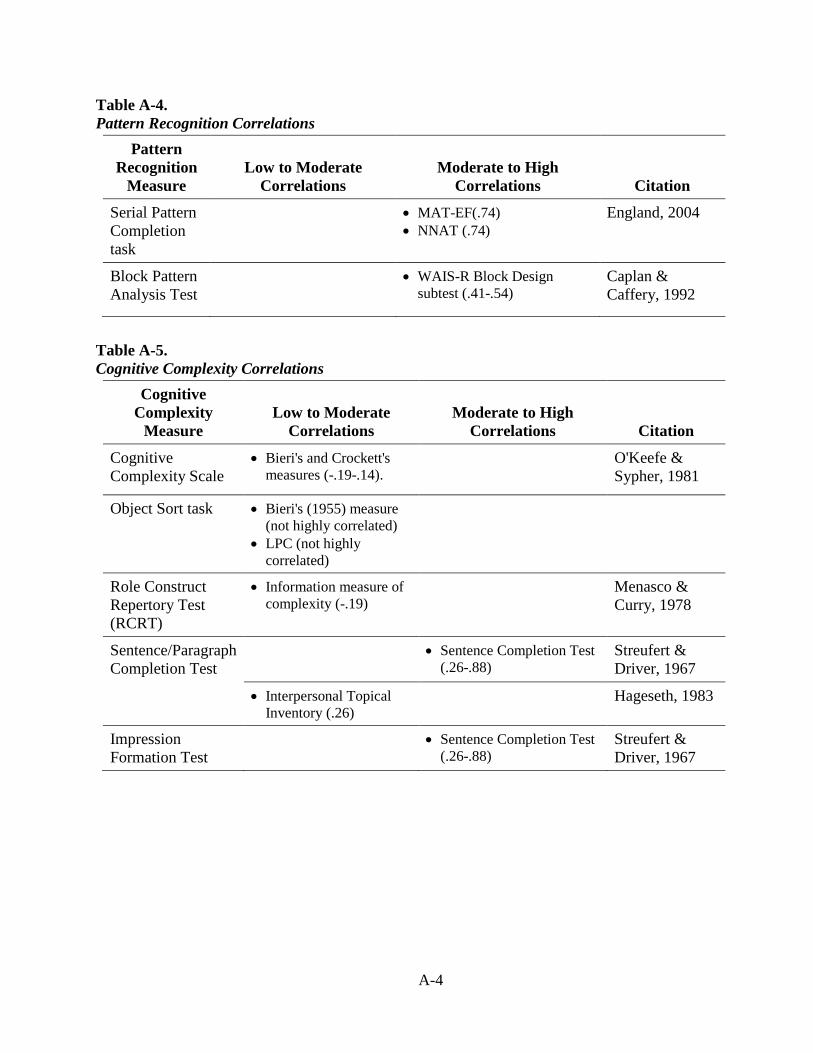
A A-4
Table A-4. Pattern Recognition Correlations
Pattern Recognition
Measure Low to Moderate
Correlations Moderate to High
Correlations Citation
Serial Pattern Completion task
• MAT-EF(.74) • NNAT (.74)
England, 2004
Block Pattern Analysis Test
• WAIS-R Block Design subtest (.41-.54)
Caplan & Caffery, 1992
Table A-5. Cognitive Complexity Correlations
Cognitive Complexity
Measure Low to Moderate
Correlations Moderate to High
Correlations Citation
Cognitive Complexity Scale
• Bieri's and Crockett's measures (-.19-.14).
O'Keefe & Sypher, 1981
Object Sort task • Bieri's (1955) measure (not highly correlated)
• LPC (not highly correlated)
Role Construct Repertory Test (RCRT)
• Information measure of complexity (-.19)
Menasco & Curry, 1978
Sentence/Paragraph Completion Test
• Sentence Completion Test (.26-.88)
Streufert & Driver, 1967
• Interpersonal Topical Inventory (.26)
Hageseth, 1983
Impression Formation Test
• Sentence Completion Test (.26-.88)
Streufert & Driver, 1967