Embed Size (px)
Citation preview

1
Innovative Thinking in Investor Relations & Corporate Governance
March 18, 2016 Project for Capacity Building of Capital Market in Mongolia:
IPO & Dual Listing Seminar (2)
Tatsuya Imade Investor Relations and Corporate Governance Specialist
Tokyo, Japan
The process of translating an idea or invention into a good or service that creates value or for which customers will pay.
To be called an innovation, an idea must be replicable at an economical cost and must satisfy a specific need.
Innovation involves deliberate application of information, imagination and initiative in deriving greater or different values from resources, and includes all processes by which new ideas are generated and converted into useful products.
2
Source: http://www.businessdictionary.com/definition/innovation.html
Obsession
Perseverance
Focus, Discipline and
Patience
http://www.entrepreneur.com/article/238545
Where does it come from?
It comes from
Need to prove yourself
Your subconscious
Identifying problems Inside of
you
Dream Ambition
What is Innovation?

2
3
Source: East Spring Investmentts
If the market is efficient, it may valuate you fairly. If the market is inefficient, you may be undervalued or overvalued. If you are undervalued against your actual heavyweight of the value, You have a huge upside potential.
Market Valuates You…
What Happened in Japan?

3
• Foreign institutional investors are the strongest buyers of Japanese stocks. • Japanese Institutional investors finally woke up by “Abenomics”.
Source : Tokyo Stock Exchange
6,000
8,000
10,000
12,000
14,000
16,000
18,000
20,000
22,000
▲ 3,000,000
▲ 2,000,000
▲ 1,000,000
0
1,000,000
2,000,000
3,000,000
Nikkei
Ave
Amount
In ¥mil
自己取引 個人 海外投資家 証券会社 投資信託 事業法人・その他の法人等 生保・損保 都銀・地銀等
Net ¥ Purchased
Net ¥ Sold
Foreign Investors
Japanese Institutions
Lehman Shock!
Retail (Individual)
Deflation/Deficit/Demography/
Disaster/ Demonstration
5D Factors
China Shock!
Abe nomics
Japanese Stock Market Has Suffered for Long Time with 5D Factors
5
(Local)
Goverment
Banks
Trust banks (trust account)
Insurance
Oher financials
Brokers
Corporates
Foreign Investors
Individuals and others
%
5%
10%
15%
20%
25%
30%
35%
1. Foreign investors now own more than 30% of Corporate Japan. 2. “Trust account” represents domestic institutions’ fiduciary based holdings. 3. Ownership and influence of Institutional Portfolio Investors has increased significantly.
Source : Tokyo Stock Exchange
Long-Term Historical Trend of Share Ownership
6

4
• Majority of TOPIX is Companies are owned by Professional Institutional Investors. • Many Companies listed in Other markets still have old style ownership structure.
Source : Tokyo Stock Exchange
Govt. & Local Govt.
0.17%
Commercial Banks 3.68%
Trust Banks 18.50%
Life Insurance
Companies 3.74%
Non-life Insurance
Companies 1.42%
Other Financial
Institutions 0.68%
Securities Companies
2.22% Business
Corporations 20.79%
Foreign Investors 32.37%
Individuals and Other Investors 16.43%
Govt. & Local Govt.
0.02%
Commercial Banks 2.90%
Trust Banks 4.09%
Life Insurance
Companies 1.05%
Non-life Insurance
Companies 0.68% Other
Financial Institutions
0.63%
Securities Companies
1.86%
Business Corporations
34.84%
Foreign Investors 11.67%
Individuals and Other Investors 42.27%
TOPIX Other Markets
(Approx. 1800 companies listed on the 1st section of Tokyo Stock Exchange)
Ownership Structure of Japan, Inc: Two Types of Market
7
Source : Japan FSA presentation on Japan Revitalization Strategy
Positioning Japan as “Undervalued Heavy Weight”
By promoting Corporate Sector productivity & Growth with 2 Codes.
Japan Revitalization Strategy
8

5
Investor Relations (“IR”) & Corporate Governance (“CG”)
Winning TRUST with
Transparency and Accountability
Establish your BRAND
In Capital Markets
TRUST & BRAND will have investors to pay premium
and hold your stock longer
Corporate governance involves a set of relationships between a company’s management, its board, its shareholders and other stakeholders. Corporate governance also provides the structure through which the objectives of the company are set, and the means of attaining those objectives and monitoring performance are determined.’ (OECD Corporate Governance Principles, 2004)
9
10
Good Disclosure
Risk Management
Financial
Soundness
Business Model
Growth Story
BRAND In
Capital Market
Environmental & Social
Value
Corporate
Governance
Shareholder Value
Capital Efficiency
Branding your Country, Market, and Yourself
Integrated Process for Sustainable Value Creation
Elements of IR Communication

6
11
IPO is NOT a GOAL, it’s a STARTING POINT
IPO Building Long-term Relationship through Transparency and Accountability based on good Corporate Governance as a foundation of Sustainable Growth
Stewardship “Win – Win”
Relations
Marketing Your Corporate Story
Investors
Long-term Shareholders
With Monitoring
Eyes
IPO, IR & Corporate Governance
12 Source SHISEIDO
Communicating Vision & Strategy: Shiseido’s IR

7
13 Source OMRON
Voluntary Statutory
OMRON Chooses
Hybrid Structure utilizing the Japanese traditional
model for its pursuit of the
best governance
CG Structure in Japan: Case of OMRON
14 Source MUFG
Voluntary
Statutory
U.S.- Style 3 Committee Structure to ensure credible decision-
making and monitoring in
Nomination Compensation
Auditing
CG Structure in Japan: Case of MUFG

8
15
Passive Investments Active Investments
INDEX ETF
Enhanced Index
Quantitative
Quants Value
Value
GARP
Growth
Hedge Funds
Regional
Global Frontier Thematic
Country Dedicated
Traditional Active
Alternative
Professional Investors’ Universe & Investment Styles
Yeah, MSE performed very well few years ago.
However, there were some political actions that are unfriendly to investors,
right?
Oh! Really? Mongolia has an
active stock market?!
The market is too small for me to
consider investing
We cannot invest in illiquid market or stocks. Do they have
anything else other than coal and few other
natural resources?
The economic fundamentals are not
strong due to too much dependence on China import of its coal and
commodity prices.
Liquidity, Liquidity, And Corporate Governance are what they need.
Global Investors’ Perception on Mongolian Stock Market
16

9
Ticker Name Weight (%) Market Value Sector Exchange Country
1 NBK NATIONAL BANK OF KUWAIT S.A.K. 7.0917 $29,639,295 Financials Kuwait Stock Exchange Kuwait
2 KFIN KUWAIT FINANCE HOUSE K.S.C. 4.5958 $19,207,725 Financials Kuwait Stock Exchange Kuwait
3 YPF YPF S.A. ADS 3.4839 $14,560,857 Energy New York Stock Exchange Inc. Argentina
4 ZAIN MOBILE TELECOMMUNICATIONS CO. (MTC 3.4472 $14,407,485 Telecommunication Services Kuwait Stock Exchange Kuwait
5 BMA BANCO MACRO ADR REPRESENTING TEN S 2.7912 $11,665,780 Financials New York Stock Exchange Inc. Argentina
6 GGAL GRUPO FINANCIERO GALICIA S.A. ADS 2.7676 $11,567,073 Financials NASDAQ Argentina
7 IAM MAROC TELECOM 2.6037 $10,881,993 Telecommunication Services Casablanca Stock Exchange Morocco
8 NB NIGERIAN BREWERIES 2.3969 $10,017,764 Consumer Staples Nigerian Stock Exchange Nigeria
9 SAFARC SAFARICOM LTD. 2.1458 $8,968,334 Telecommunication Services Nairobi Stock Exchange Kenya
10 OTEL OMAN TELEMMUNICATIONS 1.9671 $8,221,327 Telecommunication Services Muscat Securities Market Oman
11 TEO TELECOM ARGENTINA ADR REPRESENTING 1.8415 $7,696,495 Telecommunication Services New York Stock Exchange Inc. Argentina
12 ATW ATTIJARIWAFA BANK SA 1.8331 $7,661,158 Financials Casablanca Stock Exchange Morocco
13 GTB GUARANTY TRUST BANK PLC 1.8245 $7,625,342 Financials Nigerian Stock Exchange Nigeria
14 TLV BANCA TRANSILVAN SA 1.7338 $7,246,187 Financials Spot Regulated Market - Bvb Romania
15 KMG KAZMUNAIGAS EP JSC - GDR 1.6348 $6,832,564 Energy London Stock Exchange Kazakhstan
16 SQURPHARMA SQUARE PHARMACEUTICALS LTD 1.6221 $6,779,398 Health Care Dhaka Stock Exchange Ltd Bangladesh
17 ZENITH ZENITH BANK PLC 1.5323 $6,404,114 Financials Nigerian Stock Exchange Nigeria
18 EABL EAST AFR BREWERS LTD 1.5178 $6,343,379 Consumer Staples Nairobi Stock Exchange Kenya
19 VIC VINGROUP JOINT STOCK COMPANY 1.4948 $6,247,278 Financials Hochiminh Stock Exchange Vietnam
20 BKMB BANK MUSCAT 1.4436 $6,033,564 Financials Muscat Securities Market Oman
21 MABANEE MABANEE CO. S.A.K.C. 1.3872 $5,797,594 Financials Kuwait Stock Exchange Kuwait
22 HBL HABIB BANK LTD. 1.3824 $5,777,718 Financials Karachi Stock Exchange (Guarantee) Limited Pakistan
23 NESTLE NESTLE FOODS PLC 1.3579 $5,675,330 Consumer Staples Nigerian Stock Exchange Nigeria
24 MCB MCB BANK LTD. 1.2963 $5,417,926 Financials Karachi Stock Exchange (Guarantee) Limited Pakistan
25 PAM PAMPA ENERGIA S.A. ADS 1.285 $5,370,669 Utilities New York Stock Exchange Inc. Argentina
26 JKH.N0000 JOHN KEELLS HOLDING PLC 1.2215 $5,105,005 Industrials Colombo Stock Exchange Sri Lanka
27 KCBK KENYA COMER BANK LTD 1.1804 $4,933,279 Financials Nairobi Stock Exchange Kenya
28 MSN MASAN GROUP CORP 1.174 $4,906,487 Consumer Staples Hochiminh Stock Exchange Vietnam
29 EBL EQUITY BANK LTD. 1.1219 $4,688,931 Financials Nairobi Stock Exchange Kenya
30 LUCK LUCKY CEMENT LTD 1.1057 $4,621,287 Materials Karachi Stock Exchange (Guarantee) Limited Pakistan
Source https://www.ishares.com
Frontier Market Index Opportunities
iShares MSCI Frontier 100 Index fund: Top 30 holdings
17
Source https://investorfunds.us.hsbc.com/funds/f-7/hsbc-frontier-markets-fund/a/characteristics.fs
Opportunities in Frontier Market Funds (1)
HSBC Frontier Market Fund
18

10
Source http://guggenheiminvestments.com/products/etf/frn/holdings
Opportunities in Frontier Market Funds (2)
FRN Guggenheim Frontier Markets ETF
19
Market category scores (%)
Total CG Rules & Practices Enforcement Political &
Regulatory IGAAP CG Culture
1. = Hong Kong 65 61 71 69 72 51
1. = Singapore 64 63 56 64 85 54
3. Japan 60 48 62 61 72 55
4. = Thailand 58 62 51 48 80 50
4. = Malaysia 58 55 47 59 85 43
6. Taiwan 56 48 47 63 75 47
7. India 54 57 46 58 57 51
8. Korea 49 46 46 45 72 34
9. China 45 42 40 44 67 34
10. = Philippines 40 40 18 42 65 33
10. = Indonesia 39 34 24 44 62 32
Source: Asian Corporate Governance Association
Japan’s low score on CG Rules & Practice is not reflecting the CG code of 2015 but reflecting the lower rate of Independent Directors on Corporate boards.
Global Investors’ Perception on CG in 2014
20

11
21
Internal External Mongolia Japan Mongolia
Strength Opportunity
+
Big Land & attractive landscape
Vast Natural Resources History Talented people
Technology High Quality Products Economic position History & Unique culture Sophisticated Cuisine Water, Ocean, Landscape Four seasons Diversity of industries and
trade partners
Tourism Agriculture Information Technology? New Silk-road? Friendship with Japan
Weakness Threat
_ Small population/domestic market
Climate (too cold?) Dependence on Coal Insufficient infrastructure
Lack of Natural Resources
Low self-sufficiency in food
D factors Second Language ability
Geopolitical Risk Chinese economy Global environment Coal divestment
SWOT Analysis for Innovation
22
Source: UNPRI
Principle 1: We will incorporate ESG issues into investment analysis and decision-making processes.+ Principle 2: We will be active owners and incorporate ESG issues into our ownership policies and practices.+ Principle 3: We will seek appropriate disclosure on ESG issues by the entities in which we invest.+ Principle 4: We will promote acceptance and implementation of the Principles within the investment industry.+ Principle 5: We will work together to enhance our effectiveness in implementing the Principles.+ Principle 6: We will each report on our activities and progress towards implementing the Principles.+
E=Environmental
S=Social G=Governance
Sustainability
UNPRI=United Nations Principle for Responsible Investments
What is Responsible Investment & ESG?

12
23
Government
Customers
Shareholders
Your Company
Local Society
Environment
Business
Partners
Employees
Balance for Sustainability
Dealing with Multi-Stakeholders
24
Innovation involves deliberate application of information, imagination and initiative in deriving greater or different values from resources,
It is important to think about spill-over effects in any development projects.
Innovative Thinking for the Future Development

13
Mongolia and MSE can be “Undervalued Heavy Weight”
MSE needs broader investor base and liquidity.
Investor Relations and Corporate Governance may help
communicating values.
Diversification of industries and trade partners would be necessary.
Innovative thinking is indispensable.
Any development projects should be planned with “Spill-over Effects”.
IPO is not a GOAL, it’s a Starting point.
Dual Listing may help promoting foreign investments through index
for broader investor base.
Conclusions
25
Баярлалаа !! March 18, 2016
Project for Capacity Building of Capital Market in Mongolia: IPO & Dual Listing Seminar (2)
Tatsuya Imade Tokyo, Japan
26

1
Optimizing Capital Market through Innovations - Lessons from the Past & On-going Initiatives
in Foreign Markets -
March 18, 2016 Project for Capacity Building of Capital Market in Mongolia:
IPO & Dual Listing Seminar (2)
Seiji Adachi Kanda University of International Studies
Former Chief Strategist for Asian Business, Tokyo Stock Exchange
Introduction
Expected function for Capital Market
1. As an alternative funding source other than bank loan and another saving tool for the Public 2. As an important access for emerging countries to bring fresh fund into home market from all
over the World
To realize a reliable capital market, the past and on-going lessons abroad teach
us the following four essential points through the position of “Innovations”
I. Innovations in Broadening
Investor Base
I. Innovations in Broadening
Investor Base
II. Innovations in Privatization
II. Innovations in Privatization
III. Innovations in Market Planning
III. Innovations in Market Planning
IV. Innovations in Utilizing
Overseas Market
IV. Innovations in Utilizing
Overseas Market
2

2
I. Innovations in Broadening Investor Base (1)
3
Distributed this small “bank” to retail clients nationwide since 1953.
Then, collected certain amount of money in the BOX (US$10 equivalent) once a month to let them buy “equity investment trust”, which
Contributed to create a new concept, “equity investment- based saving” following traditional “bank deposit saving”
‘Million Yen Piggy Bank’
☞ A key tool in Japan during ‘60s (before taking-off for “rapid growth”)
Saving for securities investment
Creation of deeper and wider retail investor base brings a cornerstone of capital market in any countries
In Japan, October 4th every year is now spotlighted as “National Investment Day”
I. Innovations in Broadening Investor Base (2)
4
“NISA” Nippon (Japan) Individual Savings Account
☞ Japan’s new type savings scheme launched in January 2014
NISA, based on U.K.’s “Individual Saving account, ISA” with a simple TAX allowance for retail investors up to a 1.2 Million Yen per year
Around 2.6 million people bought financial products through the scheme, since its launch in Jan 2014 to the end of Nov 2015
In addition, same type named “Junior NISA” is to be available after April 2016 for minors (under 20 years of age)
Tax Exemption Scheme in other countries France : “Roi Monory” (1978) Tax deduction and allowance up to 5,000 Franc per year U.K. : “PEP” - Personal Equity Plan (1987) Expansively upgraded and reorganized into ISA (1999) Tax exemption on capital gain and interest, up to ₤15,000 per year
Tax Incentive Measures

3
II. Innovations in Privatization: History in UK
Timeline of Major Privatization in U.K.(after Thatcher’s Administration)
5
Year Names of Company Privatized Total Net Proceeds
1979 1981 1982 1983 1984 1985 1986 1987 1988 1989 1990 1991 1992 1993 1994 1995 1996 2001 2006 2013
British Petroleum (BP) British Aerospace (BAE), Cable & Wireless (C&W), BP Britoil, Amersham International Associated British Ports, BP, C&W British Telecom (BT) , Associated British Ports Bae, Britoil, C&W British Gas (BG) British Airways, British Airports Authority, BP, Rolls-Royce British Steel, Rover Group (British Leyland) Water Authorities Reginal Electricity Companies (REC, England and Wales) BT, National Power/Power Generation, REC (Scotland) Power Generation (NI) BT, REC (NI) British Coal, Train Operating Companies National Power/Power Gen AEA Technology, British Energy, Rail track National Air Traffic Services BNFL, QinetiQ Royal Mail
276 (₤ Million) 232 691 852 4,347 1,347 7,731 9,045 2,587 3,594 7,713 11,759 708 5,338 955 3,642 3,316 800 3,578 1,980 (Source: House of Commons)
“Renaissance” mind changed U.K. itself & the City
6
1. Massive scale nation-wide campaign on privatization 2. Cheaper pricing scheme, partial payment, for Pos 3. Incentives for new shareholders; either through “discount” vouchers or “bonus”
share after full payment
The offering was priced @£130/share with 3 partial
payments, 1) Nov 28, 84: £50 ➔ Began trading @LSE on Dec 3, 84 2) Jun 24, 85: £40 3) Apr 9, 86: £40 = £130… but..
Shareholders with only £50 payment were “guaranteed” to receive “full dividend” !
No. of application become “4 times” of total offered shares (£16.6bn !)
II. Innovations in Privatization: Privatization of BT (1)
Over 1.5 million shareholders were newly born, and lots of capital gainers were also born
What action taken for its successful largest share sale by British Telecom (BT)?

4
※ Returns (%*) to investors selling after *Day 1; shows the gain from first day’s trading on the selling price at the Exchange. All other returns reflect annualized. (Source; David Parker, “The U.K’s Privatization Experiment”)
Compny names Day 1 1 yr 5 yr BT (1st sale) 15% 84% 20%
BG 10 24 15
Power Gen (1st) 22 29 30
National Power (1st) 22 22 28
Fact proves !!!
Making another happy story still remained !!
II. Innovations in Privatization: Privatization of BT (2)
BT’s privatization contributed its “restructuring” process as a profit- seeking business entity ☞ ₤4 billion pound !! obtained by the Government
Launched ESOP scheme*, joined by 90% of BT employees, successfully reorganized its relationship between the Management and the Labor Union (*Employee Share Ownership Plan )
♪1st BT trading on Dec 3rd 1984 at the London Stock Exchange
7
8
【 Group Outline 】 【 Syndicate Structure for Offering 】
【 Far-Reaching Retail Network… 】
Source: JP Holdings
II. Innovations in Privatization: Privatization of JP (1)
IPO by Japan Post Group (Nov 4 2015) on TSE
JP Bank Japan Post JP Insurance
Deposit JPY 178tn
Mail flow 18bn
# of branches 24,000
# of contracts 33mn
JP Holdings Consolidated net profit: JPY483bn
(as in FY2015)
Total Asset: JPY85tn
Net Asset: JPY2tn
Current Profit: JPY493bn
Net Profit: JPY82bn
Total Asset: JPY208tn
Net Asset: JPY12tn
Current Profit: JPY569bn
Net Profit: JPY369bn
Total Asset: JPY5tn
Net Asset: JPY1tn
Current Profit: JPY22bn
Net Profit: JPY15bn

5
9
☞ Encouraging broader adoption of tax-free individual savings accounts
II. Innovations in Privatization: Privatization of JP (2)
Obtained by more than 40% of total purchase through NISA accounts at 5 major brokers and leading 5 online brokerages
Purchased via NISA accounts totaled just over JPY200bn (US$1.63 bn)
In total, 1.8 million new shareholders created
What action taken for its successful share sale by JP?
In addition, why did JP IPO successfully finish…
(1) Feeling more secure investment supported by High-profile name as a National Postal Servicing infrastructure
(2) Offering a higher dividend yield (2~3%) than bank deposit (ZERO) interest (3) Nation-wide massive scale “Share-sale” campaign by the Government (Ministry of Finance) (4) Joint sales campaign by leading domestic banks and brokers
Profitability margin Well-defined institutional responsibilities Avoid large new investments and
restructuring in privatization candidates Prepare sales with various changes,
debt decrease and labor shedding
Attractive Object
Legal system to protect consumers Market friendly policy to reduce
economic distortion
Regulation & Policy
Sufficient number of investors for competitive bidding
Precise valuation backed by enough information
Capital Market
Transparency ✓ Clear selection criteria ✓ Disclosure of sales price and buyer Overvaluation can delay the process Adequate monitoring and supervision
Process Management
Successful Privatization
II. Innovations in Privatization: Basic Implications
Keys for Successful Privatization
10

6
III. Innovations in Market Planning: Market Integration for Economy of Scale
11
Bangkok: Gateway to Mekong Investment
KL: Investment Centre for Islamic Finance
Singapore: Corner-Stone in Total Asian Investment & Management
Jakarta: Overhauling home market, and strengthening its own Islamic Capital Market
Philippine: Restructuring its own financial market structure, catching-up planned ASEAN Consolidated Capital Market
C,L,V: Developing each Local Capital Markets as one of their economic growth & reform agenda
(Source; DIR)
Moving forward as ASEAN, through avoiding a “storm in a teacup”
12
To have all necessary conditions to facilitate companies in raising fund through capital market
To have a mechanism & market instruments to support the reform of the enterprises To have comprehensive legal framework in compliance with national needs &
international standards LSX, CSD & brokers operate their business smoothly with limited risks & can
integrate with regional & global markets To increase the participation of public, investment base & structural balance Securities regulatory authority, the exchange & securities intermediaries having a
certain number of staff with certain knowledge To enable Lao Capital Market to integrate with regional/global markets
(Source; Lao Securities Commission)
☞ Creating more functional, efficient Stock Exchange is the highest-profile issue for the Government
Blue Print for Capital Market Development (2016-25) by Laos Securities Commission
III. Innovations in Market Planning: Laos
7
13
To deepen the development of Gov’t Bond Securities market ➔ Consider issuing Government Bonds
To establish supporting infrastructure for market ➔ Depositary, Clearing & Settlement facility, payment system link with national base
To overhaul/review regulatory framework & SEC structure to ensure they remain relevant to market condition
To promote unlisted companies on financing via IPO with some tax-allowance given incentives
To expand nation-wide educational campaign with schools to create new investor-base To develop collective investment schemes such as Investment Trust
(Source; Cambodia Securities Exchange)
☞ Common concept on the Exchange, an indispensable component for home capital market development, widely accepted
Financial Sector Development Strategy (2011-20) by Cambodian Government
III. Innovations in Market Planning: Cambodia
Becoming the highest-graded flagship mission among member countries
14
I. Mutual Recognition Framework to Facilitate
Cross border fund raising Product distribution Cross border investment within ASEAN Market access by intermediary
I. Mutual Recognition Framework to Facilitate
Cross border fund raising Product distribution Cross border investment within ASEAN Market access by intermediary
II. ASEAN Exchange Alliance & Governance Build trading linkage and setup ASEAN Board Enhance governance, trading efficiency & cost reduction Clearing depositary, and settlement linkage Marketing and Investor education
II. ASEAN Exchange Alliance & Governance Build trading linkage and setup ASEAN Board Enhance governance, trading efficiency & cost reduction Clearing depositary, and settlement linkage Marketing and Investor education
III. Promote New Products Build ASEAN as an asset class Promote private sector led regional products development Promote ASEAN “star” companies under ASEAN board
III. Promote New Products Build ASEAN as an asset class Promote private sector led regional products development Promote ASEAN “star” companies under ASEAN board
IV. Strengthen Bond Markets Reform initiatives in Bond issuance, listing & distribution Design a regional strategy for rating comparability Improve market liquidity, and clearing & settlement of linkage
IV. Strengthen Bond Markets Reform initiatives in Bond issuance, listing & distribution Design a regional strategy for rating comparability Improve market liquidity, and clearing & settlement of linkage
V. Align Each CMDP(*) to Support Integration Align national development initiatives to support cross border
integration Adopt phased approach to liberalization to ensure domestic
market alliance
V. Align Each CMDP(*) to Support Integration Align national development initiatives to support cross border
integration Adopt phased approach to liberalization to ensure domestic
market alliance
VI. Reinforce ASEAN Working Process Establish ASEAN Coordinating Team, comprising dedicated
resources from ACMF members to monitor, coordinate, report and raise issues on the implementation Plan
VI. Reinforce ASEAN Working Process Establish ASEAN Coordinating Team, comprising dedicated
resources from ACMF members to monitor, coordinate, report and raise issues on the implementation Plan
(*) CMDP = Capital Market Development Plan Source: Association of Thai Securities Companies
Strategic Plan for ASEAN Consolidated Capital Market
III. Innovations in Market Planning: Strategy for Market Integration

8
Expected benefits by an “Integrated ASEAN Capital Market” 15
Largest pool of liquidity Cost reduction (trading, settlement, disclosure & financing) Risk reduction Increased efficiency in capital allocation
Regional future growth should be capitalized in neighboring countries
Incorporating ASEAN market development as another key for Mongolian market? (time doesn’t wait !)
Why don’t you ride on the “Regional WAVE” from the South
Greater variety of financing sources
Joining the bandwagon of globalization…
III. Innovations in Market Planning: Rationale of Market Integration
So, is Dual-Listing the “Best” Solution? Need to carefully think about the plan, especially after “Listing”…
16
Why is Dual-Listing focused on ???
☞ Advantages ✓ Access to larger pool of potential investors (both retail and institutional) ✓ Greater access to capital, particular in larger market such as Tokyo, Hong Kong ✓ Ability to “tap into” different markets at a different time zone ✓ Increased opportunities for M&A, and… ✓ High public profile for issuing company
☞ Challenges ✓ Initial listing cost with a “secondary” listing ✓ On-going costs associated with a seconda listing ✓ Increased liability given different regulatory requirements ✓ Increased demands on management-time commitment for IR or marketing
IV. Innovations in Utilizing Overseas Market: Dual-Listing

9
17
① Via Depositary Receipts(ADR, GDR, SDR, HDR and JDR) Wider way of financing and Global presence are always key points (ex. SONY
in ‘60s and SAMSUNG in ‘90s), however, Cost is not far from cheap…especially on NYSE listing
② London’s “AIM” type IPO as an alternative option (cheaper and easier) Tokyo can be chosen (HK’s GEM, SGX’s Catalyst require “Primary Listing”) ➪ How to avoid to be a “sleeping” listed entity after IPO
③ “POWL” Public Offering without Listing” in Japan No-payable to the Exchange, but IR and periodical Roadshow required
④ Use of “Class-Share” with some limited voting-rights Not so supportive by market authority, however, ➪ Targeted finance could be possible (ex. Institutional Investors only)
IV. Innovations in Utilizing Overseas Market: Other Options
Other options offered ‘globally’
Conclusion: Rome was not built in a Day….
18
‘Reasonable’ & ‘realistic’ planning is the most important perspective in any emerging markets

10
Thank you !
19

Dual Listing and Depositary Receipts An International Comparison
12 May 2017
JICA Consultant Team
Contents
2
1. Overview: Dual Listing and Depositary Receipts (DRs)
2. Global Stock Exchanges: NYSE, NASDAQ,
JPX, HKEx, LSE, TMX and ASX 3. Key Considerations

1. Overview: Dual Listing
3
Dual listing means listing of a stock on more than one exchange. For instance, Tokyo and London. New York and Hong Kong.
As of today, none of the MSE-listed companies are dual listed. There are dual-listed companies with assets in Mongolia. Turquoise Hill Resources is listed on New York Stock Exchange and Toronto Stock Exchange. SouthGobi Resources is listed on Toronto Stock Exchange and Hong Kong Stock Exchange.
There are also companies listed on three stock exchanges.
1. Overview: Dual Listing – cont.
4
Advantages of a dual listing are: i) possibility of raising capital overseas; ii) better liquidity of your company’s shares; and iii) increasing brand awareness of your company in overseas.
Major disadvantage of a dual-listing is additional costs, such as annual listing fees, disclosure and compliance costs.

1. Overview: Depositary Receipts (DRs)
5
Issuance of DRs Issuance of Shares
DR Holders
Depositary
Corporation
Shares
DRs Shareholders
Corporation Shares
Depositary receipts (DRs) are receipts issued by a depositary (mostly depositary bank), representing the underlying shares of a corporation which has been deposited with the depositary bank or its nominated custodian.
1. Overview: Depositary Receipts (DRs) – cont.
6
Advantage for Issuers
Regulation – Local regulations may discourage overseas issuance of shares or overseas share register, but the DR structure allows efficient cross border transactions
Share size – DRs can be sized to fit host market practice
Advantage for Investors
Convenience – No need for local registration, compliance with foreign investor regulations, currency translation, etc.

1. Overview: Depositary Receipts (DRs) – cont.
7
ADRs
“American depositary receipts” • Used almost universally by foreign companies listing
in the US • Regulations follow those applicable to securities
generally • Level І: non-listed ІІ: listed without public capital-raising ІІІ: listed with public capital-raising
GDRs
“Global depositary receipts” • Used by many foreign companies listing in London or
Luxembourg • Concessionary regulation – viewed as professional
products and listed under minimum European regulations
Local DRs • DRs listed under regimes of specific markets – Hong
Kong, Japan, Taiwan, Singapore, Sweden, etc. • Regulation may be concessionary
2. Global Stock Exchanges: Ranking by Market Capitalization
8
Rank Location Stock Exchange US$tn Dec16
1 US NYSE Group 19.6 2 US Nasdaq - US 7.8 3 Japan Japan Exchange Group (Tokyo) 5.0 4 China Shanghai Stock Exchange 4.1 5 EU Euronext 3.5 6 China Shenzhen Stock Exchange 3.2 7 Hong Kong Hong Kong Exchanges and Clearing (HKEx) 3.2 8 UK London Stock Exchange (LSE) 2.9 9 Canada TMX Group (Toronto) 2.0 10 Germany Deutsche Börse AG 1.7 11 India BSE Limited 1.6 12 India National Stock Exchange of India Limited 1.5 13 Switzerland SIX Swiss Exchange 1.4 14 Australia Australian Securities Exchange (ASX) 1.3 15 Korea Korea Exchange 1.3 Source: World Federation of Exchanges, LSE

2. Global Stock Exchanges: Number of Foreign Issuers
9
Mar17
New York 490
NASDAQ 422
Tokyo 6
Hong Kong 101
London (LSE and AIM) 298
Toronto (TSX and TSV) 231
Australia 127
Source: NYSE, NASDAQ, JPX, HKEx, LSE, TMX, ASX
2. Global Stock Exchanges: NYSE and NASDAQ
10
NYSE and NASDAQ are the largest two stock exchanges in the world in terms of market capitalization as well as trading value.
NYSE and NASDAQ are also the top two stock exchanges with largest number of foreign issuers. NYSE and NASDAQ has 490 and 422 foreign issuers, from 47 and 35 countries/regions, respectively.
Many of the foreign stocks traded on NYSE and NASDAQ are American Depository Receipts (ADRs). For instance, all of 13 NYSE-listed Japanese stocks are in the form of ADRs.

2. Global Stock Exchanges: NYSE and NASDAQ – cont.
11 Source: NYSE, NASDAQ
NYSE ADR Non- ADR Total NASDAQ ADR Non-
ADR Total
Canada - 129 129 China 32 51 83 China 48 10 58 Israel 13 70 83 UK 23 12 35 Canada - 55 55 Brazil 24 2 26 UK 5 29 34 Bermuda - 24 24 Ireland 5 13 18 Argentina 13 4 17 Bermuda - 17 17 Chile 13 - 13 Switzerland - 17 17 Japan 13 - 13 Greece - 15 15 India 8 4 12 Netherlands 2 11 13 Israel 1 11 12 HK 3 6 9 ROW 81 67 151 ROW 42 36 78 Total 224 263 490 Total 102 320 422
Number of Foreign Issuers by Headquarter Location, Mar17
2. Global Stock Exchanges: JPX (Tokyo)
12
JPX is the third largest stock exchange by market capitalization, after NYSE and NASDAQ, and ranked 5th in terms of trading value.
JPX’s one of strengths is that companies can access international institutional investors as well as retail Japanese investors.
JPX is known to be active in international cooperation with overseas stock exchanges, especially in Asia.
Number of foreign issuers are less than other major global stock exchanges, with six foreign listed issuers currently.

2. Global Stock Exchanges: JPX (Tokyo) – cont.
13
Source: JPX
Name Sector Incorporation Primary list exchange
YTL Construction Malaysia Bursa Malaysia Bank of America Financials US NYSE AIG Financials US NYSE Aflac Financials US NYSE Xinhua Holdings IT Cayman Islands - Medicinova Pharmaceuticals US NASDAQ
Foreign Listed Issuers on JPX
2. Global Stock Exchanges: HKEx (Hong Kong)
14
Many of HKEx-listed issuers are incorporated outside of Hong Kong and China, mainly in Cayman Islands and Bermuda.
There are several cases for foreign consumer brands to list their shares in Hong Kong for the purpose of increasing brand awareness in the Mainland China market.

2. Global Stock Exchanges: HKEx (Hong Kong) – cont.
15
Cayman Islands 781 China 218 Bermuda 474 Hong Kong 204 British Virgin Islands 9 US-Nasdaq stocks
for trading only 6 Singapore 9 Canada 4 Grand total 1,737 UK 4 Japan 3 Jersey 3 Luxembourg 2 Italy 1 US 1 Brazil 0 Total 1,291
Source: HKEx
Number of Issuers by Location Incorporated on HKEx, Dec16
2. Global Stock Exchanges: LSE (London)
16
London (LSE) is another major global stock exchange. There are 298 foreign issuers.
London is positioned as a center for issuers in Europe and Africa.
There are quite a few mining stocks on LSE. There are 57 foreign issuers in the basic resources (mainly mining) sector.

2. Global Stock Exchanges: LSE (London) – cont.
17
Basic Resources Oil & Gas Others Total
Europe 14 9 68 91 British Virgin Islands 15 2 20 37 Cayman Islands 1 7 23 31 Bermuda 5 2 23 30 Australia 14 9 5 28 United States - 2 19 21 Canada 6 7 4 17 Africa 2 2 10 14 Israel - - 11 11 Asia ex-Japan and China - 1 7 8 Japan - 5 5 China - - 3 3 Latin America - 1 1 2 International Issuers Total 57 42 199 298
Number of Foreign Issuers on LSE, Mar17
Source: LSE
2. Global Stock Exchanges: TMX (Toronto)
18
Toronto (TMX) has 231 foreign issuers, 119 out of which are US companies.
There are also quite a few Canadian companies dual-listed on TMX and overseas exchanges.
One of TMX’s remarkable features is its large mining sector. In fact, 1,210 out of 3,128 listed issuers on TMX are mining companies. Out of the 1,210 mining stocks, 50 issuers are incorporated in overseas.

US, 119
Australia/NZ/PNG, 17
Asia, 33
UK/Europe, 26
Africa, 7
Latin America, 16
ROW, 13
231
2. Global Stock Exchanges: TMX (Toronto) – cont.
19
Number of Foreign Issuers by Headquarter Location on TMX, Mar17
Source: TMX
2. Global Stock Exchanges: TMX (Toronto) – cont.
20
Canadian issuers - dual-listed 192 Foreign issuers - dual-listed 50 Canadian issuers - listed in Toronto only 968 Mining sector total 1,210
US 18 Australia 10 UK 7 China 3 South Africa 3 ROW 9 Total 50
Number of Foreign Issuers in the Mining Sector on TMX, Mar17

2. Global Stock Exchanges: ASX (Australia)
21
Australia (ASX) has 127 foreign listed issuers, with New Zealand and US companies of 48 and 15, respectively.
ASX is also known as a stock exchange with large exposure to the mining sector.
2. Global Stock Exchanges: ASX (Australia) – cont.
22 Source: ASX
Number of Foreign Issuers by Headquarter Location on ASX, Mar17
New Zealand, 48
US, 15Bermuda, 12
UK, 10
Singapore, 9
Canada, 8
Hong Kong, 8
Papua New Guinea, 6
British Virgin Islands, 3
Cayman Islands, 2
Indonesia, 1 Ireland, 1 Israel, 1 Netherlands, 1South Africa,
1
127

3. Key Considerations
23
When you plan a dual listing in Mongolia and overseas, or an issuance of DRs, key considerations are:
ii) listing requirements;
i) investor base;
iv) costs; and
iii) accounting standards and disclosure requirements;
v) availability of a securities company.
3. Key Considerations: Investor Base
24
Investor base is perhaps the first you need to think. Large-sized stock exchanges can offer bigger potential to accept your company’s financing. In terms of size, the US markets are the largest, then Japan, followed by Hong Kong and London.
Although they are not top stock exchanges in size, there are experienced investors in the mining sector in Toronto and Australia.

3. Key Considerations: Listing Requirements
25
Listing requirements depend on a stock exchange. Basically, the listing requirements consist of quantitative requirements and qualitative requirements.
The qualitative requirements usually include profitability of a company for two consecutive years or longer. In other words, a company that wants to be listed to maintain profitability before listing. Typical qualitative requirements are management’s ability, internal control etc.
In certain markets, such as TMX and ASX, different requirements can be applied for companies in the mining sector.
3. Key Considerations: Accounting and Disclosure
26
Accounting and disclosure are also key factors if your company can be dual listed or issue DRs.
Major stock exchanges require either accounting standards of their home country, International Financial Reporting Standards (IFRS) or other country’s standards that can be regarded as international standards.
With regards to disclosure, quarterly financial reports in timely manner, usually within 45 days after the end of each period, is necessary. Annual reports are requested to submit within 3 months after the end of each financial year, in most of cases.

3. Key Considerations: Cost
27
It is hard to compare costs by each country, given that costs are dependent on a size of a company and who is your company’s partners providing professional services.
Generally, initial listing fees consist of : Legal advice fee for an issuer Legal advice fee for an underwriter Accounting support fee Printing cost Consulting fee to an underwriter Underwriting commission Transfer agent fee Listing examination fee Initial listing fee
3. Key Considerations: Cost
28
Annual costs after listing: Legal advice fee Accounting support fee Printing cost Transfer agent cost Annual listing fee

3. Key Considerations: Securities Companies
29
Dual listing and DR issuance cannot be materialized without securities companies’ support.
The most important consideration from securities companies’ perspective is if your company’s shares or DRs can be sold to investors.
Summary
30
Mongolian companies have two possibilities in financing overseas: Dual listing and DR issuance.
There are several possibilities as a stock exchange to be dual-listed or issue DRs: NYSE, NASDAQ, JPX, HKEx, LSE, TMX or ASX. Each stock exchange has their own advantages.
Which stock exchange to choose should be considered several key factors: investor base, listing requirements, accounting and disclosure, cost and availability of securities companies.

1
Project for Capacity Building of Capital Market in Mongolia - Redesigning Mongolian Capital Market -
May 12, 2017
Takayuki Urade JICA Consulting Team
Why & How to Redesign?
2
Persistent Shortfalls Limited domestic investor base
due to; Small population Absence of institutional
investors Distorted interest rate structure,
hampering the efficiency of financing activities.
Need to reconfirm that ‘MGL is different’…
Bring about only limited impacts…
• Facilitating basic & robust conditions required for ANY financial markets Basic roles of direct & indirect finance Consistent risk-return profiles across
product segments • But each financing tool needs to be applied;
In a simplified manner and On a selective basis.
Maximizing benefits of market development
• Assuming direct transplanting from ‘global standard’
• With less customization…
‘Cookie cutter’ traditional solutions
Further customized solutions
‘Redesigning’ Need to realign the market resources toward; Sustainable, Profitable & Marketable products…
Don’t want to jump to what works in other (especially advanced) markets...

2
New Products/Schemes with Potentials in Mongolian Capital Market
1. Corporate (Straight) Bond (SB) 2. Convertible Bond (CB) 3. Warrant Bond (WB) 4. Depository Receipt (DR) 5. ‘Carving Out’ & ‘Holding Company Structure’ for Privatization
6. Real Estate Investment Trust (REIT) 7. Exchange Traded Fund (ETF)
8. Investment Savings Account (e.g. NISA in Japan)
9. Syndicated ‘Firm Commitment’ Underwriting
Issuer
Investment Management
Retail Investor
Intermediaries
3
1. Corporate Straight Bond (SB) vs. Bank Loans
Benefits Difficulties/Shortfalls Requirements ‘Fixed Income’ Long-term financing (∵) Not
bound by financing side Borrower is visible Tradable (if listed)
Cash flow relies on the credit of issuers, not banks
Benchmark (gov’t bond) Credit rating agency Clearing & settlement Custodians (for foreigners)
Bank
Deposit
Interest
Loan
Interest
Purchase SB
Coupon & Principal
Traded SB
4

3
Attractive for Investors
c.f. Cost of Financing
Is there a room for capital market financing?
5 Source: Consultant Team from the Mongol Bank and the World Bank
Attractive for Financiers
2. Convertible Bond (CB)
Benefits Difficulties/Shortfalls Requirements Downside protection (∵) Bond Upside (capital gains) Low cost financing (under low int rate) High return (under high int rate)
Generally lower coupon & liquidity < SB
Compulsory conversion Repayment burden if not
converted
Enough knowledge on investors’ side
Purchase CB
Coupon (➔ Dividend) Principal (if held to maturity)
Traded
CB
Converted
Share Listed & Traded
6

4
3. Warrant Bond (WB)
7
Benefits Difficulties/Shortfalls Requirements
Downside protection (∵) Bond Upside if shares are purchased May be able to purchase shares
@discount Low cost financing (under low int rate) High return (under high int rate)
Generally lower coupon & liquidity < SB
Volatile price Repayment burden
(∵) Debt
Enough knowledge on investors’ side
Purchase WB
Coupon + Dividend Principal (if held to maturity)
Traded
WB
Exercised & Purchased
Listed & Traded Share
4. Overseas Financing through Depository Receipt (DR)
Benefits Difficulties/Shortfalls Requirements Can get around the domestic regulations,
settlement restrictions, etc. Liquidity can be enhanced through
greater investor base Easier access to Mongolian market
Transaction cost (e.g. Fees) Price can be higher than
original shares
Local disclosure requirements
Listed
Deposit
Listed
Mongolia Foreign Country
Purchase
DR
Original Share
Purchase
8

5
5. ‘Carving Out’ & ‘Holding Company Structure’ for Privatization
Benefits Difficulties/Shortfalls Requirements Valuable/profitable parts can
be presented to investors Complicated valuation for
the holding company
Real synergy necessary for holding company structure
Enough time for pre-privatization resrtucturind
Persuasive equity story for IPO
SOE
Business Segment
Issuer Company
Listed
Share
State Owned Holding Company
SOE (1)
SOE (2)
SOE (3)
Share
Listed
Carve Out
Holding Company
Purchase
9
Why privatized? - To enhance efficiency by ensuring management independence - To introduce competition through liberalizing telecom market
Since the listing in 1987, gov’t gradually sold its holdings until 2005 for JPY14tn.
Still gov’t has to hold over 1/3 of total outstanding, and foreign ownership is restricted to 1/3.
Government
NTT Holdings NTT Public Corporation
Regional Business
International Business
Data Business
1985
100%
Government
100%
Private
66%
Other Business
Regional
2015
International
33%
100%
Data
54.2%
Mobile
66.6%
Established in 1998 Established in 1999
Established in 1992 Established in 1999
Established in 1999
c.f. Japanese Case (Telecom): NTT
10

6
Why privatized? - To reduce huge deficit of JPY 37.1tn of Japanese National Railways (JNR) - To optimize management policy suitable for each region
JNR was divided into 6 regional companies and 1 freight company, of which 3 profitable companies were listed and all the shares were sold for JPY 4.0tn.
Privatization effort has overcome extremely strong union and the operation was successfully improved with a reduction of over 30% of employees.
Government
JNR
West
Central
1986
100%
Private
1987
East
Hokkaido
Shikoku Kyushu
Freighter others
Government
100%
JNR Settlement Corporation
West Central East
Hokkaido
Shikoku
Kyushu
Freighter
100% 100% 100%
100%
Fully Privatized in 2002
Fully Privatized in 2004
Fully Privatized in 2006
Gov
100% 100%
JRTT
Hokkaido
Shikoku
Kyushu
Freighter
100%
West
Central
East
2006
Dissolved in 1998. Debt of 13.8 became national burden
(total debt in red JPY tn)
(37.1) (25.5)
(3.3) (1.0) (0.3)
c.f. Japanese Case (Railway): JR
11
Debt (25.5)
JSC was established for restructuring B/S of JNR.
Only profitable four JR companies took over the debt related w/own assets and JSC succeeded the rest of all debt.
Debt Structure (1988)
JNR Debt (25.4) Japanese National Railways
JRCC Debt (4.5)
Santo Fund (1.3)
Pension Obligation (5.0)
Debt Allocation Payment Resource
Tota
l Deb
t Rel
ated
to R
ailw
ays
(37.
1)
(JPY tn)
HSBA Debt (0.6) Restructuring Cost (0.3)
Debt (11.6)
Revenue (25.5)
JNR Debt (8.6)
JRCC Debt (3.0)
JNR Debt (16.8)
JRCC Debt (1.5)
HSBA Debt (0.6) Restructuring Cost (0.3)
Pension Obligation (5.0) Santo Fund (1.3)
Revenue (11.6)
Profitable JRs Income (5.9)
Shinkansen Income(5.7)
National Burden (13.8)
JR Stock Sale (1.2)
Land Asset Sale (7.7)
Shinkansen Sale (2.9)
JR
JSC
c.f. Japanese Case (Railway): JNR Settlement Corporation (JSC)
12

7
There were many private electric power companies before WWII.
During the war, gov’t forced to merge them into Japan Electric Generation & Transmission Co. (JEGTC) and 9 distributors under National General Mobilization Act.
GHQ divided JEGTC into 9 regional companies in 1951, while TEPCO was renationalized in 2012 due to the nuclear accident caused by the earthquake.
1930’s 1939-1950
Government
Kansai
Chubu
Tokyo
1951 470 private electric power companies
Private
9 Distributors
Private
JEGTC
9 private regional companies
Hokuriku Tohoku
Shikoku Kyushu
Chugoku
Renationalized in 2012
Nationalized companies
Hokkaido
SMEs
c.f. Japanese Case (Electricity): Electric Power Companies
13
6. Real Estate Investment Trust (REIT)
Benefits Difficulties/Shortfalls Requirements Address off-balance needs of
asset-rich companies Can invest multiple real
estate properties Real estate investment return
Bankruptcy/delisting risk for the investment company
Return subject to the leverage of investment company, property market performance, etc.
Disaster risk
Enough assets to be included
Real Estate
Investment Company
REIT Listed Purchase
Invest
Traded
Investment Return
Investment Return
14

8
7. Exchange Traded Fund (ETF)
Benefits Difficulties/Shortfalls Requirements Can be traded on a real-time basis High liquidity Low custodian/trust fee
(∵) Traded @stock exchange Margin trading is available
Minimum trading unit is generally larger than investment trusts
Initial fee @purchase > investment trust (usually no load)
Enough liquidity in original shares
Investment Manager
ETF
Listed
Purchase
Traded Share A
Share B
Share C
Purchase Index
Listed Structure & Manage
15
8. Investment Savings Account (e.g. NISA in Japan)
Benefits Difficulties/Shortfalls Requirements Tax exempt for dividends
& capital gains
Profits & losses cannot be offset (NISA) Losses cannot be carried over ( -do- ) Margin trading is not available ( -do- )
1 account per person & up to ¥1.2mn/yr *5yrs (NISA)
Securities Co
ISA
Purchase Hold Up to ¥1.2mn /yr *5 (NISA)
Tax exempt
Listed
Dividend & Capital Gains
Dividend
16
9
Lead Underwriter
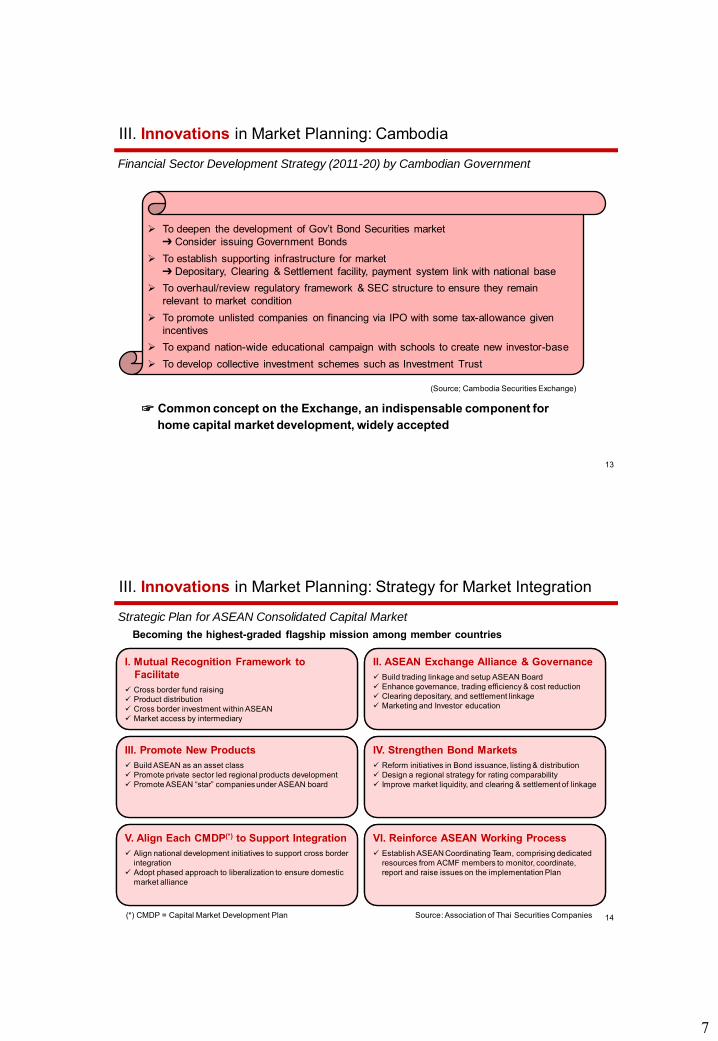
9. Syndicated ‘Firm Commitment’ Underwriting
Benefits Difficulties/Shortfalls Requirements Large-scale offerings are possible
trough diversifying selling channels Easier to go for firm commitment Lead underwriter can get
management fees
May take time for coordination Syndicate members have to
pay management fees to the leading firm
Specification of roles of each underwriter on underwriting agreement
Purchase
Syndicate
Manage
Investors
Underwrite
17
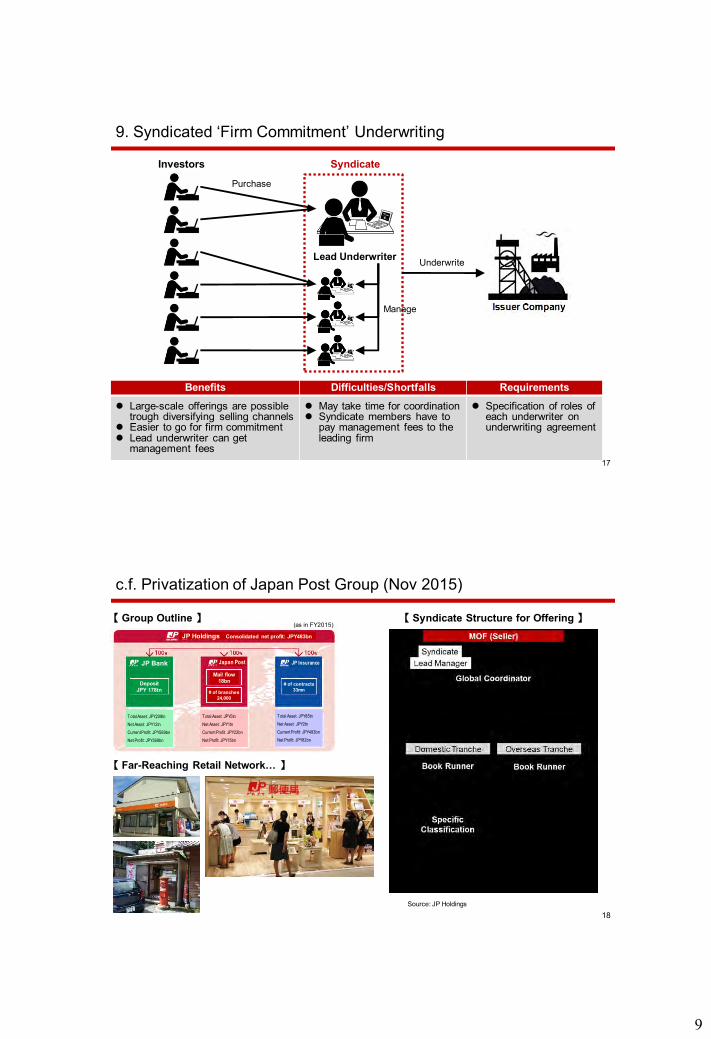
【 Group Outline 】 【 Syndicate Structure for Offering 】
【 Far-Reaching Retail Network… 】
Source: JP Holdings
c.f. Privatization of Japan Post Group (Nov 2015)
JP Bank Japan Post JP Insurance
Deposit JPY 178tn
Mail flow 18bn
# of branches 24,000
# of contracts 33mn
JP Holdings Consolidated net profit: JPY483bn
(as in FY2015)
Total Asset: JPY85tn
Net Asset: JPY2tn
Current Profit: JPY493bn
Net Profit: JPY82bn
Total Asset: JPY208tn
Net Asset: JPY12tn
Current Profit: JPY569bn
Net Profit: JPY369bn
Total Asset: JPY5tn
Net Asset: JPY1tn
Current Profit: JPY22bn
Net Profit: JPY15bn
18

10
Takeaways
19
‘Redesigning’ = Applying ‘simple solutions’ on a selective basis, while ensuring the ‘basic & robust framework’. 1
2
3
‘Fixed income’ → ‘equity-linked’ products as an entry to stimulate demands for capital market products.
Bundling fragmented investment opportunities into a package with a simple & clear concept.
Thank you! For further questions, comments & suggestions, please contact:
Takayuki Urade JICA Consulting Team
Office (Local): Training Room, 4F, FRC
20

© 2017 Japan Exchange Group, Inc. and/or its affiliates. All rights reserved.
Overview of TSE Equity Market
May, 2017
Tokyo Stock Exchange, Inc.
© 2017 Japan Exchange Group, Inc. and/or its affiliates. All rights reserved. 1
1. Executive Summary
2. Overview of the Japanese Market
3. Deep and Diverse Investor Base
4. Listing Requirements of Tokyo Stock Exchange

2 © 2017 Japan Exchange Group, Inc. and/or its affiliates. All rights reserved.
Advantages of Listing on TSE
The Largest Exchange in Asia by Market Capitalization – Tokyo Stock Exchange is the Asia’s largest exchange with a market capitalization $5.1 trillion as of Dec.
2016. – Tokyo Stock Exchange is one of the most liquid Asian Stock Exchange with an average daily trading
value US$ 26,253 million in 2016 in terms of TSE 1st Section.
The Huge Pool of Cash and Deposits Held by Japanese Retail Investors – The huge pool of cash and deposits held by Japanese retail investors amounting to JPY 916,007 billion
(As of June 2016) is seeking tools and opportunities for investment.
High IPO Allocation to Retail Investors – More than 80% of stocks are allocated to retail investors through IPOs in Japan.
The Largest IPO in 2016 – Kyushu Railway offered JPY 416 billion, US$ 4.16 billion in total.
The Largest IPO in 2015 – Japan Post Holdings and its two subsidiaries offered JPY 1.4 trillion, US$ 14 billion in total.
Long-Term Investment by Retail Investors – The risk appetite of retail investors is much different from institutional investors. They tend to hold
stocks much longer than institutional investors.
The largest Institutional Investor – The Government Pension Investment Fund, Japan (GPIF), the largest institutional investor in the world
with AUM totaling almost US$ 1.44 trillion (Dec. 2016). GPIF’s investments in foreign stocks accounted for 23.1% of its entire portfolio, an amount valued at US$331 billion1 (Dec. 2016)
Note: 1 US$= 100 JPY
© 2017 Japan Exchange Group, Inc. and/or its affiliates. All rights reserved. 3
1. Executive Summary
2. Overview of the Japanese Market
3. Deep and Diverse Investor Base
4. Listing Requirements of Tokyo Stock Exchange

4 © 2017 Japan Exchange Group, Inc. and/or its affiliates. All rights reserved.
Market Capitalization
Tokyo Stock Exchange ranks No. 1 in Asia by market capitalization.
Source: WFE Note: Domestic market capitalization as of the end of March 2017
17,787 20,012
8,436
5,197 3,719 3,505
1,434 1,392 957 717 0
2,000
4,000
6,000
8,000
10,000
12,000
14,000
16,000
18,000
20,000
22,000
NYSE Nasdaq - US JapanExchangeGroup Inc.
Euronext Hong KongExchanges
and Clearing
KoreaExchange
AustralianSecuritiesExchange
Taiwan StockExchange
SingaporeExchange
Mar
ket
Capi
taliz
atio
n (U
S$ b
illio
n)
5 © 2017 Japan Exchange Group, Inc. and/or its affiliates. All rights reserved.
3,979
2,696
1,320
595 398 399
205 152 56
0
500
1,000
1,500
2,000
2,500
3,000
3,500
4,000
NYSE Nasdaq - US JapanExchangeGroup Inc.
KoreaExchange
Hong KongExchanges and
Clearing
Euronext AustralianSecuritiesExchange
Taiwan StockExchange
SingaporeExchange
Valu
e of
Sha
re T
radi
ng (
US$
bill
ion)
Value of Share Trading in the World
Tokyo Stock Exchange is about 6.7 times larger than Hong Kong Exchanges by value of share trading.
Source: WFE Note: Value of share trading - Electronic order book trades from January to March 2017

6 © 2017 Japan Exchange Group, Inc. and/or its affiliates. All rights reserved.
Stock Market Index Performance Japan has enjoyed a high performance since Mr. Abe became Prime Minister. Also Japan is free from a political risk while there are a lot of political events in Europe and the U.S.
Source: Bloomberg Note: As of December 30, 2016. Indices rebased to 100 as of November 1, 2012.
249
80
130
180
230
280
330
01-Nov-12 01-Apr-13 01-Sep-13 01-Feb-14 01-Jul-14 01-Dec-14 01-May-15 01-Oct-15 01-Mar-16 01-Aug-16
TOPIX (Japan) TSE Mothers (Japan) NYSE Composite (US)Nasdaq Composite (US) FTSE All Shares (UK) S&P/HKEx Large Cap Index (Hong Kong)FTSE Straits Times Index (Singapore) KOSPI Index (Korea) TWSE Index (Taiwan)Shanghai Composite (China)
204
7 © 2017 Japan Exchange Group, Inc. and/or its affiliates. All rights reserved.
Daily Average Trading Volume
Daily average trading volume has exceeded US$ 20 billion on an ongoing basis since January 2013.
Source: Tokyo Stock Exchange Note: US$ = 100 JPY.
Daily Average Trading Volume (TSE 1st): US$ 20 billion
Daily Average Trading Volume (TSE 1st): US$ 30 billion
0
1,000
2,000
3,000
4,000
5,000
6,000
7,000
8,000
9,000
0
5,000
10,000
15,000
20,000
25,000
30,000
35,000
40,000
45,000
Jan-
12M
ar-1
2M
ay-1
2Ju
l-12
Sep-
12N
ov-1
2Ja
n-13
Mar
-13
May
-13
Jul-1
3Se
p-13
Nov
-13
Jan-
14M
ar-1
4M
ay-1
4Ju
l-14
Sep-
14N
ov-1
4Ja
n-15
Mar
-15
May
-15
Jul-1
5Se
p-15
Nov
-15
Jan-
16M
ar-1
6M
ay-1
6Ju
l-16
Sep-
16N
ov-1
6Ja
n-17
Dai
ly A
vera
ge T
radi
ng V
olum
e (
US$
mill
ion,
TSE
2nd
, TSE
Mot
hers
, TS
E JA
SDAQ
)
Dai
ly A
vera
ge T
radi
ng V
olum
e (U
S$ m
illio
n, T
SE 1
st)
TSE 1st TSE 2nd TSE Mothers TSE JASDAQ

8 © 2017 Japan Exchange Group, Inc. and/or its affiliates. All rights reserved.
19 22
37
52
64
86
103
84
2009 2010 2011 2012 2013 2014 2015 2016
Number of IPOs in Japan
Number of IPO showed that IPO activity in Japan are increasing since 2009.
Source: TSE
9 © 2017 Japan Exchange Group, Inc. and/or its affiliates. All rights reserved.
IPO Case Study (Dual IPO): LINE Corporation
On July 15, 2016, Japanese chat app LINE Corp, a subsidiary of South Korean internet search giant NAVER, successfully completed dual IPO in Tokyo and New York. Its offering amount was US$ 1.3 billion1 and its market capitalization reached US$ 10 billion1 during Tokyo Stock Exchange’s first trading day. Company Profile/IPO summary
Company Name LINE Corporation [TSE 1st: 3938, NYSE: LN]
CEO Takeshi Idezawa Foundation Sep. 4, 2000
IPO Date Jul. 14, 2016 [NYSE] Jul. 15, 2016 [TSE 1st]
Underwriter Nomura Securities
Offering Price JPY3,300 (US$32.84) (NYSE First Price:US$ 42.00) (TSE 1st First Price:JPY 4,900)
IPO Amount
(New Shares / Sale) US$1,328 million (US$1,155 million/US$173 million)
Market Cap (offering price/first price)
US$6,930 million /US$8,820 million (NYSE) US$10,290million (TSE 1st)
WEB http://linecorp.com/en/
Business
Segment (FY Dec 2015) Shareholders
Summary of Financial Data Market Cap Chart
LINE Corporation is a Japan-based company mainly engaged in the operation of LINE business portal business. Its LINE business portal segment includes communication and content service and advertising service. Communication and content service provides communication, contents and other services, such as LINE Pay, LINE FRIENDS and LINE Mobile. Advertising service provides LINE advertising and portal advertising services. Note: 1 1US$ = 100 JPY.
Source: Reuters.com
Sales by business segment Sales by country
151 259
396
864
1,207
-61 -19 -8
42
-76 -2000
200400600800
1,0001,2001,400
Dec-11 Dec-12 Dec-13 Dec-14 Dec-15
(US$
mill
ion)
Revenue Net ProfitIFRS J-GAAP
Content (Games), US$493M
, 41%
Others, US$60M,
5%
Communication (Stickers),
US$287M, 24%
LINE advertising, US$265M,
22%
Portal advertising, US$99M, 8%
Japan, US$848M,
70%
Taiwan, US$171M,
14%
Other, US$188M,
16%
NAVER Corporation
(Korea), 74%
Stock option
holders, 11%
Japan offering,
6%
US offering,
9%
Note: After IPO. Dilutive shares.
Source: Bloomberg
0
200
400
600
800
1,000
1,200
01,0002,0003,0004,0005,0006,0007,0008,0009,000
10,000
Turn
over
(U
S$ m
illio
n)
Mar
ket C
ap (
US$
mill
ion)
Turnover(US$ million)
Market Cap(US$ million)
Source: Company disclosure
Source: Annual report

10 © 2017 Japan Exchange Group, Inc. and/or its affiliates. All rights reserved.
Structure of TSE Cash Equity Market
JPX offers several markets with different concepts to allow companies to make an optimal choice.
- Various Sectors and Growth
Companies -
1st Section - Large-sized companies -
2,015 Companies
2nd Section - Medium-sized
companies - 535 Companies
Market Of
The High-growth and
EmeRging Stocks
237 Companies
Available to both individual and professional investors
JASDAQ Standard
712 Companies
JASDAQ Growth
42 Companies
Equity Market (3,531 companies) Other Cash Products
Professional-oriented market: Only available to professional investors
16 Companies
25 Programs
ETF 206 ETFs
ETN 24 ETNs
REIT 58 REITs
Country Fund 1 Fund
Venture Fund 1 Fund
Infrastructure Fund 3 Fund
Note: As of March, 2017
11 © 2017 Japan Exchange Group, Inc. and/or its affiliates. All rights reserved.
IPO Companies Size in 2016
TSE 2nd [5 IPOs]
JASDAQ [14 IPOs]
Mothers [54 IPOs]
Revenue
Net
Profit Net Asset
Market Cap
(First Price)
Actual
PER
(First Price)
IPO
Amount2
US$ 3,779M
US$ 861M
US$ 217M
US$ 77M
US$ 28M
US$ -4,330M
US$ 3,057M
US$ 190M
US$ 58M
US$ 10,289M
US$ 576M
US$ 207M
23.8x
14.8x
6.2x
US$ 4,160M
US$ 347M
US$ 30M
US$ 915M
US$ 307M
US$ 20M
US$ 18M
US$ 10M
US$ 6.0M
US$ 143M
US$ 91M
US$ 33M
US$ 270M
US$ 116M
US$ 58M
14.7x
9.9x
7.4x
US$ 48M
US$ 18M
US$ 13M
US$ 158M
US$ 20M
US$ 6.0M
US$ 18M
US$ 1.5M
US$ -5.5M
US$ 93M
US$ 5.3M
US$ 0.5M
US$ 303M
US$ 79M
US$ 29M
1,665.3x
65.8x
10.4x
US$ 283M
US$ 10M
US$ 3.0M
US$ 190M
US$ 60M
US$ 15M
US$ 5.6M
US$ 2.0M
US$ 0.9M
US$ 49M
US$ 13M
US$ 7.1M
US$ 110M
US$ 40M
US$ 22M
75.0x
19.3x
6.5x
US$ 21M
US$ 5.4M
US$ 3.5M
US$ 3,779M
US$ 36M
US$ 6.0M
US$ 77M
US$ 1.8M
US$ -4,330M
US$ 3,057M
US$ 10M
US$ 0.5M
US$ 10,289M
US$ 78M
US$ 16M
1,665.3x
41.0x
6.2x
US$ 4,160M
US$ 11M
US$ 3.0M
TSE 1st [8 IPOs]
Max
Median
Min
Source: TSE Note: 1 Excluding Tokyo Pro Market, REITs and Infrastructure Fund. US$ = 100JPY. 2 Including Nagoya Stock Exchange’s IPOs 3 Total of offering and sales.
All [83 IPOs]

12 © 2017 Japan Exchange Group, Inc. and/or its affiliates. All rights reserved.
Electric Appliances 11%
Transportation Equipment
10%
Information & Communication
9%
Banks 8%
Chemicals 6% Retail
5% Pharmaceutical
5% Machinery
5% Foods
4%
Wholesale Trade 4%
Services 4%
Land Transportation 4%
Construction 3%
Insurance 2%
Real 2%
Others 14%
2nd Section 1%
JASDAQ Standard
1%
Mothers 1%
JASDAQ Growth 0%
TOKYO PRO Market 0%
Market Capitalization by Industrial Sectors in TSE 1st & Sections
Source: TSE Note: As of February 28, 2017
TSE 1st, $6,483tr
, 97%
Market Capitalization by Industrial Sectors in TSE 1st & Sections Sector Market Cap. Ratio
Electric Appliances 65,488,192 11.16% Transportation Equipment 56,391,055 9.61%
Information & Communication
55,256,468 9.41%
Banks 44,566,627 7.59% Chemicals 37,127,795 6.32% Retail 31,738,690 5.41% Pharmaceutical 27,569,366 4.70% Machinery 27,299,490 4.65% Foods 24,916,315 4.24% Wholesale Trade 24,577,768 4.19% Services 23,740,228 4.04% Land Transportation
21,519,504 3.67%
Construction 15,572,966 2.65% Insurance 14,126,598 2.41% Real 13,372,167 2.28% Others 82,562,030 14.06% 2nd Section 8,410,998 1.43% JASDAQ Standard 8,358,330 1.42% Mothers 4,058,612 0.69% JASDAQ Growth 333,040 0.06% TOKYO PRO Market 37,164 0.01%
Million Yen
13 © 2017 Japan Exchange Group, Inc. and/or its affiliates. All rights reserved.
Mining Sector
Company Name Code Market Division Daily Average Value
(Yen) Market Cap.
(Yen) Dividend yield Consolidated PER
NIPPON COKE & ENGINEERING COMPANY,LIMITED 3315 First Section 109,528,143 28,723,197,655 2.1 15.9
SHOWA SHELL SEKIYU K.K. 5002 First Section 1,771,311,442 424,710,400,800 3.37 9.8
TOA OIL COMPANY,LIMITED 5008 Second Section 23,643,445 17,047,595,000 2.91 7.4
NIPPON SEIRO CO.,LTD. 5010 Second Section 6,803,946 6,652,800,000 3.36 8.8
NICHIREKI CO.,LTD. 5011 First Section 40,541,870 28,802,533,095 8.4 10
Yushiro Chemical Industry Co.,Ltd. 5013 First Section 16,818,790 19,112,589,375 2.9 11.6
BP Castrol K.K. 5015 First Section 59,289,821 38,506,416,764 4.23 23.6
Fuji Oil Company,Ltd. 5017 First Section 154,856,552 29,397,062,552 1.59 2.9
MORESCO 5018 First Section 47,403,567 16,435,600,000 2.35 9.9
Idemitsu Kosan Co.,Ltd 5019 First Section 2,346,612,492 619,200,000,000 1.29 8.8
JXTG Holdings,Inc. 5020 First Section 5,753,551,720 1,364,282,157,384 2.92 9
COSMO ENERGY HOLDINGS COMPANY,LIMITED
5021 First Section 535,061,073 162,081,211,296 2.61 4.8
Source: Quick Note: Market Cap: As of March, 2017. Daily average value: From April to March 2017.

14 © 2017 Japan Exchange Group, Inc. and/or its affiliates. All rights reserved.
Privatization
Company Name Code Market Division Daily Average Value
(Yen) Market Cap.
(Yen) Dividend yield Consolidated PER
INPEX CORPORATION 1605 First Section 6,155,829,784 1,600,513,180,200 1.64 33.2
Japan Petroleum Exploration Co.,Ltd. 1662 First Section 885,229,243 145,687,524,024 1.17 29.3
Electric Power Development Co.,Ltd. 9513 First Section 2,540,445,798 476,848,115,500 2.68 12.8
NIPPON TELEGRAPH AND TELEPHONE CORPORATION 9432 First Section 18,366,909,013 9,962,066,521,440 2.52 12.4
NTT DOCOMO,INC. 9437 First Section 13,147,604,393 10,109,617,077,500 3.08 14.6
JAPAN TOBACCO INC. 2914 First Section 16,363,459,613 7,236,000,000,000 3.86 16.1
East Japan Railway Company 9020 First Section 9,390,806,632 3,774,920,182,600 1.34 14.1
Central Japan Railway Company 9022 First Section 8,098,043,188 3,736,840,000,000 0.71 9.8
West Japan Railway Company 9021 First Section 5,423,797,072 1,402,835,135,000 1.93 13.6
JAPAN POST HOLDINGS Co.,Ltd. 6178 First Section 3,409,455,826 6,286,500,000,000 3.57 17.9
JAPAN POST BANK Co.,Ltd. 7182 First Section 3,536,988,976 6,214,500,000,000 3.62 17.2
JAPAN POST INSURANCE Co.,Ltd. 7181 First Section 1,163,397,176 1,530,600,000,000 2.35 17.7
Source: Quick Note: Market Cap: As of March, 2017. Daily average value: From April to March 2017.
15 © 2017 Japan Exchange Group, Inc. and/or its affiliates. All rights reserved.
Transpotation Service,
$1.8bn, 37%
Construction, $0.9bn,
18%
Real Estate, $0.6bn, 13%
Restaurant, $1.0bn, 20%
Others, $0.6bn, 12%
Kyushu Railway Company
Company Profile/IPO summary
Company Name Kyushu Railway Company [TSE 1st: 9142]
President Toshihiko Aoyagi Foundation Apr. 1, 1987 IPO Date Oct. 25, 2016 Underwriter Mitsubishi UFJ Morgan Stanley Offering Price JPY2,600 (First Price:JPY3,100)
IPO Amount
(New Shares / Sale) US$4,160 million (NA/US$4,160 million)
Market Cap (offering price/first price)
US$4,160 million /US$4,960 million
WEB http://www.jrkyushu.co.jp/english/index.jsp
Business
Business Segment (FY Mar. 2016, US$ billion)
Summary of Financial Data Market Cap Chart
Kyushu Railway Company is a Japan-based company mainly engaged in transportation, construction, station buildings and real estate, distribution and food business, as well as other business around Kyushu in Japan. The Company has 4 business segments. Transportation segment operates railway business, bus business, marine business and car rental business. Construction segment operates construction business, vehicle mechanical equipment engineering business, and electrical construction business. Station Buildings and Real Estate segment engages in leasing of station buildings and other real estate, as well as sale of condominium unit and other real estate. Distribution and Food segment engages in retail industry, catering industry and agriculture industry.
Note: 1 1US$ = 100 JPY.
Source: Reuters.com Source: Bloomberg
Revenue
3,328 3,429 3,548 3,574 3,780
67 60 116 150
-4,331 -5,000-4,000-3,000-2,000-1,000
01,0002,0003,0004,0005,000
Mar-12 Mar-13 Mar-14 Mar-15 Mar-16
(US$
mill
ion)
Revenue Net Profit
Shinkansen bullet train
Commercial/Office building
Restaurant Hotel
0
500
1,000
1,500
2,000
2,500
3,000
0
1,000
2,000
3,000
4,000
5,000
6,000
25-Oct-16 25-Nov-16 25-Dec-16
Turn
over
(U
S$ m
illio
n)
Mar
ket C
ap (
US$
mill
ion)
Turnover(US$ million)
Market Cap(US$ million)
Market Cap (Dec 19,2016): US$ 4.9 billion

16 © 2017 Japan Exchange Group, Inc. and/or its affiliates. All rights reserved.
0
500
1,000
1,500
2,000
2,500
3,000
0
10,000
20,000
30,000
40,000
50,000
60,000
70,000
80,000
90,000
100,000
4-N
ov-1
54-
Dec
-15
4-Ja
n-16
4-Fe
b-16
4-M
ar-1
64-
Apr-
164-
May
-16
4-Ju
n-16
4-Ju
l-16
4-Au
g-16
4-Se
p-16
4-O
ct-1
6
Turn
over
(U
S$ m
illio
n)
Mar
ket C
ap (
US$
mill
ion)
Turnover(US$ million)
Market Cap(US$ million)
Japan Post Holdings Co Ltd
Company Profile/IPO summary
Company Name Japan Post Holdings Co Ltd [TSE 1st: 6178]
President/CEO Taizo Nishimuro Foundation Jan. 23, 2006 IPO Date Nov. 4, 2015 Underwriter Nomura Offering Price JPY1,400 (First Price:JPY1,631)
IPO Amount
(New Shares / Sale) US$6,930 million (NA/US$6,930 million)
Market Cap (offering price/first price)
US$63,000 million /US$73,395 million
WEB http://www.japanpost.jp/en/
Business
Group Structure (After Oct 1, 2012) Business Segment (FY Mar. 2015, US$ billion)
Summary of Financial Data Market Cap Chart
Japan Post Holdings Co., Ltd. is a Japan-based company mainly engaged in postal and logistics business, financial window business, banking business and life insurance business. The Company operates five business segments. The Postal and Logistics Business segment engages in postal business, logistics business as well as other businesses. The Financial Counter Business segment engages in postal and logistics business related counter services, bank counter services, insurance counter services, product sales business, real estate business, partner financial services and other businesses. The Banking segment engages in fund management, financing, asset and liability management, fee-based businesses. The Life Insurance Business segment engages in life insurance business, work proxy and business agent services, as well as simple insurance management business. The Other segment engages in group shared business, hospital business and accommodation business.
Note: 1 1US$ = 100 JPY.
Source: Reuters.com Source: Bloomberg
Operating Income Net Operating Income
Postal Service, $19bn, 12%
Post Office, $13bn,
8%
Bank, $21bn, 13%
Insurance,
$102bn, 65%
Others, $3bn, 2%
Postal Service, $0.0bn,
0%
Post Office, $0.2bn,
2%
Bank, $5.7bn, 46%
Insurance,
$4.9bn, 40%
Others, $1.5bn, 12%
Market Cap (Dec 7, 2015):
US$ 89.9 billion
166.6 158.5 152.4
142.6 142.6
4.7 5.6 4.8 4.8 4.3 0.0
20.0
40.0
60.0
80.0
100.0
120.0
140.0
160.0
180.0
Mar-12 Mar-13 Mar-14 Mar-15 Mar-16
(US$
bill
ion)
Revenue Net Profit
17 © 2017 Japan Exchange Group, Inc. and/or its affiliates. All rights reserved.
0
500
1,000
1,500
2,000
2,500
0
10,000
20,000
30,000
40,000
50,000
60,000
70,000
80,000
90,000
4-N
ov-1
54-
Dec
-15
4-Ja
n-16
4-Fe
b-16
4-M
ar-1
64-
Apr-
164-
May
-16
4-Ju
n-16
4-Ju
l-16
4-Au
g-16
4-Se
p-16
4-O
ct-1
6
Turn
over
(U
S$ m
illio
n)
Mar
ket C
ap (
US$
mill
ion)
Turnover(US$ million)
Market Cap(US$ million)
Japan Post Bank Co Ltd
Company Profile/IPO summary
Company Name Japan Post Bank Co Ltd [TSE 1st: 7182]
President Masatsugu Nagato Foundation Sep. 1, 2006 IPO Date Nov. 4, 2015 Underwriter Nomura Offering Price JPY1,450 (First Price:JPY1,680)
IPO Amount
(New Shares / Sale) US$5,980 million (NA/US$5,980 million)
Market Cap (offering price/first price)
US$65,250 million /US$75,600 million
WEB http://www.jp-bank.japanpost.jp/en_index.html
Business
Business
Summary of Financial Data Market Cap Chart
Japan Post Bank Co., Ltd. is a Japan-based company mainly engaged in banking business. The Bank operates banking business segment. It primarily engages in deposit business, lending business, securities investment business, exchange business, government bonds, investment trust and counter sales of insurance products, intermediary business as well as credit card business. The Bank's main businesses include financing, asset and liability management, as well as fee-based business.
Note: 1 1US$ = 100 JPY.
Source: Reuters.com Source: Bloomberg
1,817
1,774
1,757 1,746
1,756 1,760 1,766
1,777
1,700
1,720
1,740
1,760
1,780
1,800
1,820
1,840
Mar.2008
Mar.2009
Mar.2010
Mar.2011
Mar.2012
Mar.2013
Mar.2014
Mar.2015
Deposit Balance (billion US$)
Japanese Government Bonds, 52%
Japanese Local
Government Bonds, 3%
Japanese Corporate Bonds &
Commercial Paper, 5%
Other securities,
16%
Money Held in Trust, 2%
Due from Banks, etc.,
22%
Asset Management Status (US$ 2.05 trillion, FY Mar 2015)
Market Cap (Dec 28, 2015): US$ 81.0 billion
22.3 21.3 20.8 20.8
19.7
3.3 3.7 3.5 3.7 3.3
0.0
5.0
10.0
15.0
20.0
25.0
Mar-12 Mar-13 Mar-14 Mar-15 Mar-16
(US$
bill
ion)
Gross Operating Profit Net Profit

18 © 2017 Japan Exchange Group, Inc. and/or its affiliates. All rights reserved.
02004006008001,0001,2001,4001,6001,8002,000
0
5,000
10,000
15,000
20,000
25,000
4-N
ov-1
54-
Dec
-15
4-Ja
n-16
4-Fe
b-16
4-M
ar-1
64-
Apr-
164-
May
-16
4-Ju
n-16
4-Ju
l-16
4-Au
g-16
4-Se
p-16
4-O
ct-1
6
Turn
over
(U
S$ m
illio
n)
Mar
ket C
ap (
US$
mill
ion)
Turnover(US$ million)
Market Cap(US$ million)
Japan Post Insurance Co Ltd
Company Profile/IPO summary
Company Name Japan Post Insurance Co Ltd [TSE 1st: 7181]
President/CEO Masami Ishii Foundation Oct. 1, 2007 IPO Date Nov. 4, 2015 Underwriter Nomura Offering Price JPY1,450 (First Price:JPY1,680)
IPO Amount
(New Shares / Sale) US$1,452 million (NA/US$1,452 million)
Market Cap (offering price/first price)
US$13,200 million /US$17,574 million
WEB http://www.jp-life.japanpost.jp/en/index.html
Business
EEV(European Embedded Value)
Summary of Financial Data Market Cap Chart
JAPAN POST INSURANCE Co.,Ltd. is a Japan-based company principally engaged in the insurance business. The Company is engaged in the provision of insurance products, the business agency for other insurance and financial companies, as well as the simple life insurance management business which is commissioned by the management unit, among others.
Note: 1 1US$ = 100 JPY.
Source: Reuters.com Source: Bloomberg
Market Cap (Nov 5, 2015): US$ 23.3 billion
68.6 64.8
59.1 59.6 54.1
0.7 0.9 0.6 0.8 0.8 0.0
10.0
20.0
30.0
40.0
50.0
60.0
70.0
80.0
Mar-12 Mar-13 Mar-14 Mar-15 Mar-16
(US$
bill
ion)
Insurance Premiums Net Profit
16.5 22.4 23.0
17.4 18.9
11.6 6.2
10.9 18.7 12.6
28.1 28.7
33.9 36.1
31.5
0.05.0
10.015.020.025.030.035.040.0
Mar-12 Mar-13 Mar-14 Mar-15 Mar-16
(bill
ion
US$
) Value of in-force covered business EEV
1.7 1.8 1.9
1.5 1.4
0.0
0.5
1.0
1.5
2.0
Mar-12Mar-13Mar-14Mar-15Mar-16
(bill
ion
US$
)
Value of new business
© 2017 Japan Exchange Group, Inc. and/or its affiliates. All rights reserved. 19
1. Executive Summary
2. Overview of the Japanese Market
3. Deep and Diverse Investor Base
4. Listing Requirements of Tokyo Stock Exchange

20 © 2017 Japan Exchange Group, Inc. and/or its affiliates. All rights reserved.
Deep and Diverse Investor Base
Participation by various types of investors in the TSE market creates fair and reliable valuations of its listed companies.
The World's Largest Institutional Investor Japan is the primary investment focus for the Government Pension Investment Fund, Japan (GPIF),
the largest institutional investor in the world. Assets under management at GPIF was valued at US$1.4 trillion1 (Sep. 2015). GPIF’s investments in
foreign stocks accounted for 21.6% of its entire portfolio, an amount valued at US$292 billion1 (Sep. 2015).
There are also other pension funds that manage huge amounts of funds.
High Net Worth Individuals Financial assets held by Japanese individuals stood at US$17.0 trillion as of September 30, 2015. This is comparable to 3 times of Japan's GDP. This is a very high level worldwide.
Accessibility to Japanese Markets for International Investors Foreign investors are the largest players in Japan. The increase in investments by foreign investors
can be seen from their trading value, which reached US$6.8 trillion1, 2 in 2014. Globally reputable investors from many countries have shown interest in the Tokyo market. A TSE
listing promises a company access to investment by international investors.
1
2
Source: GPIF web site, BOJ, World Bank Note: 1 US$= 100 JPY 2 Total amount of buy and sell
3
21 © 2017 Japan Exchange Group, Inc. and/or its affiliates. All rights reserved.
Stock Trading Value by Investor Category (2016) Foreign investors account for more than half of trading in the TSE 1st Section. By contrast, individual investors make up the majority in the TSE 2nd Section, Mothers, and JASDAQ.
Average Daily Trading Value
US$ 26,253 M
TS
E 2
nd S
ecti
on
TS
E 1
st
Se
cti
on
T
SE
Mo
the
rs
TS
E J
AS
DA
Q
Source: Tokyo Stock Exchange Note: 1 US$= 100 JPY
Foreign Investors
62%
Proprietary Trading
16%
Domestic Institutional
Investors 8%
Individuals 14%
Average Daily Trading Value
US$ 1,209 M
Average Daily Trading Value
US$ 495 M
Average Daily Trading Value
US$ 249 M
Foreign Investors
26%
Foreign Investors
28%
Foreign Investors
26%
Individuals 67%
Individuals 64%
Individuals 60%
Domestic Institutional Investors, 5%
Proprietary Trading 2%
Domestic Institutional Investors, 7%
Proprietary Trading, 3%
Domestic Institutional Investors, 8%
Proprietary Trading, 4%

22 © 2017 Japan Exchange Group, Inc. and/or its affiliates. All rights reserved.
TSE is the one of the most liquid Asian Stock Exchanges.
You can list your company smoothly on the market based on your fundraising demand.
54%
58%
62%
66%
70%
International Investors
Foreign investors are the largest players in Japan. The increase of investments by foreign investors can be evidenced by their turnover and share-ownership ratio. Listing on TSE enables a company to access to international investors.
Value of Share Trading (US$ trillion, Dec. 2016)
Ratio of Market Value by Foreign Investors (2016)
58%
17.3 11.1
5.6 2.3 1.8 1.7 1.4 1.3 1.2 0.9
NYSE Nasdaq TokyoStock
Exchange
LSE Group Euronext KoreaExchange
HongKong
Exchanges
DeutscheBoerse
TMXGroup
SIX SwissExchange
Source: WFE
23 © 2017 Japan Exchange Group, Inc. and/or its affiliates. All rights reserved.
The Largest Institutional Investor in the World
The Government Pension Investment Fund (GPIF) is the largest institutional investor in the world. GPIF managed investments valued at JPY134 trillion (US$1.2 trillion) as of the end of March, 2016. GPIF’s
investments in foreign stocks accounted for 22% of its entire portfolio, an amount valued at JPY30 trillion (US$296 billion1) at the end of March, 2016.
GPIF (Japan) remained at the top of the ranking, where it has been since 2002, with AUM totaling almost US$ 1.2 trillion in 2015. This fund is 34% larger than the second fund in the ranking, the Government Pension Fund of Norway (US$ 866 billion).
Source: Pensions & Investments / Willis Towers Watson 300 Analysis - Year end 2015
Percentage of total value of fund assets by country Top 15 World’s Largest Pension Funds
Rank Fund Market Total Assets
US$m 1 Government Pension Investment Japan $1,163,203 2 Government Pension Fund Norway $865,943 3 Federal Retirement Thrift U.S. $443,328 4 National South Korea $435,405 5 ABP Netherlands $384,271 6 National Social Security China $294,939 7 California Public Employees U.S. $285,774 8 Central Provident Fund Singapore $211,373 9 Canada Pension Canada $201,871 10 PFZW Netherlands $186,471 11 California State Teachers U.S. $181,875 12 Local Government Officials Japan $176,160 13 New York State Common U.S. $173,541 14 Employees Provident Fund Malaysia $161,707 15 New York City Retirement Retirement $155,120 8.5%
1.3% 1.4% 1.4% 1.5% 2.0% 2.0% 2.1%
3.1% 3.4%
5.3% 5.4% 5.8% 6.4%
12.0% 38.3%
OtherMalaysia
SingaporeSwitzerland
GermanyChina
DenmarkSweden
SouthAustraliaCanada
UKNorway
NetherlandsJapan
US

24 © 2017 Japan Exchange Group, Inc. and/or its affiliates. All rights reserved.
Equity Purchase by Individual Investors
Period
Initial Public Offerings (IPO)
Total Amount (A)
Approx. Individual Investor Purchases
(B)
Ratio (B/A)
2013 3,739 3,310 89% 2014 7,910 6,885 87% 2015 14,585 12,339 85% 2016 6,487 5,642 87%
2013. 1 - 3 548 490 89% 2013. 4 - 6 167 142 85% 2013. 7 - 9 2,250 1,992 89%
2013.10 – 12 774 686 89% 2014. 1 - 3 3,268 2,802 86% 2014. 4 - 6 621 537 86% 2014. 7 - 9 321 297 93%
2014.10 – 12 3,700 3,248 88% 2015. 1 - 3 349 317 91% 2015. 4 - 6 656 587 89% 2015. 7 - 9 890 777 87%
2015.10 – 12 12,690 10,658 84% 2016. 1 - 3 437 378 86% 2016. 4 - 6 936 836 89% 2016. 7 - 9 904 750 83% 2016.10 - 12 4,209 3,678 87%
(100 million yen)
Source: JSDA
As more than 80% of stocks are allocated to retail investors through IPOs in Japan and 10% - 20% of trading value are coming from retail investors, the stock price will be valued by not only institutional investors but also individual investors.
10%
11%
12%
13%
14%
15%
16%
17%
18%
19%
20%Trading Value Ratio of Individual Investors
(TSE 1st Section) Total amount allocated to individual investors
16.0%
25 © 2017 Japan Exchange Group, Inc. and/or its affiliates. All rights reserved.
Household Financial Assets As household has its financial assets as cash and deposits, which account for 52%, it is seeking for opportunities of investment. The total amount of household financial assets is 18,000 billion USD.
Source: JSDA
(Billion yen)
936,551 25,132 166,755 96,432 524,293 51,098
0 200,000 400,000 600,000 800,000 1,000,000 1,200,000 1,400,000 1,600,000 1,800,000
2016.3Q
Cash and deposits Bonds Stocks and other equities Investment trusts Insurance and pension reserves Others
Note: 1 US$= 100 JPY

26 © 2017 Japan Exchange Group, Inc. and/or its affiliates. All rights reserved.
Long-Term Investment by Retail Investors
Japanese retail investors behave in a different way from institutional investors. They have risk propensities clearly different from those of institutional investors in Europe and the US. The investment held by retail investors for the purpose of short-term trading was only 8% as a percentage of
total investments, while long term holding was 50% and holding for dividend payment or loyalty program specific to investors was 24%.
51% of retail investors hold investments for the average period over 5 years while 32% hold them for the average period of 10 years or more.
1.3%
6.4% 7.7% 14.2% 19.2% 19.3% 31.6%
-1 Month -6 Months -1 year -3 years -5 years -10 years 10 years- N/A
8.3% 1.6%
16.3% 11.6% 11.9% 50.3%
Short-term Other Not decided Shareholder incentives Dividend Long-term※Short-term means “Focus on gains from price increase by trading on a short term basis”. ※Long-term means “Mostly holding on a long-term basis, with possible sales at the time of price appreciation”.
Retail Investors' Investment Policy for Stocks
Retail Investors' Average Holding Period of Stocks
Source: “Survey on securities investment of individual investors” published by Japan Securities Dealers Association on September 15, 2015
© 2017 Japan Exchange Group, Inc. and/or its affiliates. All rights reserved. 27
1. Executive Summary
2. Overview of the Japanese Market
3. Deep and Diverse Investor Base
4. Listing Requirements of Tokyo Stock Exchange

28 © 2017 Japan Exchange Group, Inc. and/or its affiliates. All rights reserved.
Formal Requirements for Listing In the case of dual listing on Main Market, requirements of "market capitalization of tradable shares" and "ratio of tradable shares to listed shares“ do not apply for applicants.
Note: 1US$ = 100JPY
1st Section 2nd Section Standard GrowthNumber of shareholders 2,200 or more 800 or more 200 or more ―
Tradable shares
Number of tradable shares 20,000 unitsor more
4,000 unitsor more
2,000 unitsor more
―
Market capitalization oftradable shares
JPY 1 billion(USD 10m)
or more
JPY 1 billion(USD 10m)
or more
JPY 500 million(USD 5m)or more
―
Ratio of tradable shares tolisted shares 35% or more 30% or more 25% or more ―
Public offering ― ―500 trading units
or more ―
Market capitalization of listedshares
JPY 25 billion(USD 250m)
or more
JPY 2 billion(USD 20m)
or more
JPY 1 billion(USD 10m)
or more―
Number of years of businessoperation 1 year or more ―
Shareholders' equity ―JPY 200 million
(USD 2m) or more Not negative ―
Amount of profits or Marketcapitalization ―
[Ordinary profit]JPY100 million(USD 1m) or more[Market cap]JPY5 billion(USD 50m) or more
― ―
JPY 1 billion (USD 10m) or more
[Ordinary profit]Total amount of JPY500 million (USD 5m) or morein the last 2 fiscal years[Market cap]Market cap: JPY 50 billion (USD 500m) or moreSales: JPY 10 billion (USD 100m) or more
10 percent or moreor 1,000 trading units
200 or more
JPY 500 million(USD 5m)or more
―
―
―
―
Main MarketMothers
JASDAQ TOKYOPRO Market
3 years or more
In the case of dual listing, these requirements do not apply for applicants
In the case of dual listing, these requirements do not apply for applicants.
29 © 2017 Japan Exchange Group, Inc. and/or its affiliates. All rights reserved.
Overview of Listing Examination for Main Board
TSE examines the company, which meets “Formal Requirements” and conducts an examination based on the “Eligibility Requirements.” When applying TSE rules to a foreign country or a foreign corporation where the foreign country or the foreign corporation is an issuer of a listed security, TSE shall also take into account the legal systems, practices and customs in such foreign country or the country
of the foreign corporation.
Corporate Continuity and Profitability – The applicant company must conduct its business continuously and have a stable
revenue base.
Sound Corporate Management – The applicant company must conduct its business in a fair and honest manner.
Effective Corporate Governance and Internal Control System – The applicant company has built an appropriate framework for corporate governance
and internal control.
Appropriate Disclosure of Corporate Information – The applicant company is capable of appropriately disclosing corporate information, etc.
Other Matters deemed necessary in light of Public Interest and Investor Protection a. Shareholders’ rights and exercise of such rights are not unduly restricted. b. Relationship with a parent company is deemed appropriate. c. Other matters are deemed appropriate in light of public interest and investor protection.
1
2
3
4
5

30 © 2017 Japan Exchange Group, Inc. and/or its affiliates. All rights reserved.
Listing Schedule
Depending on the internal systems of the company, however, it takes about one year from kick-off to listing. Note that the company needs to be audited for two business years.
Offering Offering Listing
examination by TSE Listing
examination by TSE Underwriting examination
Underwriting examination
Listing preparation Listing preparation Selection of parties
involved in the listing Selection of parties
involved in the listing
Selection of parties involved in the listing
Lead underwriter Lawyers (specialized
in Japanese law) Lawyers (specialized
in applicant's home country laws)
Audit firm Financial printer Trust and banking company
Preparation of application forms
Underwriting examination by lead underwriters
Lis
tin
g a
pp
lica
tio
n
Lis
tin
g a
pp
rova
l
Lis
tin
g
About 3 months
Identification of issues to be addressed
Design and implementation of system and improvements hereto
1 month
Offering
Listing examination
by TSE
Submission of Confirmation Report prior to Initial Listing Application (for Trading Participant Handling Matters)
Submission of Confirmation Report prior to Initial Listing Application
(for Applicant Company)
31 © 2017 Japan Exchange Group, Inc. and/or its affiliates. All rights reserved.
Listing Examination Schedule
Resolution of board of directors authorizing listing application
Listing Application (Major documents to be submitted) • Application for Listing of Securities • Securities Report for Listing Application • Articles of incorporation • Annual Reports • Business Plan
Approval of listing by TSE (Public announcement)
Filing of the Securities Registration Statement with Prime Minister Filing of the Securities Registration Statement with Prime Minister
Effective date of the Securities Registration Statement Effective date of the Securities Registration Statement
Public offering and sales completed Public offering and sales completed Listing Date
ab
ou
t 3
mo
nth
s
1 m
on
th 15 days
Procedure of public offering
Application entry
Preliminary confirmation
First questions and answers in writing and interview
Second questions and answers in writing and interview
On-site examination
Third questions and answers in writing and interview
Meeting with president, statutory auditor and accounting auditor
Notes:
1. The schedule shown here is a typical example and may be subject to change.
2. TSE shall examine the regulatory system of the home country of an applicant company in preliminary confirmation procedure. Note that, it may take longer time than the others when the applicant company is the first from its country to apply.

32 © 2017 Japan Exchange Group, Inc. and/or its affiliates. All rights reserved.
Roles of Each Party Involved in an IPO
Financial Services Agency
Trust and Banking Company
Lead Underwriter
Issuer
Law Firm (Japanese law
/home country laws)
Audit Firm (foreign audit
firm, etc.)
TSE and JPX Regulation
Listing examination
Consultation and underwriting examination
Submission of a “Sponsor’s Letter of Recommendation”
Filing of statutory disclosure documents
Financial Printer
Legal check and review Legal opinion Assistance in preparing
disclosure documents
Audit (audit opinion)
Printing of prospectus
Assistance in preparing disclosure documents
Shareholder services Dividend payment bank Issuance of JDRs
Lead underwriting agreement
33 © 2017 Japan Exchange Group, Inc. and/or its affiliates. All rights reserved.
IPOs in Japan in 2016 - Underwriters & Accounting Firms
Number of IPOs by Underwriter in Japan in 2016 (Total: 83 Cos) 1, 2
Number of IPOs by Accounting Firm in Japan in 2016 (Total: 83 Cos) 1
Note: 1 The data excludes Tokyo Pro Market, REITs and Infrastructure Funds. 2 Daiwa and Mitsubishi UFJ Morgan Stanley count Menicon’s IPO.
Mizuho, 18Cos, 22%
Nomura, 17Cos, 20%
Daiwa, 15Cos, 18%
SBI, 13Cos, 16%
SMBC Nikko, 12Cos, 14%
Tokai Tokyo, 5Cos, 6%
Mitsubishi UFJ MS,
2Cos, 2%
Ichiyoshi, 1Cos, 1%
SMBC FRIEND, 1Cos, 1%
Ernst & Young
ShinNihon, 28Cos, 34%
Deloitte Touche
Tohmatsu, 23Cos, 28%
KPMG AZSA, 13Cos, 16%
Grant Thornton
Taiyo, 8Cos, 10%
PwC Arata, 3Co, 3%
BDO Sanyu, 3Co, 4%
BDO Toyo, 2Co, 2%
Gyosei, 2Co, 2%
Crowe Horwath
Yusei, 1Co, 1%

© 2017 Japan Exchange Group, Inc. and/or its affiliates. All rights reserved.
Please note that this presentation is for informational purposes only. Japan Exchange Group, Inc. and Tokyo Stock Exchange, Inc. are not responsible for any damage caused by using the information contained herein. Please also note that the information is not guaranteed to be complete, correct, or up-to-date, and may be changed without notice. Unauthorized copying, reproduction, republishing, uploading, posting, transmitting or duplicating any part of the material is prohibited.
【Important Information】
1
How to Activate Equity Trading - Lessons from Japanese Experiences -
October 27, 2016
Seiji Adachi Kanda University of International Studies
Former Chief Strategist for Asian Business, Tokyo Stock Exchange
Contents
2
1. What Attracts Potential Investors to Equity Investment? 2. Investment Day 3. Financial Literacy & Educational Support Activities by JPX 4. Nikkei Annual Investor Relations (IR) Fair (Aug 26 & 27, 2016) 5. Shareholders’ Special Benefit Plan 6. Application to Mongolian Context

2
1. What Attracts Potential Investors to Equity Investment?
3
Hypotheses
Investment returns? Liquidity? Trust in / prestige of the company? Relationship with / expectation in the company? Other benefits?
2. Investment Day (1)
4
Outline & rationale
Nationwide events around ‘Investment Day’ (Oct 4) every year (since 1996)
Main purposes: 1. To enhance financial literacy of the general public, through promoting &
enlightening on financial/securities markets. 2. To develop investors’ base as ‘potential’ clients in the future, through
improving the ‘negative image’ on financial investments among public
JSDA(*) as a lead promoter, supported by JPX & FSA. Regional exchanges also cooperate for the local events. (*) JSDA: An SRO with a legal status of Financial Instruments Firms Association authorized
under the Financial Instruments & Exchange Act. Currently JSDA has about 500 members including securities firms, mainly broking houses & other financial institutions operating securities businesses in Japan.
2016: Events were held at 16 venues with 5,000 participants (2015: 20 venues in 9 districts with 4,117 participants)

3
2. Investment Day (2)
5
Main events
1) Tokyo Investment Forum For disseminating info as widely as possible. Live events also broadcasted through Internet. Lectures & talk shows also held in Osaka.
2) NISA(*) Counters JSDA set up ‘NISA Consulting Counters’ in the lobby of 16 venues for ‘Investment Day’ events, staffed with FPs sent by JSDA. FPs answered any questions from a neutral position & fair perspective about NISA-based equity investment. (*) NISA (Nippon Individual Saving Account): A small lot securities investment scheme exempt
from taxes on dividends & capital gains, etc. to be managed in tax-free accounts.
3) Publication of Feature Articles Summary articles of the event held in Tokyo Forum on leading national newspapers (Half a page sized advertisement on the Nikkei, Asahi & Yomiuri)
4) Dedicated Website on Investment Day Announcement on the events & seminars held at broking houses Quiz designed for the Investment Day Other related information
Venue Tokyo International Forum (nearTokyo Station) Key Note Lecture (18:30-19:20)
‘The future of Japan & how we should protect ourselves through investment’ --- Motoyoshi Itoh, Hon.Prof. University of Tokyo
Guiding information (19:20-19:40)
‘Attention on Investment Fraud’ by JSDA staff
Panel Discussion (19:40-20:40)
‘Financial Literacy could be changing Japan’ Panelist:
- Motoyoshi Itoh, Hon.Prof. University of Tokyo
- Masumi Tsai, Macro Economist - Pack’n & Mack’n, a “Manzai” performer
Moderator: Sohichiro TAHARA (Journalist)
3. Financial Literacy & Educational Support Activities by JPX
6
JPX, taking a leading role in investor education
1) JPX Academy providing information from a neutral viewpoint on
macroeconomic trends, the latest theories, other subjects relevant to asset building & management.
Participants: 5,016 (2013) ➔ 5,100 (2014) ➔ 7,500 (2015)
2) Outreach to schools (elementary to high school) Lectures for students are also available at TSE & OSE along
with short tours to the facilities for feeling the dynamism of economy on-site. Participants: 15,300 (2015)
3) Basic lectures on economy for parents & young children (during holidays) Summer lecture series for parents & children at TSE (for better understanding of equity & other
listed products. TSE & OSE open facilities to group & individual visitors. Participants : 2,600 (2015), 66,000 (up to 2015)
4) Request-based delivery of lecturing(for university or college students) Participants: Around 11,000 students in 190+ times (2015)
5) Joint projects with securities industry group ‘Stock investment program’ offered for students from junior high to university level, in the form of
a game, to help them understand the equity market in simulation-like settings.

4
4. Nikkei Annual Investor Relations (IR) Fair (Aug 26 & 27, 2016)
7
One of the largest-scale investor events in Japan
Venue: Tokyo Big-Sight (int’l convention hall) Number of exhibitors (mainly listed companies):
82 (mainly mid-size ones) In addition, 4 leading asset management
companies (including UBS Securities) & major market-info vendors also opened the booths
Cost per booth: ¥0.8-1.2mn (incl. posting articles on Nikkei newspaper)
weather # of visitors Friday, Oct 26 Fine 7,301 Saturday, Oct 27 Cloudy 8,814
Total 16,115
5. Shareholders’ Special Benefit Plan (1)
8
Outline & typical cases of airline companies
Traditional incentive programs @listed companies: Given to the shareholders, who hold more than a certain number of shares to the vesting date
Implemented at 1,100 out of 3,000 listed companies in Japan.
In addition to the dividend, shareholders of a company are granted a variety of ‘benefits’ related to the products/services of the company. (e.g.) - Discount free air ticket
- Railway free pass
For airline companies (e.g. JAL,ANA), considerable part of the shareholders (especially individuals) buy the shares to take advantage of such benefits usually allocated according to the number of shareholdings.

5
5. Shareholders’ Special Benefit Plan (2)
9
Wide variety of benefits provided to shareholders…
Kikkoman sends its packaged-products set to their shareholders by the end of July every year, and tries to keep long-lasting relationship with them.
Company Type of benefit Minimum investment amount AEON (Super Market)
Cash-back guarantee Voucher (Prepaid Card type)
3% cash-back for owners holding over 100 shares (=min. ¥150,000) 4% cash-back for owners holding over 400 shares
5% cash-back for owners holding over 1,000 shares
7% cash-back for owners holding over 3,000 shares
TDL (Theme Park)
1 day free passport for Tokyo Disney World
Up to once a year for owners holding over 100 shares (=min. ¥650,000) 1 every six months for owners holding 400 shares (up to 2 a year) 2 every six months for owners holding 800 shares (up to 4 a year) 3 every six months for owners holding over 1,200 shares (up to 6 a year) 5 every six months for owners holding over 2,000 share (up to 10 a year)
Kikkoman (largest soy-source maker)
Products assorted set, valued at ¥2,500, sent to every shareowner holding at least 1,000 shares
6. Application to Mongolian Context
10
Creating a virtuous cycle to stimulate the interest of potential investors…
Goal: To ensure the growth of a nation-based economy, through developing a liquid stock market
How: 1st step is to increase potential individual investors through organized programs, even if it takes time.
Why ‘Financial Literacy’? In real life, no one can escape from financial matters, which even improve your QOL. Need to understand finance from basics to a practical level, as ‘life skills’ As the level of financial knowledge improves on an individual basis, promotion of
healthy & quality financial products becomes possible, Which eventually leads to an expansion of the demand for financial assets
Every citizen of can feel secure & enjoy ‘richer’ life on the back of the assets held on an appropriate understanding…
A key to realizing a fair & sustainable society, which even attracts fresh investments from abroad…
‘Rome was not built in a day…’

6
Баярлалаа!
11


![Investor Relations - hanatourcompany.comhanatour]ir_presentation_june... · Investor Relations 1 Investor Relations Jun. 2009.(Korean) 2 ... (cf. 국내소비0.3% 증가, 자료:한국은행,2006)](https://img.dokumen.tips/doc/110x75/5a881d307f8b9a87368ecd91/investor-relations-hanatourirpresentationjuneinvestor-relations-1-investor.jpg)