Embed Size (px)
Citation preview

FEBRUARY 2016 ANNUAL FINANCIAL STATEMENTS
Innovative Solutions. Endless Possibilities.

ContentsApproval of the annual financial statements ifc
Compliance statement by the Company Secretary ifc
Report of the audit and risk committee 1
Independent auditor’s report 3
Report of the directors 4
Statements of financial position 6
Statements of profit and loss and other comprehensive income 7
Consolidated statement of changes in equity 8
Company statement of changes in equity 9
Statements of cash flow 10
Consolidated segmental analysis 11
Notes to the annual financial statements 12
Santova Limited Annual Financial Statements 2016
for the year ended 29 February 2016
COMPLIANCE STATEMENT BY THE
COMPANY SECRETARY
I hereby certify that in terms of section 88(2) of the Companies Act No. 71 of 2008, the Company has filed with the Companies and Intellectual Property Commission all such returns and notices as are required of a public company and that all such returns are true, correct and up to date in respect of the financial year ended 29 February 2016.
JA Lupton FCISCompany SecretaryPractice number: PPG00290
Durban18 May 2016
APPROVAL OF THE
ANNUAL FINANCIAL STATEMENTS
The directors are responsible for the preparation and fair presentation of the annual financial statements of Santova Limited, comprising the statement of financial position as at 29 February 2016 and the statements of comprehensive income, changes in equity and cash flows for the year then ended, and the notes to the financial statements, which include a summary of significant accounting policies and other explanatory notes in accordance with International Financial Reporting Standards (“IFRS”).
The directors are required by Companies Act, 2008 to maintain adequate accounting records and are responsible for the content and integrity of and related financial information included in this report, and for such internal control as the directors determine is necessary to enable the preparation of financial statements that are free from material misstatement, whether due to fraud or error. The external auditors are engaged to express an independent opinion on the annual financial statements and their report is presented on page 3.
The annual financial statements are prepared in accordance with IFRS and are based upon appropriate accounting policies consistently applied and supported by reasonable and prudent judgements and estimates. The directors' responsibility also includes maintaining adequate accounting records and an effective system of risk management as well as the preparation of the supplementary schedules included in the annual financial statements.
The directors acknowledge that they are ultimately responsible for the system of internal financial control established by the company and place considerable importance on maintaining a strong control environment. To enable the directors to meet these responsibilities, the board sets standards for internal control aimed at reducing the risk of error or loss in a cost effective manner. The standards include the proper delegation of responsibilities within a clearly defined framework, effective accounting procedures and adequate segregation of duties to ensure an acceptable level of risk. These controls are monitored and all employees are required to maintain the highest ethical standards in ensuring the company’s business is conducted in a manner that in all reasonable circumstances is above reproach. The focus of risk management in the company is on identifying, assessing, managing and monitoring all known forms of risk across the company. While operating risk cannot be fully eliminated, the company endeavours to minimise it by ensuring that appropriate infrastructure, controls, systems and ethical behaviour are applied and managed within predetermined procedures and constraints.
The directors have made an assessment of the company’s ability to continue as a going concern and there is no reason to believe the business will not be a going concern in the year ahead.
The directors are of the opinion, based on the information and explanations given by management,that the system of internal control provides reasonable assurance that the financial records may be relied on for the preparation of the annual financial statements. However, any system of internal financial control can provide only reasonable, and not absolute, assurance against material misstatement or loss.
PREPARER OF ANNUAL OF FINANCIAL STATEMENTSThe preparation of the consolidated annual financial statements for the year ended 29 February 2016 has been supervised by the group financial director of Santova Limited, Mr D Edley CA (SA).
APROVAL OF THE ANNUAL OF FINANCIAL STATEMENTSThe annual financial statements set out on pages 6 to 57 which have been prepared on the going concern basis, were approved by the board on 18 May 2016 and are signed on its behalf by:
ESC Garner GH GerberChairman Chief Executive Officer
Durban18 May 2016

Santova Limited Annual Financial Statements 2016
FINANCIAL REPORT
1
REPORT OF THE
AUDIT AND RISK COMMITTEE
We are pleased to present our report for the financial year ended 29 February 2016.
The Audit and Risk Committee is an independent statutory committee appointed by the shareholders and its statutory duties are set down in Section 94(7) of the Companies Act. The Board of Directors of Santova Limited has delegated the monitoring of risk management to the Committee and the Company has applied the principles of King III where Audit and Risk Committees are concerned. This report covers all these duties and responsibilities.
COMPOSITION OF COMMITTEE AND ATTENDANCEThe membership of the Committee comprises the three independent non-executive directors, and the Chairman of the Committee is WA Lombard. The Committee met four times during the year and every Committee member attended all four meetings.
The CEO and GFD are permanent invitees to Committee meetings and the external auditors attend by invitation when appropriae.
AUDIT AND RISK COMMITTEE CHARTERThe Audit and Risk Committee has adopted formal terms of reference contained in a Charter that has been approved by the Board of Directors. The Committee has conducted its affairs in compliance with its terms of reference and has discharged its responsibilities contained therein. The Charter is reviewed annually by the Committee and updated as necessary. A copy of the Charter is available on the Company’s website.
ROLE AND RESPONSIBILITIES
Statutory dutiesThe Audit and Risk Committee’s role and responsibilities include statutory duties set down in the Companies Act and are reported on below. The Audit and Risk Committee executed its duties in terms of the requirements of King III. Instances where the principles of King III have either not been applied or have only partially been applied are explained in a report generated by the Institute of Directors of South Africa Governance Assessment Instrument and may be found on the Company’s website.
External auditor appointment and independenceThe Audit and Risk Committee has satisfied itself that the external auditor was independent of the Company, as required by Section 94(8) of the Companies Act, which includes consideration of previous appointments of the auditor and compliance with criteria relating to independence or conflicts of interest as prescribed by the Independent Regulatory Board for Auditors. Requisite assurance was sought and provided by the auditor that internal governance processes within the audit firm support and demonstrate its claim to independence.
The Committee approved a Policy on Non-Audit Services during the year and in line with that policy the external auditor
is not considered for non-audit services in South Africa. However, the external auditor may provide such services to the overseas entities, each of which has its own independent auditors.
The Committee ensured that the appointment of the auditor complied with the Companies Act and any other legislation relating to the appointment of auditors.
The Committee, in consultation with executive management, agreed to the engagement letter, terms, audit plan and budgeted audit fees for the 2016 financial year.
During the year under review, the Committee met with the external auditors without management being present and also met with management without the external auditors being present. No issues of any significance were raised by either the external auditors or Management at these meetings.
The Committee has nominated for election at the Annual General Meeting Deloitte & Touche as the external auditor and B Botes as the designated auditor responsible for performing the functions of auditor for the 2017 financial year. The Committee has satisfied itself that the audit firm and designated auditor are accredited as such on the JSE‘s list of auditors and their advisors.
Financial statements and accounting practicesThe Audit and Risk Committee has reviewed the accounting policies and the financial statements of the Company and the Group and is satisfied that they are appropriate and comply with International Financial Reporting Standards.
An Audit and Risk Committee process has been established to receive and deal appropriately with any concerns and complaints relating to the reporting practices of the Company. No matters of significance have been raised in the past financial year.
Internal financial controlsThe Audit and Risk Committee has overseen a process by which it has assured itself of the effectiveness of the Company’s system of internal controls and risk management, including internal financial controls through assurance received from formal financial, legal, IT and customs reports provided by management and external and internal assurance providers. Based on this assurance, the Audit and Risk Committee made a recommendation to the Board in order for the Board to report thereon. The Board report referring to the effectiveness of the system of internal controls is included in the Approval of these Annual Financial Statements on the inside front cover. The Audit and Risk Committee supports the opinion of the Board in this regard.
DUTIES ASSIGNED BY THE BOARDIn addition to the statutory duties of the Audit Committee as reported above, and in accordance with the provisions of the Companies Act, the Board of Directors has determined further functions for the Audit and Risk Committee to perform, which are set out in the Audit and Risk Committee’s Charter. These functions include the following:
for the year ended 29 February 2016

Santova Limited Annual Financial Statements 20162
INTEGRATED REPORTING AND COMBINED ASSURANCEThe Audit and Risk Committee fulfils an oversight role regarding the Company’s integrated report and the reporting process.
The Audit and Risk Committee considered the Company’s sustainability information as disclosed in the integrated report and has assessed its consistency with operational and other information known to Audit and Risk Committee members, and for consistency with the Annual Financial Statements. The Audit and Risk Committee discussed the sustainability information as contained in the Sustainability Report with management. The Board of Directors does not believe that the Company is at the stage of its development that warrants the cost of appointing either a sustainability committee or an external assurance provider. The Audit and Risk Committee is satisfied that the Company has optimised the assurance coverage obtained from management, internal and external assurance providers in accordance with an appropriate combined assurance model.
GOING CONCERNThe Audit and Risk Committee has reviewed a documented assessment, including key assumptions, prepared by management of the going concern status of the Company and the Group and has made recommendations to the Board. The Board’s statement on the going concern status of the Company and the Group, as supported by the Audit Committee, may be found in the Directors’ Approval of the Financial Statements on the inside front cover of these Annual Financial Statements.
GOVERNANCE OF RISKThe Board has assigned oversight of the Group’s risk management function to the Audit and Risk Committee. The Committee is assisted in this task by the internal Risk Management Committee, the IT Risk Management Committee and the Social and Ethics Committee where appropriate.
Further detailed information on the governance of risk and members of the relevant sub-committees can be found in the Risk Management Report on pages 30 of the Annual Integrated Report.
The Audit and Risk Committee members are of the opinion that all identified risks appropriate to the business are being well managed by the management team.
Internal auditThe Group does not have an internal audit department as envisaged by King III as the Board of Directors does not believe that, at this stage in the Group’s development, a fully-fledged independent internal audit function is justified. Management, the Board and the Audit and Risk Committee have taken responsibility for ensuring an appropriate internal control environment by properly identifying all material risks, both financial and other, and mitigating those through the implementation of appropriate controls and action plans.
Whilst there is not a specifically designated internal audit department, there are a number of specialised individuals, divisions and committees within the Group who review high risk areas on a continuous basis. This includes role players who are independent of the subsidiaries and/or business units that they review and audit. Furthermore, there is a specialised network of independent suppliers whose role assists in the audit of risk within the Group. In addition, the Group Exco team, during their visits to subsidiary companies, regularly review the internal controls adopted at subsidiary level for both adequacy and effectiveness.
The Audit and Risk Committee oversees the adequacy and effectiveness of controls through a process of robust and regular feedback from management, including quarterly risk reports from the Group Financial Director and Group Legal Advisor. The external audit function, as well as other external assurances (auditing areas such as tax, customs, IT, training and development, quality assurance, B-BBEE and Employment Equity to name a few), also provide a degree of comfort in that certain controls are reviewed during the course of these audits and any shortcomings identified are reported to the Audit and Risk Committee.
The Committee, together with management, ensures implementation of programmes for corrective action where necessary.
The Committee can affirm that nothing has come to its attention, or to the attention of the external auditors, that would indicate any material breakdown in the adequacy or effectiveness of the internal controls of the Group during the financial year.
The Audit and Risk Committee is satisfied that it complied with its legal, regulatory and other responsibilities.
Evaluation of the expertise and experience of the financial director and finance functionThe Audit and Risk Committee has satisfied itself that the Group Financial Director for the period under review and up to the date of this report, possessed the appropriate experience and expertise to meet his responsibilities in that position.
The Audit and Risk Committee has considered, and has satisfied itself of the appropriateness of the expertise and adequacy of resources of the finance function and experience of the senior members of management responsible for the financial function.
Approval of Annual Integrated Report and Annual Financial StatementsThe Committee reviewed the Annual Integrated Report and these audited Annual Financial Statements for the year ended 29 February 2016 and recommended them to the Board for approval.
WA LombardChairman
18 May 2016
REPORT OF THE
AUDIT AND RISK COMMITTEE CONTINUEDfor the year ended 29 February 2016

Santova Limited Annual Financial Statements 2016
FINANCIAL REPORT
3
INDEPENDENT
AUDITOR’S REPORT
We have audited the consolidated and separate financial statements of Santova Limited set out on pages 6 to 57, which comprise the statements of financial position as at 29 February 2016, and the statements of profit or loss and other comprehensive income, statements of changes in equity and statements of cash flows for the year then ended, and the notes, comprising a summary of significant accounting policies and other explanatory information.
DIRECTORS’ RESPONSIBILITY FOR THE CONSOLIDATED AND SEPARATE FINANCIAL STATEMENTSThe company’s directors are responsible for the preparation and fair presentation of these consolidated and separate financial statements in accordance with International Financial Reporting Standards and the requirements of the Companies Act of South Africa, and for such internal control as the directors determine is necessary to enable the preparation of consolidated and separate financial statements that are free from material misstatement, whether due to fraud or error.
AUDITOR’S RESPONSIBILITY Our responsibility is to express an opinion on these consolidated and separate financial statements based on our audit. We conducted our audit in accordance with International Standards on Auditing. Those standards require that we comply with ethical requirements and plan and perform the audit to obtain reasonable assurance about whether the consolidated and separate financial statements are free from material misstatement.
An audit involves performing procedures to obtain audit evidence about the amounts and disclosures in the financial statements. The procedures selected depend on the auditor’s judgement, including the assessment of the risks of material misstatement of the financial statements, whether due to fraud or error. In making those risk assessments, the auditor considers internal control relevant to the entity’s preparation and fair presentation of the financial statements in order to design audit procedures that are appropriate in the circumstances, but not for the purpose of expressing an opinion on the effectiveness of the entity’s internal control. An audit also includes evaluating the appropriateness of accounting policies used and the reasonableness of accounting estimates made by management, as well as evaluating the overall presentation of the financial statements.
We believe that the audit evidence we have obtained is sufficient and appropriate to provide a basis for our audit opinion.
OPINION In our opinion, the consolidated and separate financial statements present fairly, in all material respects, the consolidated and separate financial position of Santova Limited as at 29 February 2016, and its consolidated and separate financial performance and consolidated and separate cash flows for the year then ended in accordance with International Financial Reporting Standards and the requirements of the Companies Act of South Africa.
OTHER REPORTS REQUIRED BY THE COMPANIES ACT As part of our audit of the consolidated and separate financial statements for the year ended 29 February 2016, we have read the Report of the Directors, the Report of the Audit and Risk Committee and the Compliance Statement by the Company Secretary for the purpose of identifying whether there are material inconsistencies between these reports and the audited consolidated and separate financial statements. These reports are the responsibility of the respective preparers. Based on reading these reports we have not identified material inconsistencies between these reports and the audited consolidated and separate financial statements. However, we have not audited these reports and accordingly do not express an opinion on these reports.
REPORT ON OTHER LEGAL AND REGULATORY REQUIREMENTSIn terms of the Independent Regulatory Board for Auditors (IRBA) Rule published in Government Gazette Number 39475 dated 4 December 2015, we report that Deloitte & Touche has been the auditor of Santova Limited for 8 years.
Deloitte & ToucheRegistered Auditors
Per: Brian BotesPartner
18 May 2016
PO Box 243 Deloitte & ToucheDurban 4000 Registered AuditorsSouth Africa Audit – KZN Deloitte Place 2 Pencarrow Crescent
Pencarrow ParkLa Lucia Ridge Office Estate
La Lucia 4051Docex 3 Durban
Tel: +27 (0)31 560 7000Fax: +27 (0)31 560 7351
www.deloitte.com
National Executive: *LL Bam Chief Executive *AE Swiegers Chief Operating Officer *GM Pinnock Audit *N Sing Risk Advisory *NB Kader Tax TP Pillay Consulting S Gwala BPaas *K Black Clients & Industries *JK Mazzocco Talent & Transformation *MJ Jarvis Finance *M Jordan Strategy *MJ Comber Reputation & Risk *TJ Brown Chairman of the BoardRegional Leader: *R RedfearnA full list of partners and directors is available on request *Partner and Registered AuditorB-BBE rating: Level 2 contributor in terms of the Chartered Accountancy Profession Sector CodeMember of Deloitte Tohmatsu Limited

Santova Limited Annual Financial Statements 20164
for the year ended 29 February 2016
The directors have the pleasure of presenting their annual report for the year ended 29 February 2016 which forms part of the audited annual financial statements.
NATURE OF BUSINESSThe principal business of the Group is the supply of innovative global logistics solutions for international and domestic clients, which entails taking responsibility for the entire supply chain, moving goods by sea, air, road and rail from supplier to consumer internationally. This includes the provision of other value added services to clients such as supply chain analysis, financial services and information technology systems.
GROUP RESULTS The profit for the year attributable to equity holders of the parent amounted to R48,713 million (2015: R38,525 million), which represents basic earnings per share of 34,50 cents (2015: 28,23 cents).
The financial results of the Group, including its financial position, results of its operations for the period under review and detailed notes thereto, are set out in the attached annual financial statements on pages 6 to 57.
DIVIDENDS The directors have declared a final dividend of 5,50 cents (2015: 4,25 cents) per ordinary share, payable to shareholders as follows:
Date of declaration: 18 May 2016Last day to trade cum-dividend: 17 June 2016Trading ex-dividend commences: 20 June 2016Record date: 24 June 2016Payment date: 27 June 2016
SHARE CAPITAL During the year under review there were no changes to the authorised share capital of the Company but the Company issued a further 21 138 088 shares, 16 244 668 through a general issue of shares for cash and 4 893 420 ordinary shares to the vendors of Tradeway (Shipping) Limited, registered in the United Kingdom.
The total issued shares in the Company as at financial year-end amounted to 157 597 496 ordinary shares of no par value (2015: 136 459 408 shares).
CONTROLLING AND MAJOR SHAREHOLDERS As at financial year-end there were 3 735 (2015: 2 656) shareholders in the Company and controlling and major shareholders holding in excess of 5% of the Company’s share capital are detailed on page 56 of the Annual Integrated Report.
SUBSEQUENT EVENTS No material fact or circumstance has occurred between year-end and the date of this report which has a material impact on the financial position of the Company or Group.
SUBSIDIARY COMPANIES Full details of the Company’s subsidiaries and investments therein, as at year-end, are listed in note 4 to the attached annual financial statements, and may be found on page 29.
SPECIAL RESOLUTIONS The following special resolutions were passed by the holding company and its subsidiaries in the year under review:
Holding company• Approval of non-executive directors’ remuneration: 2015/2016: 28 July 2015;
• General authority to provide financial assistance in terms of section 44 of the Companies Act: 28 July 2015;
• General authority to provide financial assistance in terms of section 45 of the Companies Act: 28 July 2015; and
• General authority to buy own shares: 28 July 2015.
REPORT OF THE DIRECTORS
for the year ended 29 February 2016
Santova Limited Annual Financial Statements 2016
FINANCIAL REPORT
5
Santova Logistics (Pty) Ltd• General authority to provide financial assistance in terms of section 45 of the Companies Act: 28 July 2015;
• Specific authority to provide financial assistance in the form of a R60 million Suretyship (incorporating Cession of Claims) in favour of Nedbank Limited for the obligations of Santova Limited: 11 November 2015; and
• Specific authority to provide financial assistance in the form of a R2 million Suretyship (incorporating Cession of Claims) in favour of Nedbank Limited for the obligations of Santova Administration Services (Pty) Limited: 18 December 2015.
Santova Express (Pty) Ltd• General authority to provide financial assistance in terms of section 45 of the Companies Act: 28 July 2015.
Santova Administration Services (Pty) Ltd• General authority to provide financial assistance in terms of section 45 of the Companies Act; 28 July 2015;
• Approval of the acquisition by Santova Administration Services (Pty) Ltd of Tradeway (Shipping) Limited, registered in the United Kingdom: 23 October 2015;
• Specific authority to provide financial assistance in the form of a R60 million Suretyship (incorporating Cession of Claims) in favour of Nedbank Limited for the obligations of Santova Limited: 11 November 2015.
Santova Financial Services (Pty) Ltd• General authority to provide financial assistance in terms of section 45 of the Companies Act; 28 July 2015;
DIRECTORS The directors of the Company during the financial year and at the date of this report were as follows:
Non-executive ExecutiveESC Garner, Chairman GH Gerber, Chief Executive OfficerAD Dixon DC Edley, Group Financial Director WA Lombard AL van ZylEM Ngubo
DIRECTORS’ INTERESTS Details of the direct and indirect beneficial and non-beneficial interests of directors of the Company and directors of its subsidiary companies in the share capital of the Company as at 29 February 2016 are contained on page 57 of the Annual Integrated Report.
COMPANY SECRETARY The Secretary of the Company is JA Lupton, FCIS, whose business and postal addresses are:
Highway Corporate Services (Pty) Limited14 Hillcrest Office Park PO Box 13192 Old Main Road HillcrestHillcrest 36503610
SHARE REGISTRARS The share registrars are Computershare Investor Services (Pty) Limited, whose business and postal addresses are:
70 Marshall Street PO Box 61051Johannesburg Marshalltown2001 2107
AUDITOR Deloitte & Touche are the auditors of the Company.
NUMBER OF EMPLOYEES The number of permanent employees within the Group as at 29 February 2016 was 321 (2015: 284).

Santova Limited Annual Financial Statements 20166
STATEMENTS OF
FINANCIAL POSITIONas at 29 February 2016
Consolidated Consolidated Company Company2016 2015 2016 2015
Notes R’000 R’000 R’000 R’000
ASSETSNon-current assets 262 221 140 652 134 152 132 990
Property, plant and equipment 2 25 086 7 933 732 924 Intangible assets 3 222 881 122 264 4 352 3 200 Investments in subsidiaries 4 – – 127 424 126 885 Financial assets 5 4 536 3 235 – – Deferred taxation 6 9 718 7 220 1 644 1 981
Current assets 760 944 592 834 109 281 8 984
Trade receivables 7 590 133 495 162 247 937 Other receivables 7 46 743 52 738 362 362 Current tax receivable 385 45 – – Amounts owing from related parties 8 – – 104 959 4 388 Financial assets 5 26 – – – Cash and cash equivalents 123 657 44 889 3 713 3 297
Total assets 1 023 165 733 486 243 433 141 974
EQUITY AND LIABILITIESCapital and reserves 386 415 230 289 177 118 113 492
Stated capital 9 214 076 145 192 214 076 145 192 Treasury shares (998) – – – Equity compensation reserve 24 3 028 1 703 3 028 1 703 Foreign currency translation reserve 62 044 20 445 – – Accumulated profit/(loss) 102 027 59 090 (39 986) (33 403)
Attributable to equity holders of the parent 380 177 226 430 177 118 113 492 Non-controlling interests 6 238 3 859 – –
Non-current liabilities 76 329 20 500 48 640 1 700
Interest-bearing borrowings 10 57 043 18 800 47 140 – Long-term provision 11 1 500 1 700 1 500 1 700 Financial liabilities 5 17 786 – – –
Current liabilities 560 421 482 697 17 675 26 782
Trade and other payables 216 154 173 826 2 359 1 903 Current tax payable 8 000 2 710 68 – Current portion of interest-bearing borrowings 10 18 620 8 088 9 743 – Amounts owing to related parties 12 302 216 – 21 920 Financial liabilities 5 31 348 1 447 – – Short-term borrowings and overdrafts 13 262 918 280 838 – – Short-term provisions 14 23 079 15 572 5 505 2 959
Total equity and liabilities 1 023 165 733 486 243 433 141 974

Santova Limited Annual Financial Statements 2016
FINANCIAL REPORT
7
for the year ended 29 February 2016
STATEMENTS OF PROFIT AND LOSS AND OTHER COMPREHENSIVE INCOME
Consolidated Consolidated Company Company2016 2015* 2016 2015
Notes R’000 R’000 R’000 R’000
Gross billings 15 3 797 890 3 462 792 38 472 33 200 Revenue 15 278 655 224 235 35 557 29 820 Other income 11 196 15 952 23 7 074 Depreciation and amortisation (4 043) (3 311) (1 409) (1 129) Administrative expenses (215 022) (182 742) (31 918) (31 436)
Operating profit 16 70 786 54 134 2 253 4 329 Interest received 18 205 231 286 51 Finance costs 19 (4 255) (2 979) (2 936) (1 407)
Profit/(loss) before taxation 66 736 51 386 (397) 2 973 Income tax 20 (16 841) (12 166) (405) 37
Profit/(loss) for the year 49 895 39 220 (802) 3 010 Attributable to:Equity holders of the parent 48 713 38 525 (802) 3 010 Non-controlling interests 1 182 695 – –
Other comprehensive income Items that may be reclassified subsequently to profit or loss – Exchange differences arising from translation of foreign operations 42 796 (4 144) – – – Net actuarial gain on remeasurement of post-retirement medical
aid benefit liability 18 – 18 –
Total comprehensive income/(loss) 92 709 35 076 (784) 3 010
Attributable to:Equity holders of the parent 90 330 34 650 (784) 3 010 Non-controlling interests 2 379 426 – –
Basic earnings per share (cents) 21 34,50 28,23 – – Diluted basic earnings per share (cents) 21 33,68 27,73 – – Dividends per share (cents) 5,50 4,25 – –
* Restated due to voluntary change in presentation and classification as detailed in note 15.2

Santova Limited Annual Financial Statements 20168
for the year ended 29 February 2016
CONSOLIDATED STATEMENT OF
CHANGES IN EQUITY
Attributable to equity holders of the parent
Stated capital
Treasuryshares
Equity com-
pensationreserve
Foreign currency
translation reserve
Accu-mulated
profit Total
Non-controlling
interests Total
equity R’000 R’000 R’000 R’000 R’000 R’000 R’000 R’000
Balances at 28 February 2014 145 192 – 565 24 320 25 000 195 077 3 433 198 510 Total comprehensive income – – – (3 875) 38 525 34 650 426 35 076 Share-based equity reserve charged to profit and loss – – 1 142 – – 1 142 – 1 142 Foreign currency differences on translation of share-based
equity reserve – – (4) – – (4) – (4)Dividends paid to shareholders – – – – (4 435) (4 435) – (4 435)
Balances at 28 February 2015 145 192 – 1 703 20 445 59 090 226 430 3 859 230 289
Total comprehensive income – – – 41 599 48 731 90 330 2 379 92 709 Share-based equity reserve charged to profit and loss – – 1 335 – – 1 335 – 1 335 Foreign currency differences on translation of share-based
equity reserve – – (10) – – (10) – (10)Treasury shares acquired – (998) – – – (998) – (998)General issue of shares 51 282 – – – – 51 282 – 51 282 Vendor issue of shares to sellers of Tradeway (Shipping) Limited 17 714 – – – – 17 714 – 17 714 Costs to issue securities (112) – – – – (112) – (112)Dividends paid to shareholders – – – – (5 794) (5 794) – (5 794)
Balances at 29 February 2016 214 076 (998) 3 028 62 044 102 027 380 177 6 238 386 415

Santova Limited Annual Financial Statements 2016
FINANCIAL REPORT
9
Stated capital
Equity com-
pensationreserve
Accu-mulated
loss
Total R’000 R’000 R’000 R’000
Balances at 28 February 2014 145 192 565 (31 978) 113 779 Total comprehensive income – – 3 010 3 010 Share-based equity reserve charged to profit and loss – 1 142 – 1 142 Foreign currency differences on translation of share-based equity reserve – (4) – (4)Dividends paid to shareholders – – (4 435) (4 435)
Balances at 28 February 2015 145 192 1 703 (33 403) 113 492
Total comprehensive loss – – (784) (784)Share-based equity reserve charged to profit and loss – 1 335 – 1 335 Foreign currency differences on translation of share-based equity reserve – (10) – (10)General issue of shares 51 282 – – 51 282 Vendor issue of shares to sellers of Tradeway (Shipping) Limited 17 714 – – 17 714 Costs to issue securities (112) – – (112)Dividends paid to shareholders – – (5 799) (5 799)
Balances at 29 February 2016 214 076 3 028 (39 986) 177 118
COMPANY STATEMENT OF
CHANGES IN EQUITYfor the year ended 29 February 2016

Santova Limited Annual Financial Statements 201610
for the year ended 29 February 2016
STATEMENTS OF
CASH FLOWS
Consolidated Consolidated Company Company2016 2015* 2016 2015
Notes R’000 R’000 R’000 R’000
OPERATING ACTIVITIESCash generated from operations 22.1 48 226 46 138 7 850 2 926 Interest received 205 91 286 51 Finance costs (3 628) (2 976) (2 936) (1 025)Taxation paid 22.2 (14 389) (14 609) – –
Net cash generated by operating activities 30 414 28 644 5 200 1 952
INVESTING ACTIVITIESPlant and equipment acquired (3 041) (1 939) (157) (262)Intangible assets acquired and developed (3 220) (1 076) (2 212) (1 042)Proceeds on disposals of plant and equipment and intangible assets 310 496 1 12 Increase in amounts owing from related parties – – (82 748) (2 848) Dividends received – 1 200 – – Net cash flows on acquisition of subsidiaries 22.3 (59 275) (3 438) – –
Net cash used by investing activities (65 226) (4 757) (85 116) (4 140)
FINANCING ACTIVITIESBorrowings raised/(repaid) 48 775 (9 439) 56 883 – Issue of shares for cash 51 170 – 51 170 –Treasury shares acquired (998) – – –Increase in amounts owing to related parties 86 12 (21 922) 7 971 Dividends paid (5 794) (4 435) (5 799) (4 435)
Net cash generated/(used) by financing activities 93 239 (13 862) 80 332 3 536
Net increase in cash and cash equivalents 58 427 10 025 416 1 348 Difference arising on translation 19 576 (1 979) – – Cash and cash equivalents at beginning of year 44 889 36 843 3 297 1 949
Cash and cash equivalents at end of year 122 892 44 889 3 713 3 297
Cash and cash equivalents are made up as follows:Cash and cash equivalents 123 657 44 889 3 713 3 297Less: Bank overdrafts (765) – – –
Cash and cash equivalents at end of year 122 892 44 889 3 713 3 297
* Restated due to voluntary change in presentation and classification as detailed in note 15.2.

Santova Limited Annual Financial Statements 2016
FINANCIAL REPORT
11
Logistics Services
Financial Services
Head Office Consolidated
BUSINESS SEGMENTS R’000 R’000 R’000 R’000
29 February 2016Gross billings 3 902 726 9 978 38 472 3 951 176
External 3 788 217 8 973 700 3 797 890 Internal 114 509 1 005 37 772 153 286
Revenue 269 177 9 978 (500) 278 655 Depreciation and amortisation (2 580) (48) (1 415) (4 043) Operating profit 64 916 4 493 1 377 70 786Interest received 1 361 683 (1 839) 205 Finance costs (2 850) – (1 405) (4 255) Income tax (15 351) (1 085) (405) (16 841)
Profit/(loss) for the year 48 076 4 091 (2 272) 49 895
Total assets 859 903 10 077 153 185 1 023 165
Total liabilities 563 073 840 72 837 636 750
28 February 2015*Gross billings 3 533 024 9 795 33 200 3 576 019
External 3 453 598 8 633 561 3 462 792 Internal 79 426 1 162 32 639 113 227
Equity holders of the parent 215 249 9 795 (809) 224 235 Depreciation and amortisation (2 144) (38) (1 129) (3 311)Operating profit 47 559 3 769 2 806 54 134 Interest received 1 187 472 (1 428) 231 Finance costs (3 048) – 69 (2 979)Income tax (11 426) (778) 38 (12 166)
Profit for the year 34 272 3 463 1 485 39 220
Total assets 661 452 733 486 62 176 733 486
Total liabilities 517 846 1 461 (16 110) 503 197
LOGISTICS SERVICES
Africa Asia
Pacific United
Kingdom Europe Total GEOGRAPHICAL SEGMENTS R’000 R’000 R’000 R’000 R’000
29 February 2016Gross billings 2 709 556 193 080 402 910 482 671 3 788 217Revenue 131 234 24 977 54 446 58 520 269 177 Net profit 18 271 5 092 11 426 13 287 48 076
Total assets 519 764 59 744 194 263 86 132 859 903
Total liabilities 413 121 21 001 75 720 53 231 563 073
28 February 2015*Gross billings 2 842 967 195 233 214 871 279 953 3 533 024 Revenue 123 453 21 971 32 590 37 235 215 249 Net profit 15 780 4 783 5 765 7 944 34 272
Total assets 534 357 36 368 46 392 44 335 661 452
Total liabilities 445 820 11 513 28 885 31 628 517 846
* Restated due to voluntary change in presentation and classification as detailed in note 15.2
CONSOLIDATED
SEGMENTAL ANALYSISfor the year ended 29 February 2016

Santova Limited Annual Financial Statements 201612
NOTES TO THE
ANNUAL FINANCIAL STATEMENTSfor the year ended 29 February 2016
1. ACCOUNTING POLICIES Santova Limited is incorporated in South Africa and listed on the Main Board of the JSE Limited.
The principal activities of the Company and its subsidiaries (“the Group”) are described on page 4.
1.1 Basis of preparation
The financial statements have been prepared in accordance with International Financial Reporting Standards (“IFRS”) and interpretations adopted by the International Accounting Standards Board (“IASB”), the requirements of the South African Companies Act, No. 71 of 2008, as amended, and the JSE Listings Requirements.
The financial statements have been prepared on the historical cost basis except for the revaluation of certain financial assets and derivatives accounted for at fair value through the statement of comprehensive income.
The financial statements are presented in South African Rand, which is the Company’s functional currency. All financial information has been rounded to the nearest Rand thousand (“R’000”), except where otherwise indicated.
The principal accounting policies are set out below and have been applied consistently to all periods presented in these financial statements. Comparative figures are restated in the event of a change in accounting policy or a prior period error.
The preparation of financial statements in conformity with IFRS require management to make judgements, estimates and assumptions that affect the application of policies and reported amounts of assets, liabilities, income and expense. Although estimates and associated assumptions are based on historical experience and various other factors that are believed to be reasonable under the circumstances and which form the basis of making judgements about carrying values of assets and liabilities, the actual outcome may differ from these estimates.
The estimates and underlying assumptions are reviewed on an ongoing basis. Revisions to accounting estimates are recognised in the period in which the estimate is revised, if the revision affects only that period, or in the period of revision and future periods if the revision affects both current and future periods.
Judgements made in the application of IFRS that have had an effect on the financial statements and estimates with a risk of adjustment in the next year are discussed in note 1.25.
Recognised amounts in the financial statements are adjusted to reflect events arising after the reporting period date that provide additional evidence of conditions that existed at such date. Events after the reporting period date that are indicative of conditions that arose after the reporting period date are dealt with by way of a note.
1.2 Basis of consolidation
The consolidated financial statements incorporate the financial statements of the Company and entities controlled by the Company. Control is achieved if and only if the Company has all of the following elements:
• power over the investee i.e. the Company has existing rights that give it the ability to direct the relevant activities (the activities that significantly affect the investee’s returns);
• exposure, or rights, to variable returns from its involvement with the investee; and
• the ability to use its power over the investee to affect the amount of the Company’s returns.
The results of subsidiaries acquired or disposed of during the year are included in the consolidated statement of comprehensive income from the effective date of acquisition or up to the effective date of disposal, being the date that control commences or until the date control ceases, as appropriate.
The assets and liabilities of companies acquired are assessed and included in the statement of financial position at their estimated fair values to the Group at acquisition date.
All inter-group transactions, balances, income and expenses are eliminated in full on consolidation.
The financial statements of subsidiaries are prepared for the same reporting period as the parent company, in accordance with the relevant accounting standards and policies applicable to the jurisdiction in which the subsidiary operates, using consistent accounting policies. Where material differences exist, adjustments are made to the financial statements of subsidiaries upon consolidation to bring their accounting policies into line with those of the Group.
Minority interests in the net assets (excluding goodwill) of consolidated subsidiaries are identified separately from the Group’s equity therein. The interest of minority shareholders in the acquiree is initially measured at the minority’s proportion of the net fair value of the assets, liabilities and contingent liabilities recognised at the date of the original acquisition and the minority’s share of changes in equity since that date.
The Company carries its investments in subsidiaries at cost less accumulated impairment losses.

Santova Limited Annual Financial Statements 2016
FINANCIAL REPORT
13
1.3 Business combinations
Acquisitions of subsidiaries and businesses are accounted for using the purchase method. The cost of the business combination is measured as the aggregate of the fair values (at the date of exchange) of assets given, liabilities incurred or assumed, and equity instruments issued by the Group in exchange for control of the acquiree.
The acquiree’s identifiable assets, liabilities and contingent liabilities that meet the conditions for recognition under IFRS 3: Business Combinations are recognised at their fair values at the acquisition date, except for non-current assets that are classified as held for sale in accordance with IFRS 5: Non-current Assets Held for Sale and Discontinued Operations, which are recognised and measured at fair value less costs to sell.
Goodwill arising on acquisition is recognised as an asset and initially measured at cost, being the excess of the cost of the business combination over the Group’s interest in the net fair value of the identifiable assets, liabilities and contingent liabilities recognised.
If the cost of the acquisition is less than the Group’s interest in the net fair value of the acquiree’s identifiable assets, liabilities and contingent liabilities, the difference is recognised directly in the statement of comprehensive income.
1.4 Translation of foreign currency financial statements
The individual financial statements of each Group entity are presented in the currency of the primary economic environment in which the entity operates (its functional currency). For the purpose of the consolidated financial statements, the results and financial position of each Group entity are expressed in South African Rand.
For the purpose of presenting consolidated financial statements, the assets and liabilities of the Group’s foreign operations are expressed in Rand using exchange rates prevailing at the reporting date. Income and expense items are translated at the average exchange rates for the period, unless exchange rates fluctuated significantly during that period, in which case the exchange rates at the dates of the transactions are used. Exchange differences arising, if any, are classified as equity and recognised in the Group’s foreign currency translation reserve. Such exchange differences are recognised in profit or loss in the period in which the foreign operation is disposed of.
Goodwill and fair value adjustments arising on the acquisition of a foreign entity are treated as assets and liabilities of the foreign entity and translated at the closing rate.
1.5 Property, plant and equipment
Property, plant and equipment are stated at cost less accumulated depreciation and accumulated impairment losses. Cost includes expenditure that is directly attributable to the acquisition of the assets.
Depreciation is calculated on a systematic basis to reduce the cost of each asset to its estimated residual value over the estimated useful life of the asset as follows:
Land and buildings 40 years Plant and equipment 5 to 20 years Motor vehicles 4 to 6 years Furniture and fittings 5 to 20 years Leasehold improvements 5 years or lease period Office equipment 3 to 10 years Computer equipment 3 to 10 years
The residual values, useful lives and methods of depreciation for each asset are reviewed, and adjusted if appropriate, at each reporting date, with the effect of any changes in estimate being accounted for on a prospective basis.
An item of plant and equipment is derecognised upon disposal or when no future economic benefits are expected from its use or disposal. Any gain or loss arising on derecognition of the asset (calculated as the difference between the net disposal proceeds and the carrying amount of the asset) is included in profit or loss in the year the asset is derecognised.
Land and buildings acquired as a result of the acquisition of Tradeway (Shipping) Limited are valued using the revaluation model in terms of IAS 16: Property, Plant and Equipment and are carried at fair value less accumulated depreciation and accumulated impairment losses. Land and buildings are revalued regularly.
1.6 Intangible assets
Intangible assets acquired separately Intangible assets acquired separately are reported at cost less accumulated amortisation and accumulated impairment
losses. Amortisation is charged on a straight-line basis over their estimated useful lives as follows:
Computer software 1 to 6 years
Trademarks registered are initially recognised at cost. If assessed as having an indefinite useful life, they are not amortised but tested for impairment annually and impaired, if necessary.

Santova Limited Annual Financial Statements 201614
NOTES TO THE
ANNUAL FINANCIAL STATEMENTSfor the year ended 29 February 2016
1. ACCOUNTING POLICIES CONTINUED
1.6 Intangible assets continued
The Mauritian customs licence acquired during the year has been initially recognised at fair value in terms of IFRS 3: Business Combinations and assessed as having an indefinite useful life. It is thus not amortised, but tested for impairment annually and impaired, if necessary.
The estimated useful life and amortisation methods are reviewed at each reporting date, with the effect of any changes in estimate being accounted for on a prospective basis.
Internally-generated intangible assets – research and development expenditure Expenditure on research activities is recognised as an expense in the period in which it is incurred.
An internally-generated intangible asset arising from development (or from the development phase of an internal project) is recognised if, and only if, all of the following have been demonstrated:
• the technical feasibility of completing the intangible asset so that it will be available for use or sale;
• the intention to complete the intangible asset and use or sell it;
• the ability to use or sell the intangible asset;
• how the intangible asset will generate probable future economic benefits;
• the availability of adequate technical, financial and other resources to complete the development and to use or sell the intangible asset; and
• the ability to measure reliably the expenditure attributable to the intangible asset during its development.
The amount initially recognised for internally-generated intangible assets is the sum of the expenditure incurred from the date when the intangible asset first meets the recognition criteria listed above. Where no internally-generated intangible asset can be recognised, development expenditure is charged to profit or loss in the period in which it is incurred.
Subsequent to initial recognition, internally-generated intangible assets are reported at cost less accumulated amortisation and accumulated impairment losses, on the same basis as intangible assets acquired separately.
Intangible assets acquired in a business combination Intangible assets acquired in a business combination are identified and recognised separately from goodwill where they
satisfy the definition of an intangible asset and their fair values can be measured reliably. The cost of such intangible assets is their fair value at the acquisition date.
Subsequent to initial recognition, intangible assets acquired in a business combination are reported at cost less accumulated amortisation and accumulated impairment losses, on the same basis as intangible assets acquired separately.
1.7 Impairment of tangible and intangible assets excluding goodwill
At each reporting date, the Group reviews the carrying amounts of its tangible and intangible assets to determine whether there is any indication that those assets have suffered an impairment loss. If any such indication exists, the recoverable amount of the asset is estimated in order to determine the extent of the impairment loss (if any).
Where it is not possible to estimate the recoverable amount of an individual asset, the Group estimates the recoverable amount of the cash-generating unit to which the asset belongs. Where a reasonable and consistent basis of allocation can be identified, corporate assets are also allocated to individual cash-generating units, or otherwise they are allocated to the smallest group of cash-generating units for which a reasonable and consistent allocation basis can be identified.
Intangible assets with indefinite useful lives and intangible assets not yet available for use are tested for impairment annually, and whenever there is an indication that the asset may be impaired.
Recoverable amount is the higher of fair value less costs to sell and value in use. In assessing value in use, the estimated future cash flows are discounted to their present value using a pre-tax discount rate that reflects current market assessments of the time value of money and the risks specific to the asset.
If the recoverable amount of an asset (or cash-generating unit) is estimated to be less than its carrying amount, the carrying amount of the asset (or cash-generating unit) is reduced to its recoverable amount. An impairment loss is recognised immediately in profit or loss, unless the relevant asset is carried at a revalued amount, in which case the impairment loss is treated as a revaluation decrease.
Where an impairment loss subsequently reverses, the carrying amount of the asset (or cash-generating unit) is increased to the revised estimate of its recoverable amount, but so that the increased carrying amount does not exceed the carrying amount that would have been determined had no impairment loss been recognised for the asset (or cash-generating unit) in prior years. A reversal of an impairment loss is recognised immediately in profit or loss, unless the relevant asset is carried at a revalued amount, in which case the reversal of the impairment loss is treated as a revaluation increase.

Santova Limited Annual Financial Statements 2016
FINANCIAL REPORT
15
1.8 Goodwill
Goodwill arising on the acquisition of a subsidiary represents the excess of the cost of acquisition over the Group’s interest in the net fair value of the identifiable assets, liabilities and contingent liabilities of the subsidiary recognised at the date of acquisition. Goodwill is initially recognised as a non-current asset at cost and is subsequently measured at cost less any accumulated impairment losses.
For the purpose of impairment testing, goodwill is allocated to each of the Group’s cash-generating units expected to benefit from the synergies of the combination. Cash-generating units to which goodwill has been allocated are tested for impairment annually, or more frequently when there is an indication that the unit may be impaired.
If the recoverable amount of the cash-generating unit is less than the carrying amount of the unit, the impairment loss is allocated first to reduce the carrying amount of any goodwill allocated to the unit and then to the other assets of the unit pro rata on the basis of the carrying amount of each asset in the unit. An impairment loss recognised for goodwill is not reversed in a subsequent period.
On disposal of a subsidiary, the attributable amount of goodwill is included in the determination of the profit or loss on disposal.
1.9 Financial assets
Financial assets are classified into the following specified categories:
• ‘loans and receivables’;
• ‘held-to-maturity’ investments;
• financial assets ‘at fair value through profit or loss’ (“FVTPL”); and
• ‘available-for-sale’ (“AFS”) financial assets.
The classification depends on the nature and purpose of the financial assets and is determined at the time of initial recognition. When financial assets are recognised initially, they are measured at fair value, plus, in the case of investments not at fair value through profit or loss, directly attributable transactions costs. The Group considers whether a contract contains an embedded derivative when the entity first becomes a party to it.
The Group determines the classification of its financial assets after initial recognition and, where allowed and appropriate, re-evaluates this designation at each reporting date.
Normal purchases and sales of financial assets are recognised on the trade date, which is the date that the Group commits to purchase the asset.
Loans and receivables Trade receivables, loans, and other receivables that have fixed or determinable payments that are not quoted in an active
market are classified as loans and receivables. Loans and receivables are measured at amortised cost using the effective interest method, less any impairment. Interest income is recognised by applying the effective interest rate, except for short-term receivables when the recognition of interest would be immaterial.
Held-to-maturity investments Bills of exchange and debentures with fixed or determinable payments and fixed maturity dates that the Group has the
positive intent and ability to hold to maturity, are classified as held-to-maturity investments. Held-to-maturity investments are recorded at amortised cost using the effective interest method less any impairment, with revenue recognised on an effective yield basis.
Other investments Other investments are measured at fair value, plus transaction costs, except for those financial assets classified as at fair value
through profit or loss, which are initially measured at fair value.
Financial assets at fair value through profit or loss Financial assets are classified as at FVTPL where the financial asset is either held for trading or it is designated as at FVTPL.
Set-off Where a legally enforceable right of set-off exists for recognised financial assets and liabilities, and there is an intention to
settle the liability and realise the asset simultaneously, or to settle on a net basis, all related financial effects are offset.
Effective interest method The effective interest method is a method of calculating the amortised cost of a financial asset and of allocating interest
income over the relevant period. The effective interest rate is the rate that exactly discounts estimated future cash receipts through the expected life of the financial asset, or, where appropriate, a shorter period.
Income is recognised on an effective interest basis for debt instruments other than those financial assets designated as at FVTPL.

Santova Limited Annual Financial Statements 201616
NOTES TO THE
ANNUAL FINANCIAL STATEMENTSfor the year ended 29 February 2016
1. ACCOUNTING POLICIES CONTINUED
1.10 Impairment of financial assets
Financial assets, other than those at FVTPL, are assessed for indicators of impairment at each reporting date.
Financial assets are impaired where there is objective evidence that, as a result of one or more events that occurred after the initial recognition of the financial asset, the estimated future cash flows of the investment have been impacted.
The carrying amount of the financial asset is reduced by the impairment loss directly for all financial assets with the exception of trade receivables, where the carrying amount is reduced through the use of an allowance account. When a trade receivable is considered uncollectible, it is written off against the allowance account. Subsequent recoveries of amounts previously written off are credited against the allowance account. Changes in the carrying amount of the allowance account are recognised in profit or loss.
With the exception of AFS equity instruments, if, in a subsequent period, the amount of the impairment loss decreases and the decrease can be related objectively to an event occurring after the impairment was recognised, the previously recognised impairment loss is reversed through profit or loss to the extent that the carrying amount of the investment at the date the impairment is reversed does not exceed what the amortised cost would have been had the impairment not been recognised.
Assets carried at amortised cost If there is objective evidence that an impairment loss on loans and receivables carried at amortised cost has been incurred,
the amount of the loss is measured as the difference between the asset’s carrying amount and the present value of estimated future cash flows (excluding future expected credit losses that have not been incurred) discounted at the financial asset’s original effective interest rate.
The carrying amount of the asset is reduced through use of an allowance account. The amount of the loss is recognised in profit or loss.
Loans and receivables In relation to trade receivables, a specific provision for impairment is made when there is objective evidence that the Group
will not be able to collect all of the amounts due under the original terms of the invoice. The carrying amount of the receivable is disclosed in the statement of financial position net of the provision for impairment. Impaired debts are derecognised when they are assessed as uncollectible.
Trade receivables that are assessed not to be impaired individually, are assessed for impairment on a collective basis and, where appropriate, a portfolio provision for impairment is raised. Objective evidence of impairment for a portfolio of receivables could include the Group’s past experience of collecting payments, an increase in the number of delayed payments in the portfolio past the average credit period of 30 days, as well as observable changes in national or local economic conditions that correlate with default on receivables.
Investments For financial assets carried at amortised cost, the amount of the impairment is the difference between the asset’s carrying
amount and the present value of estimated future cash flows, discounted at the financial asset’s original effective interest rate.
Available-for-sale financial assets For unlisted shares classified as AFS, a significant or prolonged decline in the fair value of the security below its cost is
considered to be objective evidence of impairment.
For all other financial assets, including redeemable notes classified as AFS and finance lease receivables, objective evidence of impairment could include:
• significant financial difficulty of the issuer or counterparty;
• default or delinquency in interest or principal payments; or
• it becoming probable that the borrower will enter bankruptcy or financial re-organisation.
In respect of AFS equity securities, impairment losses previously recognised through profit or loss are not reversed through profit or loss. Any increase in fair value subsequent to an impairment loss is recognised directly in equity.

Santova Limited Annual Financial Statements 2016
FINANCIAL REPORT
17
1.11 Derecognition of financial assets
The Group derecognises a financial asset only when the contractual rights to the cash flows from the asset expire; or it transfers the financial asset and substantially all the risks and rewards of ownership of the asset to another entity.
If the Group neither transfers nor retains substantially all the risks and rewards of ownership and continues to control the transferred asset, the Group recognises its retained interest in the asset and an associated liability for amounts it may have to pay. If the Group retains substantially all the risks and rewards of ownership of a transferred financial asset, the Group continues to recognise the financial asset and also recognises a collateralised borrowing for the proceeds received.
1.12 Equity instruments
An equity instrument is any contract that evidences a residual interest in the assets of an entity after deducting all of its liabilities. Equity instruments issued by the Group are recorded at the proceeds received, net of direct issue costs.
Classification as debt or equity Debt and equity instruments are classified as either financial liabilities or as equity in accordance with the substance
of the contractual arrangement.
1.13 Financial guarantee contract liabilities
Financial guarantee contract liabilities are measured initially at their fair values and are subsequently measured at the higher of:
• the amount of the obligation under the contract, as determined in accordance with IAS 37: Provisions, Contingent Liabilities and Contingent Assets; and
• the amount initially recognised less, where appropriate, cumulative amortisation recognised in accordance with the revenue recognition policies of the Group.
1.14 Financial liabilities Financial liabilities are classified as either:
• ‘financial liabilities at FVTPL’; or
• ‘other financial liabilities’.
Financial liabilities at FVTPL Financial liabilities are classified as at FVTPL where the financial liability is either held for trading or it is designated as at
FVTPL. A financial liability is classified as held for trading if:
• it has been incurred principally for the purpose of repurchasing in the near future; or
• it is a part of an identified portfolio of financial instruments that the Group manages together and has a recent actual pattern of short-term profit-taking; or
• it is a derivative that is not designated and effective as a hedging instrument.
Financial liabilities at FVTPL are stated at fair value, with any resultant gain or loss recognised in profit or loss. The net gain or loss recognised in profit or loss incorporates any interest paid on the financial liability.
Other financial liabilities Other financial liabilities, including borrowings, are initially measured at fair value, net of transaction costs.
Other financial liabilities are subsequently measured at amortised cost using the effective interest method, with interest expense recognised on an effective yield basis.
The effective interest method is a method of calculating the amortised cost of a financial liability and of allocating interest expense over the relevant period. The effective interest rate is the rate that exactly discounts estimated future cash payments through the expected life of the financial liability, or, where appropriate, a shorter period.
Derecognition of financial liabilities The Group derecognises financial liabilities when, and only when, the Group’s obligations are discharged, cancelled or they
expire.

Santova Limited Annual Financial Statements 201618
NOTES TO THE
ANNUAL FINANCIAL STATEMENTSfor the year ended 29 February 2016
1. ACCOUNTING POLICIES CONTINUED
1.15 Derivative financial instruments
The Group enters into a variety of derivative financial instruments to manage its exposure to interest rate and foreign exchange rate risk, including foreign exchange forward contracts. Further details of derivative financial instruments are disclosed in note 27.
Derivatives are initially recognised at fair value at the date a derivative contract is entered into and are subsequently remeasured to their fair value at each reporting date. The resulting gain or loss is recognised in profit or loss immediately unless the derivative is designated and effective as a hedging instrument, in which event the timing of the recognition in profit or loss depends on the nature of the hedge relationship. The Group designates certain derivatives as either hedges of the fair value of recognised assets or liabilities or firm commitments (fair value hedges), hedges of highly probable forecast transactions or hedges of foreign currency risk of firm commitments (cash flow hedges), or hedges of net investments in foreign operations.
A derivative is presented as a non-current asset or a non-current liability if the remaining maturity of the instrument is more than 12 months and it is not expected to be realised or settled within 12 months. Other derivatives are presented as current assets or current liabilities.
Embedded derivatives Derivatives embedded in other financial instruments or other host contracts are treated as separate derivatives when their
risks and characteristics are not closely related to those of the host contracts and the host contracts are not measured at fair value with changes in fair value recognised in profit or loss.
1.16 Provisions
Provisions are recognised when the Group has a present obligation (legal or constructive) as a result of a past event, it is probable that the Group will be required to settle the obligation, and a reliable estimate can be made of the amount of the obligation.
The amount recognised as a provision is the best estimate of the consideration required to settle the present obligation at the reporting date, taking into account the risks and uncertainties surrounding the obligation.
Where a provision is measured using the cash flows estimated to settle the present obligation, its carrying amount is the present value of those cash flows. When some or all of the economic benefits required to settle a provision are expected to be recovered from a third party, the receivable is recognised as an asset if it is virtually certain that reimbursement will be received and the amount of the receivable can be measured reliably.
1.17 Cash and cash equivalents
Cash and cash equivalents in the statement of financial position comprise cash at banks and on hand and short-term deposits with an original maturity of three months or less.
For the purpose of the statements of cash flows, cash and cash equivalents consist of cash and cash equivalents as defined above.
1.18 Revenue recognition
Revenue is measured at the fair value of the consideration received or receivable.
Rendering of services Revenue from a contract to provide services is recognised by reference to the stage of completion of the contract.
The stage of completion of the contract is determined by reference to the work and value of the transactions undertaken and agreed tariffs or industry practices.
Revenue from logistics services comprises the net invoiced value of services rendered as an agent for customers and includes fees, commissions and net interest on the provision of a credit facility for the customer.
Recoverable disbursements incurred on behalf of customers which include customs duties, valued added taxes and the cost of freight charges and of obtaining finance are excluded from revenue and form part of gross billings only.
Dividend and interest revenue Dividend revenue from investments is recognised when the shareholder’s right to receive payment has been established.
Interest revenue is accrued on a time basis, by reference to the principal outstanding and at the effective interest rate applicable, which is the rate that exactly discounts estimated future cash receipts through the expected life of the financial asset to that asset’s net carrying amount.
Government grants Government grants are not recognised until there is reasonable assurance that the Group will comply with the conditions
attached to them and that the grants will be received.
Other government grants are recognised as income over the periods necessary to match them with the costs for which they are intended to compensate, on a systematic basis.

Santova Limited Annual Financial Statements 2016
FINANCIAL REPORT
19
1.19 Leasing
Leases are classified as finance leases whenever the terms of the lease transfer substantially all the risks and rewards of ownership to the lessee. All other leases are classified as operating leases.
The Group as lessor Amounts due from lessees under finance leases are recorded as receivables at the amount of the Group’s net investment in
the leases. Finance lease income is allocated to accounting periods so as to reflect a constant periodic rate of return on the Group’s net investment outstanding in respect of the leases.
Rental income from operating leases is recognised on a straight-line basis over the term of the relevant lease. Initial direct costs incurred in negotiating and arranging an operating lease are added to the carrying amount of the leased asset and recognised on a straight-line basis over the lease term.
The Group as lessee Assets held under finance leases are initially recognised at their fair value at the inception of the lease or, if lower, at the
present value of the minimum lease payments. The corresponding liability to the lessor is included in the statement of financial position as a finance lease obligation.
Lease payments are apportioned between finance charges and reduction of the lease obligation so as to achieve a constant rate of interest on the remaining balance of the liability. Finance charges are charged directly to profit or loss, unless they are directly attributable to qualifying assets, in which case they are capitalised in accordance with the Group’s general policy on borrowing costs. Contingent rentals are recognised as expenses in the periods in which they are incurred.
Operating lease payments are recognised as an expense on a straight-line basis over the lease term, except where another systematic basis is more representative of the time pattern in which economic benefits from the leased asset are consumed. Contingent rentals arising under operating leases are recognised as an expense in the period in which they are incurred.
In the event that lease incentives are received to enter into operating leases, such incentives are recognised as a liability. The aggregate benefit of incentives is recognised as a reduction of rental expense on a straight-line basis, except where another systematic basis is more representative of the time pattern in which economic benefits from the leased asset are consumed.
1.20 Borrowing costs
Borrowing costs directly attributable to the acquisition, construction or production of qualifying assets, which are assets that necessarily take a substantial period of time to get ready for their intended use or sale, are added to the cost of those assets, until such time as the assets are substantially ready for their intended use or sale.
Investment income earned on the temporary investment of specific borrowings pending their expenditure on qualifying assets is deducted from the borrowing costs eligible for capitalisation.
All other borrowing costs are recognised in profit or loss in the period in which they are incurred.
1.21 Retirement benefit costs
Defined contribution benefit plans Contributions to defined contribution retirement benefit plans are recognised as an expense when employees have rendered
service entitling them to the contributions.
Post-employment healthcare benefits No contributions are made to the medical aid of retired employees, except for a closed user group of retirees who were
employed and subsequently retired under a defined benefit plan. The present value of the post-retirement medical aid obligation for such retirees is actuarially determined every year, on a projected unit credit method, and any deficit or surplus is recognised in the statement of comprehensive income.
1.22 Share-based payments Equity-settled share-based payments to employees and others providing similar services are measured at the fair value of the
equity instruments at the grant date.
The fair value determined at the grant date of the equity-settled share-based payments is expensed on a straight-line basis over the vesting period, based on the Group’s estimate of equity instruments that will eventually vest. At each reporting date, the Group revises its estimate of the number of equity instruments expected to vest. The impact of the revision of the original estimates, if any, is recognised in profit or loss over the remaining vesting period, with a corresponding adjustment to the equity-settled employee benefits reserve.
Equity-settled share-based payment transactions with other parties are measured at the fair value of the goods or services received, except where the fair value cannot be estimated reliably, in which case they are measured at the fair value of the equity instruments granted, measured at the date the entity obtains the goods or the counterparty renders the service.
For cash-settled share-based payments, a liability equal to the portion of the goods or services received is recognised at the current fair value determined at each reporting date.

Santova Limited Annual Financial Statements 201620
NOTES TO THE
ANNUAL FINANCIAL STATEMENTSfor the year ended 29 February 2016
1. ACCOUNTING POLICIES CONTINUED
1.23 Taxation Income tax expense represents the sum of the tax currently payable and deferred tax.
Current tax The tax currently payable is based on taxable profit for the year. Taxable profit differs from profit as reported in the consolidated
statement of comprehensive income because it excludes items of income or expense that are taxable or deductible in other years and it further excludes items that are never taxable or deductible. The Group’s liability for current tax is calculated using tax rates that have been enacted or substantively enacted by the reporting date.
Deferred tax Deferred tax is recognised on differences between the carrying amounts of assets and liabilities in the financial statements
and the corresponding tax bases used in the computation of taxable profit, and is accounted for using the balance sheet liability method. Deferred tax liabilities are generally recognised for all taxable temporary differences, and deferred tax assets are generally recognised for all deductible temporary differences to the extent that it is probable that taxable profits will be available against which those deductible temporary differences can be utilised. Such assets and liabilities are not recognised if the temporary difference arises from goodwill or from the initial recognition (other than in a business combination) of other assets and liabilities in a transaction that affects neither the taxable profit nor the accounting profit.
Deferred tax liabilities are recognised for taxable temporary differences associated with investments in subsidiaries and associates, and interests in joint ventures, except where the Group is able to control the reversal of the temporary difference and it is probable that the temporary difference will not reverse in the foreseeable future.
Deferred tax assets arising from deductible temporary differences associated with such investments and interests are only recognised to the extent that it is probable that there will be sufficient taxable profits against which to utilise the benefits of the temporary differences and they are expected to reverse in the foreseeable future.
The carrying amount of deferred tax assets is reviewed at each reporting date and reduced to the extent that it is no longer probable that sufficient taxable profits will be available to allow all or part of the asset to be recovered.
Deferred tax assets and liabilities are measured at the tax rates that are expected to apply in the period in which the liability is settled or the asset realised, based on tax rates (and tax laws) that have been enacted or substantively enacted by the reporting date. The measurement of deferred tax liabilities and assets reflects the tax consequences that would follow from the manner in which the Group expects, at the reporting date, to recover or settle the carrying amount of its assets and liabilities.
Deferred tax assets and liabilities are offset when there is a legally enforceable right to set off current tax assets against current tax liabilities and when they relate to income taxes levied by the same taxation authority and the Group intends to settle its current tax assets and liabilities on a net basis.
Current and deferred tax for the period Current and deferred tax are recognised as an expense or income in profit or loss, except when they relate to items
credited or debited directly to equity, in which case the tax is also recognised directly in equity, or where they arise from the initial accounting for a business combination. In the case of a business combination, the tax effect is taken into account in calculating goodwill or in determining the excess of the acquirer’s interest in the net fair value of the acquiree’s identifiable assets, liabilities and contingent liabilities over the cost of the business combination.

Santova Limited Annual Financial Statements 2016
FINANCIAL REPORT
21
1.24 Foreign currencies Monetary assets and liabilities denominated in foreign currencies are translated at the ruling spot rates at the reporting date.
Exchange differences are recognised in profit or loss in the period in which they arise.
1.25 Critical accounting judgements and key sources of estimation uncertainty There are a number of areas where judgement is applied in the financial statements. The areas that have a significant risk of
causing material adjustments to the carrying values of assets and liabilities within the next financial period are as follows:
• Determination of when control is assumed in a business combination;
• valuation of goodwill arising from business combinations; and
• estimation of contingent purchase consideration on acquisitions
The Group is considered to exercise control over an entity when it has the ability to direct the relevant activities of that entity and to earn variable returns from it.
The determination of whether goodwill is impaired requires that estimates be made of the fair value of the Group’s cash-generating units to which goodwill has been allocated. The Group utilises the fair value less costs to sell (“FVLC”) method as the primary basis for determining the fair value of a cash generating unit. In determining the FVLC, the Group calculates the current earnings before interest, tax, depreciation and amortisation (“EBITDA”) and adjusts for ‘once-off’ income and expenses. The adjusted EBITDA is then multiplied by an appropriate earnings multiple and the estimated costs to sell the entity are deducted. Where the calculation of FVLC is less than the carrying amount, the Group will also calculate the fair value utilising the value in use method as a secondary indicator to support the final conclusion by estimating the future cash flows from the cash-generating unit and applying a suitable discount rate in order to arrive at the present value of such future cash flows.
In the case of the calculation of FVLC, the Group uses multiples available in the market for assets of similar size, risk and jurisdiction. To calculate value in use, the discount rate is based on current pre-tax market rates that reflect the time value of money and the risks specific to the cash-generating units. Growth rates are based on objective assessments of external data. Goodwill is tested annually for impairment or when indications arise that goodwill might be impaired.
1.26 Segmental information The Group has organised and recorded its segment information by business segment and on a secondary basis by significant
geographical region based on location of assets. This is representative of the internal reporting used for management purposes as well as the source and nature of business risks.
1.27 New/revised accounting standards Management has assessed the impact of the revised standards that were effective for the current year and the adoption of
these revised standards had no material impact on the results presented. Below is a list of the applicable standards:
Amendments to IFRS 7 and IFRS 9: Mandatory Effective Date of IFRS 9 and Transition Disclosures (effective annual periods beginning on or after 1 January 2015).
Amendments to IFRS 2 Share Based Payments: Amendments to definition of vesting condition (effective annual periods beginning on or after 1 July 2014).
Amendments to IFRS 3 Business Combinations: Amendments to accounting for contingent consideration in a business combination (effective annual periods beginning on or after 1 July 2014).
Amendments to IFRS 8 Operating Segments (effective annual periods beginning on or after 1 July 2014).
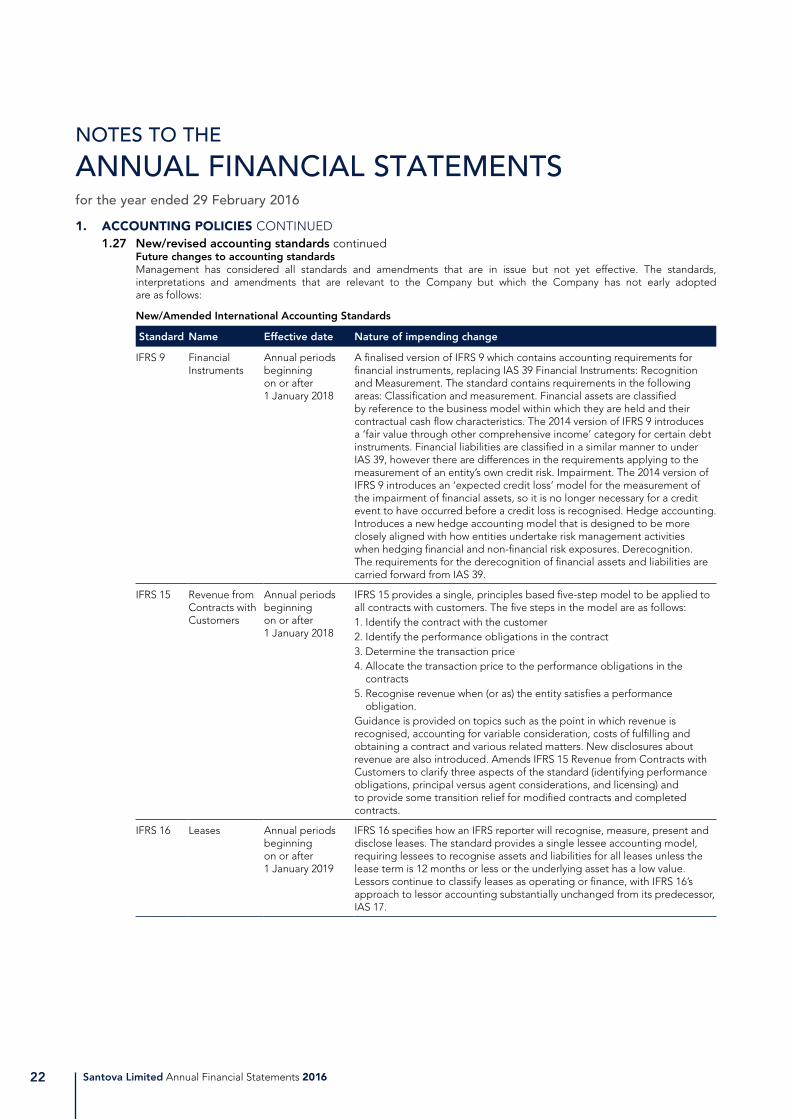
Santova Limited Annual Financial Statements 201622
NOTES TO THE
ANNUAL FINANCIAL STATEMENTSfor the year ended 29 February 2016
1. ACCOUNTING POLICIES CONTINUED 1.27 New/revised accounting standards continued Future changes to accounting standards Management has considered all standards and amendments that are in issue but not yet effective. The standards,
interpretations and amendments that are relevant to the Company but which the Company has not early adopted are as follows:
New/Amended International Accounting Standards
Standard Name Effective date Nature of impending change
IFRS 9 Financial Instruments
Annual periods beginning on or after 1 January 2018
A finalised version of IFRS 9 which contains accounting requirements for financial instruments, replacing IAS 39 Financial Instruments: Recognition and Measurement. The standard contains requirements in the following areas: Classification and measurement. Financial assets are classified by reference to the business model within which they are held and their contractual cash flow characteristics. The 2014 version of IFRS 9 introduces a ‘fair value through other comprehensive income’ category for certain debt instruments. Financial liabilities are classified in a similar manner to under IAS 39, however there are differences in the requirements applying to the measurement of an entity’s own credit risk. Impairment. The 2014 version of IFRS 9 introduces an ‘expected credit loss’ model for the measurement of the impairment of financial assets, so it is no longer necessary for a credit event to have occurred before a credit loss is recognised. Hedge accounting. Introduces a new hedge accounting model that is designed to be more closely aligned with how entities undertake risk management activities when hedging financial and non-financial risk exposures. Derecognition. The requirements for the derecognition of financial assets and liabilities are carried forward from IAS 39.
IFRS 15 Revenue from Contracts with Customers
Annual periods beginning on or after 1 January 2018
IFRS 15 provides a single, principles based five-step model to be applied to all contracts with customers. The five steps in the model are as follows:1. Identify the contract with the customer 2. Identify the performance obligations in the contract 3. Determine the transaction price 4. Allocate the transaction price to the performance obligations in the
contracts 5. Recognise revenue when (or as) the entity satisfies a performance
obligation.Guidance is provided on topics such as the point in which revenue is recognised, accounting for variable consideration, costs of fulfilling and obtaining a contract and various related matters. New disclosures about revenue are also introduced. Amends IFRS 15 Revenue from Contracts with Customers to clarify three aspects of the standard (identifying performance obligations, principal versus agent considerations, and licensing) and to provide some transition relief for modified contracts and completed contracts.
IFRS 16 Leases Annual periods beginning on or after 1 January 2019
IFRS 16 specifies how an IFRS reporter will recognise, measure, present and disclose leases. The standard provides a single lessee accounting model, requiring lessees to recognise assets and liabilities for all leases unless the lease term is 12 months or less or the underlying asset has a low value. Lessors continue to classify leases as operating or finance, with IFRS 16’s approach to lessor accounting substantially unchanged from its predecessor, IAS 17.

Santova Limited Annual Financial Statements 2016
FINANCIAL REPORT
23
1. ACCOUNTING POLICIES CONTINUED1.27 New/revised accounting standards continued
Standard Name Effective date Nature of impending change
IAS 1 Disclosure Initiative
Annual periods beginning on or after 1 January 2016
Amends IAS 1 Presentation of Financial Statements to address perceived impediments to preparers exercising their judgement in presenting their financial reports by making the following changes: Clarification that information should not be obscured by aggregating or by providing immaterial information, materiality considerations apply to the all parts of the financial statements, and even when a standard requires a specific disclosure, materiality considerations do apply;Clarification that the list of line items to be presented in these statements can be disaggregated and aggregated as relevant and additional guidance on subtotals in these statements and clarification that an entity’s share of OCI of equity-accounted associates and joint ventures should be presented in aggregate as single line items based on whether or not it will subsequently be reclassified to profit or loss; Additional examples of possible ways of ordering the notes to clarify that understandability and comparability should be considered when determining the order of the notes and to demonstrate that the notes need not be presented in the order so far listed in paragraph 114 of IAS 1.
IAS 7 Disclosure Initiative
Annual periods beginning on or after 1 January 2017
Amends IAS 7 Statement of Cash Flows to clarify that entities shall provide disclosures that enable users of financial statements to evaluate changes in liabilities arising from financing activities.
IAS 12 Recognition of Deferred Tax Assets for Unrealised Losses (Amendments to IAS 12)
Annual periods beginning on or after 1 January 2017
Amends IAS 12 Income Taxes to clarify the following aspects: Unrealised losses on debt instruments measured at fair value and measured at cost for tax purposes give rise to a deductible temporary difference regardless of whether the debt instrument’s holder expects to recover the carrying amount of the debt instrument by sale or by use. The carrying amount of an asset does not limit the estimation of probable future taxable profits. Estimates for future taxable profits exclude tax deductions resulting from the reversal of deductible temporary differences. An entity assesses a deferred tax asset in combination with other deferred tax assets. Where tax law restricts the utilisation of tax losses, an entity would assess a deferred tax asset in combination with other deferred tax assets of the same type.
IAS 16 and 38
Clarification of Acceptable Methods of Depreciation and Amortisation
Annual periods beginning on or after 1 January 2016
Amends IAS 16 Property, Plant and Equipment and IAS 38 Intangible Assets to: Clarify that a depreciation method that is based on revenue that is generated by an activity that includes the use of an asset is not appropriate for property, plant and equipment. Introduce a rebuttable presumption that an amortisation method that is based on the revenue generated by an activity that includes the use of an intangible asset is inappropriate, which can only be overcome in limited circumstances where the intangible asset is expressed as a measure of revenue, or when it can be demonstrated that revenue and the consumption of the economic benefits of the intangible asset are highly correlated. Add guidance that expected future reductions in the selling price of an item that was produced using an asset could indicate the expectation of technological or commercial obsolescence of the asset, which, in turn, might reflect a reduction of the future economic benefits embodied in the asset.
Management has completed an initial review of the provisions of IFRS 15: Revenue, applying the standard across the Group’s processes and systems. The results of the initial evaluation suggest that the effects of the new standard will not have a significant effect on the Group or the Company.
Management are in the process of evaluating the effects of these new standards and interpretations but, with the exception of IFRS16: leases, they are not expected to have a significant impact on the Company. IFRS 16: Leases will require the capitalisation of the Group’s commercial properties under leases with the expected impact being a material increase in both tangible assets and financial liabilities.

Santova Limited Annual Financial Statements 201624
NOTES TO THE
ANNUAL FINANCIAL STATEMENTSfor the year ended 29 February 2016
2. PROPERTY, PLANT AND EQUIPMENT
2016 2015
Cost
Accu-mulated
depreciationCarrying
value Cost
Accu-mulated
depreciationCarrying
valueR’000 R’000 R’000 R’000 R’000 R’000
CONSOLIDATEDProperty, plant and equipment 17 021 (953) 16 068 730 (324) 406 Motor vehicles 4 929 (2 486) 2 443 4 834 (2 480) 2 354 Furniture and fittings 3 256 (1 964) 1 292 2 013 (980) 1 033 Leasehold improvements 1 799 (1 307) 492 1 243 (813) 430 Office equipment 4 233 (2 217) 2 016 3 164 (1 962) 1 202 Computer equipment 6 359 (3 584) 2 775 5 866 (3 358) 2 508
37 597 (12 511) 25 086 17 850 (9 917) 7 933
Certain motor vehicles and equipment with a carrying value of R1 054 792 (2015: R1 346 973 ) are held under instalment sale agreements and are pledged as security for the related instalment sale agreement (refer note 10). Assets with a carrying value of R381 843 (2015: R633 484) are pledged as security for the Allianz Finance Pty Ltd facility (refer note 13).
The carrying amounts of property, plant and equipment can be reconciled as follows:
Carrying value at
beginning of year Additions Disposals Depreciation
Translation profit/(loss)
Carrying value at
end of yearR’000 R’000 R’000 R’000 R’000 R’000
2016Property, plant and equipment 406 14 564 (176) (56) 1 330 16 068 Motor vehicles 2 354 688 (63) (681) 145 2 443 Furniture and fittings 1 033 499 (30) (186) (24) 1 292 Leasehold improvements 430 574 (297) (244) 29 492 Office equipment 1 202 1 138 – (500) 176 2 016 Computer equipment 2 508 1 128 (6) (1 246) 391 2 775
7 933 18 591 (572) (2 913) 2 047 25 086
2015Property, plant and equipment 433 39 (2) (64) – 406 Motor vehicles 2 526 676 (181) (654) (13) 2 354 Furniture and fittings 1 176 91 (66) (167) (1) 1 033 Leasehold improvements 595 – – (144) (21) 430 Office equipment 1 349 305 (39) (381) (32) 1 202 Computer equipment 2 861 828 (73) (1 044) (64) 2 508
8 940 1 939 (361) (2 454) (131) 7 933

Santova Limited Annual Financial Statements 2016
FINANCIAL REPORT
25
2. PROPERTY, PLANT AND EQUIPMENT CONTINUED
2016 2015
CostAccumulated depreciation
Carrying value Cost
Accumulateddepreciation
Carrying value
R’000 R’000 R’000 R’000 R’000 R’000
COMPANYFurniture and fittings 138 (49) 89 135 (38) 97 Office equipment 4 (2) 2 4 (1) 3 Computer equipment 1 752 (1 111) 641 1 657 (833) 824
1 894 (1 162) 732 1 796 (872) 924
The carrying amounts of plant and equipment can be reconciled as follows:
Carrying value at
beginning of year Additions Disposals Depreciation
Carrying value at
end of year
R’000 R’000 R’000 R’000 R’000
2016Furniture and fittings 97 3 – (11) 89 Office equipment 3 – – (1) 2 Computer equipment 824 153 – (336) 641
924 156 – (348) 732
2015Furniture and fittings 9 92 – (4) 97 Office equipment 3 – – – 3 Computer equipment 1 001 170 – (347) 824
1 013 262 – (351) 924

Santova Limited Annual Financial Statements 201626
NOTES TO THE
ANNUAL FINANCIAL STATEMENTSfor the year ended 29 February 2016
Consolidated Consolidated Company Company2016 2015 2016 2015
R’000 R’000 R’000 R’000
3. INTANGIBLE ASSETS 3.1 Computer software
Cost 5 924 5 634 5 437 4 557 Accumulated amortisation (2 766) (2 528) (2 399) (1 621)
Carrying value at beginning of year 3 158 3 106 3 038 2 936 Additions 2 008 914 2 008 880 Disposals – (5) – –
Cost – (703) – – Accumulated amortisation – 698 – –
Amortisation (1 130) (857) (1 060) (778)
Carrying value at end of year 4 036 3 158 3 986 3 038
Comprising:Cost 7 932 5 924 7 445 5 437 Accumulated amortisation (3 896) (2 766) (3 459) (2 399)
Group and Company computer software additions consists both of internally developed systems and generic software purchases.
3.2 Indefinite useful life intangible assetsCost 162 – 162 –
Carrying value at beginning of year 162 – 162 – Acquired during the year 999 162 204 162
– Trademarks 204 162 204 162– Licence 795 – – –
Translation profit 212 – – –
Carrying value at end of year 1 373 162 366 162
Intangible assets with indefinite useful lives consists of trademarks and the value attributable to the Mauritian customs licence from the acquisition of Jet-Freight Services (Mauritius).
Further trademarks for the “Santova” brand name were registered during the year in certain countries in which the Group operates. These were capitalised and assessed by management as having indefinite useful lives based on the following factors and reasons:
• The name, Santova, is the core brand of the Group which management expects will be used indefinitely in its current form; and
• The Santova brand continues to grow and be recognised as the Group expands internationally.
The value attributable to the Mauritian customs licence has been calculated, in terms of IFRS 3, as an amount equal to the negative asset value of the acquired company on acquisition date. The value recognised in relation to this licence is due to the fact that the number of customs licences on the island of Mauritius is regulated and no further licences can be issued by the authorities. As a result, this licence has been assessed by management as having an indefinite useful life. As there had been no change in this legislation as at 29 February 2016, management’s assessment remains unchanged and management are of the opinion that there is no indicator that the asset should be impaired.

Santova Limited Annual Financial Statements 2016
FINANCIAL REPORT
27
Consolidated Consolidated Company Company2016 2015 2016 2015
R’000 R’000 R’000 R’000
3. INTANGIBLE ASSETS CONTINUED3.3 Goodwill
Carrying value at beginning of year 118 944 120 821 – – Amounts recognised from acquisitions of subsidiaries:– Tradeway (Shipping) 75 854 – – – – AEMC Trading Agency 1 498 – – – – Masterfreight Internationale Spedition – 4 050 – – Amounts written off in subsidiary:– Impairment (W.M. Shipping) – (3 892) – – Translation gain/(loss) 21 176 (2 035) – –
Carrying value at end of year 217 472 118 944 – –
Goodwill is allocated to the Group’s cash-generating units (CGUs) as follows:
217 472 118 944 – –
– AMEC Trading Agency 1 498 – – – – Masterfreight Internationale Spedition (Germany) 5 130 3 803 – Santova Logistics (South Africa) 43 063 43 063 – – – Santova Financial Services 2 826 2 826 – – – Santova Logistics (United Kingdom) 655 655 – – – Santova Logistics (Australia) 12 908 10 151 – – – Santova Logistics (Netherlands) 2 164 1 604 – – – Tradeway (Shipping) (United Kingdom) 77 974 – – –– W.M. Shipping (United Kingdom) 71 254 56 842 – –
Total intangible assets 222 881 122 264 4 352 3 200
For more detail on investments, refer to note 4.
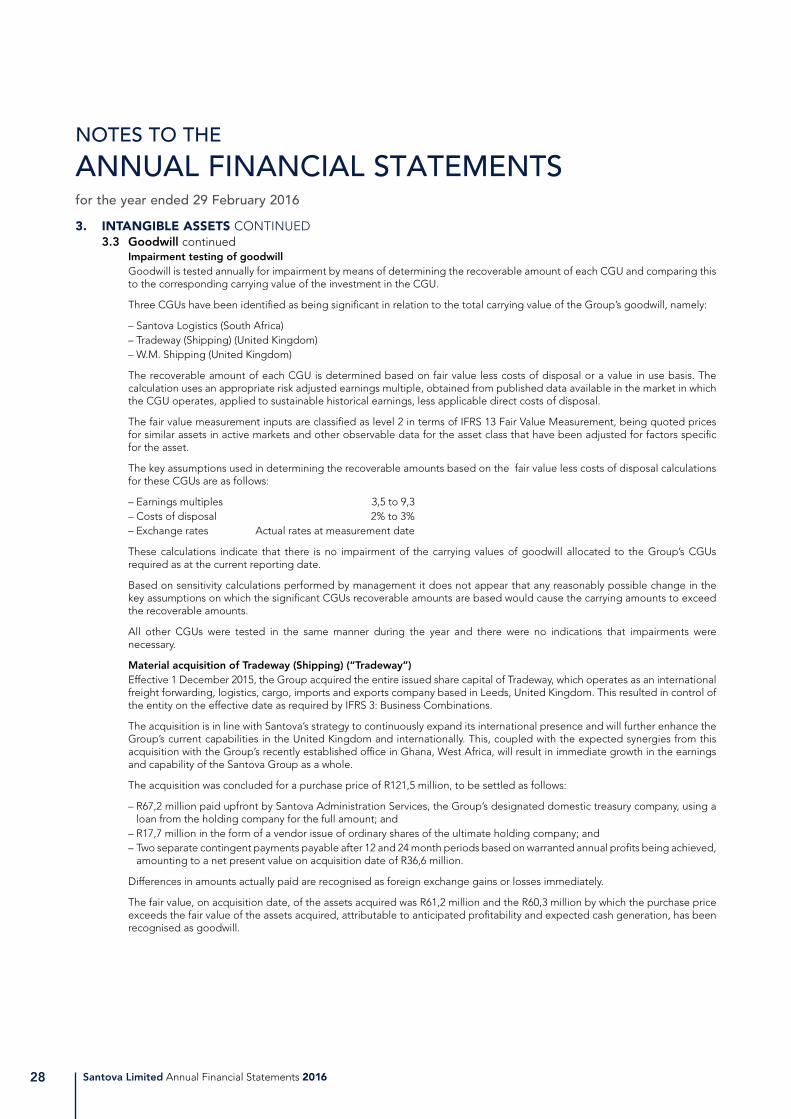
Santova Limited Annual Financial Statements 201628
NOTES TO THE
ANNUAL FINANCIAL STATEMENTSfor the year ended 29 February 2016
3. INTANGIBLE ASSETS CONTINUED3.3 Goodwill continued
Impairment testing of goodwillGoodwill is tested annually for impairment by means of determining the recoverable amount of each CGU and comparing this to the corresponding carrying value of the investment in the CGU.
Three CGUs have been identified as being significant in relation to the total carrying value of the Group’s goodwill, namely:
– Santova Logistics (South Africa)– Tradeway (Shipping) (United Kingdom)– W.M. Shipping (United Kingdom)
The recoverable amount of each CGU is determined based on fair value less costs of disposal or a value in use basis. The calculation uses an appropriate risk adjusted earnings multiple, obtained from published data available in the market in which the CGU operates, applied to sustainable historical earnings, less applicable direct costs of disposal.
The fair value measurement inputs are classified as level 2 in terms of IFRS 13 Fair Value Measurement, being quoted prices for similar assets in active markets and other observable data for the asset class that have been adjusted for factors specific for the asset.
The key assumptions used in determining the recoverable amounts based on the fair value less costs of disposal calculations for these CGUs are as follows:
– Earnings multiples 3,5 to 9,3– Costs of disposal 2% to 3%– Exchange rates Actual rates at measurement date
These calculations indicate that there is no impairment of the carrying values of goodwill allocated to the Group’s CGUs required as at the current reporting date.
Based on sensitivity calculations performed by management it does not appear that any reasonably possible change in the key assumptions on which the significant CGUs recoverable amounts are based would cause the carrying amounts to exceed the recoverable amounts.
All other CGUs were tested in the same manner during the year and there were no indications that impairments were necessary.
Material acquisition of Tradeway (Shipping) (“Tradeway”)Effective 1 December 2015, the Group acquired the entire issued share capital of Tradeway, which operates as an international freight forwarding, logistics, cargo, imports and exports company based in Leeds, United Kingdom. This resulted in control of the entity on the effective date as required by IFRS 3: Business Combinations.
The acquisition is in line with Santova’s strategy to continuously expand its international presence and will further enhance the Group’s current capabilities in the United Kingdom and internationally. This, coupled with the expected synergies from this acquisition with the Group’s recently established office in Ghana, West Africa, will result in immediate growth in the earnings and capability of the Santova Group as a whole.
The acquisition was concluded for a purchase price of R121,5 million, to be settled as follows:
– R67,2 million paid upfront by Santova Administration Services, the Group’s designated domestic treasury company, using a loan from the holding company for the full amount; and
– R17,7 million in the form of a vendor issue of ordinary shares of the ultimate holding company; and– Two separate contingent payments payable after 12 and 24 month periods based on warranted annual profits being achieved,
amounting to a net present value on acquisition date of R36,6 million.
Differences in amounts actually paid are recognised as foreign exchange gains or losses immediately.
The fair value, on acquisition date, of the assets acquired was R61,2 million and the R60,3 million by which the purchase price exceeds the fair value of the assets acquired, attributable to anticipated profitability and expected cash generation, has been recognised as goodwill.
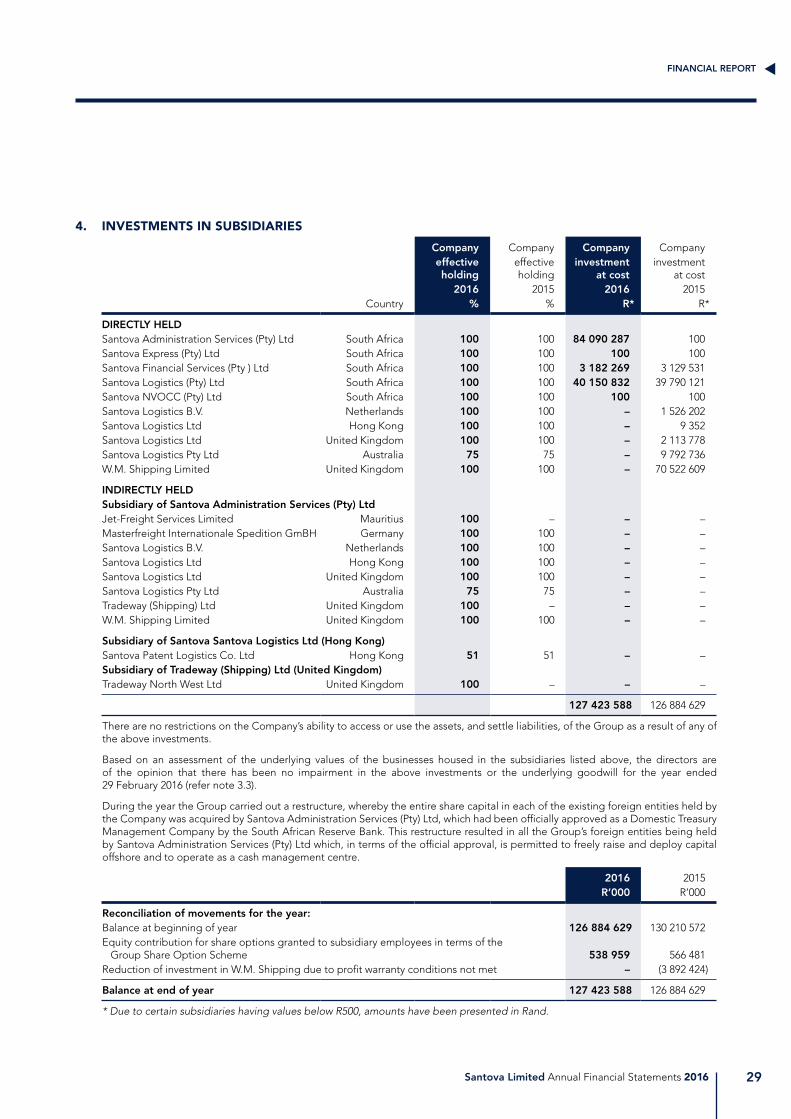
Santova Limited Annual Financial Statements 2016
FINANCIAL REPORT
29
4. INVESTMENTS IN SUBSIDIARIES
Company Company Company Company effective holding
effective holding
investment at cost
investment at cost
2016 2015 2016 2015Country % % R* R*
DIRECTLY HELDSantova Administration Services (Pty) Ltd South Africa 100 100 84 090 287 100 Santova Express (Pty) Ltd South Africa 100 100 100 100 Santova Financial Services (Pty ) Ltd South Africa 100 100 3 182 269 3 129 531 Santova Logistics (Pty) Ltd South Africa 100 100 40 150 832 39 790 121 Santova NVOCC (Pty) Ltd South Africa 100 100 100 100 Santova Logistics B.V. Netherlands 100 100 – 1 526 202 Santova Logistics Ltd Hong Kong 100 100 – 9 352 Santova Logistics Ltd United Kingdom 100 100 – 2 113 778 Santova Logistics Pty Ltd Australia 75 75 – 9 792 736 W.M. Shipping Limited United Kingdom 100 100 – 70 522 609
INDIRECTLY HELDSubsidiary of Santova Administration Services (Pty) LtdJet-Freight Services Limited Mauritius 100 – – – Masterfreight Internationale Spedition GmBH Germany 100 100 – – Santova Logistics B.V. Netherlands 100 100 – – Santova Logistics Ltd Hong Kong 100 100 – – Santova Logistics Ltd United Kingdom 100 100 – – Santova Logistics Pty Ltd Australia 75 75 – – Tradeway (Shipping) Ltd United Kingdom 100 – – – W.M. Shipping Limited United Kingdom 100 100 – –
Subsidiary of Santova Santova Logistics Ltd (Hong Kong)Santova Patent Logistics Co. Ltd Hong Kong 51 51 – – Subsidiary of Tradeway (Shipping) Ltd (United Kingdom)Tradeway North West Ltd United Kingdom 100 – – –
127 423 588 126 884 629
There are no restrictions on the Company’s ability to access or use the assets, and settle liabilities, of the Group as a result of any of the above investments.
Based on an assessment of the underlying values of the businesses housed in the subsidiaries listed above, the directors are of the opinion that there has been no impairment in the above investments or the underlying goodwill for the year ended 29 February 2016 (refer note 3.3).
During the year the Group carried out a restructure, whereby the entire share capital in each of the existing foreign entities held by the Company was acquired by Santova Administration Services (Pty) Ltd, which had been officially approved as a Domestic Treasury Management Company by the South African Reserve Bank. This restructure resulted in all the Group’s foreign entities being held by Santova Administration Services (Pty) Ltd which, in terms of the official approval, is permitted to freely raise and deploy capital offshore and to operate as a cash management centre.
2016 2015 R’000 R’000
Reconciliation of movements for the year:Balance at beginning of year 126 884 629 130 210 572 Equity contribution for share options granted to subsidiary employees in terms of the Group Share Option Scheme 538 959 566 481 Reduction of investment in W.M. Shipping due to profit warranty conditions not met – (3 892 424)
Balance at end of year 127 423 588 126 884 629
* Due to certain subsidiaries having values below R500, amounts have been presented in Rand.

Santova Limited Annual Financial Statements 201630
NOTES TO THE
ANNUAL FINANCIAL STATEMENTSfor the year ended 29 February 2016
Consolidated Consolidated Company Company2016 2015 2016 2015
Level R’000 R’000 R’000 R’000
5. FINANCIAL ASSETS/(LIABILITIES)Financial assetsNon-current financial assetsFuture profit share on rental agreement1 2 1 228 1 228 – – Guardrisk cell captive2 2 3 308 2 007 – –
4 536 3 235 – –
Current financial assetsForward exchange contracts 1 26 – – –
26 – – –
Financial liabilitiesNon-current financial liabilitiesLease termination liability 2 – (457) – – Contingent purchase considerations on acquisitions3 3 (49 134) (990) – –Less: current portion included in current liabilitiesLease termination liability 2 – 457 – – Contingent purchase considerations on acquisitions3 3 31 348 990 – –
(17 786) – – –
Current financial liabilitiesCurrent portion of lease termination liability 2 – (457) – – Current portion of contingent purchase considerations on acquisitions 3 (31 348) (990) – –
(31 348) (1 447) – –
Hierachy for fair value measurementFair value determination:Level 1 – Quoted prices (unadjusted) in active markets for identical assets or liabilities.Level 2 – Inputs other than quoted prices included within level 1 that are observable for the asset or liability, either directly or
indirectly.Level 3 – Inputs for the asset or liability that are not based on observable market data.
There were no transfers between the fair value hierarchy levels during the year.
1 Santova Logistics (Pty) Ltd entered into a profit sharing agreement with the landlord of their Durban premises on inception of the lease in the 2007 financial year. The agreement gives Santova Logistics a specified portion of the actual or deemed profit made should the building be sold or vacated. The inputs used to determine the fair value of the profit share are as follows:
Current net market rental (including parking bays) R93 per m2
Capitalisation rate 12%
2 This represents the fair value of the investment by Santova Logistics (Pty) Ltd in the Guardrisk cell captive, recognised as a financial asset with changes in fair value being recognised in profit or loss for the year. The fair value of the cell captive is determined by the net asset value that represents fair value.

Santova Limited Annual Financial Statements 2016
FINANCIAL REPORT
31
5. FINANCIAL ASSETS/(LIABILITIES) CONTINUED3 This represents the present value of the remaining contingent purchase obligations arising from acquisitions during
the current financial period. The fair value of the liabilities has been calculated as the net present value of the warranty payments, which management reasonably expect to be achieved, as set out in the agreements of sale, discounted at the weighted average cost of capital for the acquired entities. The financial liability can be reconciled as follows:
R’000
Financial liability at beginning of year 990 Financial liabilities raised during the year 47 752Interest on present value calculation 627Foreign exchange gain on translation 789
Fair value gain on remeasurement (1 024)
Financial liability at end of year 49 134
The contingent purchase obligations relate to the following acquisitions that were successfully completed during the current year:
Acquiring company Target company Discount rate used
Santova Administration Services (Pty) Ltd Tradeway (Shipping) Limited 6,6%Santova Logistics (Pty) Ltd (SA) AEMC Trading Agency 8,8%
Prior to the acquisition of Tradeway (Shipping), the target company acquired Tradeway North West. This acquisition gave rise to a financial liability as a result of contingent purchase obligations. The weighted average cost of capital used in the calculation of the fair value of this financial liability is equal to that being used to calculate the fair value of the financial liability to the sellers of Tradeway (Shipping).
Management have assessed the sensitivity of the level 3 fair value measurement to changes in unobservable inputs and do not believe that such reasonably expected changes would materially affect the fair value.
Management have assessed the degree of classification of the liabilities within level 3 and are satisfied that the classification above is appropriate due to the fact that these liabilities are measured using the same methods and thus do not have varying degrees of uncertainty or subjectivity.

Santova Limited Annual Financial Statements 201632
NOTES TO THE
ANNUAL FINANCIAL STATEMENTSfor the year ended 29 February 2016
Consolidated Consolidated Company Company2016 2015 2016 2015
R’000 R’000 R’000 R’000
6. DEFERRED TAXATIONDeferred tax comprises:– Capital allowances and provisions 8 414 6 255 1 644 1 379 – Assessed losses 1 304 965 – 602
9 718 7 220 1 644 1 981
Reconciliation of deferred taxation:Balance at beginning of year 7 220 5 376 1 981 1 944
Movements during the year attributable to:– Timing differences 2 109 2 326 299 389 – Prior year 51 (157) (34) – – Rate change – (26) – – – Assessed losses 338 (299) (602) (352)
Balance at end of year 9 718 7 220 1 644 1 981
Comprising:
Deferred tax assets 11 250 8 471 2 481 2 259 Deferred tax liabilities (1 532) (1 251) (837) (278)
Deferred tax assets have been recognised on assessed losses in the relevant entities which the Group believes it is probable will generate a taxable profit in future. The assessments are performed on a continuous basis.
Deferred tax assets amounting to R275 855 (2015: Rnil) have not been recognised during the current year as these relate to entities which the Group believes will not generate taxable profits to offset these losses in the near future.
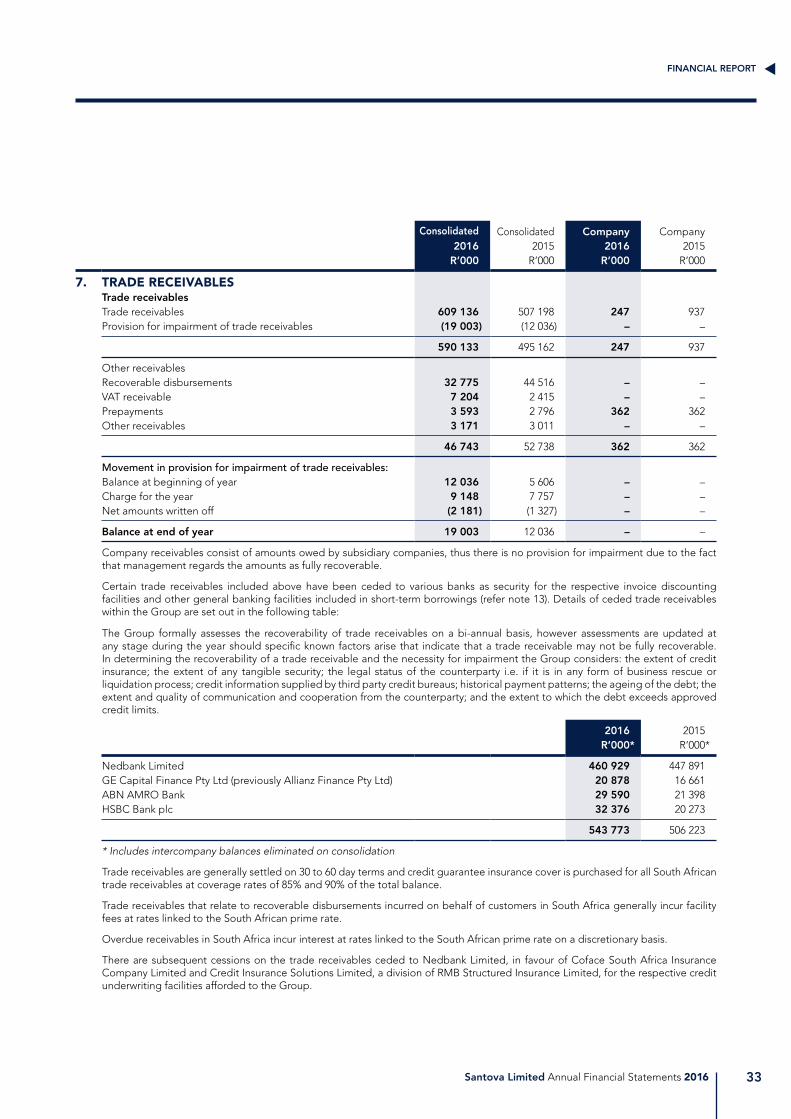
Santova Limited Annual Financial Statements 2016
FINANCIAL REPORT
33
Consolidated Consolidated Company Company2016 2015 2016 2015
R’000 R’000 R’000 R’000
7. TRADE RECEIVABLESTrade receivablesTrade receivables 609 136 507 198 247 937 Provision for impairment of trade receivables (19 003) (12 036) – –
590 133 495 162 247 937
Other receivablesRecoverable disbursements 32 775 44 516 – – VAT receivable 7 204 2 415 – – Prepayments 3 593 2 796 362 362 Other receivables 3 171 3 011 – –
46 743 52 738 362 362
Movement in provision for impairment of trade receivables:Balance at beginning of year 12 036 5 606 – – Charge for the year 9 148 7 757 – – Net amounts written off (2 181) (1 327) – –
Balance at end of year 19 003 12 036 – –
Company receivables consist of amounts owed by subsidiary companies, thus there is no provision for impairment due to the fact that management regards the amounts as fully recoverable.
Certain trade receivables included above have been ceded to various banks as security for the respective invoice discounting facilities and other general banking facilities included in short-term borrowings (refer note 13). Details of ceded trade receivables within the Group are set out in the following table:
The Group formally assesses the recoverability of trade receivables on a bi-annual basis, however assessments are updated at any stage during the year should specific known factors arise that indicate that a trade receivable may not be fully recoverable. In determining the recoverability of a trade receivable and the necessity for impairment the Group considers: the extent of credit insurance; the extent of any tangible security; the legal status of the counterparty i.e. if it is in any form of business rescue or liquidation process; credit information supplied by third party credit bureaus; historical payment patterns; the ageing of the debt; the extent and quality of communication and cooperation from the counterparty; and the extent to which the debt exceeds approved credit limits.
2016 2015 R’000* R’000*
Nedbank Limited 460 929 447 891 GE Capital Finance Pty Ltd (previously Allianz Finance Pty Ltd) 20 878 16 661 ABN AMRO Bank 29 590 21 398 HSBC Bank plc 32 376 20 273
543 773 506 223
* Includes intercompany balances eliminated on consolidation
Trade receivables are generally settled on 30 to 60 day terms and credit guarantee insurance cover is purchased for all South African trade receivables at coverage rates of 85% and 90% of the total balance.
Trade receivables that relate to recoverable disbursements incurred on behalf of customers in South Africa generally incur facility fees at rates linked to the South African prime rate.
Overdue receivables in South Africa incur interest at rates linked to the South African prime rate on a discretionary basis.
There are subsequent cessions on the trade receivables ceded to Nedbank Limited, in favour of Coface South Africa Insurance Company Limited and Credit Insurance Solutions Limited, a division of RMB Structured Insurance Limited, for the respective credit underwriting facilities afforded to the Group.
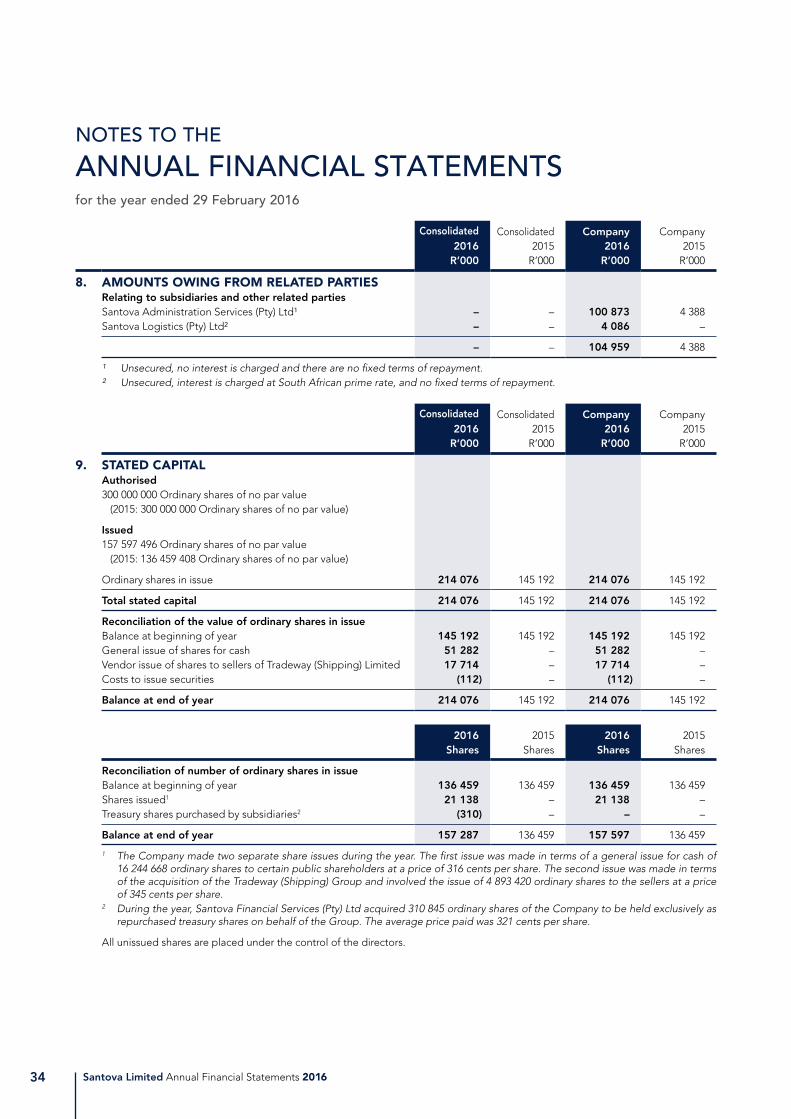
Santova Limited Annual Financial Statements 201634
NOTES TO THE
ANNUAL FINANCIAL STATEMENTSfor the year ended 29 February 2016
Consolidated Consolidated Company Company2016 2015 2016 2015
R’000 R’000 R’000 R’000
9. STATED CAPITALAuthorised300 000 000 Ordinary shares of no par value (2015: 300 000 000 Ordinary shares of no par value)
Issued157 597 496 Ordinary shares of no par value (2015: 136 459 408 Ordinary shares of no par value)
Ordinary shares in issue 214 076 145 192 214 076 145 192
Total stated capital 214 076 145 192 214 076 145 192
Reconciliation of the value of ordinary shares in issueBalance at beginning of year 145 192 145 192 145 192 145 192 General issue of shares for cash 51 282 – 51 282 – Vendor issue of shares to sellers of Tradeway (Shipping) Limited 17 714 – 17 714 – Costs to issue securities (112) – (112) –
Balance at end of year 214 076 145 192 214 076 145 192
2016 2015 2016 2015 Shares Shares Shares Shares
Reconciliation of number of ordinary shares in issueBalance at beginning of year 136 459 136 459 136 459 136 459 Shares issued1 21 138 – 21 138 – Treasury shares purchased by subsidiaries2 (310) – – –
Balance at end of year 157 287 136 459 157 597 136 459
1 The Company made two separate share issues during the year. The first issue was made in terms of a general issue for cash of 16 244 668 ordinary shares to certain public shareholders at a price of 316 cents per share. The second issue was made in terms of the acquisition of the Tradeway (Shipping) Group and involved the issue of 4 893 420 ordinary shares to the sellers at a price of 345 cents per share.
2 During the year, Santova Financial Services (Pty) Ltd acquired 310 845 ordinary shares of the Company to be held exclusively as repurchased treasury shares on behalf of the Group. The average price paid was 321 cents per share.
All unissued shares are placed under the control of the directors.
Consolidated Consolidated Company Company2016 2015 2016 2015
R’000 R’000 R’000 R’000
8. AMOUNTS OWING FROM RELATED PARTIESRelating to subsidiaries and other related partiesSantova Administration Services (Pty) Ltd¹ – – 100 873 4 388 Santova Logistics (Pty) Ltd² – – 4 086 –
– – 104 959 4 388
¹ Unsecured, no interest is charged and there are no fixed terms of repayment.² Unsecured, interest is charged at South African prime rate, and no fixed terms of repayment.

Santova Limited Annual Financial Statements 2016
FINANCIAL REPORT
35
Consolidated Consolidated Company Company2016 2015 2016 2015
R’000 R’000 R’000 R’000
10. INTEREST-BEARING BORROWINGSInstalment sale and other agreements 996 1 347 – – Medium-term loan (R39 million)¹ 17 784 25 541 – – Medium-term loan (R60 million)² 56 883 – 56 883 – Less: current portion included in current liabilities (18 620) (8 088) (9 743) –
57 043 18 800 47 140 –
The instalment sale agreements are secured by the motor vehicles and equipment for which they were raised (refer note 2).
They are repayable over no longer than five years and bear interest at variable market related rates linked to local base rates in the relevant countries.
1 The original R39 million medium term loan was taken by Santova Logistics (South Africa) in 2013 and bears interest at a variable rate of the South African prime rate less 0,5%. It is repayable on an amortising basis over five years at monthly instalments of R806 496 (2015: R803 976). This loan is secured by cross company sureties supplied by the Company and certain subsidiaries.
2 During the year, an additional R60 million medium term loan was taken by Santova Limited (South Africa) and bears interest at a variable rate of the South African prime rate less 0.25%. It is repayable on an amortising basis over five years at quarterly instalments of R3 852 101. This loan is secured by cross company sureties supplied by certain subsidiaries.
The medium-terms loans had both been granted by Nedbank Limited, the Group’s primary bankers.
As a condition of granting the medium term loan facilities, the Group banking facilities contain certain covenants with respect to minimum levels of actual shareholders’ funds and to minimum ratios of annual plus cumulative free cash flow generation to net interest and capital serviced on the Santova Limited medium term loan. These covenants are monitored on an ongoing basis by management and reviewed and confirmed with the Group’s bankers. As at the end of the current financial period, none of the covenants have been breached.

Santova Limited Annual Financial Statements 201636
NOTES TO THE
ANNUAL FINANCIAL STATEMENTSfor the year ended 29 February 2016
Consolidated Consolidated Company Company2016 2015 2016 2015
R’000 R’000 R’000 R’000
11. LONG-TERM PROVISIONPost-retirement medical aid benefits for the Group and the Company:– Present value obligation 1 500 1 700 1 500 1 700 – Less: liability already recognised (1 700) (1 777) (1 700) (1 777)
Decrease in liability (200) (77) (200) (77)
Movement represented by:– Actuarial (gain)/loss (18) 90 (18) 90 – Interest cost 110 125 110 125 – Contributions paid to fund (292) (292) (292) (292)
Decrease in liability (200) (77) (200) (77)
The Company contributes to a medical aid scheme for the benefit of 14 retired employees (2015: 14) and their dependants. During the year under review there were no exits from the scheme among the continuation members (2015: one). The Company contributes 75,0% of the monthly contribution (to a maximum of R1 600 per retired employee) and the retired employees contribute the remainder. The liability has been actuarially determined and the present value of post-retirement medical aid obligations for these retired employees is shown above.
The principal actuarial assumptions applied in the determination of fair values, expressed as weighted averages include:
– Medical aid inflation rate: 7,9% per annum (2015: 6,3%);– Discount factor 8,9% per annum (2015: 7,0%); and– Mortality rates are taken from the PA(90) Ultimate Mortality Tables.
Sensitivity analysis: mortality rateThe actuaries have assumed that the deviations from the assumed level of mortality experience of the continuation members (pensioners) will have a large impact on the actual cost to the Company. If the actual rates of mortality turns out higher than the rates assumed in the valuation basis, the cost to the Company in the form of subsidies will reduce and vice versa.
As can be seen below, the higher mortality rate, the lower the liability to the Company.
-20,0 % Mortality
rate Valuation
assumption
+20,0 % Mortality
rate R’000 R’000 R’000
Total accrued liability 1 629 1 500 1 394 Interest cost 134 122 113
The liability is valued annually. The latest actuarial valuation was performed in February 2016, on a projected unit credit method, by ZAQ Consultants and Actuaries (Pty) Ltd, independent qualified actuaries.

Santova Limited Annual Financial Statements 2016
FINANCIAL REPORT
37
Consolidated Consolidated Company Company2016 2015 2016 2015
R’000 R’000 R’000 R’000
12. AMOUNTS OWING TO RELATED PARTIESPatent International Co., Ltd1 302 216 – – Santova Financial Services (Pty) Ltd – – – 4 443 Santova Logistics (Pty) Ltd – – – 13 736 WM Shipping Limited – – – 3 741
302 216 – 21 920
1 Unsecured, interest-free and has no fixed terms of repayment (consistent with prior year).
Consolidated Consolidated Company Company2016 2015 2016 2015
R’000 R’000 R’000 R’000
13. SHORT-TERM BORROWINGS AND OVERDRAFTSBank overdrafts 765 – – – Invoice discounting facilities 262 153 280 838 – –
262 918 280 838 – –
In addition, the Group has the following unutilised facilities available:
Country
Local currency
FC’000
Functional currency
R’000
Prioryear
R’000 Security provided Interest
rate
Invoice discounting – repayable on settlement of ceded debts
South Africa n/a 87 847 69 162 Sale of book debts, cession of credit
insurance policies and cross company suretyships
with the Company and certain subsidiaries
South African prime rate
less 0,5%
Australia 1 500 17 157 13 493 Security interest in personal property
Australian base rate
plus 4,25%
Bank overdraft – repayable on demand
South Africa n/a 21 000 21 000 Ceded debit balances South African prime rate
less 0,5%
Mauritius 650 196 – None Key repo rate plus a margin
of 3%
Netherlands 500 8 737 6 477 Cession of book debts
Euro base rate plus
1,75%
Germany 78 673 356 Unsecured Fixed rate of 6,5%
135 610 110 488
For further information on ceded trade receivables refer note 7.

Santova Limited Annual Financial Statements 201638
NOTES TO THE
ANNUAL FINANCIAL STATEMENTSfor the year ended 29 February 2016
Carrying value at
beginning of year
Provisions created/(released)
Carrying value
at end of year
R’000 R’000 R’1000
14. SHORT-TERM PROVISIONSConsolidated2016Bonuses 11 114 4 532 15 646 Leave pay 3 930 2 204 6 134 Other short-term provisions 528 771 1 299
15 572 7 507 23 079
2015Bonuses 12 949 (1 835) 11 114 Leave pay 3 598 332 3 930 Other short-term provisions 293 235 528
16 840 (1 268) 15 572
Company2016Bonuses 2 300 2 357 4 657 Leave pay 659 189 848
2 959 2 546 5 505
2015Bonuses 1 790 510 2 300 Leave pay 492 167 659
2 282 677 2 959
Leave pay benefits are expected to be realised within one year of reporting date. Group policy requires that all leave pay benefits accrued in the period to be utilised within six months of the subsequent year.
Discretionary incentive bonuses are paid on an annual basis, and are based on the Group, subsidiary entity and individual employee’s performance, as assessed and approved by the Remuneration Committee.
Other short-term provisions relate to the leave benefits accruing to Australian employees for long service and to a minor claim for loss against the subsidiary in the Netherlands.

Santova Limited Annual Financial Statements 2016
FINANCIAL REPORT
39
Consolidated Consolidated Company Company2016 2015 2016 2015
R’000 R’000 R’000 R’000
15.1 REVENUEGross billings 3 797 890 3 462 792 38 472 33 200 Less: Recoverable disbursments (3 519 235) (3 238 557) (2 915) (3 380)
Revenue 278 655 224 235 35 557 29 820 Comprising revenue from:Logistics services 256 690 203 811 – – Net interest and fee Income from client financing activities 12 488 11 438 – – Insurance commission and management fees 8 973 8 633 35 557 29 820 Other revenue 504 353 – –
15.2 VOLUNTARY CHANGE IN PRESENTATION AND CLASSIFICATIONThe following voluntary change in accounting presentation and classification, in terms of IAS 1 Presentation of Financial Statements (“IAS 1”), has been applied during the period under review resulting in the restatement and reclassification of certain comparatives for the year ended 28 February 2015.
IAS 1 Presentation of Financial Statements – Reclassification of the net interest and fee income from client financing activities to revenueInterest expense, interest income, fee income and fee expense relating to client financing activities have previously been disclosed in the Group Statement of Profit or Loss and Other Comprehensive Income as finance costs, interest received, other income and administration expenses respectively. During the period under review, the Group’s management resolved to account for this net interest and fee income as revenue. The Group generates net interest and fee revenue through the provision of short-term finance facilities to clients for logistics related recoverable disbursements, effectively acting as a financial institution. The Group’s management regards this as a principal revenue-producing activity. The Group funds these short-term receivables through the ongoing sale of such receivables to its principal banker via an invoice discounting facility, on which it incurs an interest expense. To enable the Group to access this invoice discounting facility it is a requirement of the Group’s Bankers that the receivables being financed are insured by a third-party credit underwriter and management views this cost as part of the effective cost of finance.
The Group believes that this change in presentation and classification will result in more relevant and reliable information being presented in respect of its client-financing activities by matching all the direct related interest income, fee income and expenses associated with this principal revenue producing activity and disclosing it as part of revenue.
In addition this change in classification and presentation further reinforces the voluntary change in accounting policy applied by the Group in the previous reporting period, whereby the cash inflows and outflows relating to this principal revenue generating activity were reclassified as operating cash flows
As required by IAS 1, this change in presentation and classification has been retrospectively applied, resulting in the restatement of the Group’s Statement of Comprehensive Income and Statement of Cash Flows as disclosed below. This change in presentation and classification has not resulted in any changes or restatement to the Group’s Statement of Financial Position.
Group Group2015 2014
Impact of the change on: R’000 R’000
Statement of profit or loss and other comprehensive incomeRevenue (12 798) (12 478)Other income (806) – Administrative expenses 6 057 4 705
Operating profit (7 547) (7 773)Interest received (8 455) (4 257)Finance costs 16 002 12 030
Profit before taxation – –
Statement of cash flowsCash generated from operations (7 547) (7 773)Interest received (8 455) (4 257)Finance costs 16 002 12 030
Net cash flows from operating activities – –

Santova Limited Annual Financial Statements 201640
NOTES TO THE
ANNUAL FINANCIAL STATEMENTSfor the year ended 29 February 2016
Consolidated Consolidated Company Company2016 2015 2016 2015
R’000 R’000 R’000 R’000
16. OPERATING PROFITOperating profit is stated after:
IncomeBad debts recovered 175 142 22 33 Dividends received from subsidiaries – – – 1 133 Foreign exchange commission and valuation gains 5 184 5 363 – – Profit on disposals of plant and equipment 124 334 1 8 Fair value gain on financial liability 1 024 5 896 1 024 5 896
ExpenditureAuditors’ remuneration 2 668 2 250 375 377
– In respect of audit services 1 988 1 850 375 377 – In respect of other services 680 400 – –
Depreciation and amortisation 4 043 3 311 1 408 1 129
– Property, plant and equipment (refer note 2) 2 913 2 454 348 351 – Intangible assets (refer note 3) 1 130 857 1 060 778
Lease rentals 12 126 10 033 674 637
– Premises 11 143 8 857 674 637 – Equipment 66 443 – – – Motor vehicles 917 733 – –
Loss on disposal of plant and equipment 380 204 – – Net actuarial loss recognised (refer note 11) – 90 – 90 Impairment of investment (refer note 4) – – – 3 892 Impairment of goodwill (refer note 3.3) – 3 892 – – Foreign exchange losses 1 373 166 – 81 Staff costs (including directors’ emoluments) 146 141 115 862 22 241 17 132 Share option expense 1 335 1 142 678 571

Santova Limited Annual Financial Statements 2016
FINANCIAL REPORT
41
Directors’ fees
Basic remuneration
Performance bonus
Retirement, medical
and other benefits Total
R’000 R’000 R’000 R’000 R’000
17. DIRECTORS’ EMOLUMENTS2016Executive directors DC Edley – 1 472 625 270 2 367 GH Gerber – 2 669 1 183 63 3 915 AL van Zyl – 1 856 714 78 2 648
Prescribed officers AKG Lewis – 1 021 400 129 1 550
Non-executive directors AD Dixon 148 – – – 148 ESC Garner 349 – – – 349 WA Lombard 204 – – – 204 EM Ngubo 73 – – – 73
774 7 018 2 922 540 11 254
Paid by: The Company 774 5 162 2 208 462 8 606 Subsidiary company – 1 856 714 78 2 648
774 7 018 2 922 540 11 254
2015Executive directors DC Edley – 1 360 285 253 1 898 GH Gerber – 2 428 551 55 3 034 AL van Zyl – 1 754 349 71 2 174
Prescribed officers AKG Lewis – 887 130 113 1 130
Non-executive directors AD Dixon 145 – – – 145 ESC Garner 318 – – – 318 WA Lombard 173 – – – 173 EM Ngubo 75 – – – 75
711 6 429 1 315 492 8 947
Paid by: The Company 711 4 675 966 421 6 773 Subsidiary company – 1 754 349 71 2 174
711 6 429 1 315 492 8 947
Refer to the Remuneration Report on pages 36 to 39 of the Annual Integrated Report for additional disclosure on key management personnel compensation.

Santova Limited Annual Financial Statements 201642
NOTES TO THE
ANNUAL FINANCIAL STATEMENTSfor the year ended 29 February 2016
17. DIRECTORS’ EMOLUMENTS CONTINUEDA summary of share options granted, forfeited and still to be exercised by executive directors and prescribed officers in terms of the Group Share Option Schemes (refer note 24 for further information) are as follows:
Options Options as at as at Option
1 March Options Options Options 29 February price Vesting 2015 awarded lapsed exercised 2016 (cents) date
2016Executive directors DC Edley 450 000 – – – 450 000 85 30 November 2015
350 000 – – – 350 000 186 26 May 2017 – 168 649 – – 168 649 415 21 February 2019 – 131 351 – – 131 351 415 21 February 2021
800 000 300 000 – – 1 100 000
GH Gerber 800 000 – – – 800 000 85 30 November 2015 500 000 – – – 500 000 186 26 May 2017
– 562 165 – – 562 165 415 21 February 2019 – 437 835 – – 437 835 415 21 February 2021
1 300 000 1 000 000 – – 2 300 000
AL van Zyl 500 000 – – – 500 000 85 30 November 2015 350 000 – – – 350 000 186 26 May 2017
– 168 649 – – 168 649 415 21 February 2019 – 131 351 – – 131 351 415 21 February 2021
850 000 300 000 – – 1 150 000
Prescribed officerA Lewis 199 000 – – – 199 000 85 30 November 2015
150 000 – – – 150 000 186 26 May 2017 – 253 537 – – 253 537 415 21 February 2019 – 197 463 – – 197 463 415 21 February 2021
349 000 451 000 – – 800 000
3 299 000 2 051 000 – – 5 350 000

Santova Limited Annual Financial Statements 2016
FINANCIAL REPORT
43
17. DIRECTORS’ EMOLUMENTS CONTINUED
Options Options as at as at Option
1 March Options Options Options 28 February price Vesting 2014 awarded lapsed exercised 2015 (cents) date
2015Executive directors DC Edley 450 000 – – – 450 000 85 30 November 2015
– 350 000 – – 350 000 186 26 May 2017
450 000 350 000 – – 800 000
GH Gerber 800 000 – – – 800 000 85 30 November 2015 – 500 000 – – 500 000 186 26 May 2017
800 000 500 000 – – 1 300 000
AL van Zyl 500 000 – – – 500 000 85 30 November 2015 – 350 000 – – 350 000 186 26 May 2017
500 000 350 000 – – 850 000
Prescribed officerA Lewis 199 000 – – – 199 000 85 30 November 2015
– 150 000 – – 150 000 186 26 May 2017
199 000 150 000 – – 349 000
1 949 000 1 350 000 – – 3 299 000

Santova Limited Annual Financial Statements 201644
NOTES TO THE
ANNUAL FINANCIAL STATEMENTSfor the year ended 29 February 2016
Consolidated Consolidated Company Company2016 2015* 2016 2015
R’000 R’000 R’000 R’000
18. INTEREST RECEIVEDInterest received from third parties 205 231 – – Interest received from related parties – – 286 51
205 231 286 51
19. FINANCE COSTSBank overdrafts (refer note 13) 9 21 – – Financial liabilities (refer note 5) 630 263 – 149 Interest-bearing borrowings (refer note 10) 3 607 2 692 – – Interest paid to related parties (refer note 12) – – 1 595 1 258 Other interest paid 9 3 1 341 –
4 255 2 979 2 936 1 407
* Restated due to voluntary change in presentation and classification as detailed in note 15.2.
20. INCOME TAXSouth African normal taxCurrent tax– Current year 9 221 7 999 89 – – Prior year 31 – (21) – Deferred tax– Current year (744) (1 421) 303 (37)– Prior year (51) 195 34 –
8 457 6 773 405 (37)
Foreign tax– Current tax 10 282 6 012 – – – Deferred tax (1 703) (619)– Capital gains tax (195) – – –
8 384 5 393 – –
Tax for the year 16 841 12 166 405 (37)
Reconciliation of rate of taxation % % % %
South African normal tax rate 28,0 28,0 28,0 28,0 Adjusted for:– Local exempt income, disallowable expenditure and allowances (0,4) (3,0) (126,8) (29,2)
Learnership allowances (0,7) (0,7) – –Fair value adjustments (1,0) (3,2) – (55,5)Non-deductible interest 0,9 – (104,7) 0,2 Non-deductible capital expenditure 0,5 – (42,2) 0,1 Dividends – (1,3) – (10,7)Impairment of investment – 2,1 – 36,7 Other items (0,1) 0,1 20,1 –
– Foreign disallowable expenditure/(exempt income) 0,9 (0,5) – – – Foreign tax differential (2,9) (1,0) – – – Capital gains tax (0,3) – – –– Prior year: current tax – – 5,4 – – Prior year: deferred tax (0,1) 0,2 (8,6) –
Effective tax rate 25,2 23,7 (102,0) (1,2)
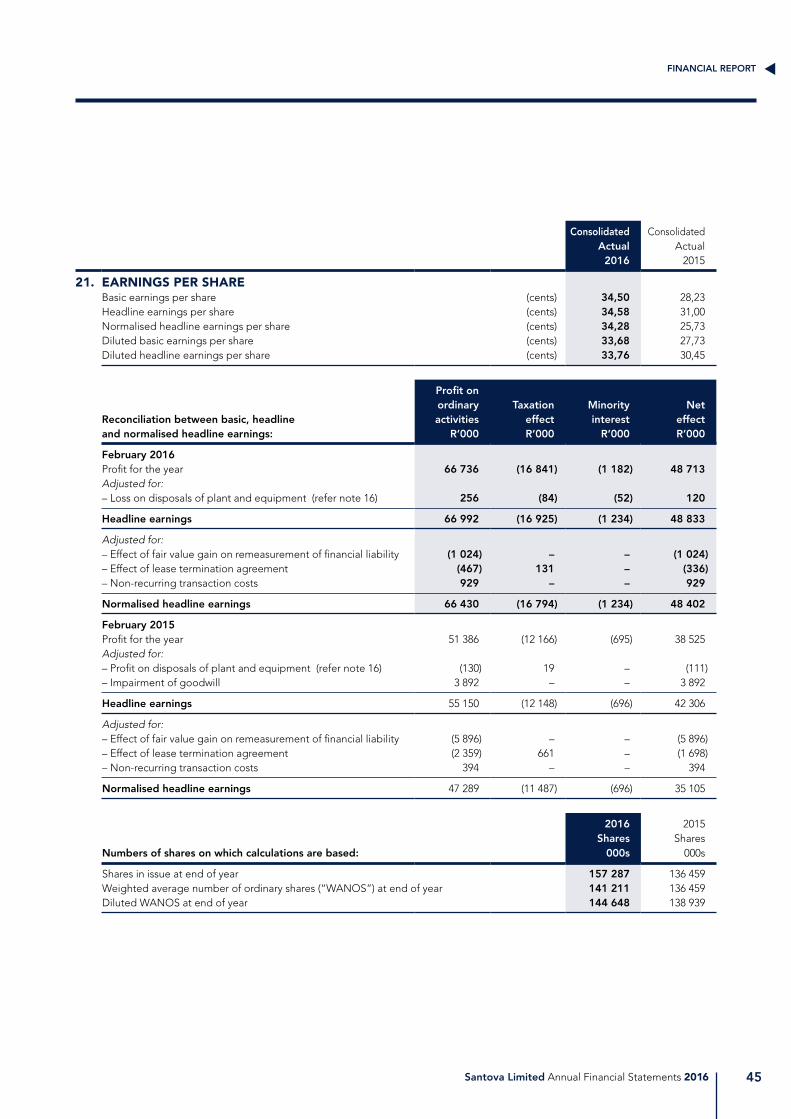
Santova Limited Annual Financial Statements 2016
FINANCIAL REPORT
45
Consolidated ConsolidatedActual Actual
2016 2015
21. EARNINGS PER SHAREBasic earnings per share (cents) 34,50 28,23 Headline earnings per share (cents) 34,58 31,00 Normalised headline earnings per share (cents) 34,28 25,73 Diluted basic earnings per share (cents) 33,68 27,73 Diluted headline earnings per share (cents) 33,76 30,45
Profit onordinary Taxation Minority Net
Reconciliation between basic, headline activities effect interest effectand normalised headline earnings: R’000 R’000 R’000 R’000
February 2016Profit for the year 66 736 (16 841) (1 182) 48 713 Adjusted for:– Loss on disposals of plant and equipment (refer note 16) 256 (84) (52) 120
Headline earnings 66 992 (16 925) (1 234) 48 833
Adjusted for:– Effect of fair value gain on remeasurement of financial liability (1 024) – – (1 024)– Effect of lease termination agreement (467) 131 – (336)– Non-recurring transaction costs 929 – – 929
Normalised headline earnings 66 430 (16 794) (1 234) 48 402
February 2015Profit for the year 51 386 (12 166) (695) 38 525 Adjusted for:– Profit on disposals of plant and equipment (refer note 16) (130) 19 – (111)– Impairment of goodwill 3 892 – – 3 892
Headline earnings 55 150 (12 148) (696) 42 306
Adjusted for:– Effect of fair value gain on remeasurement of financial liability (5 896) – – (5 896)– Effect of lease termination agreement (2 359) 661 – (1 698)– Non-recurring transaction costs 394 – – 394
Normalised headline earnings 47 289 (11 487) (696) 35 105
2016 2015Shares Shares
Numbers of shares on which calculations are based: 000s 000s
Shares in issue at end of year 157 287 136 459 Weighted average number of ordinary shares (“WANOS”) at end of year 141 211 136 459 Diluted WANOS at end of year 144 648 138 939

Santova Limited Annual Financial Statements 201646
NOTES TO THE
ANNUAL FINANCIAL STATEMENTSfor the year ended 29 February 2016
Consolidated Consolidated Company Company2016 2015* 2016 2015
R’000 R’000 R’000 R’000
22. NOTES TO THE STATEMENTS OF CASH FLOW22.1Cash generated from operations
Profit before taxation 66 736 51 386 (397) 2 972 Adjustments for:Depreciation and amortisation 4 043 3 311 1 409 1 129 Net loss/(profit) on disposal of plant and equipment 256 (130) – (12)Impairment of goodwill – 3 892 – – Impairment of investment – – – 3 892 Interest received (205) (231) (286) (51)Finance costs 4 255 2 979 2 936 1 407 Dividends received – (1 200) – (1 133)Foreign exchange loss/(gain) on financial liabilities and dividends 789 (128) – (40)Movement in fair value of financial assets and liabilities (2 807) (8 334) – (6 253)Movement in retirement benefits (182) (77) (182) (77)Movement in share option expense 1 326 1 138 678 571 Working capital changes:Proceeds from sale of trade receivables (18 685) 72 333 – – Increase in trade and other receivables (31 028) (13 140) 690 (355)Increase in trade payables and provisions 23 728 (65 661) 3 002 876
48 226 46 138 7 850 2 926
22.2Taxation paidCharge in the statements of comprehensive income 16 841 12 166 405 37 Adjustment for deferred tax 2 498 1 843 (337) (37)Movement in taxation balance (4 950) 600 (68) –
14 389 14 609 – –
22.3Net cash flow on acquisition of subsidiariesFair value of assets acquired:Plant and equipment 15 549 – – – Intangible assets 15 524 – – –Trade receivables 57 948 17 119 – – Other receivables – 275 – – Cash and cash equivalents 33 277 1 301 – – Interest-bearing borrowings – (414) – –Trade and other payables (26 107) (17 468) – – Financial liability (34 992) – – –Short-term borrowings and overdraft – (183) – –
Net assets acquired 61 199 630 – – Goodwill 61 828 4 050 – –
Purchase consideration 123 027 4 680 – – Contingent purchase considerations (37 574) (1 052) – –Settled in shares (17 714) – – –
Settled in cash 67 739 3 628 – – Settlement of portion of financial liability acquired on acquisition 24 813 – – –Settlement of contingent purchase consideration for prior year acquisitions – 1 111 – – Less: cash and cash equivalents acquired on acquisition (33 277) (1 301) – –
59 275 3 438 – –
* Restated due to voluntary change in presentation and classification as detailed in note 15.2

Santova Limited Annual Financial Statements 2016
FINANCIAL REPORT
47
Consolidated Consolidated Company Company2016 2015 2016 2015
R’000 R’000 R’000 R’000
23. EMPLOYEE BENEFITSRetirement benefit expense– Provident and pension 9 979 7 402 1 280 1 208
Defined contribution retirement plansThe Group makes retirement benefits available to its employees. A defined contribution provident fund and pension fund, which are subject to the Pensions Fund Act 1956, exist for this purpose in South Africa, with similar alternative retirement benefit options available for employees of certain foreign subsidiaries. In other foreign subsidiaries the Group makes statutory contributions to government established and managed pension funds or social security funds that provide retirement benefits. The schemes are funded by employer and employee contributions, which are charged to the respective entities’ statement of comprehensive income as they are incurred.
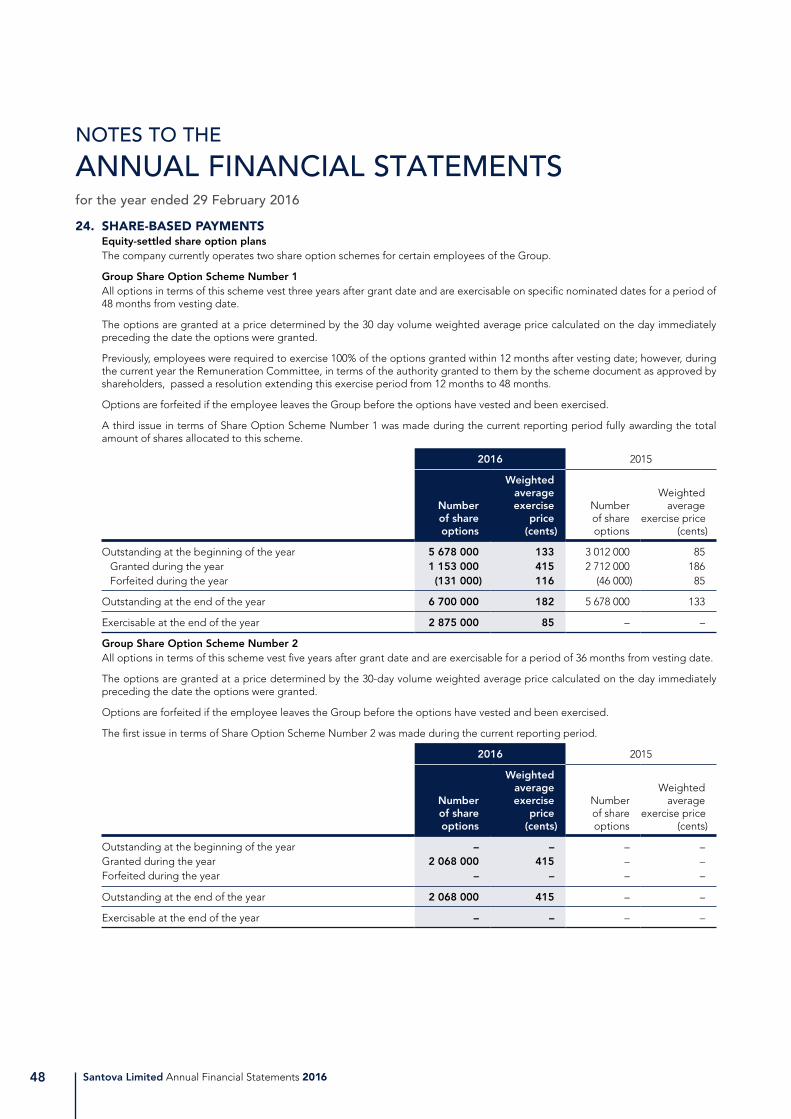
Santova Limited Annual Financial Statements 201648
NOTES TO THE
ANNUAL FINANCIAL STATEMENTSfor the year ended 29 February 2016
24. SHARE-BASED PAYMENTSEquity-settled share option plansThe company currently operates two share option schemes for certain employees of the Group.
Group Share Option Scheme Number 1All options in terms of this scheme vest three years after grant date and are exercisable on specific nominated dates for a period of 48 months from vesting date.
The options are granted at a price determined by the 30 day volume weighted average price calculated on the day immediately preceding the date the options were granted.
Previously, employees were required to exercise 100% of the options granted within 12 months after vesting date; however, during the current year the Remuneration Committee, in terms of the authority granted to them by the scheme document as approved by shareholders, passed a resolution extending this exercise period from 12 months to 48 months.
Options are forfeited if the employee leaves the Group before the options have vested and been exercised.
A third issue in terms of Share Option Scheme Number 1 was made during the current reporting period fully awarding the total amount of shares allocated to this scheme.
2016 2015
Number of share options
Weighted average exercise
price (cents)
Number of share options
Weighted average
exercise price (cents)
Outstanding at the beginning of the year 5 678 000 133 3 012 000 85 Granted during the year 1 153 000 415 2 712 000 186 Forfeited during the year (131 000) 116 (46 000) 85
Outstanding at the end of the year 6 700 000 182 5 678 000 133
Exercisable at the end of the year 2 875 000 85 – –
Group Share Option Scheme Number 2All options in terms of this scheme vest five years after grant date and are exercisable for a period of 36 months from vesting date.
The options are granted at a price determined by the 30-day volume weighted average price calculated on the day immediately preceding the date the options were granted.
Options are forfeited if the employee leaves the Group before the options have vested and been exercised.
The first issue in terms of Share Option Scheme Number 2 was made during the current reporting period.
2016 2015
Number of share options
Weighted average exercise
price (cents)
Number of share options
Weighted average
exercise price (cents)
Outstanding at the beginning of the year – – – – Granted during the year 2 068 000 415 – – Forfeited during the year – – – –
Outstanding at the end of the year 2 068 000 415 – –
Exercisable at the end of the year – – – –

Santova Limited Annual Financial Statements 2016
FINANCIAL REPORT
49
24. SHARE-BASED PAYMENTS CONTINUEDThe fair value calculation of the options granted was performed by the Company utilising the Black-Scholes formula using director’s best estimates and information from the Company’s bankers and other independent institutions.
The inputs into the model were as follows:Consolidated Consolidated
2016 2015
Scheme 1 Issue 1Weighted average share price (cents) 85,0 85,0 Weighted average exercise price (cents) 42,5 42,5 Expected volatility (%) 45,56 45,56 Expected option lifetime (years) 3 3 Risk-free rate based on zero-coupon government bond yield (%) 5,11 5,11 Expected dividend yield (%) 2,98 2,98
Scheme 1 Issue 2Weighted average share price (cents) 186,00 186,00 Weighted average exercise price (cents) 93,00 93,00 Expected volatility (%) 37,70 37,70 Expected option lifetime (years) 3,00 3,00 Risk-free rate based on zero-coupon government bond yield (%) 7,36 7,36 Expected dividend yield (%) 3,00 3,00
Scheme 1 Issue 3Weighted average share price (cents) 415,00 – Weighted average exercise price (cents) 207,50 – Expected volatility (%) 19,48 – Expected option lifetime (years) 3,00 – Risk-free rate based on zero-coupon government bond yield (%) 8,63 – Expected dividend yield (%) 1,50 –
Scheme 2 Issue 1Weighted average share price (cents) 415,00 – Weighted average exercise price (cents) 415,00 – Expected volatility (%) 16,52 – Expected option lifetime (years) 5,00 – Risk-free rate based on zero-coupon government bond yield (%) 8,63 – Expected dividend yield (%) 1,50 –
The expected volatility is determined utilising a model to calculate the forecasted average 30-day volatility in the companies’ share price over the period of the option. The inputs utilised in the model are based on historical data and managements best estimate of forward market projections.
In the case of share option scheme number 1, the weighted average exercise price for the calculation of the fair value of the options takes into account a 50% cash contribution from the Company upon exercise, in terms of the approved scheme.
The Group has raised an equity compensation reserve in the statement of financial position in terms of IFRS 2:Share-based payments. The reserve will only be realised as options are exercised by employees.
The Group recognised an expense related to these equity-settled share-based payment transactions during the year, the value of which has been disclosed in note 16.

Santova Limited Annual Financial Statements 201650
NOTES TO THE
ANNUAL FINANCIAL STATEMENTSfor the year ended 29 February 2016
Consolidated Consolidated Company Company2016 2015 2016 2015
R’000 R’000 R’000 R’000
25. COMMITMENTSOperating lease commitmentsNo later than one year 8 740 6 499 – – Later than one year and no later than five years 10 758 8 347 – –
19 498 14 846 – –
The Group leases offices, motor vehicles, and certain of its office equipment in terms of operating leases. The Group does not have the option to acquire the assets at the termination of the lease and there are no restrictions imposed by the leases. Certain leased premises are subject to profit sharing agreements (refer note 5).
The future minimum lease payments under non-cancellable operating leases are shown above.
Insurance cell captiveSantova Logistics operates a cell captive with Guardrisk Insurance Company Limited to cover the underlying deductibles of their Open Marine Cargo Insurance policy. In the event of claims being lodged in terms of the Marine Insurance Policy, the insurance cell captive referred to in note 5 will be required to cover the first R50 000 of any claim up to a limit of R100 000 for any one loss or series of losses arising from the same event. The balance of the claim is covered by the Marine Insurance Policy’s underwriters.
The maximum liability of the cell captive is limited to R750 000 per year, provided that this is matched by the premiums received during the year. Should the premiums received for the year amount to less than R750 000, then Santova Logistics will be liable to fund the cell captive to cover the shortfall.
The cell has received premiums in excess of the R750 000 minimum required during the current year.
Based on the claims history and the likelihood of future claims, the directors believe that the cell captive has adequate reserves and provisions to cover future claims raised.

Santova Limited Annual Financial Statements 2016
FINANCIAL REPORT
51
26. RELATED PARTIESDuring the year, the Company, in the ordinary course of business, entered into various transactions with its subsidiaries.
These transactions occurred under terms that are no more or less favourable than those arranged with third-party companies.
All intercompany transactions and balances within the Group are eliminated in full on consolidation.
Refer to notes 8 and 12 for amounts owing from and to related parties which are not part of the Group structure.
Net of gross billings and cost of billings for
goods and services
Net outstanding balances arising from sale/purchase of
goods and services
2016 2015 2016 2015 R’000 R’000 R’000 R’000
COMPANYJet-Freight Services Ltd (Mauritius) 15 – 15 – MasterFreight Internationale Spedition GmbH (Germany) 99 – – – Santova Express (Pty) Ltd 147 51 – (3)Santova Financial Services (Pty) Ltd 1 491 1 471 14 106 Santova Logistics (Pty) Ltd 31 583 28 122 (19) 592 Santova Logistics B.V. (Netherlands) 1 860 965 (14) (62)Santova Logistics Ltd (Hong Kong) 352 314 – 54 Santova Logistics Ltd (United Kingdom) 566 540 47 39 Santova Logistics Pty Ltd (Australia) 714 587 147 – WM Shipping Limited (United Kingdom) 945 588 – 54
37 772 32 638 190 780
Interest on loans (from)/to related parties
Loans to/(from) related parties
2016 2015 2016 2015R’000 R’000 R’000 R’000
COMPANYSantova Administration Services (Pty) Ltd – – 100 873 4 388 Santova Financial Services (Pty) Ltd (385) (367) – (4 443)Santova Logistics (Pty) Ltd (670) (858) 4 086 (13 736)Santova Logistics B.V. (Netherlands) – 51 – – WM Shipping Limited (United Kingdom) – (33) – (3 741)
(1 055) (1 207) 104 959 (17 532)
All of the above parties are subsidiaries, directly or indirectly, of the Company.
Refer note 17 for disclosure of remuneration of key management personnel.

Santova Limited Annual Financial Statements 201652
NOTES TO THE
ANNUAL FINANCIAL STATEMENTSfor the year ended 29 February 2016
Consolidated Consolidated Company Company2016 2015 2016 2015
R’000 R’000 R’000 R’000
27. FINANCIAL RISK MANAGEMENT, OBJECTIVES AND POLICIESCategories of financial instruments
Financial assetsLoans and receivables 636 876 547 900 105 568 5 687 Financial assets at fair value through profit or loss 4 562 3 235 – –
Financial liabilitiesFinancial liabilities measured at amortised cost 604 171 483 215 59 242 23 823
Reconciliation to statements of financial position
Trade receivables 590 133 495 162 247 937 Other receivables 46 743 52 738 362 362 Amounts owing from related parties – – 104 959 4 388
Loans and receivables 636 876 547 900 105 568 5 687
Financial assets 4 562 3 235 – –
Financial assets at fair value through profit or loss 4 562 3 235 – –
Trade and other payables 216 154 173 826 2 359 1 903 Amounts owing to related parties 302 216 – 21 920 Interest-bearing borrowings 75 663 26 888 56 883 – Financial liabilities 49 134 1 447 – – Short-term borrowings and overdraft 262 918 280 838 – –
Financial liabilities measured at amortised cost 604 171 483 215 59 242 23 823
Significant accounting policiesDetails of significant accounting policies and methods adopted in respect of each class of financial asset, financial liability and equity instrument are disclosed under significant accounting policies on pages 12 to 23 of these financial statements.
Financial risk profileIn the normal course of operations, the Group is exposed to foreign currency risk, interest rate risk, credit risk and liquidity risk.
The risk management policies of the Group relating to each of these risks is discussed below.

Santova Limited Annual Financial Statements 2016
FINANCIAL REPORT
53
27. FINANCIAL RISK MANAGEMENT, OBJECTIVES AND POLICIES CONTINUED27.1Foreign currency risk management
As the result of the Group’s extensive investments in offshore operating subsidiaries which contribute the majority of its profit after tax, the Group has significant exposure to foreign currency risk. This exposure is created in a number of ways and impacts the financial results of the Group in a number of ways:
1. Translation differences arising from generation and reporting of profits from the Group’s offshore subsidiaries in foreign currencies, which impact directly on profit or loss.
2. Translation differences arising from the revaluation of the Group’s investments in its foreign subsidiaries and the goodwill related to those investments, which are reported in other comprehensive income.
3. Foreign currency gains or losses that arise from the translation of foreign currency assets and liabilities from the reporting currency of each operating entity, which impacts directly on profit or loss.
The Group’s policy is to cover the exposures related to all foreign currency assets and liabilities that will be settled in South African rands and that arise in the ordinary course of business by utilising forward exchange contracts. The Group does not hedge or cover the exposures related to the translation of foreign profits earned by offshore subsidiaries, the translation of its investments and goodwill in foreign subsidiaries and it does not cover the foreign currency assets and liabilities within its foreign operating entities.
The carrying amount of the Group’s foreign currency denominated monetary assets and monetary liabilities, in currencies other than the reporting currency of each operating entity, at the reporting date are as follows:
2016 2015
Foreign currency balances
Forward exchange contracts
Net position
Foreign currency balances
Forward exchange contracts
Net position
R’000 R’000 R’000 R’000 R’000 R’000
Credit balancesAustralian Dollar (267) 40 (227) (21) 17 (4)British Pound (1 377) 742 (635) (657) 598 (59)Euro (3 469) 2 292 (1 177) (1 374) 1 363 (11)US Dollar (21 843) 2 340 (19 503) (9 133) 4 778 (4 355)Other (379) 195 (184) (497) 485 (12)
Debit balancesUS Dollar 39 267 (334) 38 933 14 741 (387) 14 354 Euro 444 – 444 829 – 829 Other – – – 2 – 2
12 376 5 275 17 651 3 890 6 854 10 744
Foreign currency sensitivityThe Group’s exchange rate exposure relates mainly to the Euro, British Pound and the United States Dollar. The following details the Group’s sensitivity to a 10,0% increase or decrease in the Rand against the relevant foreign currencies. 10,0% is the sensitivity rate used when reporting foreign currency internally to key management personnel and represents management’s best assessment of the possible change in foreign exchange rates. The sensitivity analysis includes only outstanding foreign currency denominated monetary items and adjusts their translation at the year end for a 10,0% change in foreign currency rates. The amounts below indicate the amount by which profit or loss and equity would increase or decrease if the Rand strengthens or weakens by 10,0%.
2016 2015
Sensitivity analysisIf the foreign currency rates had been 10,0% higher/lower and all other variables held constant,the Group’s profit (pre-tax) for the year would increase/decrease by 1 765 1 074

Santova Limited Annual Financial Statements 201654
NOTES TO THE
ANNUAL FINANCIAL STATEMENTSfor the year ended 29 February 2016
27.2 Interest rate risk managementThe Group is exposed to interest rate risk in respect of variable rate borrowings and fixed and variable rate disbursement fees on monies disbursed on behalf of customers. This risk is managed predominantly through monitoring and renegotiation of interest rates by management on an ongoing basis with financing suppliers and customers in order to maintain acceptable interest margins.
Interest rate sensitivityThe sensitivity analysis below has been determined based on the exposure of interest-bearing borrowings to interest rates. A 50 basis point increase or decrease has been used for a period of 45 days, being the average credit term from invoice date of trade receivables and the maximum potential rate gap period before which the interest received from a client can be repriced.
Consolidated Consolidated2016 2015
R’000 R’000
Sensitivity analysisIf the interest rates had been 50 basis points higher/lower and all other variables held constant, the Group’s profit (pre-tax) would increase/decrease by 239 191
27.3 Credit risk managementCredit risk is the risk that a counterparty will default on its contractual obligations resulting in financial loss to the Group. The Group mitigates this through transacting with a widespread geographical and sectoral customer base and through the ongoing credit evaluation of the financial condition of its customers, resulting in the fact that no single client contributes more than 5% of total Group revenues.
In the case of South African trade receivables where credit risk is deemed to be higher as a result of the legal obligation imposed by regulatory authorities for the Group to fund significant recoverable disbursements on behalf of clients, credit guarantee insurance cover is purchased for all debtors. This credit insurance cover is provided by Coface South Africa Services and Credit Insurance Solutions which covers 85% to 90% of the outstanding trade receivable balance in the event of default.
In the case of the trade receivables within the Group’s foreign subsidiaries, the materiality of potential financial losses as a result of default is not deemed to be as significant due to the fact that these operations are not required to fund recoverable disbursements on behalf of clients. Therefore, the Group does not take out credit insurance cover in its foreign operations, but provides adequate specific and portfolio impairment provisions to mitigate credit risk.
27. FINANCIAL RISK MANAGEMENT, OBJECTIVES AND POLICIES CONTINUED27.1Foreign currency risk management continued
Forward exchange contractsIt is the policy of the Group to enter into forward exchange contracts to cover the exposures related to all foreign currency assets and liabilities that will be settled in South African rands and that arise in the ordinary course of business.
The following table details the forward exchange contracts outstanding at reporting date:
Buy EUR1 Buy USD2 Buy other3
Contract value (Rand)2016 2 288 806 2 326 082 960 488
2015 1 362 702 4 390 693 1 099 690
Year end value (Rand)*2016 2 291 973 2 340 388 977 023
2015 1 339 155 4 425 830 1 090 724
1Euro 2United States Dollar 3Australian Dollar, British Pound, Canadian Dollar, Swedish Krona, Swiss Franc.
* The year end value represents the foreign currency exposure translated at the closing spot rate at year end
All the forward exchange contracts are short dated, maturing within two months of year end.

Santova Limited Annual Financial Statements 2016
FINANCIAL REPORT
55
27. FINANCIAL RISK MANAGEMENT, OBJECTIVES AND POLICIES CONTINUED27.3 Credit risk management continued
At 29 February 2016, the Group does not consider there to be any material credit risk that has not been insured or adequately provided for.
The carrying amount of the financial assets recorded in the financial statements, grossed up for any impairments, represents the Group’s maximum exposure to credit risk.
The Group grants varied credit terms of between 7 to 90 days to its customers. The analysis of trade receivables which are past due at reporting date is as follows:
Consolidated Consolidated Company Company2016 2015 2016 2015
R’000 R’000 R’000 R’000
Not past due 480 502 450 547 247 937 Past due but not impaired:– 0 to 30 days 82 460 31 525 – – – 31 to 60 days 10 066 3 295 – – – 61 to 90 days 5 370 550 – – – over 90 days 3 056 603 – – Impaired 27 682 20 678 – –
Trade receivables 609 136 507 198 247 937 Provision for impairment of receivables (refer note 7) (19 003) (12 036) – –
Net trade receivables 590 133 495 162 247 937
27.4 Liquidity risk managementThe ultimate responsibility for liquidity risk management rests with the Board of Directors. The Group manages liquidity risk by maintaining adequate reserves and banking facilities and by continuously monitoring cash flows and the maturity profiles of financial assets and financial liabilities.
There were no defaults of terms with lenders during the year.
The Group has continued to enjoy uninterrupted access to its facilities, which at the year end amounted to:
Facilities available (refer note 13)Bank overdraft 31 371 27 833 – – Medium-term loans 74 667 25 541 56 883 – Invoice discounting facilities 367 157 363 493 – –
Total facilities available 473 195 416 867 56 883 –
Facilities utilised at year end (refer note 13)Bank overdraft 765 – – – Medium-term loans 74 667 25 541 56 883 – Invoice discounting facilities 262 153 280 838 – –
Total facilities utilised 337 585 306 379 56 883 –
Available unutilised facilitiesBank overdraft 30 606 27 833 – – Medium-term loans – – – Invoice discounting facilities 105 004 82 655 – –
Total available unutilised facilities 135 610 110 488 – –
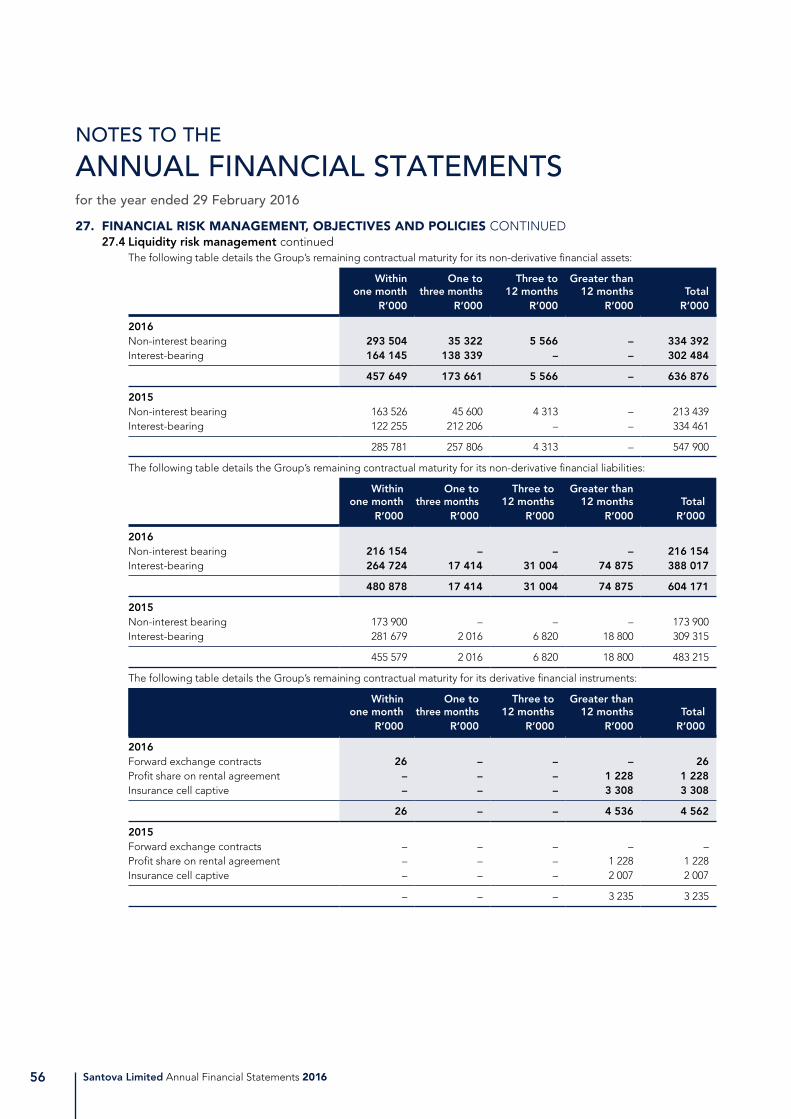
Santova Limited Annual Financial Statements 201656
NOTES TO THE
ANNUAL FINANCIAL STATEMENTSfor the year ended 29 February 2016
27. FINANCIAL RISK MANAGEMENT, OBJECTIVES AND POLICIES CONTINUED27.4 Liquidity risk management continued
The following table details the Group’s remaining contractual maturity for its non-derivative financial assets:
Within one month
One to three months
Three to 12 months
Greater than 12 months Total
R’000 R’000 R’000 R’000 R’000
2016Non-interest bearing 293 504 35 322 5 566 – 334 392 Interest-bearing 164 145 138 339 – – 302 484
457 649 173 661 5 566 – 636 876
2015Non-interest bearing 163 526 45 600 4 313 – 213 439 Interest-bearing 122 255 212 206 – – 334 461
285 781 257 806 4 313 – 547 900
The following table details the Group’s remaining contractual maturity for its non-derivative financial liabilities:
Within one month
One to three months
Three to 12 months
Greater than12 months Total
R’000 R’000 R’000 R’000 R’000
2016Non-interest bearing 216 154 – – – 216 154 Interest-bearing 264 724 17 414 31 004 74 875 388 017
480 878 17 414 31 004 74 875 604 171
2015Non-interest bearing 173 900 – – – 173 900 Interest-bearing 281 679 2 016 6 820 18 800 309 315
455 579 2 016 6 820 18 800 483 215
The following table details the Group’s remaining contractual maturity for its derivative financial instruments:
Within one month
One tothree months
Three to 12 months
Greater than12 months Total
R’000 R’000 R’000 R’000 R’000
2016Forward exchange contracts 26 – – – 26 Profit share on rental agreement – – – 1 228 1 228 Insurance cell captive – – – 3 308 3 308
26 – – 4 536 4 562
2015Forward exchange contracts – – – – – Profit share on rental agreement – – – 1 228 1 228 Insurance cell captive – – – 2 007 2 007
– – – 3 235 3 235

Santova Limited Annual Financial Statements 2016
FINANCIAL REPORT
57
27. FINANCIAL RISK MANAGEMENT, OBJECTIVES AND POLICIES CONTINUED27.5 Capital risk management
The Group manages the capital at its disposal so as to ensure that the Group will be able to continue as a going concern to maximise the return to shareholders.
The Group’s capital consists of shareholders funds, debt and cash and cash equivalents and the Group’s strategy is to maintain an optimal mix of this capital so as to minimise the cost of capital and to have sufficient capital available for allocation to the Group’s business operations.
There has been no change to the Group’s approach to capital management during the year.
The Group is subject to externally imposed capital requirements by its primary transactional bankers arising in the ordinary course of securing funding facilities. These capital requirements relate to minimum required levels of shareholders funds and free cash flow to net interest and capital serviced (on the medium-term loan) and there have been no breaches or default of these capital requirements during the year.
The Group monitors its capital on the basis of a gearing ratio which is calculated as total interest-bearing borrowings less cash and cash equivalents, divided by total capital and reserves. The Group’s gearing ratio at year end was:
Consolidated Consolidated2016 2015
R’000 R’000
Interest-bearing and short-term borrowings 338 581 307 726 Less: Cash and cash equivalents 123 657 44 889
Net debt 214 924 262 837
Total capital and reserves 386 415 230 289 Gearing ratio (%) 56 114
The levels of gearing within the Group is considered appropriate based on the financing activities it undertakes on behalf of it customers, from which it generates a market and risk related net interest margin. In addition the majority of debt originates from upfront payments received upon the discounting of a portion of its short-term receivables book, which book is secured by credit underwriting polices protecting the Group up to 85%/90% of the value of the receivables outstanding.
28. EVENTS AFTER THE REPORTING PERIOD There are no events that have taken place after the reporting period for which non-disclosure would affect the ability of the users to make proper evaluations and decisions.

Santova Limited Annual Financial Statements 2016
FINANCIAL REPORT
58
CORPORATE INFORMATION
SANTOVA LIMITEDCountry of incorporationRepublic of South Africa
Registration number1998/018118/06
Share codeSNV
ISINZAE000159711
Nature of businessInternational logistics solutions provider
DIRECTORSIndependent non-executive directorsESC Garner (Chairman)AD DixonWA LombardEM Ngubo
Executive directorsGH Gerber (Chief Executive Officer)DC Edley (Group Financial Director) AL van Zyl
COMPANY SECRETARYJA Lupton, FCISHighway Corporate Services (Pty) LtdPO Box 1319, Hillcrest, 3650
JSE SPONSORRiver GroupUnit 2, 211 Kloof Street, Waterkloof, Pretoria 0145
GROUP AUDITORDeloitte & ToucheDeloitte Place, 2 Pencarrow ParkLa Lucia Ridge Office Estate, La Lucia, 4051PO Box 243, Durban, 4000
SHARE REGISTRARComputershare Investor Services (Pty) LtdPO Box 61051, Marshalltown, 2107
LEGAL ADVISORLivingston Leandy IncPO Box 4107, Umhlanga Rocks, 4320
INVESTOR RELATIONSContact personsGH Gerber (Chief Executive Officer)DC Edley (Group Financial Director)
Email [email protected]
Contact number +27 31 374 7000
Santova head office and registered officePhysical addressSantova House, 88 Mahatma Gandhi Road, Durban, 4001
Postal addressPO Box 6148, Durban, 4000
Contact number +27 31 374 7000
CORPORATE BANKERSNedbank Limited