Embed Size (px)
Citation preview
Innovative LNAPL Recovery Techniques
Innovative LNAPL Recovery Techniques
RTDFNON-AQUEOUS PHASE LIQUID (NAPL)
CLEANUP ALLIANCESan Antonio, TexasFebruary 7-8, 2006
RTDFNON-AQUEOUS PHASE LIQUID (NAPL)
CLEANUP ALLIANCESan Antonio, TexasFebruary 7-8, 2006
Presented by:Patrick E. Haas
P. E. Haas & Associates, LLChttp://www.phaas.net
Presented by:Patrick E. Haas
P. E. Haas & Associates, LLChttp://www.phaas.net

Problem:LNAPL on Soil
Problem:LNAPL on Soil

Problem:LNAPL in Soil
Problem:LNAPL in Soil
andin a well
andin a well

LNAPL CharacteristicsLNAPL CharacteristicsLNAPLs
Gasoline; jet fuels; diesels contain 200+ individual componentsComposition varies with source
LNAPLs can contain DNAPLsDNAPLS can contain LNAPLsAlways characterize NAPL composition; viscosity; density
Composition over time
LNAPLsGasoline; jet fuels; diesels contain 200+ individual componentsComposition varies with source
LNAPLs can contain DNAPLsDNAPLS can contain LNAPLsAlways characterize NAPL composition; viscosity; density
Composition over time
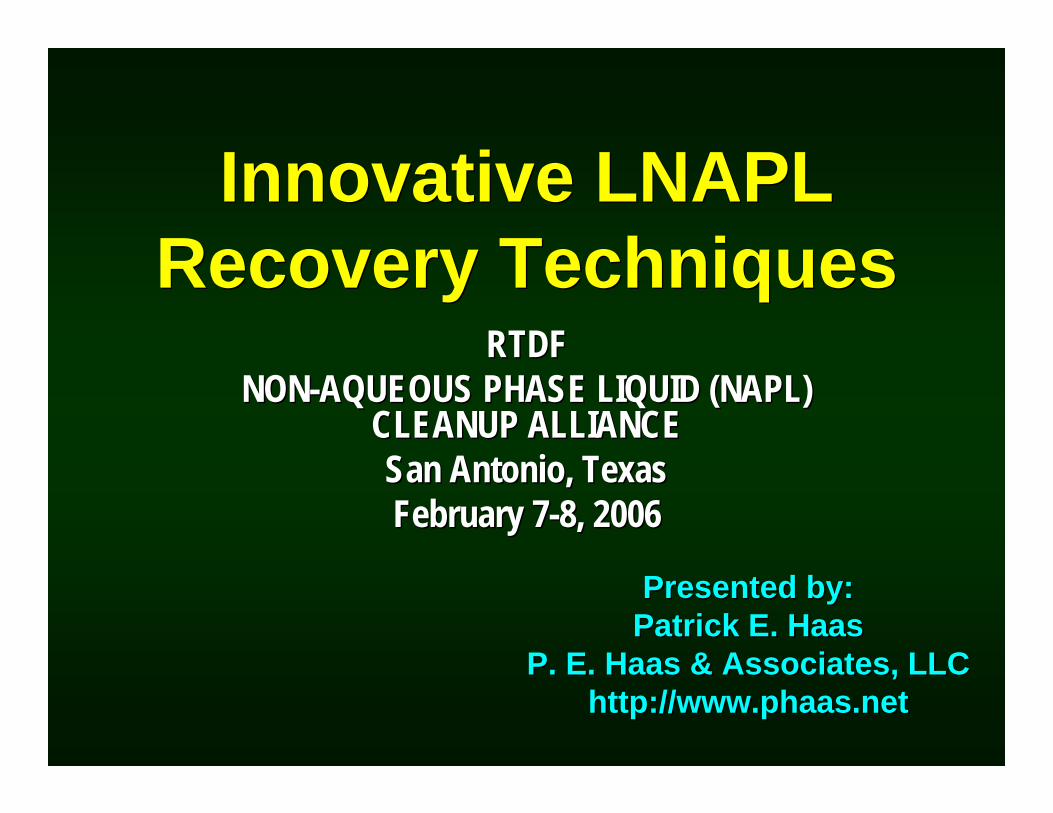
Vertical NAPL MigrationVertical NAPL MigrationZones of higher relative soil moisture or water saturation tend to inhibit downward migration of NAPL and cause spreading and poolingExamples:
Clay layers: Lower porosity and more perfectly wetted
Higher displacement pressures
Zones of higher relative soil moisture or water saturation tend to inhibit downward migration of NAPL and cause spreading and poolingExamples:
Clay layers: Lower porosity and more perfectly wetted
Higher displacement pressures
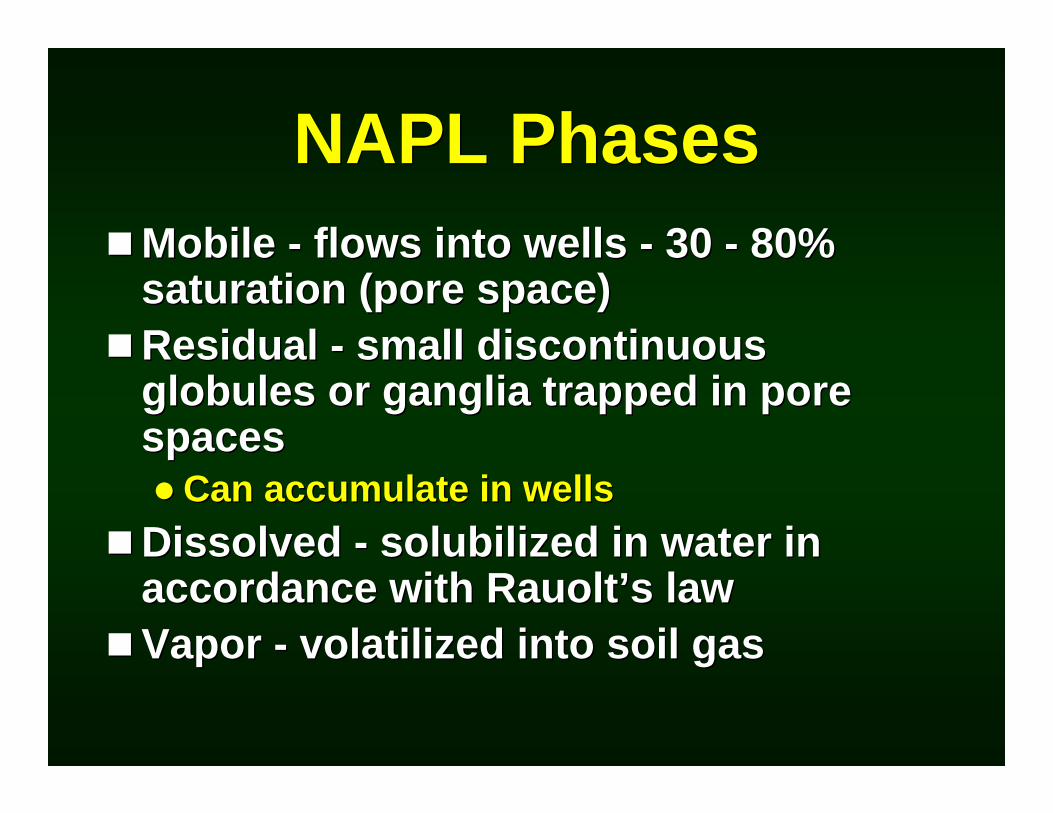
NAPL PhasesNAPL PhasesMobile - flows into wells - 30 - 80% saturation (pore space)Residual - small discontinuous globules or ganglia trapped in pore spaces
Can accumulate in wellsDissolved - solubilized in water in accordance with Rauolt’s lawVapor - volatilized into soil gas
Mobile - flows into wells - 30 - 80% saturation (pore space)Residual - small discontinuous globules or ganglia trapped in pore spaces
Can accumulate in wellsDissolved - solubilized in water in accordance with Rauolt’s lawVapor - volatilized into soil gas
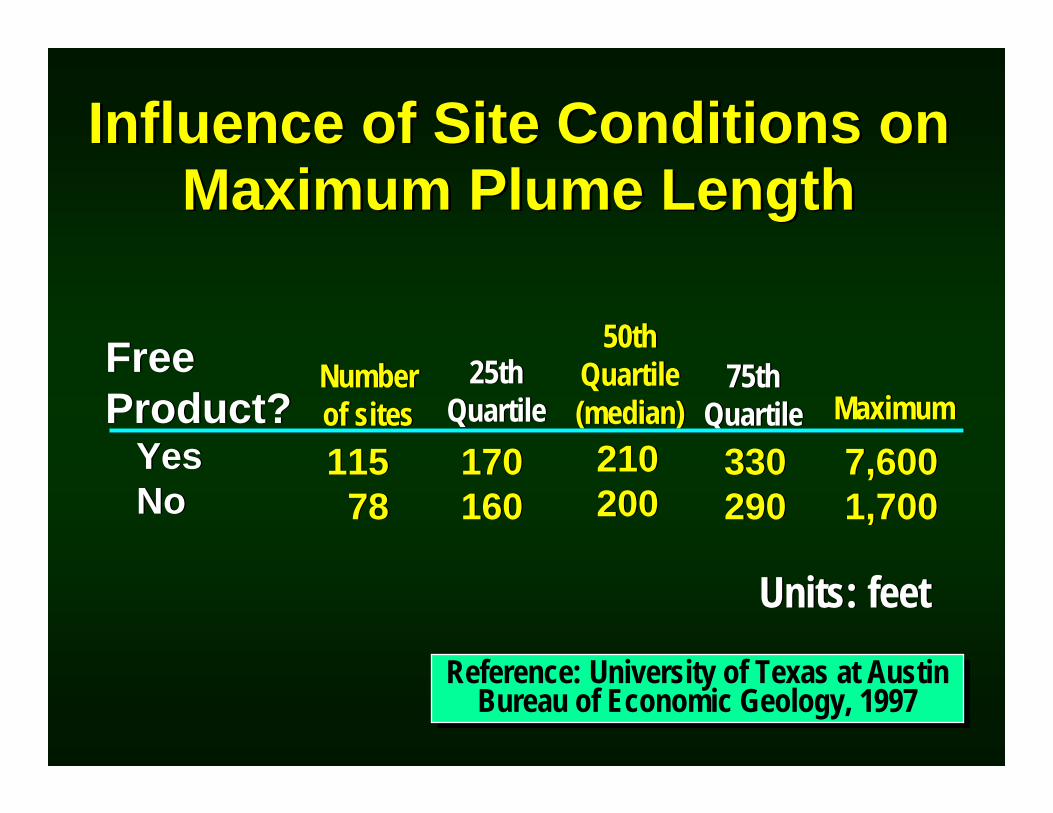
Influence of Site Conditions on Maximum Plume Length
Influence of Site Conditions on Maximum Plume Length
Free Product?
YesNo
Free Product?
YesNo
11578
11578
170160170160
210200210200
330290330290
7,6001,7007,6001,700
Numberof sitesNumberof sites
25thQuartile
25thQuartile
50thQuartile(median)
50thQuartile(median)
75thQuartile
75thQuartile MaximumMaximum
Reference: University of Texas at Austin Bureau of Economic Geology, 1997
Reference: University of Texas at Austin Bureau of Economic Geology, 1997
Units: feetUnits: feet

Smearing: Before Water Table Fluctuation
Smearing: Before Water Table Fluctuation
NAPLNAPL
SolidSolid
WaterWater
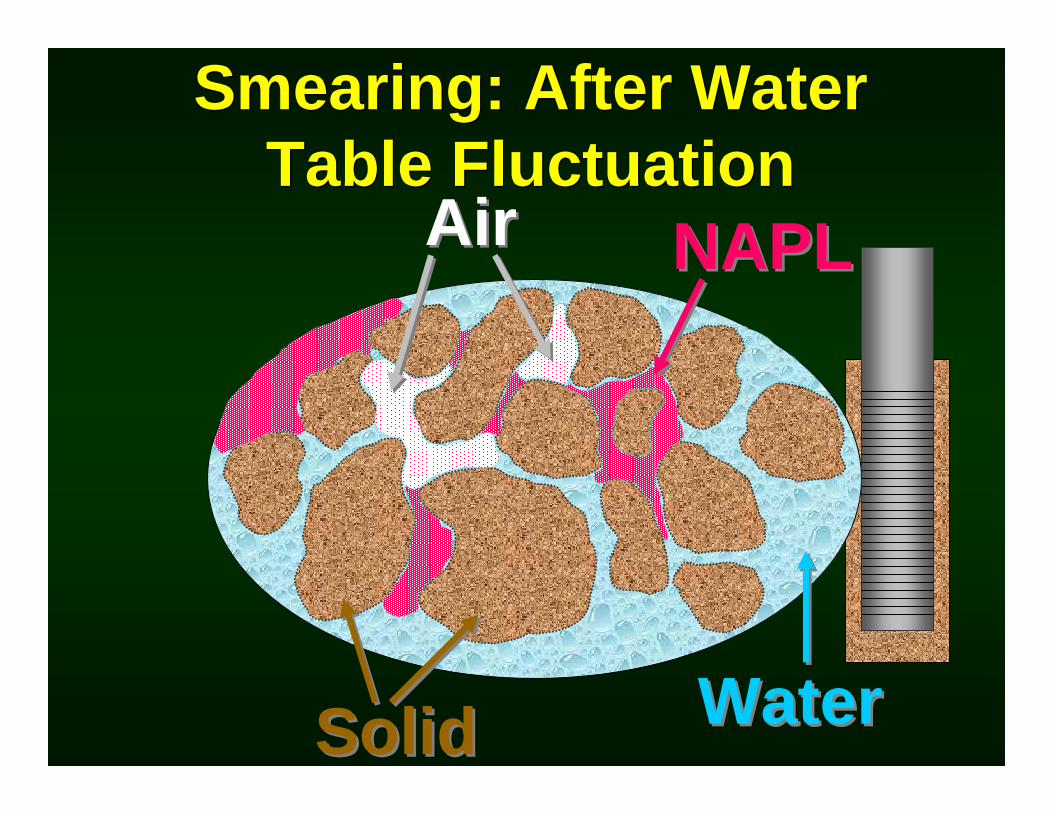
Smearing: After Water Table Fluctuation
Smearing: After Water Table Fluctuation
AirAir NAPLNAPL
SolidSolid WaterWater

OilOil
Water Treatment DischargeWater Treatment Discharge
Horizontal Flow LinesHorizontal Flow Lines
Vacuum-enhancedVacuum-enhancedConventionalConventional
Air/Liquid Separator-Vacuum
Pump
Air/Liquid Separator-Vacuum
Pump
GroundwaterDepression PumpGroundwaterDepression Pump
Oil SkimmerPumpOil SkimmerPump
GroundwaterGroundwater
Air Flow in Vadose ZoneAir Flow in Vadose Zone
No Air FlowNo Air Flow
Flow Due toPressure InducedGradient
Flow Due toPressure InducedGradient
Oil/WaterSeparator
Oil/WaterSeparator
Oil/Water SeparatorOil/Water Separator
Air Treatmentor DischargeAir Treatmentor Discharge
Flow Due to Pressure InducedGradient
Flow Due to Pressure InducedGradient
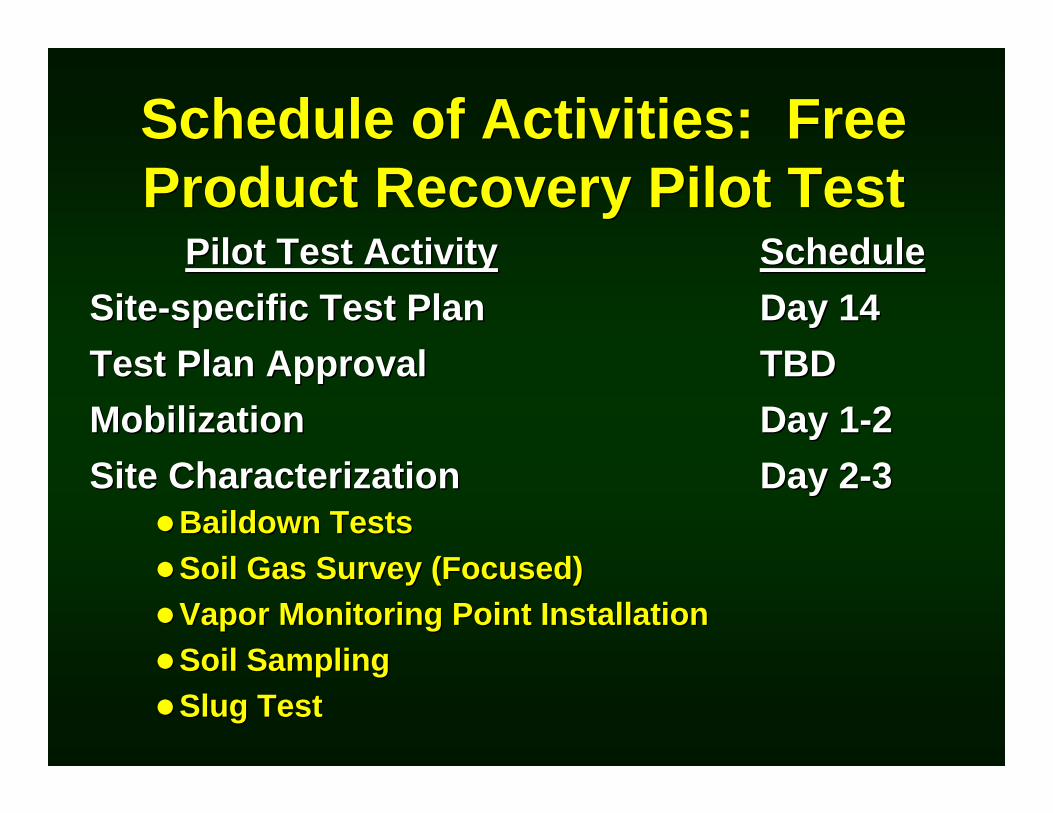
Schedule of Activities: Free Product Recovery Pilot TestSchedule of Activities: Free Product Recovery Pilot Test
Pilot Test Activity ScheduleSite-specific Test Plan Day 14Test Plan Approval TBDMobilization Day 1-2Site Characterization Day 2-3
Baildown TestsSoil Gas Survey (Focused)Vapor Monitoring Point InstallationSoil SamplingSlug Test
Pilot Test Activity ScheduleSite-specific Test Plan Day 14Test Plan Approval TBDMobilization Day 1-2Site Characterization Day 2-3
Baildown TestsSoil Gas Survey (Focused)Vapor Monitoring Point InstallationSoil SamplingSlug Test

Schedule of Activities: Free Product Recovery Pilot Test
(cont)
Schedule of Activities: Free Product Recovery Pilot Test
(cont)
Pilot Test Activity ScheduleSystem Installation Day 2-3Test Start-up Day 4
Skimmer Test (2 days) Day 4-5Bioslurper Test (4 days) Day 6-9Air Permeability Test Day 6Skimmer and/or SVE Test (1 day) Day 10Drawdown Test (2 days) Day 11-12In Situ Respiration Test Day 11In Situ Respiration Test Day 12-14
Demobilization Day 14-15

Baildown and Recovery Data
Baildown and Recovery DataBaildown Test Recovery Rates
SiteFuel Type
Original Product
Thickness (ft)
Final Product Thickness
(ft)Recovery
(%)Fuel
(gal/day)Water
(gal/day)TPH Vapor
(lb/day) *
Andrews AFB, MD
No. 2 Fuel Oil
2.32 2.01 87 78.5 1,820 6.5
Bolling AFB, D.C. (B. 18)
No. 2 Fuel Oil
4.44 3.52 79 59.85 2,751 0.009
Bolling AFB, D.C. (B.41)
Gasoline 0.34 0.32 94 1.55 0.81
1,286 1,052
470.1/---
Dover AFB, DE JP-4 3.73 3.77 101 43.2 2,844 ---/4.4
Edwards AFB, CA
JP-4 5.05 3.02 60 289.7 2,447
Havre AFS, MT (MW-7)
No.2 Fuel Oil
0.36 0.28 78 0.14 76 0.89
Havre AFS, MT (MW-F)
No.2 Fuel Oil
1.50 0.25 17 1.2 210 ---
Hickam AFB, HI Aviation Gasoline
3.98 3.95 99 90.9 2,313 132/ 0.030
Hill AFB, UT Fuel Oil 0.60 0.56 93 3.2 1,500 92

Fuel Recovery vs. TimeBuilding 18 – Well # HP-3Fuel Recovery vs. Time
Building 18 – Well # HP-3Fu
el R
ecov
ered
(gal
)
Time (hrs)

Fuel Recovery vs. TimeBuilding 41 – MW-3
Fuel Recovery vs. TimeBuilding 41 – MW-3
Fuel
Rec
over
ed (g
al)
Time (hrs)
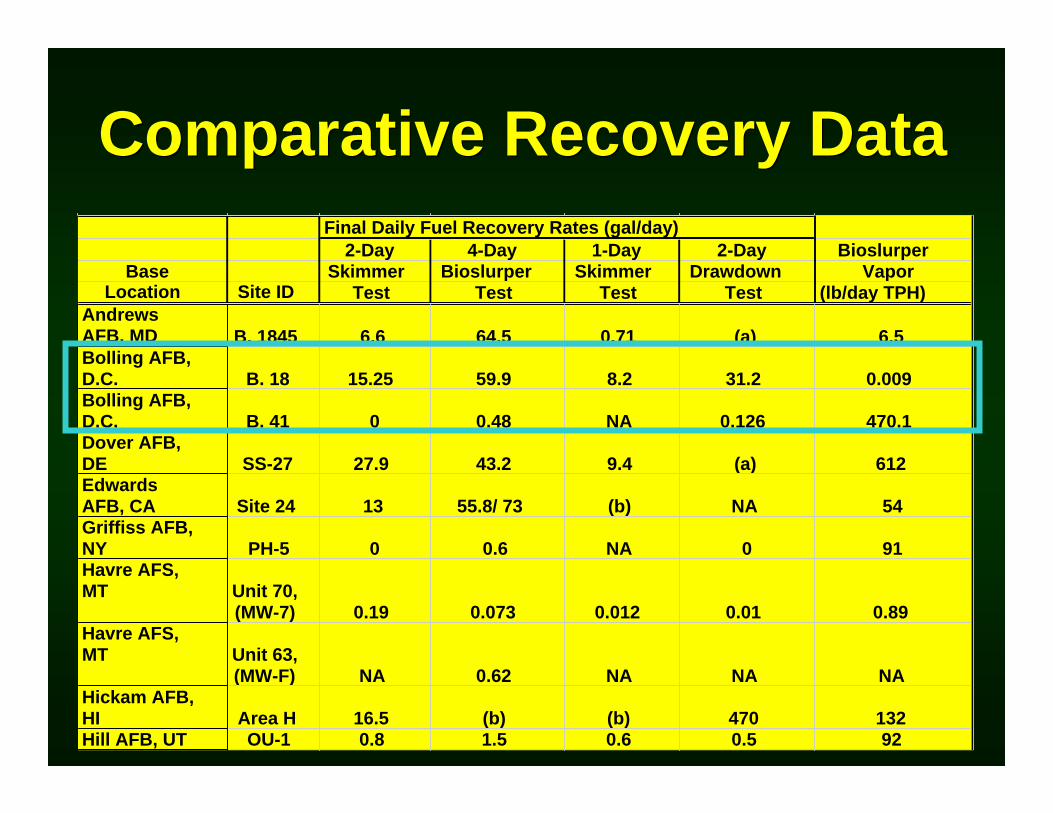
Comparative Recovery DataComparative Recovery DataFinal Daily Fuel Recovery Rates (gal/day)
2-Day 4-Day 1-Day 2-Day BioslurperBase Skimmer Bioslurper Skimmer Drawdown Vapor
Location Site ID Test Test Test Test (lb/day TPH)Andrews AFB, MD B. 1845 6.6 64.5 0.71 (a) 6.5Bolling AFB, D.C. B. 18 15.25 59.9 8.2 31.2 0.009Bolling AFB, D.C. B. 41 0 0.48 NA 0.126 470.1Dover AFB, DE SS-27 27.9 43.2 9.4 (a) 612Edwards AFB, CA Site 24 13 55.8/ 73 (b) NA 54Griffiss AFB, NY PH-5 0 0.6 NA 0 91Havre AFS, MT Unit 70,
(MW-7) 0.19 0.073 0.012 0.01 0.89Havre AFS, MT Unit 63,
(MW-F) NA 0.62 NA NA NAHickam AFB, HI Area H 16.5 (b) (b) 470 132Hill AFB, UT OU-1 0.8 1.5 0.6 0.5 92

Soil Vapor Extraction via Internal Combustion EngineSoil Vapor Extraction via Internal Combustion Engine

MonitoringWell
Convertedto aSVEWell
MonitoringWell
Convertedto aSVEWell
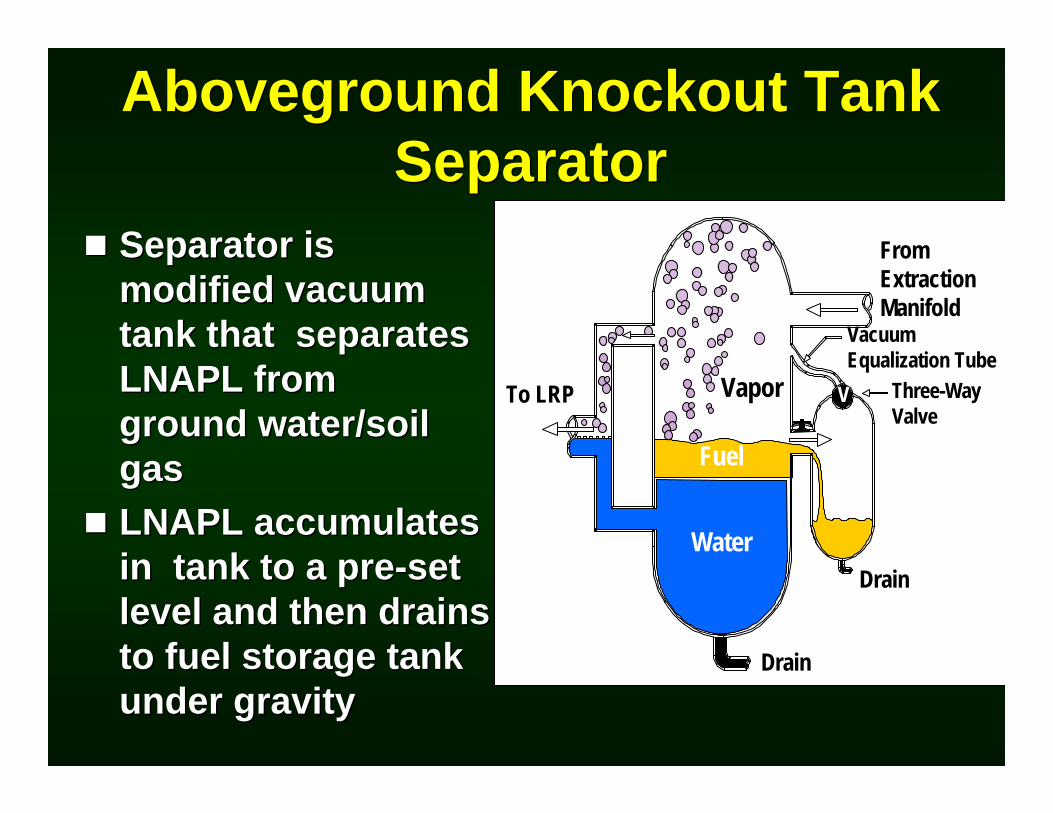
Aboveground Knockout Tank Separator
Aboveground Knockout Tank Separator
Separator is modified vacuum tank that separates LNAPL from ground water/soil gasLNAPL accumulates in tank to a pre-set level and then drains to fuel storage tank under gravity
Separator is modified vacuum tank that separates LNAPL from ground water/soil gasLNAPL accumulates in tank to a pre-set level and then drains to fuel storage tank under gravity
Water
Fuel
VaporTo LRP
FromExtractionManifold
VacuumEqualization Tube
Three-WayValve
Drain
Drain
V

Knockout Tank SeparatorKnockout Tank SeparatorLiquid ring
pumpLiquid ring
pump
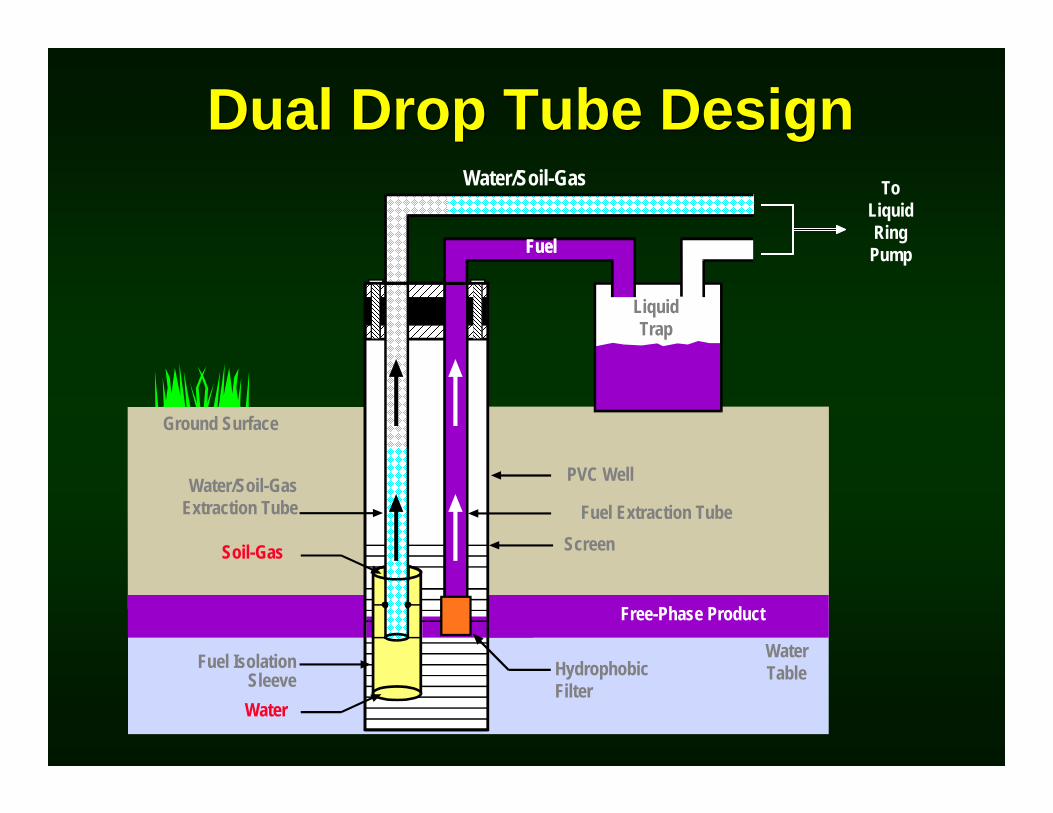
Dual Drop Tube Design Dual Drop Tube Design Water/Soil-Gas To
LiquidRingPumpFuel
LiquidTrap
Screen
Fuel
Fuel Extraction Tube
PVC Well
Ground Surface
Water/Soil-GasExtraction Tube
Soil-Gas
Water
Fuel IsolationSleeve Hydrophobic
Filter
Free-Phase Product
WaterTable

In-Well Separator: Dual Drop Tube
In-Well Separator: Dual Drop Tube
Shield prevents LNAPL from entering into drop tube while allowing groundwater to enter from below and soil vapor to enter from aboveLNAPL is extracted by a small-diameter tube located outside the shield
Shield prevents LNAPL from entering into drop tube while allowing groundwater to enter from below and soil vapor to enter from aboveLNAPL is extracted by a small-diameter tube located outside the shield

Dual Drop Tube Test: CSS Panama City
Dual Drop Tube Test: CSS Panama City
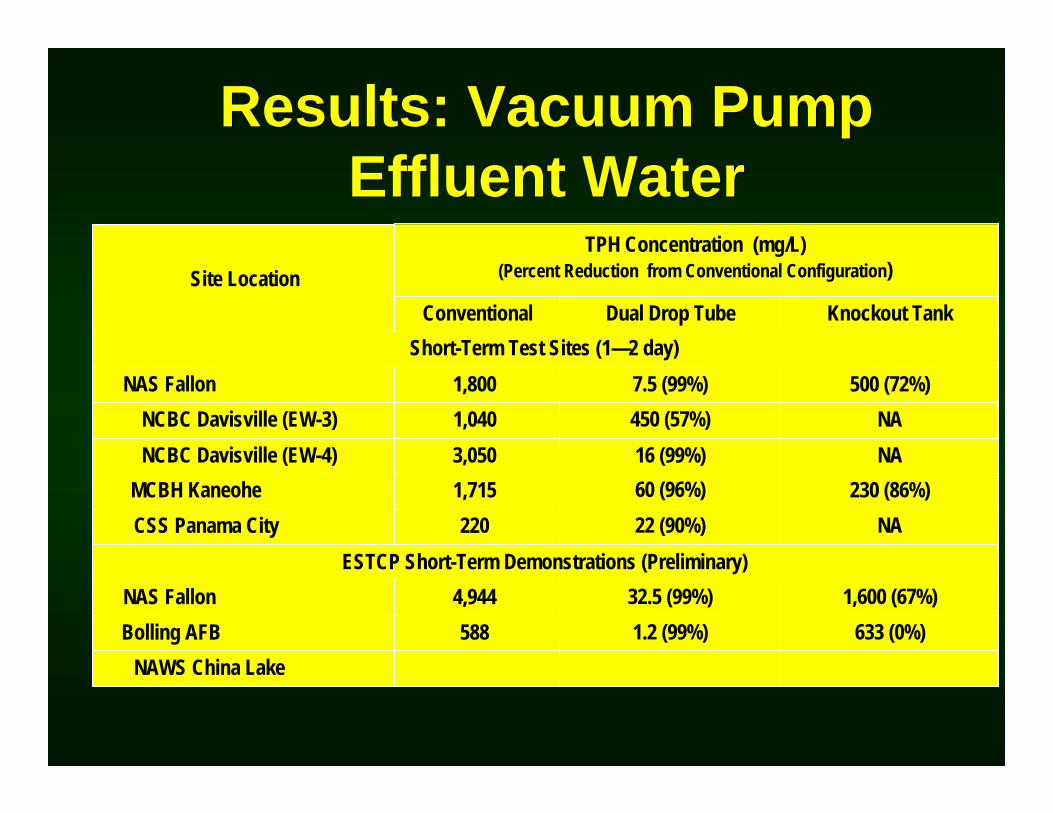
TPH Concentration (mg/L)(Percent Reduction from Conventional Configuration)Site Location
Conventional Dual Drop Tube Knockout TankShort-Term Test Sites (1—2 day)
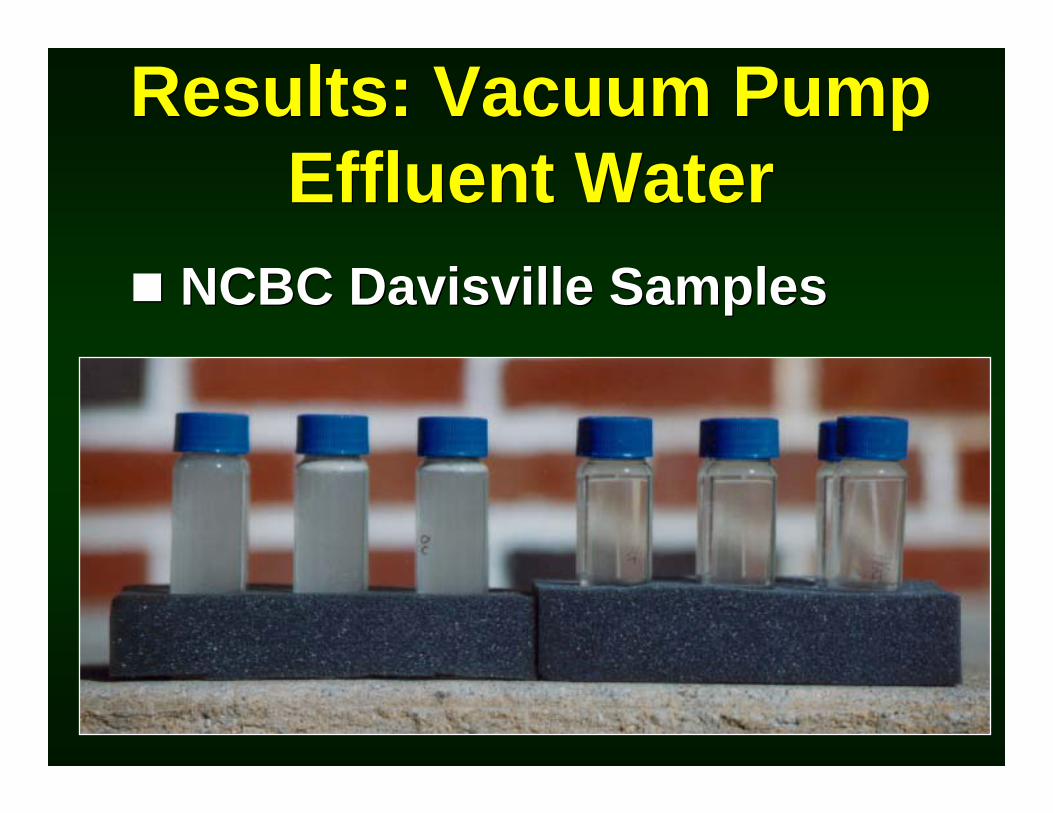
NAS Fallon 1,800 7.5 (99%) 500 (72%)NCBC Davisville (EW-3) 1,040 450 (57%) NANCBC Davisville (EW-4) 3,050 16 (99%) NA
MCBH Kaneohe 1,715 60 (96%) 230 (86%)CSS Panama City 220 22 (90%) NA
ESTCP Short-Term Demonstrations (Preliminary)NAS Fallon 4,944 32.5 (99%) 1,600 (67%)Bolling AFB 588 1.2 (99%) 633 (0%)
NAWS China Lake
Results: Vacuum Pump Effluent Water
Results: Vacuum Pump Effluent Water
Results: Vacuum Pump Effluent Water
Results: Vacuum Pump Effluent Water
NCBC Davisville SamplesNCBC Davisville Samples
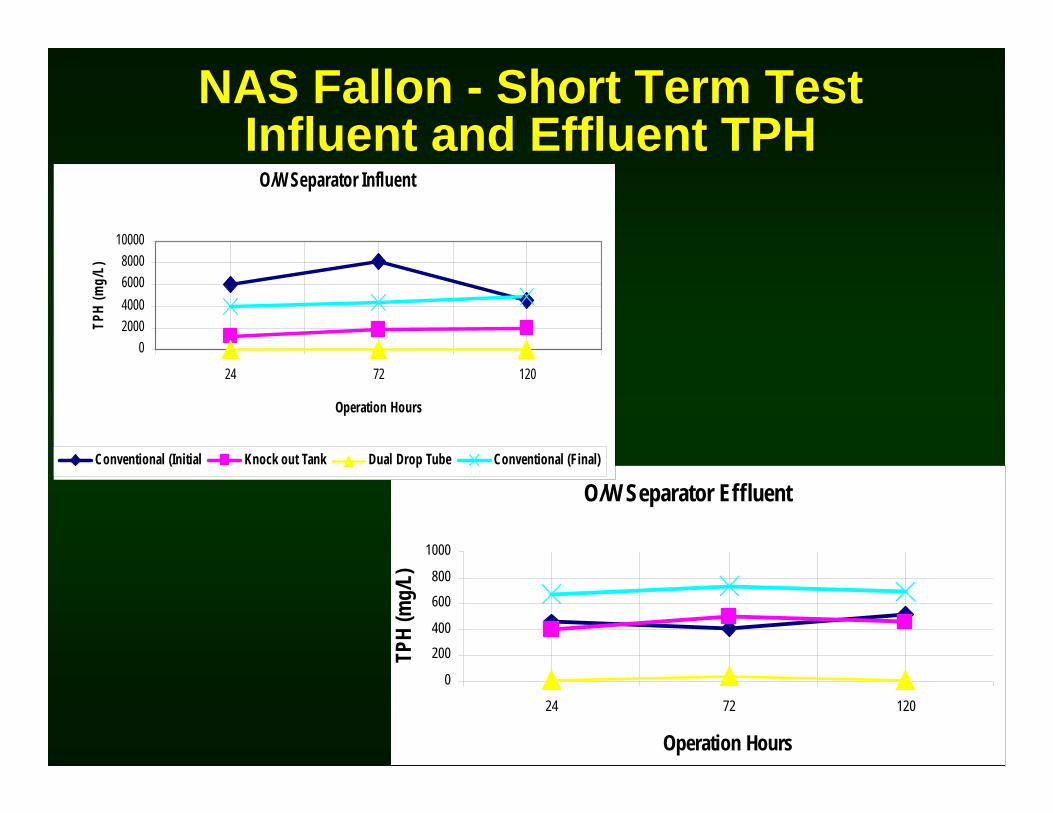
NAS Fallon - Short Term Test Influent and Effluent TPH
NAS Fallon - Short Term Test Influent and Effluent TPH
O/W Separator Effluent
0
200400
600800
1000
24 72 120
Operation Hours
TPH
(mg/
L)
O/W Separator Influent
02000400060008000
10000
24 72 120
Operation Hours
TPH
(mg/
L)
Conventional (Initial Knock out Tank Dual Drop Tube Conventional (Final)
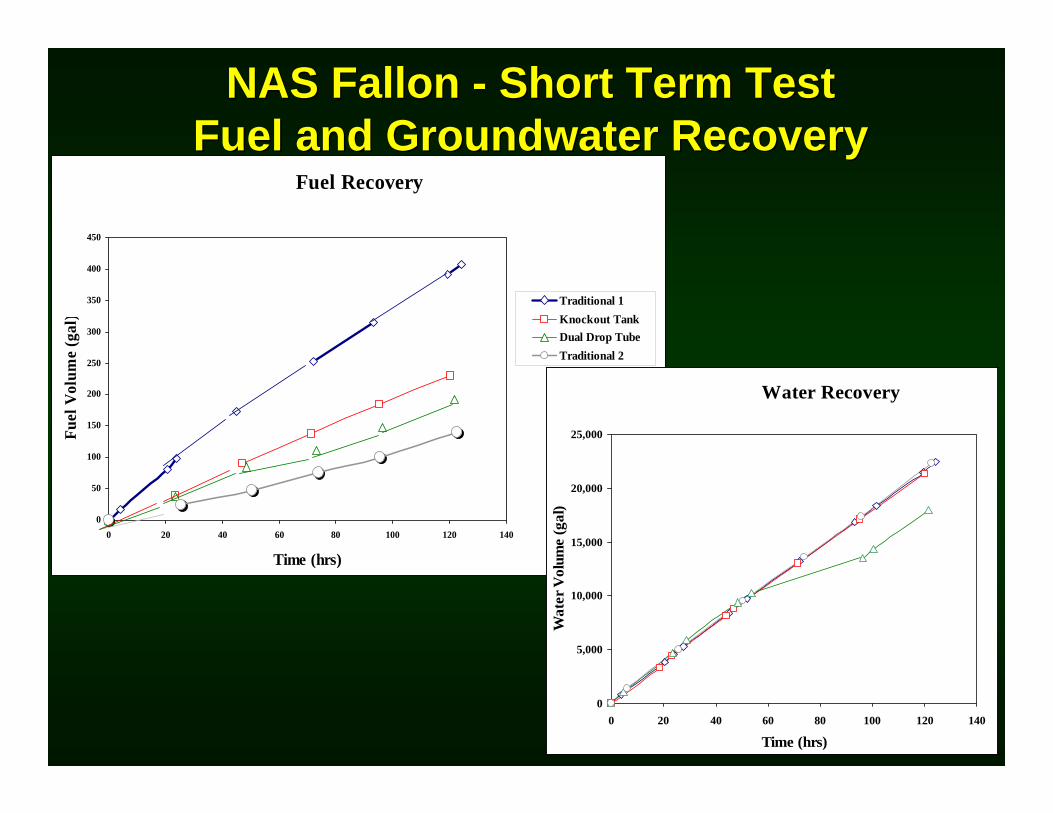
NAS Fallon - Short Term Test Fuel and Groundwater Recovery
NAS Fallon - Short Term Test Fuel and Groundwater Recovery
Fuel Recovery
0
50
100
150
200
250
300
350
400
450
0 20 40 60 80 100 120 140
Time (hrs)
Fuel
Vol
ume
(gal
)
Traditional 1Knockout TankDual Drop TubeTraditional 2
Water Recovery
0
5,000
10,000
15,000
20,000
25,000
0 20 40 60 80 100 120 140
Time (hrs)
Wat
er V
olum
e (g
al)
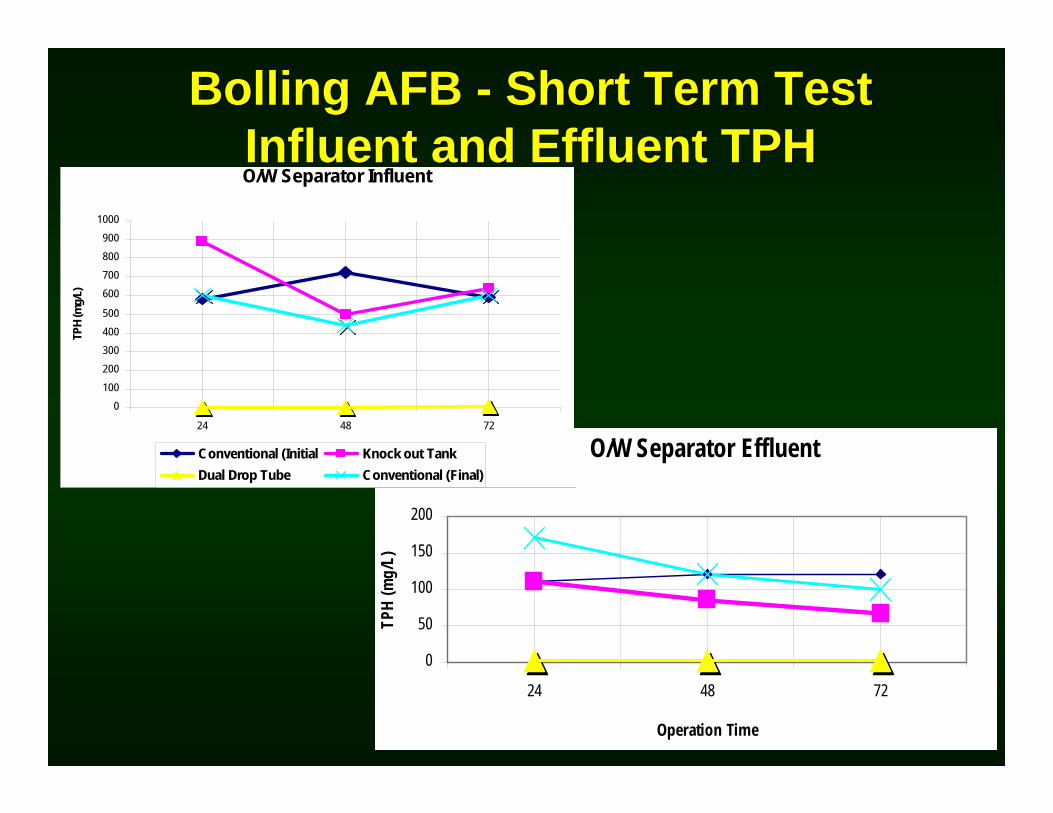
Bolling AFB - Short Term Test Influent and Effluent TPH
Bolling AFB - Short Term Test Influent and Effluent TPH
O/W Separator Effluent
0
50
100
150
200
24 48 72
Operation Time
TPH
(mg/
L)
O/W Separator Influent
0100200300400500
600700800900
1000
24 48 72
Operation Hours
TPH
(mg/
L)
Conventional (Initial Knock out TankDual Drop Tube Conventional (Final)

Bolling AFB - Short Term Test Fuel and Groundwater Recovery Bolling AFB - Short Term Test
Fuel and Groundwater Recovery Fuel Recovery
0
2
4
6
8
10
12
0 10 20 30 40 50 60 70 80
Time (hrs)
Fuel
Vol
ume
(gal
)
Traditional 1Knockout Tank Dual Drop TubeTraditional 2
Water Recovery
0
1000
2000
3000
4000
5000
6000
0 10 20 30 40 50 60 70 80
Time (hrs)
Wat
er V
olum
e (g
al)

NAWS China Lake - Short Term Test Fuel and Groundwater Recovery
NAWS China Lake - Short Term Test Fuel and Groundwater Recovery
Fuel Recovery
0
20
40
60
80
100
120
140
160
0 10 20 30 40 50 60 70 80Time (hrs)
Fuel
Vol
ume
(gal
)
Traditional 1Knockout TankDual Drop Tube 1Dual Drop Tube 2
Water Recovery
0
2000
4000
6000
8000
10000
12000
14000
0 10 20 30 40 50 60 70 80
Time (hrs)
Wat
er V
olum
e (g
al)

Results: Off-GasResults: Off-Gas
Source: Hoeppel et. al.
TPH Concentration in the Off-Gas (ppmv),(Percent Reduction from Conventional Configuration)Site Location Conventional Dual Drop Tube Knockout Tank
NAS Fallon 3,210 900 (72%) 1,950 (39%)NCBC Davisville (EW-3) 675 620 (8%) NA
NCBC Davisville (EW-4) 870 145 (83%) NAESTCP Short-Term Demonstrations (Preliminary)
NAS Fallon 2,940 2,350 (20%) 3,960 (0%)Bolling AFB 160 100 (37%) 150 (6%)NAWS China Lake

72-hour Baildown Recovery Test Data
72-hour Baildown Recovery Test Data
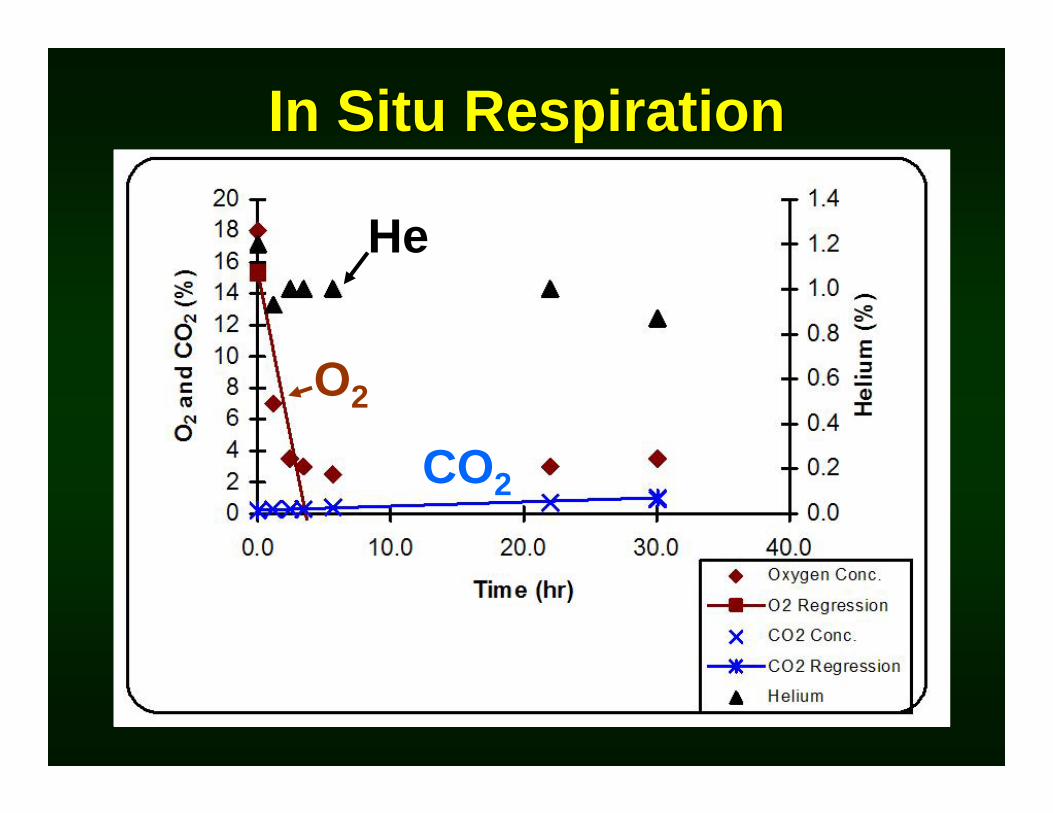
In Situ RespirationIn Situ Respiration
He
O2
CO2

Date: 1/23/95 Site Name: Travis Air Force Base
Monitoring Point: MPC Depth of MP (ft): 5.5Date/Time (mm/dd/yr
hr:min)
Time (hr)
Oxygen (%)
Carbon Dioxide
(%)
Helium (%)
1/23/95 11:05 0.0 18.00 0.20 1.201/23/95 12:15 1.2 7.00 0.30 0.931/23/95 13:30 2.4 3.50 0.30 1.001/23/95 14:30 3.4 3.00 0.30 1.001/23/95 16:45 5.7 2.50 0.40 1.001/24/95 9:05 22.0 3.00 0.70 1.00
1/24/95 17:10 30.1 3.50 0.90 0.87
Regression Lines O2 CO2
Slope -4.2642 0.0264ko 0.071 %/min Intercept 15.3373 0.2288
4.264 %/hr Determination Coef. 0.8240 0.616482.895 102.340 %/day No. of Data Points 4 4
In Situ Respiration Test: Data Analysis
O2 Utilization Rate
02468
101214161820
0.0 10.0 20.0 30.0 40.0
Time (hr)O
2 and
CO
2 (%
)
0.0
0.2
0.4
0.6
0.8
1.0
1.2
1.4
Hel
ium
(%)
Oxygen Conc.
O2 Regression
CO2 Conc.
CO2 Regression
Helium
BiodegradationRate
(mg/kg-day)
In Situ RespirationIn Situ Respiration

Bioventing PotentialBioventing PotentialFuel Storage Area G
Average biodegradation rate = 67.6 mg/kg-dayAssume:
Area of contamination = 750 m2
Contaminated soil is 2m thick1m3 of soil weighs 1440kg
67.6mg/kg-day x 1440kg/m3 x 750m2 x 2m = 146kg/day
Approximately 146 kg of hydrocarbons are biodegraded per
day
Fuel Storage Area GAverage biodegradation rate = 67.6 mg/kg-dayAssume:
Area of contamination = 750 m2
Contaminated soil is 2m thick1m3 of soil weighs 1440kg
67.6mg/kg-day x 1440kg/m3 x 750m2 x 2m = 146kg/day
Approximately 146 kg of hydrocarbons are biodegraded per
day
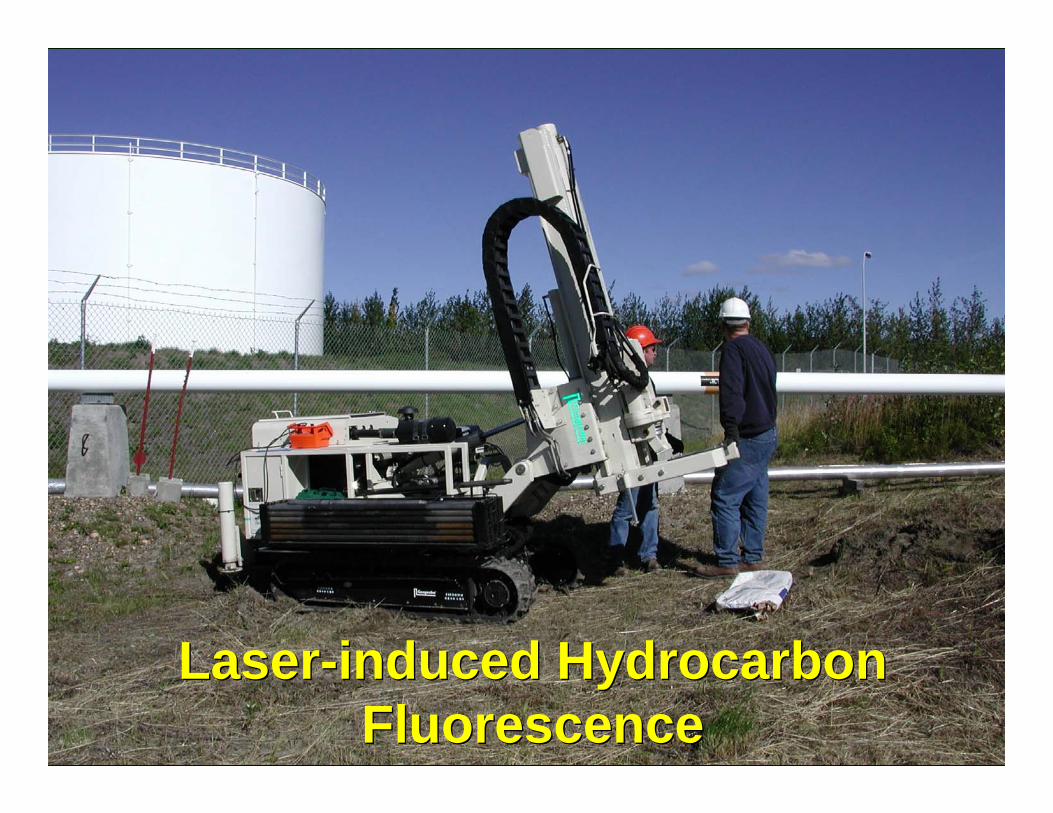
Laser-induced Hydrocarbon Fluorescence
Laser-induced Hydrocarbon Fluorescence

Fuel hydrocarbons at 26-31 ft bgs
Water table fluctuates
from 6-26 ft bgs
Historic low at 32 ft bgs
Fuel hydrocarbons at 26-31 ft bgs
Water table fluctuates
from 6-26 ft bgs
Historic low at 32 ft bgs
Laser-induced
fluorescence log
26 ft bgs
31 ft bgs

Smear Zone TreatmentSmear Zone Treatment
UST
GW Low-Low
GW Current
GW High-High
Product Recovery Well
Bioventing Well at GW
Current
Bioventing Well at GW Low-Low
Injected Air Flow
Lines
Injected Air Flow
Lines
LNAPL
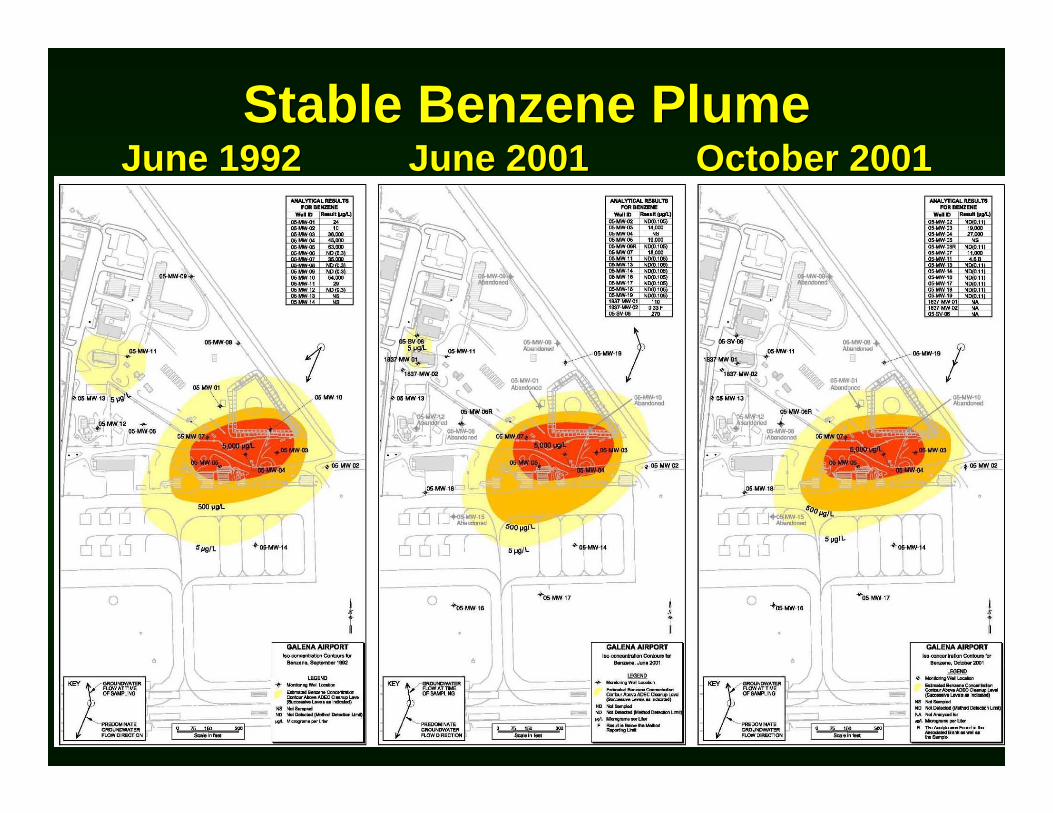
Stable Benzene PlumeJune 1992 June 2001 October 2001
Stable Benzene PlumeJune 1992 June 2001 October 2001
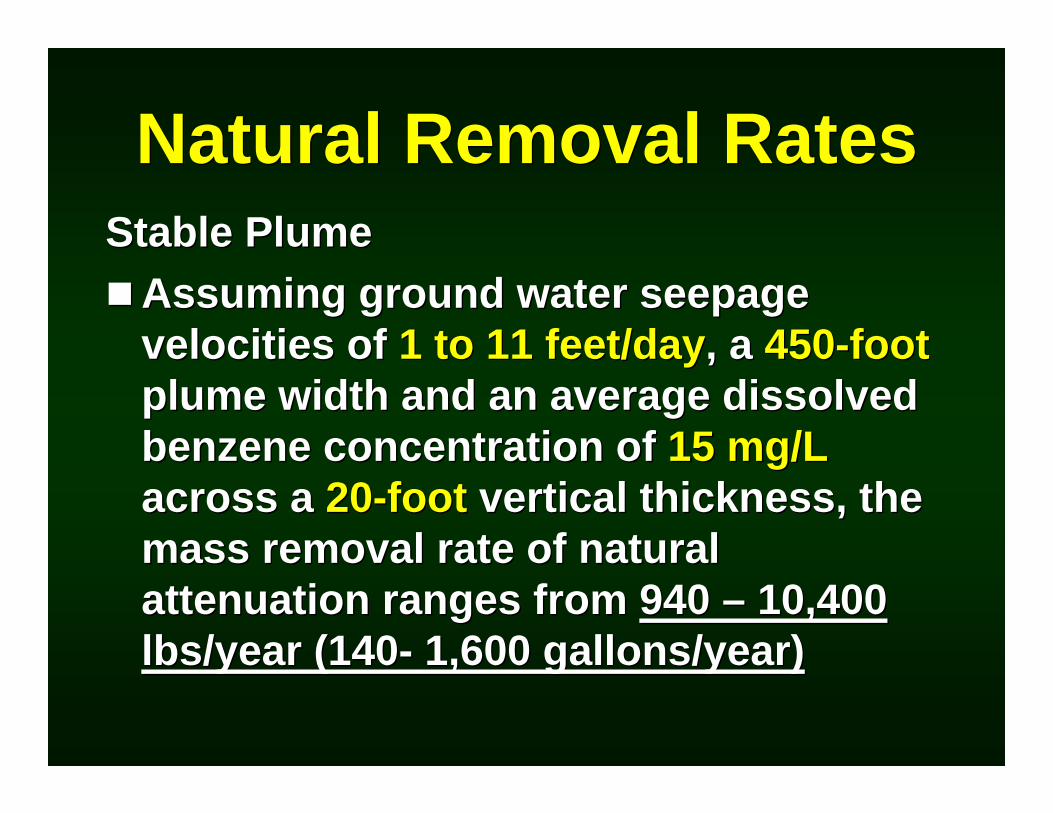
Natural Removal RatesNatural Removal RatesStable Plume
Assuming ground water seepage velocities of 1 to 11 feet/day, a 450-footplume width and an average dissolved benzene concentration of 15 mg/Lacross a 20-foot vertical thickness, the mass removal rate of natural attenuation ranges from 940 – 10,400 lbs/year (140- 1,600 gallons/year)
Stable PlumeAssuming ground water seepage velocities of 1 to 11 feet/day, a 450-footplume width and an average dissolved benzene concentration of 15 mg/Lacross a 20-foot vertical thickness, the mass removal rate of natural attenuation ranges from 940 – 10,400 lbs/year (140- 1,600 gallons/year)

StrategyStrategySite characterization
Where is LNAPL in soil/aquifer matrix?Is LNAPL mobile?
Consecutive baildown recovery to assess mobilityShort-term low tech removal
Recovery PotentialBaildown, baildown, baildown?
What’s the risk?Composition – Kerosene or Benzene?NAPL and dissolved plume mobility –Stable, decreasing?
Site characterizationWhere is LNAPL in soil/aquifer matrix?Is LNAPL mobile?
Consecutive baildown recovery to assess mobilityShort-term low tech removal
Recovery PotentialBaildown, baildown, baildown?
What’s the risk?Composition – Kerosene or Benzene?NAPL and dissolved plume mobility –Stable, decreasing?

Strategy (cont)Strategy (cont)Remediation
During low ground water levelsIf mobile, consider liquid phase recover
Vacuum-enhanced?If volatile, consider SVEAlways consider biodegradation – Natural and bioventing
ClosureRisk-basedDevelop criteria for free product recovery to the maximum extent practical
RemediationDuring low ground water levelsIf mobile, consider liquid phase recover
Vacuum-enhanced?If volatile, consider SVEAlways consider biodegradation – Natural and bioventing
ClosureRisk-basedDevelop criteria for free product recovery to the maximum extent practical
Questions?