Embed Size (px)
Citation preview

Innovative instruments for ADF 14
Discussion Paper
ADF-14 First Replenishment Meeting 17-18 March, 2016
Abidjan, Côte d’Ivoire
AFRICAN DEVELOPMENT FUND

Table of Contents
Executive Summary 4
Abbreviations 5
1. Introduction 6
2. Concessional Donor Loans 6
3. Bridge Loans 11
4. The Buy-Down Mechanism 13
5. Possible combinations 16
6. Leveraging Concessional Donor Loans for Private Sector Development 18
7. Management’s Proposal to Deputies under ADF-14 20
Annex 1: AfDB Group’s Country Classification and Corresponding Resources Available 21
Annex 2: Information from IDA on their experience with CDLs and its applicability to the ADF 22
Annex 3: The ACC model 25
Annex 4: Potential demand for CDLs 28
Annex 5: Impact of CDLs on the ACC 30
Annex 6: Calculation of the grant element for the CDLs and what differ from IDA and OECD-DAC 31
Annex 7: CDLs – Strengths and weaknesses analysis 33
Annex 8: Prioritization rules for CDLs and BLs 36
Annex 9: How a Bridge Loan will impact on the ACC? 38
Annex 10: Calculation of the grant element for a Bridge Loan 39
Annex 11: Bridge Loan – Strengths and weaknesses analysis 40
Annex 12: Buy-Down Mechanism (BDM) - Strengths and weaknesses analysis 42
Annex 13: Buy-Down Mechanism - Estimated Freed up Funding for the Remaining ADF countries 44
Annex 14: How does the BDM impact on the ACC 45
Annex 15: How does the BDM impact on the AfDB risk exposure? 46
Annex 16: Amounts due during ADF-14 for grant compensation approved during ADF-9, ADF-10 & ADF-11 47
Annex 17: How to implement the BDM 48
Annex 18: Potential combinations 50
Annex 19: Summary of the three options 53
Annex 20: Comparative impact of CDL and BL 54
Figures and tables
Figure 1: ADF resources for CDLs borrowed at interest rates between 0.5% and 1%.............................. ..8
Figure 2: ADF resources for CDLs borrowed at interest rates between 0% and 0.5%.............................. 9
Figure 3: Distribution of ADF resources in the option of a BL of UA 1 billion………………………………. 12
Figure 4 Distribution of ADF resources in the case of a BDM………………………………………………...14

Figure 5: Possible combinations of the CDLs, BLs and BDM………………………………………………... 16
Figure 6: The ACC Mechanism…………………………………………………………………………………. 25
Figure 7: Historical evolution of the ACC……………………………………………………………………….. 26
Figure 8: Projection of the Total Resource Envelope with a UA1billion BL………………………………… 38
Figure 9: SDR Yield Curve……………………………………………………………………………………….. 39
Figure 10: Implementation of a BDM including compensation provided through an ADF set aside……... 48
Figure 11: Implementation of a BDM including compensation provided by a facility……………………… 49
Table 1: IDA’s CDLs Model and its applicability to ADF……………………………………………………… 22
Table 2: Concessional Loan Contributions to IDA 17…………………………………………………………. 24
Table 3: Projected Allocations to Countries by Credit Category for ADF-13, 14 and 15 cycles………….. 28
Table 4 : Impact of CDLs on ACC………………………………………………………………………………. 30
Table 5: Grant element under various scenarios of concessional rates on CDL…………………………... 32
Table 6: Illustration of First stage Prioritization Based on ADF-14 Core Burden Shares…………………. 36
Table 7: Illustration of Second stage Prioritization Based on Additionality…………………………………. 37
Table 8: Impact of a Bridge Loan on the ACC…………………………………………………………………. 38
Table 9: Grant element for BLs………………………………………………………………………………….. 39
Table 10: Buy-Down mechanism - Resources available for remaining ADF countries…………………… 44
Table 11: BDM – level of compensation………………………………………………………………………... 44
Table 12: Estimated impact on the ACC during ADF-14……………………………………………………… 47
Table 13: Impact of the Buy-down Mechanism on main prudential ratios…………………………………. 48
Table 14: Comparative impact between CDL and BL………………………………………………………… 56

4
Executive Summary
At the ADF-13 replenishment, Deputies set up a Working Group on innovative financial approaches for ADF-14. The Working Group met four times and its conclusions were discussed during the ADF-13 Mid-Term Review in September 2015. At the Mid Term Review, Deputies requested Management to conduct further analysis on the three innovative instruments that had been presented.
Concessional Donor Loans (CDLs): ADF borrows from donor countries on concessional terms to improve its commitment capacity in beneficiary countries.
Bridge Loan (BL): A BL is a concessional donor loan provided to improve the Fund’s general liquidity and to bring forward future internally generated revenue. A BL does not increase the ADF envelope over the lifetime of the ADF. The additional ACC during ADF-14 will benefit all ADF eligible countries, including those in fragile situations.
Buy-Down Mechanism (BDM): Eligible RMCs borrow from the AfDB the equivalent of their Performance Based Allocation (PBA). Extra grant resources are then made available by ADF as compensation for the differential between ADF and AfDB lending terms. The Buy-Down unlocks resources for the remaining ADF countries. The BDM would be applied to graduating countries, blend countries and ADF green light countries. Countries facing fragile situations are excluded.
It is estimated that ADF-14 can leverage between UA 458 million to UA 1.27 billion as CDLs. In this case, the resource envelope would increase by between UA 0.63 billion to UA 1.62 billion provided CDLs do not substitute the grants.
If ADF-14 secures a UA 1 billion BL at an interest rate of up to 1%, the ADF-14 envelope would increase by UA 0.83 billion. The net amount of additional resources under the BDM is estimated at around UA 0.63 billion during ADF-14.
The three financial innovations can be combined. However, highest financial impact can be obtained by combining a CDL with a BL which would increase the ADF-14 envelope by UA 2.2 billion.
The paper provides the main conclusions of this analysis on the three innovative options discussed by the ADF WG and formulates some recommendations to the Deputies.

5
Abbreviations
ACC Advanced Commitment Capacity ADF African Development Fund AfDB African Development Bank ALM Asset Liability Management As DB Asian Development Bank BDM Buy-Down Mechanism BL Bridge Loan CDL Concessional Donor Loan DSA Debt Sustainability Analysis DSF Debt Sustainability Framework IDA International Development Association MDB Multilateral Development Bank PBA Performance Based Allocation RAC Risk-adjusted Capital RCUR Risk Capital Utilization Rate RMC Regional Member Countries SDR Special Drawing Right TSF Transition States Facility UA Unit of Account WG Working Group

6
INNOVATIVE FINANCING INSTRUMENTS FOR ADF-14
1. Introduction
1.1 At the end of the ADF-13 replenishment, Deputies agreed to set up an ADF-14 Working Group on innovative approaches. Following four meetings which took place in 2014 and 2015 the conclusions of the working group were discussed during the ADF-13 Mid-Term Review. Three innovative options were put forward:
Concessional Donor Loans (CDLs): ADF borrows from donor countries on concessional terms to improve its commitment capacity in beneficiary countries.
Bridge Loans (BLs): Donors provide a concessional loan to the ADF to improve the Fund’s general liquidity and increase the Advanced Commitment Capacity (ACC) for ADF-14 by frontloading future internally generated resources of subsequent replenishments.
Buy-Down Mechanism (BDM): the BDM leverages the AfDB balance sheet by enabling eligible countries to get the equivalent of the Performance Based Allocations through the AfDB window.
1.2 Deputies asked Management to provide further analysis on the three innovative instruments for the first meeting of ADF-14 replenishment. They requested that such analysis includes the feasibility of the options, the pros and cons and fiduciary risks. They also asked that combinations of the options be further envisaged.
1.3 For the sake of comparison the simulations that informed this paper used ADF-13 donor contributions, i.e. UA 3.863 billion. In addition, based on the update of the Fund’s cash flows, the revised amount for the base scenario of the advanced commitment capacity (ACC) is projected to be UA 460 million, which is 53% less than what it was for ADF-13 (UA 976 million). The decline in the ACC is mainly due to: (i) continued lower interest rates, (ii) increased administrative expense budget and (iii) the shortfall in inflows from the Multilateral Debt Relief Initiative (MDRI). Annex 3 provides additional information on the ACC and its expected evolution while more details on the ACC are in the ADF-14 Financing Framework paper.
1.4 The paper is organized in 6 sections. Following the introduction, Sections 2, 3 and 4 summarize the key principles of the three innovative instruments, their financial impact and risk analyses. Each section presents the preferred operational modalities in ADF-14. Section 5 outlines possible combinations of the three instruments. Section 6 discusses the possibility of using CDLs, over and above the required resources for sovereign operations and for the bridge loan, to support private sector development in ADF countries. Section 7 provides Management’s recommendations.
2. Concessional Donor Loans
Main principles
2.1 Concessional donor loans (CDLs) are loans offered by a development partner to the ADF at interest rates significantly lower than market rates, to supplement available grant resources in the framework of any specific replenishment cycle. These loans would create additional resources for the ADF’s global pool of resources. Donors providing concessional loans are then compensated on the basis of the grant element embedded in their loans to the Fund.
2.2 The general principles governing CDLs are:
Protection of the ADF grant-component (no substitution effect);
Preservation of ADF’s long-term financial viability;

7
Recognition of donors providing CDLs; and
No earmarking of the proceeds of the CDLs.
2.3 Following the recommendation of the ADF Working Group, the paper was able to draw from the experience of IDA’s implementation of CDLs which have been successfully incorporated into the IDA-17 financing framework. Lessons on the implementation by IDA is that the CDLs are operating as designed, and all payments are being made as per the agreements. Indeed, CDLs contributed to the overall success of the replenishment, enabling IDA to provide greater support to recipient countries than would otherwise have not been possible. With some adjustments, ADF-14 could borrow from the IDA-17 CDL model while incorporating specific features. Annex 2 provides an overview of IDA’s model in comparison to what is being proposed for ADF-14.
Potential financial impact
2.4 From a risk management perspective, CDLs must be self-financed. This means that (i) the volume of debt incorporated into the ADF financial framework must be fully repaid through reflows from the additional lending made possible by that debt, and (ii) that the ADF has a sufficient level of liquidity to meet its financial obligations.
2.5 Taking this assumption into account, scenarios have been developed to reflect the range of financial resources ADF could expect from CDLs, in addition to donor grant contributions. Since the expected reflows will come from interest repaid by borrowing countries, the scenarios depend on whether to limit the size of CDLs the ADF could accommodate to either:
ADF allocations for gap, blend and graduating countries1 (i.e. ADF countries that are charged an interest rate of 1% and a service charge of 0.75%), or
In addition to the above countries, allocation for ADF green light countries which are charged only a service charge of 0.75%.
2.6 Hence, the CDLs’ interest rates are the key factor to determine the maximum volume of CDLs that the Fund can accommodate. Therefore, the following two options represent the highest and the lowest limit of debt the Fund can accommodate through CDLs:
If CDLs are provided at an interest rate between 0.5% and 1%, the maximum size of CDLs will be equivalent to the ADF allocation for blend, gap and graduating countries, i.e. UA 458 million.
If CDLs are provided at an interest rate between 0 and 0.5%, then the maximum size of CDLs would be equivalent to the ADF allocation for blend, gap and graduating countries plus ADF green light countries, i.e. UA 1.27 billion.
2.7 Since CDLs will be integrated into the replenishment resources, they will have to be accounted for when calculating the ACC (see annex 3). Provided that the redemption profile of a CDL is at least as long as ADF loans reflows, the potential impact on the ACC will be limited to the cash flows related to the net interest rate margin. Nevertheless, given that the CDL is expected to be encashed much faster than regular ADF contribution, the increase in the ACC could still be significant. Hence the impact of CDLs in the two scenarios envisaged is as follows:
CDLs of UA 458 million will have a positive impact on the ACC of UA 172 million, in addition to the increase in donor contributions of UA 458 million. This will result in an overall increase in the resource envelope by UA 630 million (+14, 5%).
CDLs of UA 1.27 billion will have a positive impact on the ACC of UA 347 million, in addition to the increase in donor resources of UA 1.27 billion, which will result in an overall increase in the resource envelope by UA 1.62 billion (+37%).
1 Details on the AfDB Group’s country classification and corresponding resources available are provided in Annex 1.

8
Allocation
2.8 It has been agreed that the CDLs’ proceeds would be pooled with other ADF resources; there will be no earmarking in the allocation process which will be based on the performance-based allocation system.
2.9 The allocation of CDLs’ proceeds to the various ADF envelopes - Transition Support Facility (TSF), Regional Operations (RO), Performance-Based Allocations (PBA), PBA for Fragile States (FS), – would differ depending on the volume of CDLs borrowed by the Fund.
2.10 Since the TSF is ring-fenced and provided there is no change in the TSF eligible country list, its allocation will remain unchanged at UA 0.7 billion while the other resource envelopes will increase. The following figures provide the distribution of resources inclusive of CDLs.
2.11 Figure 1 shows the distribution of resources for a CDL borrowed with interest rates ranging between 0.5% and 1% while figure 2 shows the distribution of resources for a CDL borrowed at interest rates ranging between 0% and 0.5%.
Figure 1: ADF resources for CDLs borrowed at interest rates between 0.5% and 1%
A CDL of UA 0.458 bn
Net Increase by up to
UA 630
Million
(+14,5%)
with costs borne entirely by Subscribing Donors
0.7
TSF
1.1
RO
3.4
PBA
1.0
0.70,9
2.8
0.9
PBA for FS
Without CDLs
With CDLs
Estimations assume UA 4,465.50 million as net total resources available under ADF-14
2.12 Based on our computations, resources mobilized through CDLs with interest rates ranging between 0.5% and 1% during ADF-14 should increase by 14,5% while the TSF would remain the same as in ADF-13 (UA 0.7 billion). However, resources available under RO and PBA would be increased by 14% and 17% respectively. Our simulations suggest that resources to be allocated to countries affected by fragility within the PBA will increase by 11%.

9
Figure 2: ADF resources for CDLs borrowed at interest rates between 0% and 0.5%
A CDL of UA 1.27 bn
Net Increase by up to
UA 1,617
Million
(+37%)
with costs borne entirely by Subscribing Donors
0,7
TSF
1.3
RO
4.1
PBA
1.3
0.70.9
2.8
0.9
PBA for FS
Without CDLs
With CDLs
Estimations assume UA 4,465.50 million as net total resources available under ADF-14
2.13 In the case of CDLs borrowed at an interest rate between 0% and 0.5%, resources mobilized increase significantly compared without CDLs (+37%). Here again, the allocation to the TSF would not change but resources available under RO and PBA would significantly increase by 44% and 46% respectively. PBA resources channeled to countries in fragile situation would also increase by 44%.
Impact of the CDLs interest rates
2.14 For risk management purposes, CDLs would require an UA equivalent interest rate ranging between 0% and 1%, the latter corresponding to the interest rate of loans secured under ADF blend terms. This would ensure that ADF can transfer the borrowing costs to recipients without using any donor grants. However, as evidenced by the simulations above, the impact of the CDLs interest rates is a key factor in determining the volume of resources the ADF might be able to draw from CDLs. If the ADF secures CDLs at interest rates ranging between 0% and 0.5%, additional resources (i.e. UA 1.617 billion) thus mobilized would be 156% higher than if CDLs were borrowed at interest rates of between 0.5% and 1%.
Operational modalities
2.15 At the ADF-13 MTR in November 2015, Deputies agreed on some general features for CDLs, which can be included in the proposed framework for ADF-14. The following section focuses on recommendations from Management on the best operational modalities for CDLs aimed at protecting the interest of the ADF, donor countries, and recipient countries:
Currency: Since the ADF operates in UA (equivalent to the SDR), denominating the CDLs in UA or in currencies of the SDR basket would mitigate the currency risk for the ADF by matching the borrowing currency to ADF’s operational currency. It is therefore recommended that CDLs be denominated in either UA or in UA basket currencies because it could use the existing ADF framework to hedge the currency risk, without adding any additional administrative burden.
Determination of the grant element: The burden shares associated with CDLs are based on the grant element of CDLs. As explained in Annex 6, the grant element represents the present

10
value of the financial benefit to the ADF of contracting a CDL. It depends on the terms and conditions of the CDLs, the terms and conditions of the loans to gap, blend and graduating countries, and on the discount rate used to determine the present value of the financial benefits estimated annually. Considering that, for the sake of risk management, CDLs must be self-contained, the following key features would be adopted:
Maturity and grace period: Considering that the maturity and grace period of CDLs should exceed that of the loans financed by the CDLs proceeds, two cases are possible:
If we target a maximum volume of UA 458 million for CDLs, (which corresponds to the ADF allocation for blend, gap and graduating countries), CDLs should have a maturity of not less than 30 years and a grace period of not less than 5 years;
If we target UA 1 270 million for CDLs, (which correspond to the ADF allocation for blend, gap and graduating countries plus ADF green light countries), CDLs should have a maturity of not less than 40 years, and a grace period of not less than 10 years.
Considering the ADF cash flow profile, maturity interest and principal repayment schedules will be at least the same as those of ADF loans to gap, blend and graduating countries, i.e. 5 years and 30 years respectively. If donors agree on longer grace and maturity periods on their CDLs, these would of course also be accepted.
Repayment schedule: The repayment schedule will aim to match ADF lending terms.
Interest rate: CDLs would require an UA equivalent interest rate ranging between 0% and 1%; however, an interest rate of 0% is highly recommended to achieve the multiplier effect mentioned above.
Discount Rate: It is proposed to retain the “net income earned approach” to calculate the discount rate, which is the same methodology utilized by IDA (see annex 6). The discount rate would be set as the all-in cost of interest rate on ADF loans to gap, blend and transition countries i.e. 1.75%.2
Potential risks and mitigation
Substitution risk
2.16 Since CDLs proceeds benefit all ADF eligible countries, it is necessary to ensure that CDLs do not substitute grant contributions. Therefore, to warrant the additionality of CDLs, the following two elements are proposed:
Only the grant element of a CDL will be treated as a donor contribution for burden-sharing purposes;
A donor’s minimum grant subscription to ADF-14 will be set at 90% of its ADF-13 grant subscriptions, and the total contribution of a member subscribing additionally through CDLs will be at least equivalent to its ADF-13 subscription on a grant equivalent basis.
This approach would encourage partners to use CDLs as an additional scale-up to their grant contributions.
Financial risks to ADF
2.17 The main financial risks that could arise from the introduction of debt funding into ADF’s financing framework would be additional liquidity risk, exchange rate risk and credit risks. Based on our analysis, the Fund’s Asset & Liability Management (ALM) framework will not be weakened by the implementation of the CDLs. Nevertheless, the implementation of the CDLs will require minor changes in the ADF Asset & Liability Management Guidelines, particularly in the following areas:
2 The all-in cost to borrowers also includes a 0.75% service charge.

11
The need to revise the definition of the Fund’s eligible liquidity for the purpose of monitoring
compliance with the Liquidity policy to include the proceeds of the CDLs. Consequently the
Prudential Minimum Level of Liquidity will also need to be adjusted to take into account debt
service requirements;
The need to establish a prudential debt limit to ensure that the Fund can meet its debt service
obligations in addition to its disbursement obligations without having recourse to additional donor
contributions. Internal reflows should be sufficient to cover cash flow requirements.
Debt sustainability risk to borrowing countries
2.18 CDLs are not expected to weigh on the debt sustainability of the ADF eligible countries, since the traffic light system will still prevail for the distribution of resources between loans and grants, based on the Debt Sustainability Analysis of each beneficiary country.
Prioritization rule for loan offers
2.19 The target debt level for ADF-14 is approximately UA 2 billion. In the event that partners provide loan offers in excess of this target level, a 2-step process of prioritization similar to the one adopted by IDA will be implemented, as explained in annex 8. In addition, one could include a priority factor to the participant state that agrees to lend on the most concessional conditions (i.e. interest rate of 0% and 40 years of maturity). Additional information on the risks and advantages of the CDLs is in Annex 7.
3. Bridge Loans
Main principles
3.1 The purpose of a bridge loan is to improve the Fund’s general liquidity level and increase the ACC by frontloading future internally generated resources to the forthcoming two replenishment cycles, when the Fund’s ACC is expected to be low. The ADF would frontload resources to support more operations earlier in recipient countries and would reimburse the loan starting from ADF-16 cycle when reflows into the Fund are expected to exceed outflows. Donors who provide a bridge loan would receive ADF burden-sharing recognition based on the grant element of the loan. Nevertheless, the bridge loan should not be considered as being part of a specific replenishment since it consists of direct injections of donor concessional resources into the ADF’s global ACC mechanism with a view to allow frontloading future internal generated resources at an earlier stage. It is, per se, not limited to any specific replenishment.
Financial impact
3.2 The aim of the BL is to improve the Fund’s general liquidity level while enabling it to smooth its ACC over several replenishments. The downward trend in the ACC that was observed from the ADF-13 period is expected to further worsen during ADF-14 due to well identified factors (see annex 3 on the evolution of ACC). However, the ACC is expected to double from ADF-16 period as the Fund’s reflows are to rise at a faster pace than cash outflows as a result of the growth of the Fund’s loan portfolio and the decision to harden the ADF lending conditions taken during ADF-13.
3.3 The amount of UA 1 billion is the optimal size of the BL to smooth the ACC over several replenishment and to generate an optimal impact of approximately UA 0.83 billion during ADF-14. Moreover, it should be noted that a BL of more than UA 1 billion would not increase further the ACC, which reduces the attraction for the ADF to exceed this amount. Annex 9 provides details on the BL’s expected impact on the ACC.
Allocation
3.4 One of the main appeals of the BL is that, by increasing the total resource envelope of the ADF

12
through an increased level of ACC, it benefits all ADF eligible countries, including those in fragile situations. The BL proceeds will be allocated through the PBA system to all ADF eligible countries. Using ADF-13 donor contributions as the baseline, a BL of UA 1 billion would increase ADF-14 resources by 19% (Figure 3). On top of the baseline ACC of UA 460 million, the ACC would increase by UA 828 million. Hence a BL of UA 1 billion would bring the total amount of the ACC up to UA 1.3 billion. The PBA and the RO envelopes would increase by 22% and 25% respectively. However, for the same reason as in CDLs, the TSF would not increase provided there is no change in the TSF eligible country list.
Figure 3: Distribution of ADF resources in the option of a BL of UA 1 billion
4
Bridge Loans of UA 1 bn
Net increase by up to
UA 828 million (+19%)
with costs borne by Donor(s) providing
bridge loans0.7
TSF
1.1
RO
3.5
PBA
1.1
0.7
0.9
2.8
O.9
PBA for FS
Without BLs
With BLs
Estimations assume UA 4,465.50 million as net total resources available under ADF-14
Operational modalities
3.5 The best operational modality would be for one or more donors to provide a BL in the form of direct injections into the Bank’s ACC that will allow frontloading future internal generated resources at an earlier stage.
3.6 The following section focuses on the recommendation from Management on the modalities, aiming at protecting the interest of the Bank Group, donor countries and recipient countries.
Determination of Grant Element: As for CDLs, the burden shares associated with the BL are based on its grant element. Here again, the same methodology as IDA (the so-called “Net income earned approach”) would be applied to calculate the BL’s grant element. However, there are some divergences in the results, given that the return on BL’s proceeds depends on the currency in which the BL will be received while the return on CDLs depends on the ADF lending conditions. Annex 10 provides more information on the calculation of the grant element of a BL.
Maturity and grace period: considering that the ACC would increase from the ADF-16 onwards, when there would be a comfortable level of liquidity allowing the ADF to

13
meet its obligations, the maturity of a BL would not have to exceed 20 years including a 10 years of grace period.
Repayment schedule: an amortizing repayment calendar would be applied with yearly payments.
Interest rate: BLs would require an interest rate that could range between 0% and 1%, the latter being considered as the maximum rate where the grant element would still be attractive for donors (see table 9 in annex 10).
Discount rate: The discount rate is a key variable for estimating the grant element. Following the “net income earned approach”, the discount rate corresponds to the expected return on BL’s proceeds, which depends on the currency in which the BL will be received. Therefore, it is proposed to use the SDR yield curve (see figure 9 in annex 10) for the determination of the discount rate. On this basis, the proposed discount rate is set at 1.75% for an average investment portfolio maturity of 15 years.
Currency It is recommended that the BLs be denominated in either UA or in a currency of the UA basket because it could use the existing ADF framework to hedge the currency risk, without adding any additional administrative burden (see annex 10).
3.7 The BL is a simple instrument to implement and has no significant impact on the Administrative budget, nor any major legal implications. The Fund would have to enter into a written agreement with the country (or the entity) providing the BL in such a form as is acceptable to the Fund. No specific legal vehicle would have to be created, such as a trust fund or an earmarked facility, other than the usual contractual agreements between Bank and donors to secure the loans arrangements.
3.8 It is expected that the BL’s proceeds will be allocated through the PBA system to all ADF eligible countries. Hence, the traffic light system would prevail for the countries eligibility to loans and/or grants, based on the Debt Sustainability Analysis. This being considered, BLs are not expected to
impact negatively the debt sustainability of ADF eligible countries.
Financial risks to ADF
3.9 The main financial risks that could arise from the introduction of debt funding in the form of BLs into ADF’s financing framework would be the same as for CDLs, i.e. additional liquidity risk, exchange rate risk and credit risks. Given the similarity of risks between CDLs and BLs, the same risk analysis conducted on the implementation of BLs has driven to the same conclusions as in the CDLs case. Please refer to the § 2.17 for more information.
4. The Buy-Down Mechanism
Main Principles
4.1 The proposed BDM would reduce part of the ADF commitments to a set of countries, in order to free-up resources to fund additional operations in the ADF remaining countries. It takes advantage of the Bank’s credit policy and available AfDB headroom. The BDM leverages the AfDB balance sheet and has two elements:
Eligible RMCs would be able to use their AfDB headroom to borrow from the AfDB the equivalent of their Performance Based Allocation (PBA). Extra grant resources would then be made available either by ADF and/or a willing third party as compensation for the differential between ADF and AfDB lending terms.
As a result, some countries would no longer utilize their ADF allocations. This would unlock resources for the remaining ADF countries.
4.2 The BDM would be applied to ADF countries which have enough AfDB headroom. To ensure that the pilot application of the BDM under ADF-14 is risk free, it is proposed to apply the BDM to the ADF most advanced countries (i.e. graduating countries and blend countries) and ADF green light

14
countries. Countries facing fragile situations would be excluded. As of January 2016, the BDM would be applied to 10 countries.
Financial impact
4.3 The most important beneficiaries of the mechanism would be the ADF remaining countries which have huge needs in terms of concessional financing. The gross amount of additional resources for them is estimated at around UA 648 million (see Annex 13). There would be a very small reduction in the ACC (see weaknesses section below). The net amount of additional resources is estimated at
around UA 631 million during ADF-143. The PBA bar corresponds to the effective resources
allocated (out of Bank’s charges) including the BDM effect.
Figure 4: Distribution of ADF resources in the case of a BDM.
6
Buy-Down Mechanism to Blend,
Graduating, and Green Light Countries
Increase by up to
UA 631million
for the neediest RMCs at no direct
cost to Donors
0.7
TSF
0,9
RO
3,3
PBA
1.2
0.7
0,9
2,7
0.9
PBA for FS
Without BDM
With BDM
Estimations assume UA 4,465.50 million as net total resources available under ADF-14
Allocation
4.4 In the simulations, all freed up resources are allocated to the ADF remaining countries through the Performance Based Allocation (PBA) system, as in Figure 4.
4.5 Eligible countries which forego their ADF allocation would actually have access to more resources because extra grants will be provided on top of the equivalent of the PBA provided by the Bank on AfDB terms4.
4.6 To create incentives for eligible countries to which the mechanism is applied, to forego their ADF allocation, a proportion of the released amounts could be allocated to them, in the form of a topped up allocation, or technical assistance in addition to extra grants. In addition, the operational guidelines of the ADF could be amended to make sure that countries that would otherwise be pushed out
3 The BDM net impact would be UA 0.201 billion, i.e. the sum of additional resources made available for the ADF remaining countries (UA 0.203 billion) less its negative impact on the ACC of about UA 0.002 billion) if the BDM is applied to blend and graduating countries. 4 The BDM will slightly reduce the AfDB headroom of these countries. The 10 countries have a total AfDB headroom of UA 16,767 million as of
2015. The total estimated PBA allocation for these 10 countries under ADF-14 is UA 977 million. Therefore, it is estimated that the application of the BDM would consume 5,8% of the AfDB headroom of these countries.

15
completely from the ADF, continue to have access to the Regional Operation envelope and similar instruments.
Weaknesses
4.7 The BDM will result in a lower ACC during ADF-14 through two effects: a “compensation” effect and a “grant share” effect. By limiting the use of ADF resources to some countries and pushing some borrowers to the AfDB window, the reflows to the ADF will decrease in the future and the share of grants in the ADF will increase. The BDM will therefore result in a decrease of the ACC in the future because ACC assumptions include less reflows in the future. The decrease in the ACC will be higher if grants provided to the eligible countries as compensation come directly from the ADF. In this case, the ACC would decrease by UA 17 million during ADF-14 if the mechanism is applied to blend, graduating and some ADF Green light countries (See Annex 14). The ACC would decrease by UA
2 million during ADF-14 if the mechanism is only applied to blend and graduating countries.5 If the
compensation is not provided by the ADF, the decrease in the ACC during ADF-14 will be lower.
4.8 The BDM would have no cost for ADF contributors in the short term. However, as the BDM will move borrowers from the ADF to the AfDB, part of the unlocked resources will be utilized to support countries eligible for grants. The amount of grants provided by the Fund will increase. In addition, if the grants made available to the eligible countries as compensation come from the ADF, the volume of grants in the ADF-14 will increase. As the volume of grants is used to compute the consolidated Grant Compensation Scheme agreed since ADF-9 (see Annex 16), the larger the amount of grant is, the larger the compensation from ADF contributors will be in the future. Grant compensation is paid in instalments, using the repayment profile of ADF loans that would have been approved on that replenishment but were given out instead as grants. It therefore mirrors the repayment profile of loans approved on the replenishment. As an example, compensation for grants approved on year 1 of ADF-14 (2017) should start being paid by Donors back to the Fund after the grace period of the applicable loan repayment profile elapses, i.e., and assuming standard ADF loan terms, in 2028. There would be less impact on the Grant Compensation Scheme if the compensation is not provided by the ADF.
Operational modalities
4.9 Annex 17 sets out implementation options. Management proposes to implement the BDM on a pilot basis during ADF-14. If implemented on a stand-alone basis, the BDM would be applied to blend, graduating and ADF green light countries that are not experiencing a situation of fragility. ADF resources would be set aside for the mechanism.
Possible risks and mitigation
Financial risks to the AfDB
4.10 If the BDM is implemented, the benefits of the diversification of the AfDB’s portfolio would be larger than the additional risk taken by the Bank (see Annex 15). If the BDM were to be applied to some ADF green light countries, the same risk assessment as the one in the Bank Group’s current Credit Policy would be conducted to vet the creditworthiness of potential eligible countries, in order to protect the Bank from the additional risk taken. ADF Countries that are then not deemed eligible for the AfDB window after the creditworthiness assessment will continue to receive their PBA from the ADF.
Debt sustainability risk to borrowing countries
4.11 The mechanism will be in line with countries’ Debt Sustainability Analysis (DSA). Eligible countries would have access to more resources because extra grants will be provided on top of the equivalent of the PBA provided by the Bank on AfDB terms. The package of resources will have the same amount of concessionality.
5 The decrease is mitigated if the ADF compensation is allocated following the standard ADF conditions.

16
5. Possible combinations
5.1 This section presents the feasibility and impact of each combination. Figure 5 below summarizes the potential combinations and the respective financial impacts.
Figure 5: Possible combinations of the CDLs, BLs and BDM.
CDLs BLs
BDM
* CDLs’ interest rates ranging between 0% and 0.5%
** CDLs are applied to gap countries, whatever its interest rate. BDM to blend, graduating and non-fragile green light countries
*** CDLs with an interest rate at 0% are applied to gap and green light countries. BDM is applied to blend and graduating countries
UA 630 M or UA 1617 M*
UA 1312 M or UA 2212 M*
UA 828 M
UA 631 M
UA 2177 M***
UA 1459 MUA 873 M**UA 1330 M ***
5.2 For the sake of the simulations, the following assumptions were used:
Two variations for the CDLs: one where CDLs are provided at an interest rate ranging between 0% and 0.5% and one where CDLs are provided with an interest rate ranging between 0.5% and 1%;
Bridge loans of UA 1 billion;
Two variations for the BDM: one where the BDM concerns blend and graduating countries; one where in addition non-fragile green light countries are included.
5.3 From a Bank’s Group’s perspective, it should also be noted that in the case of the BDM, eligible countries which forego their ADF allocations will also receive the equivalent of the PBA from the AfDB (estimated at UA 977 million during ADF-14). The overall positive effect of the BDM will thus include around UA 1 billion in addition to the unlocked UA 631 million
5.4 The sequencing of the BDM when combined with the CDL and BL matters for the net effect on the resource envelope. Indeed, if the ACC is first added to donor contributions, and then the BDM applied this would free more resources than if BDM is applied only to donors’ contributions. However, the BDM has a negative impact on the ACC which introduces a feedback loop making such sequencing difficult. For the sake of clarity Management applied the BDM only on donors’ contributions which gives the lower bound for freed-up resources.
CDLs and BLs
5.5 The following two options are based on the two scenarios for the CDLs (with an interest rate between of 0% and 0.5%; and the other with interest rate between 0.5% and 1%):

17
The highest option would be where all CDLs are provided by lenders at an interest rate between 0% and 0.5%, and limited to UA 1.270 billion (the estimated ADF-14 allocation for blend, gap, graduating and ADF green light countries). In this option, the impact on the ACC would be about UA 0.942 billion. Thus, the total impact of the combination of CDLs of UA 1.270 billion with BLs of UA 1 billion would be UA 2.212 billion.
The lowest option would be where all CDLs are provided by lenders at an interest rate between 0.5% and 1%; and limited to UA 0.458 billion, which corresponds to the sum of the estimated ADF-14 allocation for blend, gap and graduating countries. The cumulated impact on the ACC would be UA 0.854 billion. Consequently, the total impact of the combination of CDLs and BLs in this option would be UA 1.312 billion.
Many options between the highest and lowest option can be envisaged, depending on the interest rate charged by the lenders.
5.6 To mitigate the risk related to the debt limit cut off, a buffer could be set, as explained on page 10 above.
BL and BDM
5.7 BDM and BL can be run concurrently and their impacts summed. In this combination, the BDM is applied to blend, graduating and ADF green light countries that are not affected by a situation of fragility. The total impact of such a combination would be UA 1.459 billion - the sum of the BDM impact (UA 0.648 billion) and the net impact of the two instruments on the ACC of UA 0.811 billion (the BLs impact of UA 0.828 billion minus the negative impact of the BDM of UA 0.017 billion).
The CDLs can be combined with the BDM, under specific conditions
5.8 CDLs and the BDM cannot be directly combined, since all ADF eligible countries cannot be considered simultaneously for both options, for prudential reasons. The categories of countries need to be split between the two instruments. To make this combination possible and to optimize its impact, two options have been envisaged, the highest one assuming that CDLs would be provided with an interest rate ranging between 0% and 0.5%.
The higher option would be where (i) CDLs include gap and green light countries, with an interest rate at 0%; their maximum potential impact would be UA 1.129 billion - the estimated ADF-14 allocation for gap and ADF green light countries (UA 1,035 billion) plus the positive impact on ACC of UA 0.094 billion; and (ii) the BDM is applied to blend and graduating. The BDM impact would be UA 0.201 billion, i.e. the sum of additional resources made available for the ADF remaining countries (UA 0.203 billion) less its negative impact on the ACC of about UA 0.002 billion). The total impact of this combination would be UA 1.330 billion.
The lower option would be where (i) CDLs include gap countries only, with an interest rate at up to 1%; their maximum potential impact would be UA 0.242 billion – the estimated ADF-14 allocation for gap countries (UA 0.222 billion) plus their positive impact on ACC (UA 0,020 billion); and the (ii) BDM is applied to blend, graduating, and ADF green light countries not in a fragile situation. The BDM impact would be UA 0.631 billion, i.e. the sum of additional resources made available for the ADF remaining countries (UA 0.648 billion) less its negative impact on the ACC of about UA 0.017 billion. The total impact of this combination would be UA 0.873 billion.
5.9 Obviously, in this option combination again, the global impact would be maximized if donors agree to lend CDLs with an interest rate of 0%.
The three instruments can be combined, under specific conditions
5.10 While various simulations have been made based on the different scenarios of interest rates applied

18
to CDLs and the distribution of the categories of countries, only one option has been retained here to show its impact on the ADF-14 resources. The combined impact of the CDLs (assuming it is lent with an interest at 0%) and the BLs on the ACC would be the same as in the option where those two instruments are combined, i.e. UA 0.942 billion. The BDM would be applied to blend and graduating countries; its maximum potential impact would be UA 0.201 billion, i.e. the sum of additional resources made available (UA 0.203 billion) less its negative impact on the ACC (UA 0.002 billion). The maximum potential direct impact of the CDLs would be UA 1.035 billion, which corresponds to the sum of the estimated ADF-14 allocation for gap and ADF green light countries. The global impact of the best combination of the three instruments would be UA 2.177 billion.
5.11 Based on the assumptions used, it is notable that the combination of the three instruments would not necessary generate the highest additional resources for the ADF-14. Provided donors have enough appetite to provide loans, the combination of CDLs and BLs is higher. That is because CDLs have a higher potential impact when all ADF countries are included under CDLs.
6. Leveraging Concessional Donor Loans for Private Sector Development
6.1 The growing interest on the part of some donors to provide concessional loans in addition to the usual grant resources has great potential to contribute to the transformation of ADF economies. CDLs would allow recipient countries to have higher envelopes at still concessional rates instead of resorting to borrowing at very high rates on International capital markets. Moreover, concessional loans premised on capital preservation would also be more in line with discussions in donor capitals given their continuing tight fiscal situation.
6.2 Up until now, Management has proposed to absorb concessional donor loans through the global ADF envelope and a bridge loan to make more Accelerated Commitment Capacity (ACC) available sooner. The amount of such loans to the ADF is limited by: (i) the number of countries to which the ADF provides loans, and (ii) future ACC levels. There is however scope to absorb more concessional donor loans to support the transformative ambition of ADF 14 if such loans were used to support private sector operations in ADF countries. In addition, as lending to the private sector would be on harder terms, the ADF would be more sustainable over time. Hence, leveraging CDLs to support private sector operations is, in our view, a win-win scenario which deserves support.
6.3 The Bank Group’s vision of Africa is articulated in the Bank Group Strategy for 2013-2022, as a continent stable, integrated and prospering of competitive, diversified and sustainably growing economies with an expanding taxable base that can generate more domestic resources to finance development. Consistent with this vision, the private sector is a powerful driver of economic and social well-being in the continent—creating quality jobs for a growing and mostly young and restless population; generating rising incomes; and supplying an expanding range of quality goods and services at competitive prices. A key goal of the Bank Group in promoting private sector development is thus to contribute to strong and inclusive economic growth that will lead to economic transformation and sustainable development.
6.4 In line with the Bank Group Strategy 2013-2022, the ADF has supported private sector development (PSD) both indirectly (e.g. budget support, technical assistance, infrastructure finance, investments in human capacity development and other actions to improve the investment climate in ADF countries) and directly through guarantee schemes (see Box 1). Harnessing more donor resources to support private sector development, fits within the broader context of better and smarter development financing to achieve the Sustainable Development Goals (SDGs) in Africa. Africa’s private enterprises – including an estimated 70 percent of Africa’s approximately 50 million MSMEs – are severely hampered by insufficient access to long-term finance.6 Even large African enterprises routinely experience financing constraints.7 Such underfunding has led to significant underinvestment, particularly in capital goods
6 See M. Stampini, R.Leung, S. Diarra and L. Pla. 2013, “How Large is the Private Sector in Africa? Evidence from National Accounts and Labour
Markets” South African Journal of Economics Vol. 81:1 March. pp. 140-165; and T. Beck, S. Munzele Maimbo, I. Faye, T. Triki. 2011, Financing
Africa, Through the Crisis and Beyond, African Development Bank. Tunis. 7 Ibid.

19
such as machinery and equipment, as well as in research and development. In turn, this has contributed to a vicious circle of low levels of innovation, productivity, competitiveness, and employment opportunities.8 An anemic private sector also means that countries cannot expand their taxable base to generate domestic resources. Many of Africa’s young people have increasingly responded by running away to Europe and beyond because the continent is not generating the opportunities they are seeking. A vibrant private sector is the most promising way to create enough jobs which will generate better opportunities for the youth of Africa and thus prevent them from being lured by extremism or migration to developed economies.
Box 1: Existing ADF Initiatives in Support of Private Sector
The Partial Risk Guarantee (PRG) introduced under ADF-12 insures private lenders against well-defined political risks, related to the failure of a government or a government-related entity to honor specified commitments. The Partial Credit Guarantee (PCG) approved under ADF-13, partially guarantees the debt service obligations of eligible countries and State Owned Enterprises (SOEs) and therefore lowers borrowing costs. Under ADF 13, the Fund also rolled out the Private Sector Credit Enhancement Facility (PSF) with an initial seed grant of UA 165 million as a risk sharing vehicle to enable the AfDB to support more private sector projects in Low Income Countries (LICs). Over and beyond these initiatives, ADF resources may also be used by eligible sovereigns as equity participations or on-lent to State-Owned Enterprises or Public-Private Partnership vehicles.
6.5 Principles. In 2013 MDBs developed a joint guidance paper on principles and methodologies for deploying concessional financing through the private sector.9 Specific attention was paid to the subsidy element when concessional resources are provided to the private sector. The three key agreed-upon principles were: (a) need to have a clear market failure that cannot be resolved through traditional DFI non-sovereign financing such that the subsidy element is additional; (b) the subsidy element has to accrue to the “public good” that is achieved; (c) the subsidy element has to be minimized both in amount, and over time to achieve bankability without creating market distortions. The joint approach also recognizes that subsidization does not have to only be in the form of a lower interest rate. It could also be in the form of lower returns, lower seniority in financing on a stand-alone basis or finally by blending concessional and non-concessional financing. In addition, such funding would have to be strongly additional, catalytic, and target particular sectors, for example renewable energy. It is these principles that would guide any proposal to use ADF resources to support private sector entities. Two broad options could be considered.
6.6 Option 1: Direct Support to Private Sector Operations. CDLs over and above what is being requested to support sovereign operations and the bridge loan could be set aside to directly fund private sector operations (PSOs) in line with the principles outlined above. Such PSOs may have a high social return, but although commercially viable, their expected return on investment might be unattractively low. If suitable guarantees to private sector entities prove to be difficult to secure (see Box 2, third bullet), an alternative could be lending to a government-guaranteed institution which would then on-lend to the private sector. Finally, if some donors have an interest to do so, they could provide CDLs for co-financing non-sovereign operations.
8 World Economic Forum, World Bank, and African Development Bank. 2011. The African Competitiveness Report 2011. World Economic Forum:
Geneva; Gebreeyesus, M. 2009. “Innovation and Microenterprises Growth in Ethiopia.” UNU-WIDER Research Paper No. 2009/51; and Onyeiwu, S. 2011. “Does the Lack of Innovation and Absorptive Capacity Retard Economic Growth in Africa?” UNU-WIDER Working Paper No. 2011/19. 9 See DFI Guidance for Using Investment Concessional Finance in Private Sector Operations, April 15, 2013 at
http://www.ebrd.com/downloads/news/roundtable.pdf . The paper was led by the EBRD and the IFC and comprised representatives of the African Development Bank, Inter-American Development Bank and European Investment Bank

20
Box 2: Agreement Establishing the ADF
The articles of the Agreement establishing the African Development Fund allow scaled-up engagement to support the private sector within the context of the following articles:
- Article 14: the Fund provides financing only on concessional terms. - Article 15 (2): the Fund lends to deserving entities with limited sources of finance. - Article 16 (3): government or other guarantees if the borrower is not a member state.
6.7 Option 2: Scaling up the Private Sector Credit Enhancement Facility (PSF) CDLs could be channeled through the PSF to: (a) provide blending solutions and/or (b) enhance the PSF’s risk participation capacity.
(a) Blending solutions- Blending finance combines financing on market-based and concessional terms such that the overall financing structure can do more and/or accept lower financial returns than conventional DFI financing. Resources from CDLs would allow the PSF to be used as a conduit for providing such blending solutions, in the form of guarantees or loans. For the PSF to act as a blending platform would require that the arms-length relationship between the ADB and PSF be maintained.
(b) Risk participation capacity- The PSF’s credit enhancement capacity is backed by the liquidity of a reserve pool to cover potential losses. The PSF is designed to be self-sustaining over time, with revenues accruing from risk participation fees. There is an ongoing effort to scale up the PSF through targeted outreach to potential partners and investors.. One could explore conditions under which CDLs could be used through the PSF to risk participate in eligible private sector operations of the ADB and external financiers.
6.8 Way Forward A scaled-up ADF assistance to the private sector would be transformational. We see a unique window of opportunity to achieve this transformation by leveraging Concessional Donor Loans to support private sector operations. Management seeks Deputies’ views on such a possibility. Should Deputies agree, further analysis and design will be shared ahead of the second meeting of the ADF 14 replenishment.
7. Management’s Proposal to Deputies under ADF-14
7.1 In the ADF-14 Financial Framework Management proposes to combine CDLs provided at 0% interest rate with a maturity of 40 years and a grace period 10 years and bridge loans of UA 1 billion provided at an interest rate of up to 1%,with a maturity of 20 years, and a grace period 10 years. This should generate an additional UA 2 billion that will be injected within the ADF global pool of resources. Management also seeks Deputies views on the possible use of CDLs, over and above what is requested to support sovereign operations and the bridge loan, to further support private sector development in ADF countries.

21
Annex 1: AfDB Group’s Country Classification and Corresponding Resources
Available
Creditworthiness to Sustain AfDB Financing
No Yes
Per capita
income above
the ADF
operational cut-
off level for
more than 2
years
No
Countries below cut-off level and not
creditworthy: ADF-only countries on
regular/advanced ADF terms
(also known as Category A countries)
Countries below cut-off level and creditworthy:
blend countries eligible for AfDB resources
and for ADF resources subject to a cap and on
blend terms
(Also known as Category B countries).
Yes
Countries above cut-off level and not
creditworthy: gap countries not eligible for AfDB
resources but eligible for ADF resources on
blend terms (Category A)
Country above cut-off level and creditworthy:
Only eligible for AfDB resources (also known
as Category C countries)
Exceptionally, graduating countries are
eligible for ADF resources on blend terms
during a 2 to 5-year phasing-out period
Notes: All countries can borrow from the AfDB non-sovereign window. Creditworthy RMCs (blend & graduating countries) are eligible for both AfDB resources and ADF resources. The ADF resources are subject to a cap and are provided on blend terms. Blend countries can access their performance based ADF allocation (PBA) which is equivalent to 50% of their basic allocation. For graduating countries towards AfDB only status, a transition period of 2 to 5 years is applied (i.e. the country receives 100% of its ADF PBA allocation in year 1 and 50% in year 2, or, it receives 100% of its ADF PBA allocation in year 1; 80% in year 2; 60% in year 3; 40% in year 4 and 20% in year 5)10.
There is a provision in the transition framework for countries changing their credit status that creates incentives for the voluntary acceleration of graduation. In order to encourage graduation in line with a country-tailored approach, positive incentives are offered to graduating countries that would prefer more and faster access to AfDB resources instead of ADF resources. This would free up resources to be available for more interventions in other ADF recipient countries. In this way, the length of the transition period can even be shortened to less than two years. More precisely, the transition period as determined in the graduation program can be tailored to phase in AfDB resources on AfDB terms more quickly by foregoing ADF resources, at a ratio of two AfDB Units of Account (UA) for every foregone ADF UA. As of today, this provision has not been used by RMCs.
10 In April 2011 the Bank Group adopted the Transition Framework for Countries Changing Credit Status (ADB/BD/WP/2011/20/Rev.2), which
guides each transition process from one Category to another. It prescribes that the Bank will prepare a transition program for each country
being reclassified; setting out how the Bank will accompany the country in its transition to its new status. The country-tailored transition program will be included in a programming document, such as an update to the Country Strategy Paper (CSP). The Transition Framework also
sets out the criteria determining the length of the transition period in the case of graduation to Category B or C, which varies from 2 to 5 years.
This is determined by a number of guiding criteria such as measures of the pervasiveness of poverty and the relative level of human development; measures of the rate of economic growth and related revenue; and measures of financial need and use of Bank group resources.

22
Annex 2: Information from IDA on their experience with CDLs and its applicability
to the ADF
Concessional Donor Loans (Concessional Partner Loans – CPLs, as it is called in IDA) were incorporated into the financing framework of the IDA-17 replenishment as an innovation to use a limited amount of debt funding and increase IDA’s lending envelope to recipient countries. This funding mechanism was introduced in IDA-17 for a number of reasons. First, the increased price differentiation in IDA’s lending terms introduced in IDA-16 and IDA-17 (in particular shortening the grace period and maturity, and adding an interest charge) created an opportunity for IDA to incorporate debt funding into its financing framework on a sustainable basis. Second, a number of IDA contributing partners were facing resource constraints and the CDLs provided an opportunity for partners, including Middle Income Countries, to make important contributions to IDA in addition to the traditional grant payments. Third, the historically low level of interest rates allowed IDA to borrow on terms that could be structured to match closely its credits offered on blend and harder terms.
Donors agreed to a CDL framework in IDA-17 aimed at balancing the need for maintaining strong incentives for providing grant funding, with the need to provide recognition for the additional funding provided by concessional loans. While the full nominal amount of the concessional loan represents a valuable resource for IDA-17 commitment authority, the CDL framework offered burden share recognition and voting right allocation for the concessional loan based on its grant element. The grant element of a loan recognized in IDA-17 is effectively the difference between the cost of the concessional loan to IDA and the additional revenue that the loan can generate for IDA. It is calculated based on the cash flows drawdowns and repayments of the partner loan in present value terms. A discount rate of 2.65% (in SDR terms) was agreed by IDA partners to be used in the grant element calculation. This rate is the average interest rate and service charge on a portfolio of IDA blend term and transitional support credits in IDA-17, which are less concessional than ADF ones.
During the IDA-17 Replenishment discussions, participants encouraged partners to use the concessional loan to scale-up their grant contributions. They underscored the importance of the guideline under which partners would aim to provide at least 80 percent of their IDA-16 basic contribution amount in the form of a core grant contribution and target at least their IDA16 basic contribution amount on a total grant equivalent basis.
IDA also established a prudential debt limit setting the maximum volume of debt that could be sustainably incorporated into IDA-17’s financing framework. The debt limit model looked at the cash outflows relating to the concessional loan repayments relative to the cash inflows from IDA-17 transitional support lending and blend term credit repayments. The model then sets the debt limit such that the net cash flows (inflows less outflows) ensures that inflows from the loans on the blend and transitional support terms would comfortably exceed concessional loan repayments over the long term. Based on the preferred financing scenario of IDA-17, a prudential limit of SDR 6.1 billion was approved by the Board.
As mentioned in the table 1 below, standard financing terms were agreed by partners and applied to all the concessional loans in IDA-17 in order to ensure the concessional loans have features at least as concessional as IDA credits:
Table 1 – IDA’s CDLs Model and its applicability to ADF
Lessons learnt in IDA regarding CDLs Applicability to ADF
1) Historically low level of interest rates would allow IDA to
borrow on terms that could be structured to closely
match the credits offered on blend and harder terms;
Yes
2) Sufficient demand for CDLs as ~30% of IDA’s financial
assistance is provided on blend terms Yes

23
3) CDLs could provide an additional mechanism for middle
income partner countries to significantly scale up their
financial contributions to IDA
Yes – CDLs could be a viable option for African countries interested in contributing to the Fund
4) CDLs would increase IDA commitment authority. Yes
5) IDA would accept concessional loans in one of the SDR
basked currencies, namely the USD, EUR, JPY and
GBP.
Yes – although preference would be to limit contribution to SDR currencies to avoid undue administrative burden.
6) CDLs require appropriate risk management measures
to manage liquidity, interest rate, and credit risks that
could arise from the introduction of debt funding into
IDA’s financing framework
Yes
7) Necessity to limit risk of substitution of core grant
contributions for CDLs:
80/20 rule: donors’ contributions through concessional loans is subject to first meeting their objective of pledging in grants at least 80% of their previous contribution during IDA-16
Yes 90/10 rule would apply, depending on Deputies final decision
8) Only the grant element of a concessional loan is to
be treated as a partner contribution for burden
sharing and voting rights purposes
Yes
9) Grant element = present value of the portion of a
concessional loan that conveys a financial benefit to
IDA; Financial benefit derived as:
- the blend interest rate – borrowing cost >0 (Net
Income earned approach)
- borrowing cost - market cost of borrowing <0 (Net
cost savings approach)
Yes Net Income earned approach preferred.
10) IDA’s blend interest rate represents the appropriate
benchmark to use when determining the grant-element. Yes (ADF’s)
11) characteristics of concessional loans provided to IDA-
17:
- Maturity: Maturities would be either 25 or 40 years
to match the terms of IDA’s credits.
- Grace period: The grace period would be 5 years
for a 25 year loan or 10 years for a 40 year loan.
- Coupon/Interest: IDA concessional loans would
have an all-in SDR equivalent coupon of up to 1
percent.
Yes
- Maturities would be 30 years to
match ADF credit terms vs. 20
years for the Bridge Loan (BL).
- Grace period would be 5 years for
CDL vs. 10 years for BL.
- Coupon/Interest: 0% - 1%.
The framework evolved over the course of more than 2 years of working group meetings and replenishment discussions, but ultimately a consensus was achieved and the framework was approved by the Board. Issues discussed over the period include interest rate floors, buy-downs, and the need to avoid substitution. The approved framework addressed many of the significant challenges relating to the implementation of partner concessional loans in a multilateral institution, where burden share and voting rights recognition is awarded.
While many partners closely reviewed the framework and considered providing partner loans, five countries provided concessional loans totaling SDR 2.9 billion (US$ 4.4 billion) for IDA-17. These loans were provided in the four currencies of the SDR basket and four of the loans have a maturity of 25 years, while one has a maturity of 40 years. The all-in coupon rates of the concessional loans range from 0% to 1% in SDR terms, with an average cash borrowing cost of 0.67% (see table below). The total IDA-17 lending envelope was

24
increased by the notional amount of the loan contributions. In addition, the funding from the concessional loans improved IDA’s projected liquidity and thus enabled IDA to commit SDR 0.9 billion (US$1.36 billion) in additional internal resources for IDA-17.
Table 2: Concessional Loan Contributions to IDA 17
In conclusion, the IDA-17 CDLs model could be replicated for the ADF-14 providing that some adjustments are made in order to reflect specific ADF features such as the difference of concessionality applied to recipient countries of CDLs, which is higher in the ADF.

25
Annex 3: The ACC model
What are the mechanics of the ACC?
The Advance Commitment Capacity (ACC) is basically the maximum amount available through the ACA (Advance Commitment Authority), for the subsequent 3 years/replenishment cycle, derived from future internally generated resources (i.e. loan reflows + investment income) and against which lending commitments can be made.
The ACA is a cash flow projection model (spanning over 50 years) to help match the proceeds from all funding sources with payments of new loans and grants (which take an average of 10 years). To prevent any cash flow mismatches, a prudential portion of the ADF investment portfolio is set aside as minimum liquidity threshold (=75% of net disbursements).
Figure 6 – The ACC Mechanism
What is the expected evolution of the ACC?
The ACC is recalibrated every 3 years at the start of each new replenishment, based on the cash flow projections of the Fund loan income, loan reflows, investment income and administrative expenses.
As shown in figure 7 below, the ACC reached peak levels during ADF-11 and ADF-12, and then declined sharply during ADF-13.

26
Figure 7: Historical evolution of the ACC
The key reasons for the decline of the ACC between ADF-12 and ADF-13 were the following:
i. The assumptions on the Fund’s investment income were revised downward to reflect the lower interest rate environment. For ADF-12 the average return of the liquidity portfolio was estimated at 4.5% based on prevailing LIBOR rates for the prudential portfolio and forward rates for the investment portfolio at that time, but for ADF-13 the projected rates were reviewed downward to 2.65%, resulting in lower projected cash reflows from investments.
ii. During ADF-12, in order to improve efficiency of its operations, the Fund revised its loan cancellation policy to reassign 70% of cancelled loans to beneficiary countries, while the remaining 30% are reallocated to the general pool of liquidity. Previously, 100% had gone in to the general pool. As a result, reflows from loan cancellations were expected to decrease very significantly in the ACC model from an estimated annual amount of UA 100 million to only UA 30 million, representing the annual amount that can be re-committed following cancellations. As a result of this change of the loan cancellation policy, the ACC for ADF-13 dropped significantly. However it should be noted that while the ACC decreased for the general pool of countries, countries whose operations are cancelled can re-commit additional resources during each replenishment which are not accounted as new resources.
iii. The Fund’s outstanding liquidity at the end of ADF-12 was also lower than initially projected due to several other factors including: (i) an increase in the level of administrative expenses, (ii) disbursements for allocation to set asides such as the Fragile State Facility, expected to disburse at a faster pace than regular ADF projects, (iii) the creation of a special investment portfolio to warehouse and manage the proceeds of accelerated encashments, which was excluded for eligible liquidity immediately available for disbursement.
For ADF-14, the ACC is expected to decrease to approximately UA 460 million due to the following key factors:
645
1200
2063 2007
978
0
500
1000
1500
2000
2500
ADF-9 ADF-10 ADF-11 ADF-12 ADF-13
ADF Liquidity and ACC overview - based on ADF-13 assumptions
ACC

27
Continued lower interest rate environment results in a decrease in the Fund’s investment income with a knock-on effect on the ADF-14 expected ACC;
Increased administrative expense budget (esp. over the 2015-2018 period) will further reduce the ACC;
Updated projections on MDRI inflows are also expected to impact negatively the ACC.
More information on the ACC and its expected evolution is provided in the ADF-14 Financing Framework paper.

28
Annex 4: Potential demand for CDLs
The design features of CDLs are such that there is no distinct demand for the product other than the general demand for ADF resources. CDLs are intended to provide resources that form part of the general pool of resources for the replenishment cycle. CDL proceeds are allocated through the performance based allocation (PBA) system in the same way as donor subscriptions in the form of grants and internally generated funds (see on page 7). However, one of the key principles of their design is that CDLs should be self-contained in the sense that cash inflows from ADF loans funded with their proceeds should be sufficient to cater for CDL debt service. To the extent that the interest rate on CDLs is greater than zero, the total volume of CDLs cannot be higher than the volume of ADF loans with an interest rate, assuming that the 75 basis points service charge on ADF loans will continue to be retained to defray administrative costs. Consequently, the demand for CDLs is constrained by the volume of lending to gap, blend and graduating countries that will be charged with an interest rate + service charge of 1.75%.
The volume of ADF-13 resources allocated to gap, blend and graduating countries is estimated at UA 447 million, or 15% of the resources allocated, or to be allocated, through the Performance-Based Allocation (PBA) System during the replenishment cycle (Table 3). On the basis of the expected graduation scenario, the volume of ADF-14 replenishment cycle resources11 that is expected to be allocated to gap, blend and graduating countries is projected to slightly increase to UA 460 million representing 17.0% of total resources. During the ADF-15 cycle, UA 644 million is projected to be allocated to the same category of ADF borrowers representing an increase to 23.0% of the resources allocated through the PBA during the replenishment cycle.
These figures, especially those for the ADF-15 replenishment cycle, depend not only on the graduation scenario retained but also on the transition periods, which can be up to 5 years12. Another factor that could have an impact on the demand for CDLs is further hardening of the lending terms for ADF-only regional members, especially those in the “Advance” sub-category by introducing an interest rate13.
Table 3: Projected Allocations to Countries by Credit Category for ADF-13, 14 and 15 cycles
Country category
ADF-12 ADF-13 ADF-14 ADF-15
UA million
% UA
million %
UA million
% UA
million %
Gap, Blend, Graduating
248,12 6,6% 446,94 15,0% 460,54 16,8% 643,97 23,5%
Gap 22,10 0,6% 226,07 7,6% 222,91 8,1% 328,19 12,0%
Blend 194,40 5,2% 93,90 3,1% 204,18 7,5% 214,26 7,8%
Graduating 31,63 0,8% 126,96 4,2% 33,45 1,2% 101,52 3,7%
ADF-Only 3488,71 93,4% 2541,65 85,0% 2277,02 83,2% 2101,66 76,5%
Total 3736,83 100,0% 2988,59 100,0% 2737,56 100,0% 2745,64 100,0%
On the basis of the graduation scenario, the volume of ADF-14 replenishment cycle resources14 that is expected to be allocated to gap, blend and graduating countries is of UA 461 million, representing 17.0% of total resources (Table3). It should be noted that the simulations on the CDLs in this paper were based on the projected allocations as of the December 2015, which included an allocation of UA 458 million for the gap, blend and graduating countries. This allocation has been kept in this paper for the sake of continuity
11 It has been assumed that ADF-14 envelope will be the same as ADF-13 envelope in real terms. 12 Two of the two regional members currently in transition have been subjected to a 5-year transition period while the other has been granted only
a 2-year transition period. 13 The lending terms for regional members in this sub-category currently include a maturity of 40 years, a grace period of 5 years, a service charge
of 0.75%, a commitment fee of 0.50% and no interest charge. As of March 31, 2015, five countries are under this category: Benin, Chad,
Kenya, Mauritania and Senegal. 14 For the sake of comparison, it has been assumed that ADF-14 envelope will be the same as ADF-13 envelope in real terms.

29
and to rely the simulation on a slightly more conservative reference base.
During the ADF-15 cycle, an amount of UA 644 million is projected to be allocated to the same category of ADF borrowers representing an increase to 23% of the resources allocated through the PBA during the replenishment cycle.
The demand for CDLs during ADF-14 might be lower if it is decided to implement the BDM at the same time on a pilot-basis, with a focus on the blend, graduating and ADF green light countries (excluding those in a situation of fragility). In this case, the ceiling amount that would be acceptable for the CDLs would be limited to the allocation for gap countries, i.e. UA 223 million.

30
Annex 5: Impact of CDLs on the ACC
It is considered that CDLs will be recognized as part of the replenishment resources.
To avoid a negative impact on the Fund’s liquidity, the redemption profile of a CDL should mirror (or be longer than) ADF loans reflows.
The interest rate of the CDLs will be the key factor to determine the potential maximum volume of CDLs that the Fund can accommodate.
1) If CDLs are provided with an interest rate at 0.5% - 1%, the maximum potential size of CDLs will be equivalent to the ADF allocation for blend, gap and graduating countries, i.e. about UA 458 million.
2) If CDLs are provided with an interest rate at 0 – 0.5%% , then the maximum potential size of CDLs would be equivalent to the ADF allocation for blend, gap and graduating countries, plus the ADF green light countries. The maximum potential size of CDLs would be in this case up to UA 1270 million.
As a result, based on the expected ACC level of UA 460m for ADF-14, the potential impact on the ACC by CDLs (assuming maturity of 30 years with a 5 years grace period) is summarized as follows:
Table 4: Impact of CDLs on ACC
A significant drop in the ACC level will be observed during the ADF-16 cycle in the case when CDLs with an interest rate of 1% (which would cap the volume of CDLs to UA 0.458 billion, corresponding to the allocation for ADF gap, blend and graduating countries) were provided by donors during ADF-14. This is due to the higher outflows that will occur following the initial repayment of CDLs principal and interests to the donors that will start after the grace period of 5 years.
The overall Impact on ADF resource envelope at ADF-14 would be as follows:
+UA 630 million increase for a CDL of UA 0.458 billion @1%,
+UA 1,617 million increase for a CDL of UA 1.270 billion @0%.
ADF-14 ADF-15 ADF-16 ADF-17 ADF-18
ACC before CDL 460 460 1 732 2 271 2 271
ACC with UA458m CDL @ 1% 632 633 645 2 608 2 608
Impact of UA458m CDL @ 1% 172 173 (1 087) 337 337
ACC with UA1,270m CDL @ 0% 807 807 807 2 505 2 506
Impact of UA1,270m CDL @ 0% 347 347 (925) 234 235

31
Annex 6: Calculation of the grant element for the CDLs and what differ from IDA
and OECD-DAC
The burden shares associated with CDLs are based on the grant element of CDLs. The grant element represents the present value of the financial benefit to the ADF of contracting a CDL. It depends on the terms and conditions of the CDLs, the terms and conditions of the loans to gap, blend and graduating countries and on the discount rate used to determine the present value of the financial benefits estimated annually. Considering that, for the sake of risk management, CDLs must be self-contained, it is assumed that the following key features would be required for a CDL to ADF:
Maturity and grace period: considering the ADF cash flow profile, the maturity interest and principal repayment schedule will be at least the same as those of ADF loans to gap, blend and graduating countries, i.e. 5 years and 30 years respectively. Of course, softer borrowing terms (i.e. longer grace and maturity periods) would also be accepted.
Repayment schedule: a straight-line amortizing repayment calendar would be applied, matching to ADF blend lending terms.
Interest/coupon rate: CDLs would require an UA equivalent interest/coupon rate of between 0% and 1%, the latter corresponding to the interest rate of loans secured under ADF blend terms. This would ensure that ADF can pass on the borrowing cost to recipients without using any donor grant funding.
Currency: Since the ADF operates in UA (equivalent to the SDR), denominating the CDLs in UA would mitigate the currency risk for the ADF by matching the borrowing currency to ADF’s operational currency. Allowing ADF donor countries to denominate their contributions through CDLs in the currency of their choice, as they are allowed to do with regards to their grant subscriptions, would impose a significant administrative burden on the Fund. It is therefore recommended that CDLs should be denominated in either UA or in UA basket currencies because it could use the existing ADF framework to hedge the currency risk, without adding any additional administrative burden.
While different methodologies exist to calculate the grant element, Management recommend to retain the so-called “Net income earned approach” determined as the spread of averaged interest earned on ADF blend credits (1%) over the cost of borrowing – , where the first is the benchmark to be considered as the discount rate used to derive
The discount rate is a key variable for estimating the grant element. As donors are recognized based on the grant element of their CDLs, it is important to select a discount rate that will provide a strong incentive to contribute to ADF through CDLs, and that, simultaneously, will be considered equitable by donors providing only grants. Management therefore recommend retaining the “net income earned approach” to calculate the discount rate, which is the same methodology utilized by IDA. It is simpler, more stable and more equitable across replenishments than the “net cost savings approach” which would be unstable as it relies on the prevailing interest rates on the market.
Using the net income earned approach, the discount rate shall be estimated as the all-in cost of ADF loans to gap, blend and transition countries (excluding commitment fees), i.e. 1.75% comprising the service charge on ADF loans of 0.75% and an interest rate of 1.0%.
It is worth to note that IDA is using the same methodology for its CDLs in IDA-17, provided that its discount rate is calculated as the weighted average of the interest rate plus the service charge for transitional and blend countries.
Table 5 provides an estimation of the grant element under various scenarios of concessional rate on CDL:

32
Table 5 – Grant element under various scenarios of concessional rates on CDL
WAM: Weighted Average Maturity Compared to IDA, the use of CDLs in ADF should be constrained by the demand for loans on blend terms with an interest rate of 1.75%. This is why it would be impossible to use the same discount rate as IDA (i.e. 2,65% in SDR terms), since IDA has harder lending terms than the ADF for blend and transitional categories of countries, which include India.
Despite ADF and IDA use the same methodology (the so-called “net income earned approach”), the difference of condition of lending applied to recipient countries of CDLs is the only rationale justification to explain the difference between discount rate proposed by IDA vs ADF on this product. Indeed, what is worth to be looking at is not really to their concessionality, but simply at the interest rate differential that may have between the cost of a CDL and the interest rate at which one lend to the target ADF countries. From a risk management point of view, it is essential that CDLs have at least the same repayment profile of the types of ADF loans we would be financing through the introduction of this innovation.
The OECD-DAC methodology is rather different than the net income earned approach used by the two IFIs. The OECD uses a base 5% discount rate, which corresponds to the current IMF discount rate, to which it applies three different adjustment factors depending on the category of recipient countries: 4% for LDCs and other LICs; 2% for LMICs and 1% for UMICs. It is worth noting that the only purpose of the OECD’s methodology is to determine how to classify concessional donor lending as Official Development Aid (ODA). IFIs, by contrast, have to be concerned with maintaining inflows above outflows.
In conclusion, grant element on CDLs proposed by the ADF may be lower than in IDA merely because IDA’s condition of lending are slightly harder than ADF’s for target blend, gap and graduating (transitional) countries.
OECD-DAC is applying another methodology for internal classification purposes, which impeaches any relevant comparison.
It may be stressed that the methodology selected by the ADF is not mandatory at all. At the end of the day, the donor countries can use any kind of methodology to calculate CDLs concessionality for their own national purposes.
0.00% 0.25% 0.50% 0.75% 1.00%
5-30 17.75 1.75% 23.7% 20.3% 16.9% 13.5% 10.1%
Maturity WAM Discount RateInterest rate on concessional loan

33
Annex 7: CDLs – Strengths and weaknesses analysis
1. Main strengths and weaknesses of CDLs for the ADF
Strengths
CDLs will be recognized as part of the replenishment resources: CDLs are intended to provide resources that form part of the general pool of resources for the replenishment cycle. Since CDL proceeds will be allocated through the performance based allocation (PBA) system in the same way as donor subscriptions in the form of grants and internally generated funds, implementation will be relatively easy and the potential impact on the administrative budget will be very limited - considerably lower than the additional commitment capacity that the Fund would draw from CDLs.
CDLs would use existing legal arrangements. No specific legal vehicle would have to be created (i.e., no trust fund or earmarked facility) other than the usual contractual agreements between Bank and donors to secure the loan arrangements.
CDLs could significantly grow the ADF envelope: As evidenced by an increasing number of other multilateral institutions which already experienced concessional donor loan implementation (e.g. IDA, Green Climate Fund, IFAD), the introduction of CDLs could increase the total resources available to ADF14 by increasing financing available from donors who provide soft loans in addition to their grants, by potentially attracting new donors, including African countries, and by the consequential impact on the Advance Commitment Capacity (ACC) that would not have to be neglected. Moreover, CDLs provide an opportunity to leverage ADF’s grant contributions and thereby enable fulfillment of the Bank Group’s ambitious mandate.
CDLs would have no direct negative impact on liquidity: Liquidity risk related to CDLs can arise in two ways: firstly, the risk that there is insufficient liquidity when a request for disbursement from a qualifying project or country is received; secondly, the risk that funds are not available to service CDLs. Both risks can be mitigated by a proper design of CDLs, provided that their terms are similar to or softer than ADF lending terms, as follows: (i) the proceeds of the CDL should be paid in cash in three annual instalments, the first of which shall be no later than one month after the effectiveness of ADF-14; (ii) only CDLs that at least match the repayment terms of loans to ADF gap, blend and graduating countries, i.e. 5-year grace period, 30-year maturity, straight line amortization and half yearly repayments, should be accepted; (iii) the interest rates on CDLs should be determined to match the fixed ADF lending rate; and, finally, (iv) the Fund already has sound policies and relevant tools addressing these kind of risks, and these could be amended should any specific or residual risks arise from the use of CDLs.
Consequently, the interest rate of the CDLs will be the key factor to determine the potential maximum volume of CDLs that the Fund can accommodate. In this view, the two following options have been retained:
If CDLs are provided with an interest rate between 0.5% and 1%, the maximum potential size of CDLs will be equivalent to the ADF allocation for blend, gap and graduating countries, i.e. about UA 458 million.
If CDLs are provided with an interest rate between 0 and 0.5%% , then the maximum potential size of CDLs would be equivalent to the ADF allocation for blend, gap and graduating countries, to which the ADF green light countries might be added. The maximum potential size of CDLs would be in this case up to UA 1270 million.
CDLs would increase the ADF’s ACC: Since CDLs will be recognized as part of the replenishment resources, they will have to be accounted for when calculating the ACC (see annex 3 on the ACC model and its expected evolution). Provided that the redemption profile of a CDL mirrors or is longer than ADF loans reflows, the potential impact on the ACC will be limited to the cash flows related to the net interest rate margin. Nevertheless, given that the CDL is expected to be encashed much faster than regular ADF contribution, the increase in the ACC could still be significant.
As noted in annex 3, the impact on the ACC would be positive in ADF-14: a CDL of UA 458 million would have a positive impact on the ACC of UA 172 million, whilst a CDL of UA 1.27 billion would increase the ACC by UA 347 million. The impact beyond ADF-14 would depend on the terms of the CDL. Based on

34
revised assumptions of the ACC as detailed in annex 3, a CDL of UA 458 million (maturity 5/30 with an interest rate between 0.5% and 1%) injected in the Fund in 2017 would have a very small negative impact – about UA 14 million - for the period from ADF-14 to ADF-18 since both the principal and the interests will have to be reimbursed from ADF-16. However, in the case where CDLs total UA 1,270 million, the ACC would be positively impacted by UA 48 million on an average basis on the same period of fifteen years (from ADF-14 to ADF-18).
Weaknesses
Financial risks could arise from the introduction of debt funding into ADF’s financing framework. While financial risks are already inherent in ADF’s operations, the introduction of debt funding into ADF’s financing framework requires appropriate risk management measures since it can generate additional liquidity, exchange rate and credit risks. Based on our analysis, ADF’s existing risk management framework related to the Bank Group’s Asset Liability Management policy would require no major amendment to cover such incremental financial risks. Indeed, the following two risk management measures might suffice to mitigate additional risks: (i) increasing the prudential minimum liquidity level to cover debt service; (ii) introducing a debt limit. This would help in ensuring ADF would meet its debt servicing obligations without disrupting operations or using grant contributions from donors, thus mitigating any reputational risk to the Bank Group.
In addition, a supplementary prudential measure could be added in the form of a buffer limit set to the maximum debt the ADF could incur. The aim of this buffer would be to mitigate against volatility risk in the classification of countries, especially in the group of ADF green light countries where changes can occur every year. It is well understood that the traffic light system, which relies on the Debt Sustainability Analysis (DSA) launched by the IMF, is very sensitive to various factors that might occur. Countries can evolve from one category to another during the same ADF cycle: in 2015 for instance, 2 ADF-only countries (Ethiopia and Liberia) saw their DSA downgraded from low to moderate, and so they ceased to be green light countries. Depending on the number of countries changing DSA status, this may have an impact on the ADF debt limit cut off.
Consequently, a buffer might be fixed related to the loan repayments that would be lost if two ADF green light countries became yellow during the ADF-14 period. Concretely, based on the projected ADF-14 total allocation of UA 802 million for the five ADF-only countries, one average country allocation would be about UA 160 million (802/5=160). This average country allocation would be multiplied by two since one can reasonably expect that not more than two countries might see their creditworthiness degrade from low risk (green) to moderate (yellow) during the ADF-14 period. The buffer could be set at half this amount of UA 320 million, since the countries that would become yellow would be eligible for 50% of loans. Consequently, the amount of UA 160 million could be sufficient as a buffer.
Since the traffic light system only applies to the ADF-only countries, the buffer would only be of relevance in the option where CDLs are provided with an interest rate between 0 and 0.5%% - since only then are ADF green light allocations considered when evaluating the maximum size of CDLs the fund could reasonably accommodate. Such a buffer could protect the Fund against any potential risk of loan cancellations, carry-overs of under-consumed resources or situations where a country is unable to meet its obligations following the occurrence of any kind of unpredicted shock.
Introducing a debt funding option could create perverse incentives to reduce grant contributions. The highly concessional nature of ADF’s overall funding implies its reliance on grant funding. If donors substitute their core grant contributions with debt contributions, this would have serious negative consequences for ADF’s long-term financial sustainability. Indeed, given that the majority of ADF eligible countries still need highly concessional support, ADF could not operate without contributions in the form of grants. To mitigate the substitution risk, it is recommended that (i) the total contribution of a donor country subscribing through CDLs be at least equivalent to its ADF-13 contribution on a grant equivalent basis and that (ii) donor countries would commit to provide at least 90% of their ADF-13 basic burden share in the form of grant.
2. Main strengths and weaknesses of CDLs for donors

35
Strengths
CDLs offer donors the opportunity to scale up contributions to the ADF without stretching donors’ fiscal balances: The international community has set the objective of increasing the size of global ODA aiming at supporting the post-2015 agenda. Given the expectation of continued pressure on the development assistance budgets of traditional donors, the CDLs would be an innovative tool to help donors to enhance the availability of funding for ADF replenishments. Such an instrument, blending a loan with a grant component, could be easier for donors that need to streamline the use of their tax-payers money for Official Development Assistance (ODA). Considering that donors using CDLs would lend to the ADF on very soft terms, such expenses would remain classified as capital transfers for ODA purpose and, as such, would not be registered as to be compensated in the national accounts, following specific national or regional accounting rules. Even if CDLs, given their loan nature, will be paid-back to the donor, it might be thought that their high degree of concessionality (interest rate of max. 1% and long maturity) might reduce donor’s attraction for such an instrument. Nevertheless, Climate Investment Funds and IDA experience with concessional partner loans tend to indicate that there is significant interest in the use of concessional debt as a means of scaling up contributions to the concessionary windows of MDBs. In the case of IDA, five partners contributed a total of UA 2.9 billion in CDLs, as detailed in annex 2. The grant element of the CDLs brings burden sharing recognition and equity of treatment between donors providing grants and those also providing CDLs: The full amount of a loan contribution is available to increase the financial assistance that ADF provides to its eligible beneficiaries. However, unlike a grant contribution that receives recognition for burden sharing and voting rights purposes, a loan does not represent a permanent benefit to ADF because the loan would be repaid over time and therefore, cannot receive the same recognition. To ensure equity of treatment between donors providing debt funding and those contributing only in the form of grants, the recognition provided for a loan contribution would be based on its grant element only, as it represent an actual, realizable benefit to ADF. In addition, it is worth noting that the Agreement establishing the ADF does not provide any room for donors that provide concessional lending to the ADF to be recognized with additional voting powers, unlike IDA.
Weaknesses
While increasing the ADF overall commitment capacity, both on loans and grants envelops, the CDLs will mechanically impact on the long run on the grant compensation mechanism that was agreed between donors and the ADF in order to mitigate the reduction of future reflows resulting from increased grant financing. Indeed, donors have agreed since ADF-9 to compensate the Fund for foregone reflows above 7.5 percent of the replenishment amount, as the reflows arise, using the “pay-as-you-go” approach. Each donor‘s contribution to grant compensation is based on its normalized burden share for the corresponding replenishment. During ADF-14, an amount of UA 49.55 million will be due, representing the 2017, 2018 and 2019 compensation for grants extended during ADF-9 and ADF-11 (see Annex 16).

36
Annex 8: Prioritization rules for CDLs and BLs
The concessional donor loan option is designed as a mechanism for donors seeking to significantly scale up their contributions. As a result the loan option will only be available to donors who meet the minimum base line burden share requirement, i.e., ADF-13 burden share on a grant equivalent basis. In the event that CDL or BLs offers exceed the debt limit, ADF would need transparent rules to determine which offers to accept first, so that the two key principles of additionality and equitable access are respected.
To achieve both objectives the following 2 stage process is proposed. For this illustration it has been assumed that ADF-14 donor subscriptions amount to UA 4,000 million, and there is an ADF-14 debt limit of UA 500 million with an interest rate of 0.5%, a 5-year grace period and a 30-year maturity. The discount rate for determining the grant element has also been taken to be 1.00%.
First stage: prioritization based on ADF-13 burden shares. Loan offers would be prioritized based on ADF-14 core burden shares up to a specified percentage, which for the purpose of this example is taken to be 60%. This is illustrated in Table 6.
Table 6: Illustration of First stage Prioritization Based on ADF-14 Core Burden Shares
Country A that had a burden share of 10.00% in ADF-13 pledges to subscribe 9.5% of the UA 4,000 million target replenishment level for ADF-14, and also offers a CDL of UA 200 million. The potential grant element of the offer is UA 33.42 (200x 0.1686) that would generate an ADF-14 burden share of 0.84% if the entire offer was accepted. The total grant equivalent of burden share of Country A is 10.34% (9.50% + 0.84%). Country A therefore meets the minimum burden share requirements as (i) it maintained its ADF-13 burden share of 10% on a grant equivalent basis including the loan offer (10.34%) and (ii) its ADF-14 core burden shares from grant contributions is greater than 90% (95%). Since Country A meets the minimum burden share requirements, at least UA 28.5 million (300x9.5%) of its loan offer would be accepted in stage 1.
Country B does not meet the minimum burden share requirements, since it had a burden share of 10% under ADF-13 but is only offering 5.63% this time. Consequently, no portion of its loan offer will be accepted in stage 1.
Countries C, D, and E meet the minimum burden share requirements and would be allocated UA 30 million (300x10%), UA 33 million (300x11%) and UA 45 million (300x15%) respectively during the first stage.
Second stage: Prioritization based on additionality: In stage 2, the remaining debt limit would be allocated in order of priority to the donors with the highest percentage change in core burden shares in ADF-14
500
300
A B C D E
200 150 150 100 200
10.00% 10.00% 10.00% 10.00% 10.00%
9.50% 5.00% 10.00% 11.00% 15.00%
0.84% 0.63% 0.63% 0.42% 0.84%
10.34% 5.63% 10.63% 11.42% 15.84%
Yes No Yes Yes Yes
28.5 30 33 45
ADF-14 burden share incl. grant element of loan offer
Meets minimum baseline burden share requirements
Stage 1 prioritization based on ADF-14 core burden share (i.e.,
Minimum loan offer that w ould be accepted from donor)
Table I : Illustration of First stage Prioritization Based on ADF-14 Core Burden Shares
Maximum debt limit
Countries
Loan offer
Portion prioritized in stage 1:
ADF-13 basic burden shares
(60% of total)
ADF-14 core burden share from grant contributions
Potential burden share from grant element of loan offer
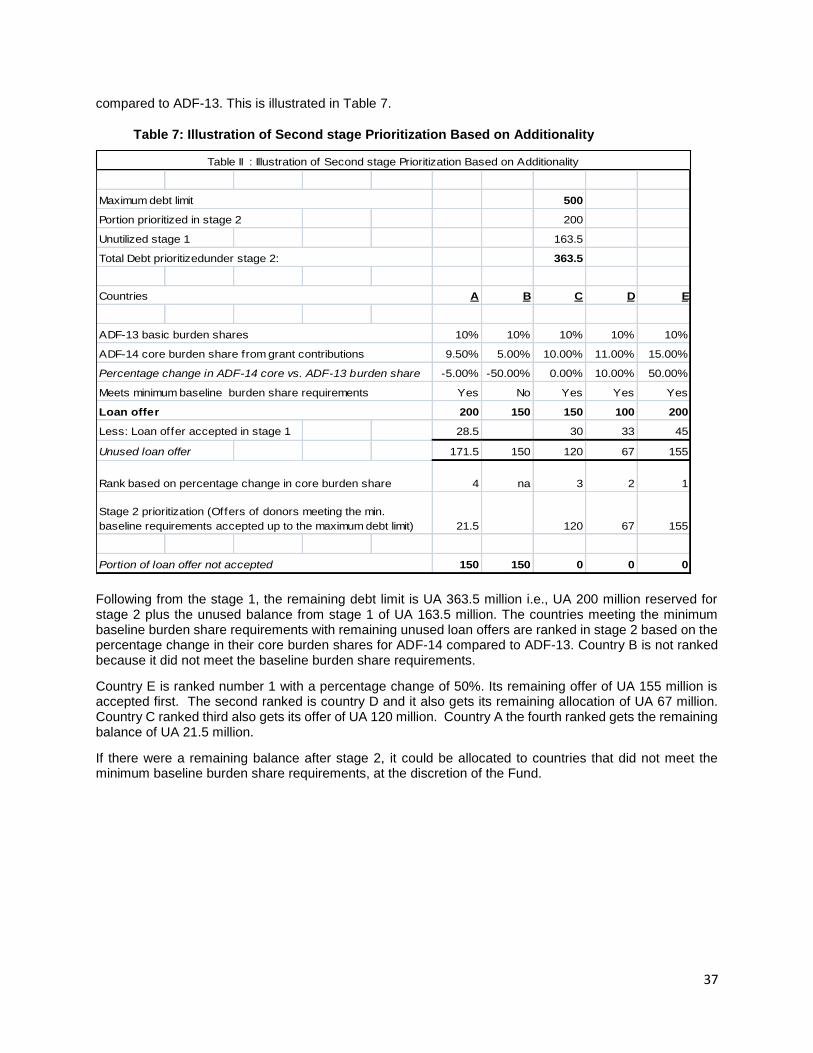
37
compared to ADF-13. This is illustrated in Table 7.
Table 7: Illustration of Second stage Prioritization Based on Additionality
Following from the stage 1, the remaining debt limit is UA 363.5 million i.e., UA 200 million reserved for stage 2 plus the unused balance from stage 1 of UA 163.5 million. The countries meeting the minimum baseline burden share requirements with remaining unused loan offers are ranked in stage 2 based on the percentage change in their core burden shares for ADF-14 compared to ADF-13. Country B is not ranked because it did not meet the baseline burden share requirements.
Country E is ranked number 1 with a percentage change of 50%. Its remaining offer of UA 155 million is accepted first. The second ranked is country D and it also gets its remaining allocation of UA 67 million. Country C ranked third also gets its offer of UA 120 million. Country A the fourth ranked gets the remaining balance of UA 21.5 million.
If there were a remaining balance after stage 2, it could be allocated to countries that did not meet the minimum baseline burden share requirements, at the discretion of the Fund.
500
Portion prioritized in stage 2 200
Unutilized stage 1 163.5
363.5
A B C D E
10% 10% 10% 10% 10%
9.50% 5.00% 10.00% 11.00% 15.00%
-5.00% -50.00% 0.00% 10.00% 50.00%
Yes No Yes Yes Yes
200 150 150 100 200
Less: Loan offer accepted in stage 1 28.5 30 33 45
Unused loan offer 171.5 150 120 67 155
Rank based on percentage change in core burden share 4 na 3 2 1
21.5 120 67 155
150 150 0 0 0Portion of loan offer not accepted
Meets minimum baseline burden share requirements
Stage 2 prioritization (Offers of donors meeting the min.
baseline requirements accepted up to the maximum debt limit)
Table II : Illustration of Second stage Prioritization Based on Additionality
Maximum debt limit
Total Debt prioritizedunder stage 2:
Countries
Loan offer
ADF-13 basic burden shares
ADF-14 core burden share from grant contributions
Percentage change in ADF-14 core vs. ADF-13 burden share

38
Annex 9: How a Bridge Loan will impact on the ACC?
The aim of the BL is to improve the Fund’s general liquidity level while enabling it to smooth its ACC over several replenishments.
Thus, based on the expected ACC level of UA460m for ADF-14, the potential impact on the ACC by a BL of UA500m and UA1 billion respectively (assuming an average interest rate of 0.5% and 20 year loan maturity – incl. 10-year grace period) is summarized as follows:
Table 8: Impact of a Bridge Loan on the ACC
ADF-14 ADF-15 ADF-16 ADF-17 ADF-18
ACC before Bridge Loan 460 460 1,732 2,271 2,271
ACC with UA500m BL 942 939 941 2,323 2,323
Impact of UA500m BL 481 479 (791) 52 52
ACC with UA1,000m BL 1,289 1,289 1,292 1,806 1,806
Impact of UA1,000 BL 828 829 (440) (465) (465)
The Bridge Loan will increase the total resource envelope of the ADF for the next 2 replenishments as follows - thereby benefiting all ADF eligible countries, including in fragile situations as follows:
Figure 8: Projection of the Total Resource Envelope with a UA 1billion BL
3,758 3,945
4,142 4,349
4,567 4,795 4,773
4,971
…4,102
4,330
0
1000
2000
3000
4000
5000
6000
ADF-13 ADF-14 ADF-15 ADF-16 ADF-17 ADF-18
No bridge With Bridge Loan

39
Annex 10: Calculation of the grant element for a Bridge Loan
With regards to the calculation of the grant element of a BL, the same methodology as IDA would be applied. This is the so-called “Net income earned approach” whereby the grant element would correspond to the present value of the spread between the BL cost and expected return on the BL’s proceeds, the latter being the benchmark/discount rate used to derive the grant element.
The return on BL’s proceeds will of course depend of the currency in which the BL will be received, with some currencies such as the US dollar currently providing relatively higher investment returns, while other currencies like the JPY provides less attractive returns. As it will not be possible to determine in advance the currencies in which the BL will be provided, Management suggests using the SDR yield curve (see figure 11) to determine the discount rate. It should be noted that the SDR basket provides a good approximation of the currencies in which the Fund’s donor resources are generally received, and should also be a good approximation of the currencies in which the BL will be received.
Figure 9 – SDR Yield Curve
On that basis, assuming investment of BL proceeds in an average 15-year maturity portfolio, table 9 presents the computation of the grant element for a discount rate of 1.75% and various scenarios of interest rates for the BLs.
Table 9 – Grant element for BLs
0.00%
0.50%
1.00%
1.50%
2.00%
2.50%
3.00%
1 3 5 7 9 11 13 15 17 19 21
SDR Yield Curve
SDR USD EUR GBP JPY CNY
0.00% 0.25% 0.50% 0.75% 1.00%
10/20 15.25 1.75% 22.6% 19.7% 16.7% 13.8% 10.9%
Interest rate on the bridge loan
(cost of borrowing)Maturity WAM Discount Rate

40
Annex 11: Bridge Loan – Strengths and weaknesses analysis
1. Main strengths and weaknesses of BLs for the ADF
Strengths
The BL will have a positive impact on the ACC. The aim of the BL is to improve the Fund’s general liquidity level while enabling it to smooth its ACC over several replenishments. The reducing trend in the ACC that was observed from ADF-13 period is expected to further worsen during ADF-14 (see annex 3 on the expected evolution of ACC) due to several factors including a continued lower interest rate environment. However, the ACC is expected to double from ADF-16 period as the Fund’s reflows are to rise at a faster pace than cash outflows as a result of the decision to harden the ADF lending conditions taken in ADF-13.
Considering this context, the BL would have a very positive impact by frontloading future internally mobilized resources to the forthcoming two replenishment cycles, when a low level of ACC as projected would otherwise limit the Fund’s ability to respond to the growing needs of its recipient countries. Annex 9 provides details on the BL’s expected impact on the ACC.
Hence, the BL will contribute to increasing the ADF Commitment capacity. One of the main appeals of the BL is that it would increase the total resource envelope of the ADF through an increased level of ACC, thereby benefiting all ADF eligible countries, including in fragile situations. It is expected that the BLs proceeds will be allocated through the PBA system to all ADF eligible countries. Hence, the traffic light system would prevail for the countries eligibility to loans and/or grants, based on the Debt Sustainability Analysis. This being considered, it is worth noting that BLs are not expected to negatively impact on the debt sustainability of the ADF eligible countries.
Assuming the same level of donor contributions as for ADF-13, allocable resources available under ADF-14 should increase by 19% thanks to the positive impact of UA 0.828 billion that BLs equivalent to UA 1 billion would have on the ACC. The PBA and the RO envelopes would increase by 18% and 23% respectively. However, the TSF would not increase automatically since it rely on a ring-fenced fixed amount which, for the sake of comparison, is assumed to remain the same as in ADF-13 (UA 0.7 billion).
The BLs would help in smoothing out the ADF’s current liquidity constraints. Through frontloading future internally generated resources to the forthcoming two replenishment cycles, when the ADF’s ACC is expected to be low, the BL will help the ADF deal with liquidity constraints. Depending on the scenario regarding the size of the BL, frontloaded resources would help through the postponement of the time when the liquidity needs will be most acute.
A Bridge Loan could be provided by any actor, including non-ADF participants. Article 8 of the ADF Agreement states that “[…] the Fund may enter into arrangements to receive other resources, including grants and loans, from members, participants, States which are not participants and from any public or private entity or entities […]”, provided that the same compliance requirements as for the BLs provided by a traditional ADF donor are met. Thus, there would be no legal obstacle, as such, that prevents the ADF from contracting a BL from any external third party, provided the restrictive conditions imposed in Article 8 of the Fund Agreement are strictly observed.
The BL is a simple instrument to implement and has no significant impact on the Administrative budget. The additional commitment capacity that the Fund could draw from ` BL would be much greater than its administrative costs. The BLs would not have major legal implications. The Fund would have to enter into a written agreement with the country (or the entity) providing the BL in such a form as is acceptable to the Fund. The arrangement would be approved by the ADF Board of Directors, unless it is with a State which is not a member of the Fund (or a State participant in the Fund or with an agency of such a State), in which case the approval has to be by an 85% of the total voting power of the participants in the Fund (i.e., the Bank and the State participants).

41
2. Main strengths and weaknesses of BLs for ADF Donors
Strengths
BL offer donors the opportunity to scale up their contributions to ADF while preserving their fiscal balance. Given the expectation of continued pressure on the development assistance budgets of traditional donors, the BL would be an innovative tool to allow donors to improve the ADF’s general liquidity while enabling it to cushion in a timely manner the ACC’s expected worsening. Like the CDLs, the BL model includes a debt funding component, in addition to its grant element. Hence, the BL model could be for donors a softer way to increase their contribution to the ADF.
[It should be noted that, while providing such a contribution in the form of a BL, the contributing donor shall support the ADF on a global scale beyond ADF-14 since the positive impact on the ADF liquidity will prevail on a longer period.
The grant element of the BL will be provided with burden sharing recognition: As it was explained above in the case of CDLs, the donors would be recognized though allocation of burden sharing corresponding to the grant element of their contribution. Annex 10 provides more detailed information on the methodology used to calculate the grant element of a BL.
In the case where any non ADF participant would like to provide a BL, it is worth noting that, provided that from a policy point of view, ADF participants agree that the Fund can obtain resources, other than Subscriptions as defined in the Agreement establishing the ADF, they would also have to agree on whether such other resources that are not Additional Subscriptions would count towards a State participant’s burden share or not. In that case, the Bank will assist them in making the determination.
Weaknesses
While increasing the ADF overall commitment capacity, both on loans and grants envelops, the BLs will impact on the grant compensation mechanism in the long run, as in the case of CDLs.

42
Annex 12: Buy-Down Mechanism (BDM) - Strengths and weaknesses analysis
1. Main Strengths and weaknesses of BDM for the Bank’s Group
Strengths
With the BDM, the utilization of the Bank’s Group resources would be optimized to provide more
resources to RMCs.
The most important beneficiaries of the mechanism would be the ADF remaining countries which
have huge needs in terms of concessional financing. The gross amount of additional resources for the ADF
remaining countries is estimated at around UA 648 million during ADF-14 (see Annex 13).
Eligible countries would also have access to more resources because extra grants will be provided on
top of the equivalent of the PBA provided by the Bank on AfDB terms. In the simulations, all freed up
resources are allocated to the ADF remaining countries through the Performance Based Allocation (PBA)
system. However, to create incentives for countries to which the mechanism is applied, a proportion of the
released amounts could be allocated to the countries to which the BDM is applied in the form of a topped
up allocation or technical assistance in addition to extra grants.
The benefits of the diversification of the Bank’s portfolio would be larger than the additional risk
taken by the Bank. Overall, the BDM should not adversely affect the risk exposure of the Bank (see annex
15).
Weaknesses
The BDM would introduce complexity in the framework for assistance to countries. The amount of
concessional resources will be calculated through the ADF methodology (PBA) but granted by the AfDB.
The BDM will result in a decrease of the ACC during ADF-14 through two effects: a “compensation”
effect and a “grant share” effect. By limiting the use of ADF resources to some countries and pushing
some borrowers to the AfDB window, the reflows to the ADF will decrease in the future and the share of
grants in the ADF will increase. The BDM will therefore result in a decrease of the ACC in the future because
ACC assumptions include less reflows in the future. The decrease in the ACC will be higher if grants
provided to the eligible countries as compensation come directly from the ADF. In this case, the ACC would
decrease by UA 17 million during ADF-14 if the mechanism is applied to blend, graduating and some ADF
Green light countries (See Annex 14). The ACC would decrease by UA 2 million during ADF-14 if the
mechanism is only applied to blend and graduating countries. The decrease is mitigated if the ADF
compensation is paid following the standard ADF conditions. If the compensation is not provided by the
ADF, the decrease in the ACC during ADF-14 will be lower.
2. Strengths and weaknesses for ADF donors
Strengths
The BDM would meet donor objectives of immediately increasing the resources to support the post-
2015 agenda.
The BDM would have no cost for the ADF contributors in the short term.
Weaknesses
There would be an increase in the amount donors have to provide in future under the grant
compensation mechanism. As the BDM will move some borrowers from the ADF to the AfDB, the
unlocked resources will be utilized to support a larger share of countries eligible to grants. The amount of
grants provided by the Fund will be therefore larger. In addition, if the grants made available to the eligible
countries as compensation come from the ADF, the volume of grants in the ADF-14 will increase. As the
volume of grants is used to compute the consolidated Grant Compensation Scheme agreed since ADF-9
(See Annex 16), the larger the amount of grant is, the larger the compensation from ADF contributors will

43
be in the future. It would however, be some way into the future. Since grant compensation mirrors the
repayment profile of loans approved on the replenishment. As an example, compensation for grants
approved on year 1 of ADF-14 (2017) should start being paid by Donors back to the Fund after the grace
period of the applicable loan repayment profile elapses, i.e., and assuming standard ADF loan terms, in
2028. There would be less impact on the Grant Compensation Scheme if the compensation is not provided
by the ADF.

44
Annex 13: Buy-Down Mechanism - Estimated Freed up Funding for the Remaining
ADF countries
Table 10: Buy-Down mechanism - Resources available for remaining ADF countries
RMCs ADF-14
allocation
Estimated Amount borrowed from AfDB in
place of ADF
ADF Amount needed to compensate
Amount available for the remaining
ADF only countries
Blend and graduating
236 236 33 203
Green light 741 741 296 445
Total 977 977 329 648 (In UA million)
Notes: The estimated volume of ADF resources made available through this mechanism has been computed based on the application of the BDM to the ADF most advanced countries (i.e. graduating countries and blend countries) and ADF Green light countries. Countries classified as fragile will be excluded.
If the mechanism was applied to ADF green light countries, this category of countries should have access to a volume of concessional funds on regular/advanced terms. According to the revised Credit Policy, this category of countries would also have access to non-concessional funds from the AfDB provided access to the sovereign AfDB window is granted according to the appropriate Risk Assessment. In order to calculate the estimate, we have assumed that all green light RMCs would receive loans on regular terms.
The calculation of the total needed for compensation is derived from the difference in terms of present value (or the difference in grant elements) between the AfDB loans versus the equivalent loans with ADF terms. For consistency, this computation is based on computations of ADF loan concessionality made during ADF-13 in line with IDA methodology.
While the pricing parameters of AfDB loans are directly linked to the yield curve (swap curve) as well as the funding levels of the Bank in international capital markets (funding margin), the calculations are based on the following assumptions: 20 year loan and a 5 year grace period. While there is not a constant AfDB rate because the funding margin fluctuates semi-annually, and any rate communicated by the Bank also changes every 6 months, the indicative lending rate level used for the computation as of today is 2.85 %. Using those assumptions, a subsidy of around 14 % of the nominal loan is required to bring back the grant element to 35% for a blend loan.
That gap is indicated in the Table 11:
Table 11: BDM – level of compensation
Blend Regular AfDB
Grant element 35% 61% 21%
Difference 14% 40% 0%
For each UA 10 million granted by AfDB to a blend country/graduating country in place of the ADF, UA 1.4 million will be required as compensation (14%). For each UA 10 million granted by AfDB to a green light ADF country in place of the ADF, UA 4.0 million will be required as compensation (40%).

45
Annex 14: How does the BDM impact on the ACC
A growing number of countries that no longer require the ADF enables the resources to be used for the remaining ADF-only countries. This means also less repayments and a greater pressure on internally generated resources.
As the ACC is computed every three years, it is difficult to provide an estimate of the impact on a very long term. However, Table I2 below provides simulations under ADF-14. These simulations are indicative and are based on an ACC of UA 460 million. Based on several ADF compensation assumptions, three scenarios are presented. It should be noted that the main impact of the proposed scheme on the ACC will occur after five years (i.e.: after ADF-14), when repayments on loans to blend and graduating countries are expected to begin.
Depending on how the ADF compensation is paid, the BDM will result in a decrease of the ACC between UA 17 million and UA 374 million during ADF-14 if the mechanism is applied to blend, graduating and some ADF Green light countries. The big difference is whether the compensation is paid following the standard ADF profile (in which case the maximum is only UA 17 million) or according to a linear 3-year profile.
Table 12-Estimated impact on the ACC during ADF-14 (UA million)
ADF compensation
ADF-14 ACC Impact
Without the mechanism 0 460
Scenario 1: ADF Compensation paid following the standard ADF profile
Blend/graduating 33 459 -2
Blend/graduating and ADF green light 296 443 -17
Scenario 2: ADF Compensation paid following a linear 3-Year profile
Blend/graduating 33 436 -25
Blend/graduating and ADF green light 296 220 -240
Scenario 3: ADF Compensation paid at the signature (one-off payment)
Blend/graduating 33 425 -36
Blend/graduating and ADF green light 296 86 -374

46
Annex 15: How does the BDM impact on the AfDB risk exposure?
In terms of AfDB risk exposure, the potential impact of a BDM is mixed. The Bank’s Risk Adjusted Capital (RAC) ratio would increase because of the increased diversification of the AfDB portfolio. Similarly, the Bank’s Risk Capital Utilization Rate (RCUR) would also increase as exposure to countries using the Buy-Down Mechanism would increase. The Bank’s risk profile would remain strong if the RAC remained above the threshold of 15% and the RCUR below 100%. Overall, the BDM should not adversely affect the risk exposure of the Bank and would rather contribute to marginally improve the RAC.
Table 13: Impact of the Buy-Down Mechanism on Main Prudential Ratios
Additional exposure for AfDB (UA million)
Impact on RAC Impact on RCUR
Prudential ratios without the mechanism
0 17.1% 61.2%
Blend/graduating 236 +0.06 +0.3
Green light ADF countries (Fragile states excluded)
741 +0.19 +0.9
Combined 977 +0.24 +1.2

47
Annex 16: Amounts due during ADF-14 for grant compensation approved during
ADF-9, ADF-10 & ADF-11
Grant Compensation (UA million)
2017 2018 2019
ARGENTINA - - -
AUSTRIA 0.24 0.30 0.46
BELGIUM 0.26 0.33 0.47
BRAZIL 0.02 0.02 0.03
CANADA 0.75 0.93 1.29
CHINA 0.27 0.34 0.49
DENMARK 0.29 0.33 0.43
EGYPT - - -
FINLAND 0.25 0.31 0.47
FRANCE 1.43 1.80 2.58
GERMANY 1.20 1.46 2.19
INDIA 0.03 0.04 0.05
ITALY 0.68 0.84 1.21
JAPAN 1.23 1.50 2.02
KOREA 0.11 0.13 0.19
KUWAIT 0.03 0.03 0.05
LUXEMBOURG - - -
THE NETHERLANDS 0.63 0.79 1.16
NORWAY 0.59 0.73 1.05
PORTUGAL 0.10 0.12 0.18
SAUDI ARABIA 0.06 0.08 0.11
SOUTH AFRICA 0.02 0.02 0.04
SPAIN 0.37 0.46 0.67
SWEDEN 0.67 0.83 1.14
SWITZERLAND 0.45 0.55 0.74
TURKEY - - -
UNITED KINGDOM 1.14 1.44 2.40
USA 1.56 1.89 2.50
Total 12.36 15.28 21.91
Donors

48
Annex 17: How to implement the BDM
With the BDM, eligible RMCs would be able to use their AfDB headroom to borrow from the AfDB the equivalent of their Performance Based Allocation (PBA). Grant resources will then be made available as compensation for the interest differential between ADF and AfDB lending terms. As some countries which are on the graduation path would no longer utilize their ADF allocations, this would unlock resources for the remaining ADF countries.
The initial idea was that ADF compensates directly the AfDB. However, any structure selected will have to be consistent with the provisions of Article 31 of the ADF Agreement which provides that “the Fund shall be an entity legally separated and distinct from the Bank and the assets of the Fund shall be kept separate and apart from those of the Bank. Nothing in the Fund Agreement shall make the Fund liable for the acts or obligations of the Bank, or the Bank liable for the acts or obligations of the Fund”. On this basis, although the Fund can contribute to a Buy-Down mechanism, the Fund itself cannot be made liable in any way, either directly or indirectly, for any obligations due to the Bank resulting from the establishment of a Buy-Down mechanism.
The simplest option is therefore to set aside ADF resources for the mechanism. Eligible countries would have access to more resources because extra grants will be provided on top of the equivalent of the PBA provided by the Bank on AfDB terms. In order to mitigate the negative impact on the ACC, the extra grants should be allocated following the standard ADF conditions.
Another option would be to create a facility to provide extra grants as direct compensation to the eligible countries but this would involve transaction costs.
In both cases, third parties will be able to contribute to the mechanism.
In any case, the ADF’s operational policy would have to be revised to open up grant eligibility to countries on the path of graduation.
Figure 10: Implementation of a BDM including compensation provided through an ADF set aside

49
Figure 11: Implementation of a BDM including compensation provided by a facility
Phasing in the Mechanism
There is a provision in the Transition Framework for Countries Changing their Credit Status that offers positive incentives to graduating countries which would prefer increased and faster access to AfDB resources instead of ADF resources. In this case, countries can phase in AfDB resources on AfDB terms more quickly by foregoing ADF resources, at a ratio of two AfDB Units of Account (UA) for every foregone ADF UA. Strengthening the dialogue with potential eligible RMCs to encourage them to use this provision would also free up resources for more interventions in other ADF recipient countries. However, as the provision has not been used because the AfDB headroom is very large and potential candidates may prefer maintaining their access to concessional resources; the Buy-Down mechanism could be introduced on a gradual basis.

50
Annex 18: Potential combinations
Innovations Impact Conditions of feasibility
CDL + BL Highest option: All CDLs are provided by lenders with an interest rate between 0% and 0.5%; their maximum amount is UA 1.270 billion. The combined impact is UA 2.212 billion: the sum of estimated ADF-14 allocation for blend, gap and graduating countries (UA 0.458 billion) + ADF green light countries (UA 0.812 billion) + cumulated impact of CDLs and BLs on ACC of (about UA 0.942 billion). Lowest option: All CDLs are provided by lenders with an interest rate up to 1%; their maximum amount is UA 0.458 billion. The combined impact is UA 1.312 billion: the estimated ADF-14 allocation for blend, gap and graduating countries (UA 0.458 billion) + cumulated impact of CDLs and BLs on the ACC (UA 0.854 billion).
CDLs and BL can be run concurrently and their impacts summed. The CDL impact is maximized if donors lend at an interest rate of 0%. Many options between the highest option and the lowest one can be envisaged depending on the interest rate offered by the lenders. While CDLs would be part of the whole ADF pool of resources, the optimal amount is computed taking into account countries which could absorb such financing. If the CDLs are provided with an interest rate of up to 1%, they can theoretically be utilized to support countries which borrow at the same interest rate. If the CDLs are provided at a 0% interest rate, the CDLs can be easily absorbed by countries which borrow at 0%. To mitigate the risk related to the debt limit cut-off, a buffer could be set.
BDM + BL The BDM is applied to blend, graduating and ADF green light countries that are not fragile. The maximum potential impact is UA 1.459 billion: additional resources for the ADF remaining countries (UA 0.648 billion) + positive impact of BLs on the ACC (UA 828 billion) – negative impact of the BDM on the ACC of (about UA 0.017 billion). .
BDM and BL can be run concurrently and their impacts summed.
CDL+ BDM Highest option: All CDLs are provided by lenders with an interest rate at 0%. They generate up to a maximum of UA 1.129 billion: the estimated ADF-14 allocation for gap and ADF green light countries (UA 1,035 billion) + positive impact on ACC (about UA 0.094 billion). The BDM is applied to blend and graduating and its maximum potential impact is UA 0.201 billion: the additional resources for the ADF remaining countries (UA 0.203 billion) minus the (negative) impact on ACC of about UA 0.002 billion. The combined impact is 1.129 (CDLs) +
0.201 (BDM) = UA 1.330 billion
The two innovations cannot be combined if all ADF eligible countries are considered simultaneously for both instruments. The eligible countries have to be split between the two instruments. In this case the prudential ceiling of CDLs is limited to the equivalent of the ADF allocation available for gap countries. Green light countries might be added only if the CDLs are provided at 0%. The BDM will be applied to blend and graduating countries. ADF green light countries in a situation of fragility will be added if CDL are provided at 0%.
51
Lowest option: All CDLs are provided by lenders with an interest rate at up to 1%. Their maximum potential impact is UA 0.242 billion: the estimated ADF-14 allocation for gap countries (UA 0.222 billion) + positive impact on ACC (about UA 0,020 billion). The BDM is applied to blend, graduating and ADF green light countries not in fragile situation. Its maximum potential impact is UA 0.631 billion: the additional resources for the ADF remaining countries (UA 0.648 billion) minus the (negative) impact on ACC of about UA 0.017 billion. The combined impact is 0.242 (CDLs) +
0.631 (BDM) = UA 0.873 billion
The CDL impact is maximized if donors lend at an interest rate of 0%.
CDL+ BDM +BL
The BDM is applied to blend and graduating countries and its maximum potential impact is UA 0.203 billion (i.e.: sum of additional resources for the ADF remaining countries) In this case, it is assumed that all CDLs are provided by lenders at 0% interest rate and their maximum potential impact is UA 1.035,5 billion (ie: sum of estimated ADF-14 allocation for gap and ADF green light countries) The CDLs and BLs cumulated impact on ACC of about UA 0.942 billion + BDM negative impact on the ACC of about UA 0.002 billion. The combined impact is: 1.035 (CDLs) + 0.203 (BDM) + 0.942 (cumulated impact of CDLs and BLs on the ACC - 0.002 (BDM impact on the ACC = UA 2.177 billion
The CDL impact is maximized if donors lend at an interest rate of 0%. Based on these assumptions, the combination of the three options would not necessary generate the highest additional resources since CDLs have a higher potential impact when all ADF countries are included under CDLs. This is not the case when countries are split between CDLs and BDM.
The combinations between CDLs and BLs would have an impact on the ACC. Based on the expected
ACC level of UA460m for ADF-14, the potential impact on the ACC by combinations of BL and CDL
would be as follows (in UA million)
CDL BL ADF-14 ADF-15 ADF-16 ADF-17 ADF-18 Net Impact
458 500 545 545 (727) (49) (49) 265
1 270 500 663 662 (610) (198) (195) 323
458 1 000 854 853 (417) (551) (543) 196
1 270 1 000 942 942 (330) (753) (404) 397

52
The optimal combination would be a CDL of UA 1.270 billion (provided that donors agree on CDLs with
interest rates ranging between 0% and 0.5%) combined with a BL of UA 1 billion (with an interest rate of
0.5%).

53
Annex 19: Summary of the three options
CDL BL BDM
Strengths
More resources available for all the ADF-eligible countries. Positive impact on the ACC. Scales up donor contributions while preserving fiscal balance.
Significant immediate increase of the ADF ACC. Scales up donor contributions while preserving fiscal balance. Simple to implement. Benefits borrowing countries, the donor countries, and the ADF’s financial sustainability
More concessional resources for the ADF remaining countries. More resources for eligible countries that will forego their ADF allocations. No cost in the short term for ADF donors. Improvement in portfolio diversification.
Risks
Debt funding in the ADF could create financial risks. Potential grant/loan substitution risk.
Negative impact on ACC from ADF-16 onwards.
Introduction of complexity in the framework for assistance to countries. Negative impact on the ACC. Negative impact on the Grant Compensation Scheme.
Mitigations
A prudential debt limit will be set. A minimum ratio of grants to CDLs will be set.
When BLs are reimbursed (i.e. during ADF-16 cycle), the ACC will be at a much higher level.
Lower impact on ACC if grants allocated on ADF conditions. Lower impact on grant compensations scheme if extra grants are provided by a third party.

54
Annex 20: Comparative impact of CDL and BL
The table 14 shows the impact of a CDL of UA 100 million at an interest rate of 0.5% with a maturity of 40
years and a grace period of 10 years with a BL of UA 100 million provided at 0.5% with a maturity and a
grace period of 20 and 10 years respectively.
Table 14: Comparative impact of between CDL and BL
ADF-14 ADF-15 ADF-16 ADF-17 ADF-18
Total ADF-14 to ADF-18
ACC before any instrument 460 460 1,732 2,271 2,271 7,194
CDL (UA 100 million at 0.5% - 10/40)
ACC with CDL
497 500 1,487 2,379 2,384 7,247
Total Impact (Loan + ACC)
137 40 (245) 108 113 152
BL (UA 100 million at 0.5% - 10/20)
ACC with BL 561 566 1,483 2,330 2,330 7,270
Total impact (ACC)
101 106 (249) 59 59 76