Embed Size (px)
Citation preview

Intermediate Capital Group PLCAnnual report and accounts 2015
Innovative.Flexible.Trusted.

Raising money and investing it. It’s what we’ve done since 1989, giving us one of the
longest track records in our industry. for over 26 years
our success has been underpinned by one thing.
Trust.
Our investors trust us to design innovative products.
page 10
Businesses trust us to provide them with flexible funding.
page 12
We trust our local teams around the world to identify
high quality opportunities.page 14
our business partners trust us to deliver sustainable returns
over the long term.page 16

GOVERNANCE REPORT
FINANCIAL STATEMENTS
1
STRATEGIC REPORT
IN THIS REPORT
STRATEGIC REPORT
Chairman’s statement 2
An introduction from the Chief Executive 4
How we create value 6
How we allocate our capital 8
Our key resources and relationships 9
Why we are different 9
Case studies 10
Our markets 18
Strategic objectives 20
How we have performed 22
Chief Executive Officer’s review 24
Chief Financial Officer’s review 30
Managing risk to deliver our strategy 36
Our appetite for risk 37
Macroeconomic risks 38
Principal risks and uncertainties 41
Our resources and relationships 44
GOVERNANCE REPORT
Letter from the Chairman 48
Board of Directors 50
Our corporate governance framework 52
The Board’s year 54
Training and induction 56
Board evaluation 57
Engaging with stakeholders 58
Audit Committee report 59
Risk Committee report 68
Nominations Committee report 73
Remuneration Committee report 76
Compensation at a glance 79
Directors’ remuneration policy summary 80
Annual report on remuneration 88
Directors’ report 98
Directors’ responsibilities 105
Auditor’s report 106
FINANCIAL STATEMENTS
Consolidated income statement 112
Consolidated and Parent Company statements of comprehensive income 113
Consolidated and Parent Company statements of financial position 114
Consolidated and Parent Company statements of cash flow 115
Consolidated and Parent Company statements of changes in equity 116
Notes to the accounts 118
OTHER INFORMATION
Glossary 158
Shareholder and Company information 160

CHAIRMAN’S STATEMENTIt has been a record year for ICG, with assets under management at an all-time high due to continued fundraising success.
It has been a record year for ICG, with assets under management at an all-time high due to continued fundraising success. Our significant achievements during the year give the Board confidence in the health of the business and the delivery of its strategy. In July 2014, the Board committed to re-gearing the balance sheet to between 0.8x and 1.2x by July 2016 and, with the planned growth of the fund management business, increase return on equity to over 13%. We are on track to meet these objectives.
DELIVERING OUR STRATEGY
We have made significant progress in transforming the business from being predominantly a balance sheet investor to becoming a manager of third party funds supported by our balance sheet. This is a journey we began five years ago, and progress is well advanced. Successes in the last financial year have included:
– Record fundraising led by our European funds.
– Improved FMC operating margin with new strategies contributing to profit.
– All direct origination funds investing on target.
– Impairments back to historical levels after the financial crisis.
– Balance sheet strengthened with new and existing facilities extending maturity profile.
The business has grown over the years through geographical and product expansion. As a result the Group’s governance policies and processes continue to evolve to ensure they remain appropriate.
DIVIDEND AND CAPITAL RETURN
The growth in Fund Management Company profits, together with ICG’s strong balance sheet, positions the Group well to generate and realise shareholder value through supporting existing strategies, investing in new opportunities and returning capital to shareholders. Accordingly, the Board is recommending, in addition to the ordinary dividend, a capital return of a further £300m to shareholders. This follows the £100m share buyback that was completed in the year. It is proposed that the £300m capital return will be by way of a special dividend, with an associated share consolidation to maintain, as far as possible, the comparability of the share price before and after the special dividend. The special dividend and share consolidation will be subject to shareholder approval at the Annual General Meeting on 15 July 2015. The ex-dividend, record and payment dates for the special dividend and the share consolidation factor will be set out in the AGM circular for shareholders.
The Board recommends a final ordinary dividend of 15.1p, an increase of 4.9% on the prior year final ordinary dividend. The Board has decided to maintain the dividend reinvestment plan (DRIP). The dividend will be paid on 28 July 2015 to shareholders on the register on 12 June 2015.
The Board anticipates updating shareholders on the Group’s capital structure plans at the time of its 2016 year end results including, subject to market conditions and gearing levels, any potential further capital return.
JUSTIN DOWLEYCHAIRMAN
ICG ANNUAL REPORT & ACCOUNTS 2015

THE PAST YEAR HAS BEEN A VERY SUCCESSFUL ONE FOR ICG AND MARKS A YEAR OF SIGNIFICANT PROGRESS.
CHANGES TO THE BOARD
We are delighted that Kathryn Purves joined the Board as a Non-Executive Director on 17 October 2014. Kathryn is Chief Risk Officer of Partnership Assurance Group plc, a FTSE listed provider of non-standard annuities, and has extensive experience in the financial services sector. Simultaneously, Lindsey McMurray stepped down from the Board to focus on her other roles. We would like to thank Lindsey for her contribution to the Board and wish her well for the future.
This Strategy Report, on pages 2 to 46, has been approved by the Board of Directors and is signed on its behalf by:
Justin DowleyChairman
21 May 2015
2 / 3
STRATEGIC REPORT
GOVERNANCE REPORT
FINANCIAL STATEMENTS
ICG AT A GLANCE
Assets under management
€18bn+ Read more on page 24
20142001
AUM
26
Profit before tax
£178m
11
year track record
+ Read more on page 9
14investment strategies
+ Read more on page 25
Operating out of 11 countries
+ Read more on page 9
ordinary Dividend per share
22.0p+ Read more on page 2

AN INTRODUCTION FROM THE CHIEF EXECUTIVE
Since 2010 our business model has been to increase the scale, profitability and sustainability of our fund management business and transition towards an optimal use of our capital to support that of third party investors. This has been a landmark year in that transition with the delivery of record assets under management and record Fund Management Company profits. We remain confident that the success of our business model and the strategic direction of the Group will be further demonstrated in the coming year.
FUNDRAISING ACROSS STRATEGIES AND MARKETS
Our fundraising momentum continued throughout the financial year with a record €6.4bn raised across eleven strategies, embedding our product and geographic diversification. Our 26 year track record, combined with market demand for alternative asset classes, has resulted in large first closes on our European funds – European Mezzanine, Senior Debt Partners and UK Real Estate – raising a total of €3.1bn. Of the remaining €3.3bn, 74% is in respect of new strategies developed in the last two years, including our expansion into the US and Japanese markets. The fundraising momentum has continued into the new financial year with €1.2bn raised since the
balance sheet date, leaving us well placed to exceed our average through the cycle fundraising target of €4bn per annum. However, we recognise that the lead time for marketing new strategies is significantly longer than for established funds where we have built a strong track record, which is why we are leaving our average through the cycle fundraising target unchanged.
While our main focus is to bring our current strategies to profitable maturity, we will continue to grow the business by adding new complementary strategies to our product portfolio. One such strategy is private equity secondaries. In November 2014, we announced the hire of a dedicated team and the closure of our first secondaries transaction. We have since signed a second transaction and preparations have begun to launch a dedicated secondaries fund. During the year we also purchased the remaining 49% of our UK real estate business, ICG Longbow. ICG Longbow has grown assets under management from €0.2bn in 2011 when ICG first acquired 51% of the business to €2.7bn at 31 March 2015 – an excellent achievement.
Our continued investment in new products is delivering strong fundraising momentum, and providing a robust foundation from which to increase the long term profitability of our fund management business.
CHRISTOPHE EVAINCHIEF EXECUTIVE OFFICER
2invest selectively
1GROW ASSETS UNDER MANAGEMENT
3Manage portfolios to maximise value
ICG ANNUAL REPORT & ACCOUNTS 2015
NAVIGATING OUR STRATEGIC REPORT
BUSINESS MODEL
CASE STUDIES RISKSPERFORMANCE RESOURCES & RELATIONSHIPS
MARKETPLACE & STRATEGY

DEPLOYING CAPITAL WHILST MAINTAINING INVESTMENT DISCIPLINE
We are pleased to have maintained the investment pace across our investment funds and our access and insights continue to enable us to find attractive investment opportunities in an increasingly competitive environment. Of our assets under management, 77% charge fees on an invested capital basis, in line with the prior year. Therefore the deployment of this capital directly contributes to the profitability of our fund management business.
The performance of our investment portfolio is resilient. The number of underperforming assets within the portfolio continues to reduce. Asset specific net impairments of £37.6m in the year were significantly below prior periods, a trend we expect to continue. The results for the year were positively impacted by the sale of the remaining assets of our performing European Mezzanine Fund 2006 to a new secondary fund, thereby crystallising performance fees and returning capital to our investors.
FINANCIAL DISCIPLINE REMAINS OVERARCHING
We are committed to allocating capital to our strategies, including new products and selective team hires, which are expected to create long term value. To do this we need to maintain broad access to financing sources and debt markets, and ensure the Group can withstand periods of market stress.
We have a blend of diverse sources of financing with an appropriate mix of maturities, which is a cornerstone of having regular, consistent and stable access to financing. We have continued to diversify funding sources throughout the year, raising £189.4m, including a sterling bond issue, which met with strong demand and was highly successful, raising £160m.
Since the balance sheet date, a further £258m has been raised, principally from US private placements.
OUTLOOK
We are confident that our strong fundraising momentum will continue as we complete the fundraising for our European funds and consolidate our geographical expansion into the US and Japan by closing our funds in these geographies. We are also making progress in raising our Asia Pacific successor fund. Elsewhere, preparations are underway for the launch of a number of new strategies, including a secondaries fund, which will contribute incremental fee streams to the Group and increase the operating leverage of the Fund Management Company.
Our recent fundraising success has generated substantial capital to deploy across our investment strategies and we continue to see good investment opportunities across all our strategies and regions. We size our funds to the market opportunity and aim to deploy the capital in line with the required investment run rate. This is subject to finding investment opportunities with the appropriate risk/return balance, whilst maintaining a disciplined approach to investment in this highly competitive market.
In addition, we will continue to manage our investment portfolios actively, working with management and sponsors to support the delivery of their business plan. This is critical to maximising the exit value of the portfolio company. We will maximise returns in older funds by realising assets to crystallise value for the balance sheet and our fund investors. Whilst the timing is rarely in the Group’s control and therefore remains uncertain, we foresee the current pace of realisations continuing in the current year.
Overall, we are well placed to continue to deliver our strategic objectives and generate improving returns for our shareholders.
4 / 5
STRATEGIC REPORT
GOVERNANCE REPORT
FINANCIAL STATEMENTS

WE OFFER INVESTORS ALTERNATIVE SOURCES OF STABLE YIELD…
BUILDING PROFITABLE, LONG TERM GROWTH
We are a specialist asset manager of €18.0bn of assets in third party funds and proprietary capital. We provide finance for corporate investments, including private debt and minority equity; manage capital market investments of public and private debt; invest in real assets, principally real estate debt; and invest in private equity secondaries funds. We manage these assets using our large, experienced and specialist investment teams operating from our head office in London and our strong local network of overseas offices.
What we do is not unique, but the breadth and depth of our experience make us a specialist among asset managers, with an enviable track record of generating attractive returns for our investors. Our outstanding track record, built up over 26 years, means that we are trusted by our investors to meet their expectations by taking appropriate, considered risks when investing.
Our team combines institutional clients’ capital and our own shareholders’ funds across a range of products. Each product has a tailored investment strategy and specific returns expectations which are aligned to the risk of the investment strategy.
You can read more about the risks associated with how we create value on pages 36–43
EVOLUTION OF THE BUSINESS MODEL
Our business model is evolving to reflect the Group’s strategic shift towards becoming a third party asset manager, principally of closed end funds. Our FMC is the operating business of the Group, sourcing and managing investments on behalf of these third party funds and for the Investment Company (IC). Managing third party capital generates long term fee income when it is either committed or invested. The fee structure depends on the product and whether the product is in its investment or realisation phase. If funds exceed performance targets additional fees can be earned.
The IC uses our balance sheet funding to provide long term support to the FMC’s third party funds and generate investment income. We manage the IC’s resources to optimise the co-investment ratio to maximise total Group returns through management fees and investment income, and to launch and develop new funds. This facilitates the expansion of the Group’s product suite, in response to market opportunities, and grows the FMC.
Both the FMC and the IC are supported by a common infrastructure and marketing platform.
ASSOCIATED PRINCIPAL RISKS
– Failure to refinance debt as it falls due
– Failure of the Group to meet its debt covenants
ASSOCIATED PRINCIPAL RISKS
– Failure to raise third party funds
– Reputational damage due to a regulatory failing
– Failure to execute the Group’s strategic priorities due to unforeseen macroeconomic changes
ICG ANNUAL REPORT & ACCOUNTS 2015 BUSINESS MODEL
CASE STUDIES RISKSPERFORMANCE RESOURCES & RELATIONSHIPS
MARKETPLACE & STRATEGY
HOW WE CREATE VALUE
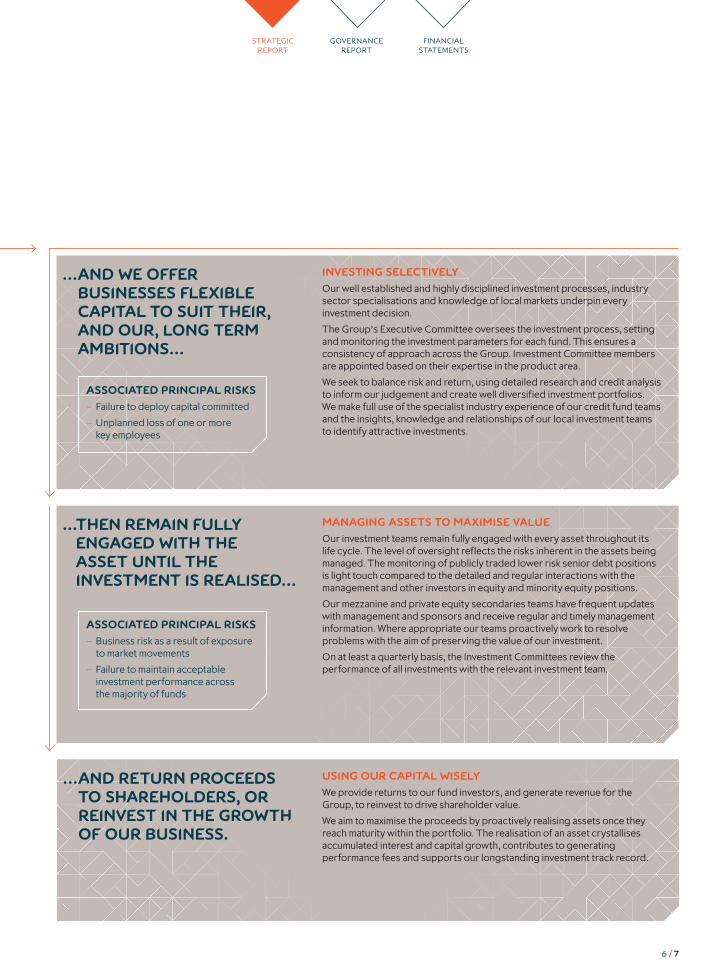
… AND WE OFFER BUSINESSES FLEXIBLE CAPITAL TO SUIT THEIR, AND OUR, LONG TERM AMBITIONS…
ASSOCIATED PRINCIPAL RISKS
– Failure to deploy capital committed
– Unplanned loss of one or more key employees
INVESTING SELECTIVELY
Our well established and highly disciplined investment processes, industry sector specialisations and knowledge of local markets underpin every investment decision.
The Group’s Executive Committee oversees the investment process, setting and monitoring the investment parameters for each fund. This ensures a consistency of approach across the Group. Investment Committee members are appointed based on their expertise in the product area.
We seek to balance risk and return, using detailed research and credit analysis to inform our judgement and create well diversified investment portfolios. We make full use of the specialist industry experience of our credit fund teams and the insights, knowledge and relationships of our local investment teams to identify attractive investments.
… THEN REMAIN FULLY ENGAGED WITH THE ASSET UNTIL THE INVESTMENT IS REALISED…
MANAGING ASSETS TO MAXIMISE VALUE
Our investment teams remain fully engaged with every asset throughout its life cycle. The level of oversight reflects the risks inherent in the assets being managed. The monitoring of publicly traded lower risk senior debt positions is light touch compared to the detailed and regular interactions with the management and other investors in equity and minority equity positions.
Our mezzanine and private equity secondaries teams have frequent updates with management and sponsors and receive regular and timely management information. Where appropriate our teams proactively work to resolve problems with the aim of preserving the value of our investment.
On at least a quarterly basis, the Investment Committees review the performance of all investments with the relevant investment team.
… AND RETURN PROCEEDS TO SHAREHOLDERS, OR REINVEST IN THE GROWTH OF OUR BUSINESS.
USING OUR CAPITAL WISELY
We provide returns to our fund investors, and generate revenue for the Group, to reinvest to drive shareholder value.
We aim to maximise the proceeds by proactively realising assets once they reach maturity within the portfolio. The realisation of an asset crystallises accumulated interest and capital growth, contributes to generating performance fees and supports our longstanding investment track record.
ASSOCIATED PRINCIPAL RISKS
– Business risk as a result of exposure to market movements
– Failure to maintain acceptable investment performance across the majority of funds
STRATEGIC REPORT
GOVERNANCE REPORT
FINANCIAL STATEMENTS
6 / 7

HOW WE ALLOCATE OUR CAPITAL
We are committed to financial discipline, both in terms of the quality of investment and strategic allocation of resources, as well as ensuring that an appropriate capital structure is maintained. Capital is allocated to strategies that are expected to create long term value.
INVESTING IN GROWTH
We allocate capital to grow the business in two ways. The Group co-invests with the higher return funds it manages, generating attractive investment income. For other strategies the Group will act as an anchor investor, providing capital to illustrate proof of concept and an initial track record to support fundraising. Once established, the Group’s investment in these strategies will be reduced appropriately.
SHAREHOLDER DISTRIBUTIONS
We seek to maximise shareholder value by utilising our available capital to prioritise investment in opportunities which over a number of years will add sustainable income streams to the business and optimise our return on equity.
We understand the value that shareholders place on regular and sustainable dividend payments and we remain committed to a dividend policy linked to cash core income. In addition, to the extent that we believe there is any material excess capital, we will return capital to our shareholders.
FUNDRAISING
6.4€bn
ADJUSTED RETURN ON EQUITY
11.0%
FMC OPERATING MARGIN
41%
SPECIAL DIVIDEND
300£m
OPERATING MODEL
INVESTING – Fund deployment – Fund performance and track record
– Impairment target of less than 2.5% of opening book
IC PROFITABILITY
– IC gross return on assets – Manage risk across all portfolios
Business growth
– Reinvest to drive return on equity
– Optimise co-investment ratio for each strategy
FUNDRAISING – Gross fundraising to average €4bn per annum
– Maintain fee level – Selective product expansion
FMC PROFITABILITY
– FMC operating margin – Manage risk across all portfolios
Shareholder returns
– Dividend – Return surplus cash
CAPITAL ALLOCATION
– Return on equity above 13% – Gearing 0.8 – 1.2x
INV
EST
ME
NT
IN N
EW
FU
ND
S
ICG ANNUAL REPORT & ACCOUNTS 2015 BUSINESS MODEL
CASE STUDIES RISKSPERFORMANCE RESOURCES & RELATIONSHIPS
MARKETPLACE & STRATEGY

You can read more about the key resources and relationships that enable our business model to function on page 44
WHY WE ARE DIFFERENT
AN ENVIABLE TRACK RECORD
The combination of our outstanding investment track record over 26 years, expanded product range and the support of a strong balance sheet are our significant differentiators when raising third party money.
Our client relationships, enhanced by the presence of our own distribution team, have continued to grow in breadth and depth, with recent fundraisings having a more geographically and institutionally diverse investor base. Our dedicated marketing and distribution team are enabling us to build stronger and broader relationships which support our strategic priority of growing assets under management.
A STRONG INVESTMENT CULTURE
Our consistent, efficient and robust investment culture across our products is based on disciplined investment processes, core credit principles and a strong focus on capital preservation.
Each investment opportunity is assessed on its own merits and in the context of the expected risk and return requirements of the fund. We particularly consider limiting the downside risk of the investment and the underlying focus is on generating cash returns through the life of the asset. Our investment strategy is underpinned by rigorous risk analysis.
We have local teams and sector specialists who speak the languages and understand the dynamics of the markets in which they operate. These investment teams have established our reputation as a trusted and experienced partner with innovative structuring skills. Our investments are tailored to provide a financing solution that fits the cash flows of the underlying asset to maximise value for our investors. Our local teams have built longstanding relationships with local sponsors, banks, advisers and management teams, providing deal flow and early access to investment opportunities.
AN ACTIVE APPROACH
Post investment monitoring is a key focus of both our investment teams and the Investment Committees. Our investment professionals and credit analysts are responsible for attending management meetings, reviewing management data and following industry trends.
We typically seek Board attendance rights from portfolio companies in our mezzanine funds, currently attending over 80% of the Boards of our portfolio companies. Board representation assists in effective portfolio management of illiquid assets as it provides access to management, additional insight into financial information and gives the opportunity to build and strengthen relationships with stakeholders.
These relationships have provided a significant number of both follow-on and new investment opportunities for our funds.
Close monitoring of investments enables us to identify risks within the portfolio at an early stage. Our investment professionals have experience in default situations and in the recovery of investments which we use to maximise our returns from these investments. Our investment and monitoring processes have supported our outstanding track record since inception, with our funds performing strongly against their peers.
A LONG TERM PERSPECTIVE
We support our investments over the long term. The availability of flexible capital, both from our balance sheet and the funds, supports sponsors and management in achieving profit and cash generation which enables us to achieve outstanding returns on realisation. This has been the basis of our long term success and enviable track record.
The realisation of our existing portfolio of investments not only generates cash returns for existing investors, but also acts as a source of investment opportunities for new funds. The speed and flexibility with which we are able to complete these transactions is enhanced by our relationships with management and deep understanding of the investment.
RESOURCES
– Investment management skills – Distribution capabilities – Scalable infrastructure
RELATIONSHIPS
– Third party investors – Key finance counterparties – Regulators – Deal sourcing networks – Company owners and management
STRATEGIC REPORT
GOVERNANCE REPORT
FINANCIAL STATEMENTS
8 / 9
OUR KEY RESOURCES AND RELATIONSHIPS

We are in the business of designing funds that address the investment opportunities we have identified in the market, for the benefit of our fund investors and shareholders. We can do this because we maintain an efficient, robust decision-making process, which gets things moving quickly. ICG’s continued success hinges on the skills of our people and remaining flexible and nimble.
ICG ANNUAL REPORT & ACCOUNTS 2015 BUSINESS MODEL
CASE STUDIES RISKSPERFORMANCE RESOURCES & RELATIONSHIPS
MARKETPLACE & STRATEGY

CASE STUDY: TARGETING MARKET OPPORTUNITIES
It is estimated that over $100bn of private equity assets are invested in funds past their typical holding period, and the manager has not raised a successor fund. Investors in these funds are unlikely to recover their remaining investments as the manager is no longer incentivised to maximise the return to their investors as the fund represents a source of fee income.
Our strategic secondaries business is an innovative strategy targeting this specific market opportunity by restructuring these funds. We do this by partnering with the incumbent manager to acquire the fund from the existing investors. A refreshed asset management strategy linked to reset incentives for the incumbent manager can deliver highly attractive returns to new investors in the portfolio.
Our approach is innovative for the well established private equity secondaries market and builds on our active management approach to investments and broad market and sector knowledge.
During the year, we hired a strategic secondaries team who brought direct private equity and fund restructuring skills to complement our existing know how. The Group’s ability to underwrite transactions in anticipation of a future fund is critical to demonstrating proof of concept and to provide comfort to potential investors that we are aligned with their interests.
We have completed one transaction and are preparing to launch a dedicated fund during the next financial year.
We offer
Strategies and funds
innovative
10 / 11
STRATEGIC REPORT
GOVERNANCE REPORT
FINANCIAL STATEMENTS

We pride ourselves on an ability to reach mutually beneficial funding agreements with the companies in which we invest. As these companies are unique, we are flexible about the form these arrangements take. This approach, combined with our ongoing involvement, means that we frequently benefit from follow on opportunities.
ICG ANNUAL REPORT & ACCOUNTS 2015 BUSINESS MODEL
CASE STUDIES RISKSPERFORMANCE RESOURCES & RELATIONSHIPS
MARKETPLACE & STRATEGY

CASE STUDY: TAILORED INVESTMENT SOLUTIONS
Our direct investment funds have the flexibility to deploy capital to suit the needs of the company in which we invest. This flexible investment strategy means that each deal has unique terms, as illustrated by two of the transactions completed during the year.
Perpetual Guardian Trust is a New Zealand based personal and corporate trust services business formed from the merger of two long established trust companies in 2014. Our fund’s investment
has been used to support the merger of these two businesses, allowing the acquiring company to repay a short term acquisition financing facility and fund the deferred consideration.
Groupe Charlois is a French manufacturer of oak barrels targeting global premium wine and spirit manufacturers. Our capital has been designed to allow management to maintain and increase their ownership in the family business after the minority shareholder sought to sell their holding.
We provide
flexiblecapital
12 / 13
STRATEGIC REPORT
GOVERNANCE REPORT
FINANCIAL STATEMENTS

We have been expanding geographically. In moving beyond Europe we have reduced our exposure to geographical risk and built shareholder value. Operating out of 11 countries, including the world’s largest economies, is a marker of our status as a global business.
ICG ANNUAL REPORT & ACCOUNTS 2015 BUSINESS MODEL
CASE STUDIES RISKSPERFORMANCE RESOURCES & RELATIONSHIPS
MARKETPLACE & STRATEGY

Our footprint is
expandingglobally
CASE STUDY: EXPANSION INTO NORTH AMERICA AND JAPAN
We have expanded our investment business into Japan, through our 50:50 partnership with Nomura, and into the US. The Group’s mezzanine strategies now cover the world’s largest economies with the launch of dedicated North America and Japanese mezzanine funds.
In Japan, the returns offered by investing in mezzanine assets in an economy with zero interest rates and an ageing population have proven attractive to Japanese investors. Furthermore, the demand for mezzanine debt from Japanese companies has been increasing in popularity in recent years as a means to finance acquisitions and corporate transactions.
Within a year of signing the joint venture agreement with Nomura a fund was structured, established and marketed and the team had closed two transactions.
During the financial year, the fund raised €60m of third party money from 18 institutions.
North America has the largest and most mature financial market with substantial opportunities to raise capital for new and existing strategies. In addition, there is an extensive market to deploy capital to mid market companies.
We have raised a total of €488m for our North American debt fund and raised three US CLOs, which are fully invested. In parallel our US investment team has completed three transactions in private debt, leveraging our 26 year track record.
This illustrates the Group’s ability to expand its geographical reach where suitable opportunities arise.
14 / 15
STRATEGIC REPORT
GOVERNANCE REPORT
FINANCIAL STATEMENTS

Since 1989, we have made it our business to develop products that enable us to capitalise on market opportunities. By offering the right products at the right time, and investing in the right companies, we have gained the trust of our business partners.
ICG ANNUAL REPORT & ACCOUNTS 2015 BUSINESS MODEL
CASE STUDIES RISKSPERFORMANCE RESOURCES & RELATIONSHIPS
MARKETPLACE & STRATEGY

CASE STUDY: SENIOR DEBT ORIGINATION
New investment strategies contribute incremental fee streams to the Group and with successor funds improve the operating leverage of the FMC.
In 2014 the Group completed its fundraising for a new strategy, Senior Debt Partners. This fund was established to provide investors with an opportunity to access the European senior secured loan market, a specialist private debt asset class. This fund is now substantially invested and is fee earning.
During the year a first close of the successor fund took place, with €1.3bn of capital raised. This capital will generate fees as it is invested, with little additional cost.
The Group saw the opportunity to expand the strategy into new geographies and asset classes as the banking landscape has changed. During the year we have broadened the senior debt strategy to the UK real estate asset class, raising segregated mandates from large UK pension funds as a precursor to a potential future fund.
The Group is also considering further geographical expansion of senior debt origination, potentially into the US and Asia.
We build
sustainableopportunities
16 / 17
STRATEGIC REPORT
GOVERNANCE REPORT
FINANCIAL STATEMENTS

Change in the global economic environment, particularly in the availability of investment capital, is the most significant market driver influencing the delivery of the Group’s strategic priorities. Market conditions which support the Group’s fundraising efforts to grow assets under management typically create a more competitive environment in which to invest selectively.
INVESTORS WANT TO DIVERSIFY AWAY FROM TRADITIONAL ASSET CLASSES. THIS IS AN OPPORTUNITY FOR US TO INCREASE MARKET SHARE.
FUNDRAISING MARKET
In the current economic environment, the alternative asset industry is benefiting from strong tailwinds as money continues to pour into higher return asset classes. Traditional asset classes, such as sovereign bonds, have suffered from a low interest rate environment and institutional investors are turning towards higher risk/return strategies in order to generate a better return on their assets. ICG operates in a rapidly growing component of the global asset management market which is benefiting from a disproportionate share of industry revenues.
Our belief is that this is a structural trend which will continue and as a result we are less likely to suffer from the commoditisation which the rest of the asset management business faces.
This increased volume of available capital is being targeted by a large number of funds seeking commitments, and competing for investors’ attention. The resulting selection process is competitive and preference is given to established managers with a strong track record, credibility and infrastructure. While the market is still fragmented because of a high degree of specialism and localism, it is inevitable that over time investors will seek to consolidate their relationships, favouring recognised leaders and brands.
We are extremely well positioned to take advantage of this fundraising backdrop. Our funds offer access to challenging, private and less liquid asset classes where our teams have consistently generated top quality returns and our breadth of strategies means that we can provide diverse investment solutions to investors. Increasing momentum in fundraising gives our brand more appeal, as evidenced by recent successes. In addition, it cements our relationship with investors and increases the potential for new product offerings.
INVESTMENT MARKET
Our expanded product range and geographical diversity mean there are significant differences between the regions, sectors and asset classes in which we operate. Each of our markets is influenced by macroeconomic events in different ways. However, there are some common features that provide a broad context to our markets.
The overriding trend is that the attractiveness of alternative asset classes is generating substantial inflows into our markets. This has been aided by the announcement by the European Central Bank that it will undertake quantitative easing and the expectation that interest rate rises in the US and elsewhere are still some way off. This has created an increased level of competition for assets and could over time reduce returns across different asset classes.
In this competitive market environment, our approach to origination, with local expert teams, offering flexible and innovative structuring skills and sector specialists comes to the fore. We are able to act quickly to perform the evaluation of complex opportunities as well as source deals ‘off market’ for our originated funds, while limiting pressure on terms. Coupled with our strong investment discipline, these are key differentiating factors to be able to generate safe yet attractive investment opportunities.
ICG ANNUAL REPORT & ACCOUNTS 2015 BUSINESS MODEL
CASE STUDIES RISKSPERFORMANCE RESOURCES & RELATIONSHIPS
MARKETPLACE & STRATEGY
OUR MARKETS

The main market we are targeting globally through different funds and strategies is the buyout and corporate investment market. The recovery of the IPO markets and an increase in the level of corporate M&A activity are providing private equity sponsors with exit routes for their mid-market portfolio companies, but it also reduces the number of potential investment opportunities. We have been able to generate attractive investment opportunities by targeting private companies directly and have had a record level of investment by our European funds while our Asian and US businesses have seen a good flow of opportunities.
A new market segment for us is the private equity secondaries segment where there is an estimated $100bn of private equity assets that are held in funds past their typical holding period, with little incentive for the incumbent manager to sell these assets in the M&A market. The existing secondaries market has evolved to enable new investors to access these assets thereby increasing the availability of investment opportunities. Our strategic secondaries strategy is designed specifically to address this opportunity, with a team that combines traditional private equity experience with a secondaries market approach, which when supplemented by our existing market knowledge is a quite unique combination which we believe will be successful.
The demand for new loans, driven by corporate refinancing and acquisitions, is supported by the issuance of new CLOs in Europe and the US. In 2014, CLO funds invested in 55% of new loans issued in the US institutional loan market and 46% of new loans issued in the European institutional loan market. In Europe, the number of CLO issuers has reduced following the introduction of requirements for CLO managers to put their own capital at risk in each vehicle. Similar regulations are due to come into force in the US from 2016 and are expected to have a similar effect on the number of managers who will be able to issue CLOs.
Whilst large companies have much easier access to capital markets, the situation is different for mid-market companies. As expected, we have not seen a meaningful increase in bank lending to mid-market corporates. This can be attributed to a lack of infrastructure following the withdrawal of many banks to their home markets during the financial crisis combined with the regulatory pressures have led to a conservative lending approach. We see this ongoing trend as structural and expect the banks’ appetite for private mid-market lending to remain subdued. This has contributed to the growth in alternative asset classes and in particular the emergence of European direct lending funds, including our own Senior Debt Partners strategy.
The UK commercial real estate market bears many of the characteristics of the wider European loan market, with substantial capital available for investment while banks remain minority players. As with our other investment strategies, competition for prime assets remains high. However, our deep knowledge of the market, industry relationships and flexible approach means we are able to originate attractive deals.
In summary, while the normalisation of financial markets and the added inflow of fresh capital, from which we are strongly benefiting, have led to a more competitive environment, we have confidence in the strength of our teams and their ability to generate attractive investment opportunities. This approach has proven highly successful in this past year.
18 / 19
STRATEGIC REPORT
GOVERNANCE REPORT
FINANCIAL STATEMENTS
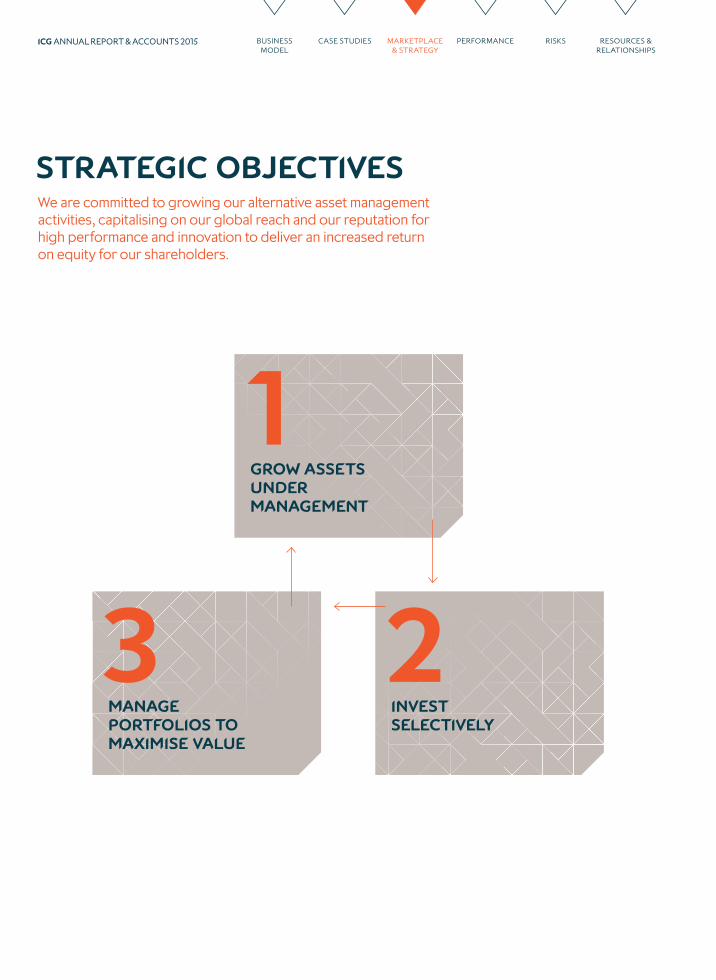
We are committed to growing our alternative asset management activities, capitalising on our global reach and our reputation for high performance and innovation to deliver an increased return on equity for our shareholders.
1GROW ASSETS UNDER MANAGEMENT
3Manage portfolios to maximise value
2invest selectively
ICG ANNUAL REPORT & ACCOUNTS 2015 BUSINESS MODEL
CASE STUDIES RISKSPERFORMANCE RESOURCES & RELATIONSHIPS
MARKETPLACE & STRATEGY
STRATEGIC OBJECTIVES

GROW ASSETS UNDER MANAGEMENT
We aim to increase our third party assets under management to maximise the profitability of the business by:
– Consolidating and broadening our existing strategies.
– Expanding our client base and existing products geographically.
– Expanding our product range through selective acquisitions and team hires.
We will capitalise on our strong track record, in house distribution team and ability to develop new investment strategies through utilising our balance sheet strength.
INVEST SELECTIVELY
We aim to invest our assets under management on a selective basis to maximise risk adjusted returns.
We will utilise:
– The sector specialisations of our credit teams.
– Our local network of originators.
– A disciplined approach to considering each investment opportunity.
MANAGE PORTFOLIOS TO MAXIMISE VALUE
We aim to manage our portfolio to maximise returns on invested capital. By doing so we build on our strong track record and generate capital to invest in new products.
We will do this by:
– Reviewing the performance of each investment at least quarterly.
– Engaging regularly with management and sponsors.
– Proactively working out problems where appropriate.
PRIORITIES FOR FY16
The Group expects its strong fundraising momentum to continue thereby delivering on its fundraising target through:
– Completing fundraising for the European funds – Senior Debt Partners, UK Real Estate and European Mezzanine.
– Consolidate geographical expansion into the US and Japan by closing their first time debt funds.
– Raising funds for new strategies, including the Strategic Secondaries fund and Alternative Credit.
The first time funds will contribute incremental fee streams to the Group and increase the operating leverage of the FMC.
PRIORITIES FOR FY16
The Group has substantial third party capital to deploy on its investment strategies.
We aim to deploy the capital raised in line with the required investment run rate, subject to finding investment opportunities with the appropriate risk/return balance.
The Group will maintain its disciplined approach to investment in a highly competitive market.
PRIORITIES FOR FY16
We will continue to actively manage our investment portfolios and proactively work with management and sponsors on working out problems.
For our sponsorless transactions in our mezzanine funds and secondaries investment strategy we will actively engage with management to support the delivery of their business plan as this is critical to maximising the exit value of the company.
The Group aims to maximise returns in older funds by realising assets to crystallise value for the balance sheet and our fund investors. The timing remains uncertain as it is rarely in the Group’s control.
ASSOCIATED PRINCIPAL RISKS
– Failure to raise third party funds – Failure to refinance debt as it falls due – Reputational damage due to a regulatory failing
– Failure of the Group to meet its debt covenants
ASSOCIATED PRINCIPAL RISKS
– Failure to execute the Group’s strategic priorities due to unforeseen macroeconomic changes
– Business risk as a result of exposure to market movements
– Failure to maintain acceptable relative investment performance across the majority of funds
ASSOCIATED PRINCIPAL RISKS
– Failure to execute the Group’s strategic priorities due to unforeseen macroeconomic changes
– Failure to deploy capital committed – Unplanned loss of one or more key employees
1 2 3
You can read more about the risks associated with how we create value on pages 36–43
20 / 21
STRATEGIC REPORT
GOVERNANCE REPORT
FINANCIAL STATEMENTS
HOW WE HAVE PERFORMED
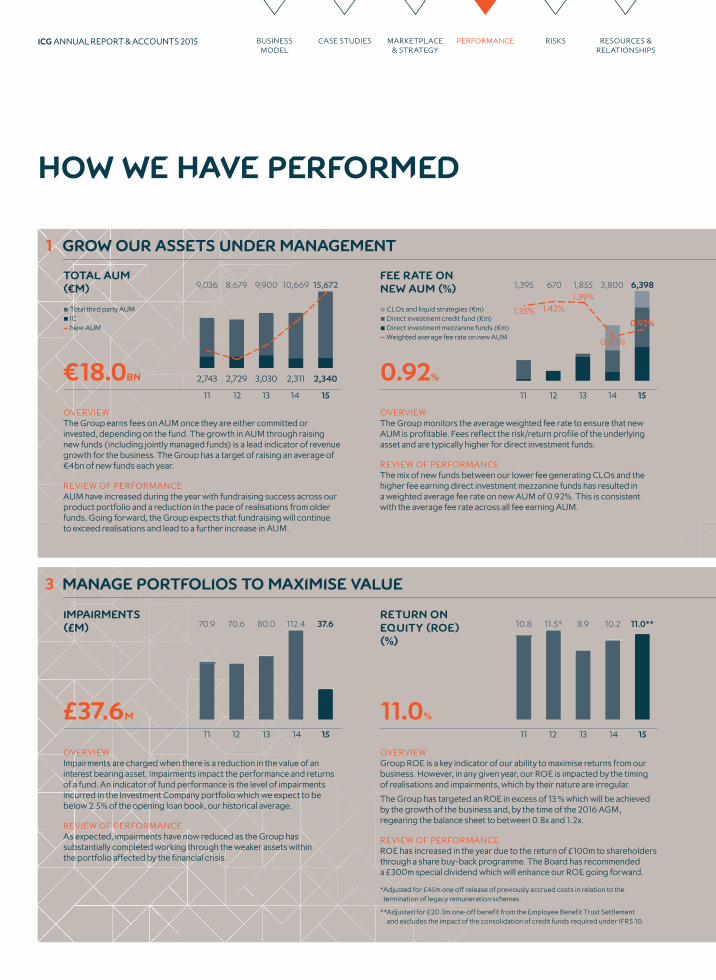
1 GROW OUR ASSETS UNDER MANAGEMENT
3 MANAGE PORTFOLIOS TO MAXIMISE VALUE
€18.0BN 2,340
15
2,311
14
3,030
13
2,729
12
2,743
15,67210,6699,9008,6799,036
11
total aum(€m)
Total third party AUMICNew AUM
£37.6M
1514131211
impairments(£m) 37.6112.480.070.670.9
fee rate onnew aum (%)
0.92%
6,398
15
3,800
14
1,855
13
670
12
1,395
11
CLOs and liquid strategies (€m)Direct investment credit fund (€m)Direct investment mezzanine funds (€m)Weighted average fee rate on new AUM
0.92%
0.80%
1.39%1.42%1.35%
11.0%
1514131211
return on equity (ROE)(%)
11.0**10.28.911.5*10.8
OVERVIEWThe Group earns fees on AUM once they are either committed or invested, depending on the fund. The growth in AUM through raising new funds (including jointly managed funds) is a lead indicator of revenue growth for the business. The Group has a target of raising an average of €4bn of new funds each year.
REVIEW OF PERFORMANCEAUM have increased during the year with fundraising success across our product portfolio and a reduction in the pace of realisations from older funds. Going forward, the Group expects that fundraising will continue to exceed realisations and lead to a further increase in AUM.
OVERVIEWThe Group monitors the average weighted fee rate to ensure that new AUM is profitable. Fees reflect the risk/return profile of the underlying asset and are typically higher for direct investment funds.
REVIEW OF PERFORMANCEThe mix of new funds between our lower fee generating CLOs and the higher fee earning direct investment mezzanine funds has resulted in a weighted average fee rate on new AUM of 0.92%. This is consistent with the average fee rate across all fee earning AUM.
OVERVIEWImpairments are charged when there is a reduction in the value of an interest bearing asset. Impairments impact the performance and returns of a fund. An indicator of fund performance is the level of impairments incurred in the Investment Company portfolio which we expect to be below 2.5% of the opening loan book, our historical average.
REVIEW OF PERFORMANCEAs expected, impairments have now reduced as the Group has substantially completed working through the weaker assets within the portfolio affected by the financial crisis.
OVERVIEWGroup ROE is a key indicator of our ability to maximise returns from our business. However, in any given year, our ROE is impacted by the timing of realisations and impairments, which by their nature are irregular.
The Group has targeted an ROE in excess of 13 % which will be achieved by the growth of the business and, by the time of the 2016 AGM, regearing the balance sheet to between 0.8x and 1.2x.
REVIEW OF PERFORMANCEROE has increased in the year due to the return of £100m to shareholders through a share buy-back programme. The Board has recommended a £300m special dividend which will enhance our ROE going forward.
* Adjusted for £45m one off release of previously accrued costs in relation to the termination of legacy remuneration schemes.
** Adjusted for £20.3m one-off benefit from the Employee Benefit Trust Settlement and excludes the impact of the consolidation of credit funds required under IFRS 10.
ICG ANNUAL REPORT & ACCOUNTS 2015 BUSINESS MODEL
CASE STUDIES RISKSPERFORMANCE RESOURCES & RELATIONSHIPS
MARKETPLACE & STRATEGY

We have identified a number of key performance indicators (KPIs), which, taken together, measure the progress we have made in meeting our strategic objectives.
1 GROW OUR ASSETS UNDER MANAGEMENT 2 INVEST SELECTIVELY
3 MANAGE PORTFOLIOS TO MAXIMISE VALUE
40.8%
1514131211
FMC operatingMargin (%) 40.835.140.141.343.9
22.0P
1514131211
ORDINARYdividend per share (P)
22.021.020.019.018.0
OVERVIEWThe operating margin of the FMC is a measure of the efficiency and scalability of the business. The Group has invested substantially in its growth and the return on this investment is measured through the operating margin. The Group is targeting a margin above 40%.
REVIEW OF PERFORMANCEThe incremental fee streams generated by the new strategies, combined with performance fees from the older mezzanine funds have resulted in an increase in FMC operating margin during the year.
OVERVIEWA measure of investing selectively is the investment performance of our funds. However, as a specialist asset manager, reliable comparable data is not readily available. For the funds where we originate assets the best indicator of the quality of our investment decisions is the underlying EBITDA performance of our portfolio companies.
REVIEW OF PERFORMANCEThe Group expects at least 60% of the portfolio companies in its mezzanine direct investment funds to report results above the prior year. The performance in the current financial year has been supported by the improving economic environment.
*Companies generating EBITDA at or above prior year levels.
OVERVIEWThe Group’s ability to pay dividends and return value to shareholders is a measure of the Group’s ability to generate returns from our Investment Company portfolio and managing third party funds.
Further details of the economic model of the business are provided on page 6.
REVIEW OF PERFORMANCEThe Group has a dividend policy linked to cash core income and over the last five years has generated sufficient returns from the business to grow the ordinary dividend year on year and return excess capital to shareholders.
73.4%
1514131211
Performance of InvestmentS*(%)
73.466.761.064.673.2
22 / 23
STRATEGIC REPORT
GOVERNANCE REPORT
FINANCIAL STATEMENTS

1. GROW ASSETS UNDER MANAGEMENT
A key measure of the success of our strategy to generate shareholder value from our fund management business is our ability to grow assets under management. With 99% of our AUM in closed end funds, our best lead indicator of sustainable future fee streams and therefore increasing profits is new AUM (inflows).
At €6.4bn, we have had a record breaking fundraising year, raising third party money across eleven products and in multiple geographies. The alignment of the fundraising cycles of our European funds – European Mezzanine, Senior Debt Partners and UK Real Estate – has contributed 48% of the total money raised in the year. We expect FY16 to be another strong fundraising year, as our European funds complete their fundraising, but continue to target raising an average of €4bn of new money per annum over the fundraising cycle.
We are delighted that we have begun to raise significant levels of third party money for our newer strategies, thus generating fee income to repay the investment we have made in those strategies. Most notably our US business has raised three CLOs and a private debt fund since the beginning of calendar year 2014, and is currently managing €1.4bn of third party money.
The pace of realisations has, as expected, slowed during the second half of the financial year to more normal levels after a period of high realisations. The income and capital return generated from these realisations has provided cash for the Group to reinvest in developing its product range and, in doing so, enhancing the fund management business.
In the twelve month period to 31 March 2015, AUM increased 39% to €18.0bn as fundraising inflows more than offset the outflows from realisations. Third party funds have increased 47% to €15.7bn, with the balance sheet portfolio up 1% to €2.3bn.
CHRISTOPHE EVAINCHIEF EXECUTIVE OFFICER
2invest selectively
1GROW ASSETS UNDER MANAGEMENT
3Manage portfolios to maximise value
ICG ANNUAL REPORT & ACCOUNTS 2015 BUSINESS MODEL
CASE STUDIES RISKSPERFORMANCE RESOURCES & RELATIONSHIPS
MARKETPLACE & STRATEGY
CHIEF EXECUTIVE OFFICER’S REVIEWWe continue to make significant progress in creating shareholder value by delivering on our strategic objectives.
MEZZANINE FUNDS
Third party mezzanine funds under management have increased by 47% to €5.4bn, with new AUM of €2.2bn outstripping the realisation of assets in the older European Funds.
The speed of fundraising for ICG Europe Fund VI and our domestic Japanese mezzanine fund (within our 50:50 partnership with Nomura), has exceeded our expectations demonstrating the strength of our product offering. ICG Europe Fund VI had a first close in late March 2015 of €1.8bn, including €500m from the balance sheet, with a further €0.6bn closed since the balance sheet date. This fund is included within fee earning AUM, as it will charge fees on a committed capital basis from April 2015 following the completion of the final deal for ICG Europe Fund V.
In Japan, we structured, established, marketed and had a first close of our fund within a year of signing a partnership agreement with Nomura. By the end of the 2015 financial year, the fund had raised €60m (¥8.8bn) of third party money from 18 institutions. Elsewhere in Asia, fundraising for our third Asia Pacific fund has been slower than expected with a first close expected shortly. We anticipate further closes will follow with the momentum created by this first close.
As outlined above, our US business has had a successful fundraising year, with a total of €488m ($642m), including $200m from ICG, raised for the US Private Debt Fund. With further closes expected in the new financial year, this is proving to be a successful first time fundraise in a brand new market.
CREDIT FUNDS
Third party credit funds under management have increased 32% to €7.6bn, with the new AUM of €2.9bn raised in the period outstripping the run off of our older European CLO funds.
Senior Debt Partners, our direct lending strategy, began the year by raising a further €0.4bn of AUM thereby completing fundraising for the first vintage of the strategy at €1.8bn. The successful deployment of that capital has enabled us to fundraise for Senior Debt Partners II. The combination of a strong track record and investor demand for European direct lending products has resulted in a rapid fundraise. A substantial first close of €1.3bn took place during the financial year, with a further €0.6bn closed since the year end.
Our CLO programme continues to raise new third party money and contribute to the increased profitability of our fund management business. We closed one European CLO during the financial year raising €361m, which included an €18m investment from our balance sheet. In the US we raised two CLOs totalling €628m ($828m) including $43m committed from the balance sheet. We expect to raise further European and US CLOs during FY16.
Elsewhere, we have also signed two small third party European loan mandates which have the potential to increase in size over the coming year.
REAL ESTATE FUNDS
Third party real estate funds under management have increased 112% in the period to €2.7bn with the continued diversification of our UK commercial real estate offering. Our real estate fund, ICG Longbow Fund IV, had a first close of €500m (£364m) during the year, including £50m committed from the balance sheet, with further closes expected during FY16. This product has continued to develop and, like other mezzanine funds, is now able to provide flexible capital across the capital structure.
In addition, five segregated mandates totalling €627m (£500m) were added to the real estate senior debt strategy, taking the total amount of money raised for the strategy to £650m. We have also signed a €260m (£202m) mandate to invest in UK real estate development.
24 / 25
STRATEGIC REPORT
GOVERNANCE REPORT
FINANCIAL STATEMENTS

2. INVEST SELECTIVELY
The investment environment is competitive, which brings to the fore our competitive advantage of having local teams and sector specialists to source and execute transactions. This, combined with the flexibility of our capital, means we are delighted to have been able to maintain the pace of investment across our direct investment funds, whilst retaining our investment discipline. Our priority is to remain extremely selective in making investment decisions and maintain our core credit principles in a more competitive investment market.
The total amount of third party capital deployed on behalf of the direct investment funds was £2.1bn in the year, a 40% increase on the last financial year. This is in part a reflection of recent fundraising achievements and the resulting availability of significant capital to deploy. In addition, our Investment Company invested a total of £360m in the year, compared to £394m
in the prior year. The investment rate for our Senior Debt Partners strategy, our Real Estate funds and our US Private Debt Fund has a direct impact on FMC income as fees are charged on an invested capital basis. Fee earning AUM has increased 39% to €12.3bn at the year end.
The direct investment funds are investing at the expected pace. ICG Europe Fund V is now fully invested after completing five deals during the year, and one further deal following the balance sheet date. We have also completed our first deal for ICG Europe Fund VI. Our ICG Longbow Real Estate Fund III is also fully invested after completing 14 deals in the year and Senior Debt Partners I is 87% committed having completed 12 deals.
Elsewhere, we completed two deals in Japan and three deals in North America, taking those funds to 30% and 21% invested, respectively. In Asia Pacific we completed one deal during the year, with one further deal completed since the balance sheet date.
Our top ten individual investments made during the period across the direct investment funds are:
Company Fund Industry Country £m*
Minimax ICG Europe Fund V Electronics Germany 232.9
Education Personnel ICG Europe Fund V Employment agency UK 159.0
JAC Group SDP I Entertaining and leisure UK 114.1
TGIF SDP I Retail UK 104.8
Adelie SDP I Retail UK 86.1
Empire Portfolio Longbow Senior Debt Real estate UK 65.0
Domus ICG Europe Fund V Healthcare France 63.7
Pall Mall Estates Longbow Fund III Real estate UK 63.3
Kingsway Hall Hotel Longbow Senior Debt Real estate UK 62.4
Staci ICG Europe Fund V Business services France 58.7
Total 1,010.0
*Total amount invested on behalf of the fund and our balance sheet
2invest selectively
1GROW ASSETS UNDER MANAGEMENT
3Manage portfolios to maximise value
ICG ANNUAL REPORT & ACCOUNTS 2015 BUSINESS MODEL
CASE STUDIES RISKSPERFORMANCE RESOURCES & RELATIONSHIPS
MARKETPLACE & STRATEGY
CHIEF EXECUTIVE OFFICER’S REVIEWCONTINUED

3. MANAGE PORTFOLIOS TO MAXIMISE VALUE
The availability of finance in the market over the last two years has enabled an unprecedented number of companies to refinance their existing debt facilities and for sponsors to exit their investments. Of the top 20 assets at 1 April 2013, 17 have been fully or partially repaid. This high proportion is in part due to the abnormally low levels of realisations in the period immediately prior to this. During the financial year we realised £609m of cash for our Investment Company with, as expected, a slowdown in the pace of realisations in the second half of the financial year.
Our portfolios are some of the best performing of their respective vintages, generating excellent returns for our fund investors and reinforcing our strong track record. This reputation for delivering value was cemented during the year with European Mezzanine Fund 2006 selling its remaining assets to a new secondary fund which is managed by the Group. This crystallised a 1.6x money multiple for the fund and performance fees of £21.6m for our fund management company. For a fund raised immediately before the financial crisis, a return in excess of its targeted 1.5x is an outstanding achievement and on a par with the best performing private equity funds of the same vintage.
The performance of the Investment Company’s mezzanine portfolio is resilient. By number, 73% of our portfolio companies (76% on a weighted average value basis) are recording EBITDA above or at the same level as the previous year. A number of our portfolio companies are benefiting from the positive macroeconomic news emanating from Europe, favourable foreign exchange rates and lower energy costs. The improved performance of our portfolio companies together with a strong stock market at 31 March 2015, has led to high levels of unrealised capital gains in the financial year. The number of weaker companies within the portfolio, which continue to underperform and currently show no signs of recovery, has substantially reduced as we have gradually worked through those assets within the portfolio that were most severely impacted by the financial crisis.
During the year we took asset specific impairments against our weaker assets of £53.5m compared to £133.6m in the prior financial year. After write backs of £15.9m during the year, net impairments were £37.6m compared to £112.4m in the prior year. Aggregate net impairments are anticipated to remain in line with our target of 2.5% of the opening Investment Company portfolio. However, to the extent that they are required, impairments are likely to remain unpredictable as we continue to monitor our weaker assets closely.
2invest selectively
1GROW ASSETS UNDER MANAGEMENT
3Manage portfolios to maximise value
26 / 27
STRATEGIC REPORT
GOVERNANCE REPORT
FINANCIAL STATEMENTS

FUNDRAISING
INVESTOR DIVERSITY
The Group is seeking to establish and build relationships with fund investors across a broad range of asset classes. This year the distribution team has been particularly successful in building relationships with pension funds and insurance companies as banks withdraw from the market.
GEOGRAPHIC DIVERSITY
With staff based across Europe, Asia, America and the Middle East, our distribution team is able to reach more investors across the globe. The Group is seeking a geographically diverse investor base.
FUNDS OVERVIEW
DIRECT MEZZANINE AND EQUITY FUNDS
FUND Third party money Estimated money multiple % carry*
MEZZANINE FUND 2003 €1,420m 1.6x 25% of 20 over 8
EUROPEAN FUND 2006B €1,024m – 20% of 5 over 8
EUROPE FUND V €2,006m 1.6x 20% of 20 over 8
RECOVERY FUND 2008 €840m 1.5x 20% of 20 over 8
MINORITY PARTNERS 2008 €120m 1.9x 20% of 20 over 8
INTERMEDIATE CAPITAL ASIA PACIFIC 2005 $300m 1.6x 25% of 20 over 8
INTERMEDIATE CAPITAL ASIA PACIFIC 2008 $562m 1.6x 20% of 20 over 8
NORTH AMERICAN PRIVATE DEBT FUND $442m – 20% of 20 over 8
NOMURA ICG FUND A** �8,750m 1.3x 20% of 20 over 4
STRATEGIC SECONDARIES CARBON FUND $149m 1.9x 20% of 12.5 over 8
ICG EUROPE VI €1,309m 1.6x 20% of 20 over 8
INTERMEDIATE CAPITAL ASIA PACIFIC III $72m 1.7x 20% of 20 over 7
* Total carry is a fixed percentage of the fund gains. For example, in Mezzanine Fund 2003 the carry is 20% of gains and the Group is entitled to 25% of this. Carry is triggered when fund returns exceed a hurdle, for Mezzanine Fund 2003 this is 8%.
**ICG’s 50% share of third party funds.
1 Pension 26%2 Fund of Funds 19%3 Insurance Company 18%4 Asset Manager 10%5 Bank 10%6 Sovereign Wealth Fund 6%7 Other 11%
1 Pension 31%2 Fund of Funds 9%3 Insurance Company 19%4 Asset Manager 8%5 Bank 12%6 Sovereign Wealth Fund 5%7 Other 16%
1
2
3
4
2012
1
2
3
4
5
6
7
2012
1
23
4
2015
1
2
34
5
6
7
2015
1 EMEA 51%2 Americas 20%3 UK and Ireland 16%4 Asia Pacific 13%
1 EMEA 38%2 Americas 21%3 UK and Ireland 21%4 Asia Pacific 20%
ICG ANNUAL REPORT & ACCOUNTS 2015 BUSINESS MODEL
CASE STUDIES RISKSPERFORMANCE RESOURCES & RELATIONSHIPS
MARKETPLACE & STRATEGY
CHIEF EXECUTIVE OFFICER’S REVIEWCONTINUED
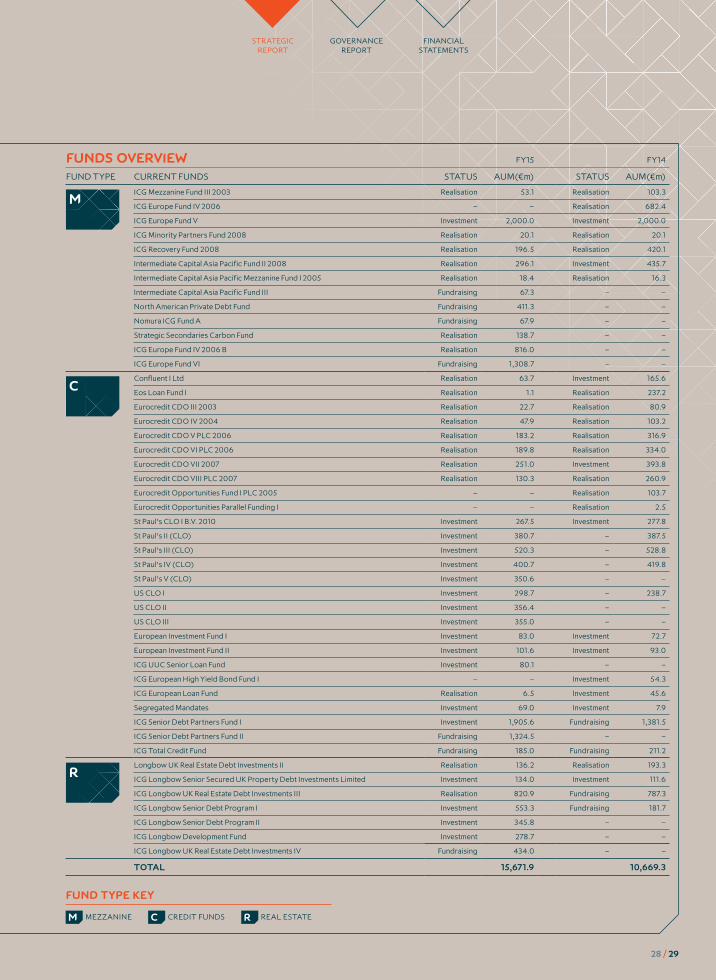
FUNDS OVERVIEW FY15 FY14
FUND TYPE CURRENT FUNDS STATUS AUM(€m) STATUS AUM(€m)
ICG Mezzanine Fund III 2003 Realisation 53.1 Realisation 103.3
ICG Europe Fund IV 2006 – – Realisation 682.4
ICG Europe Fund V Investment 2,000.0 Investment 2,000.0
ICG Minority Partners Fund 2008 Realisation 20.1 Realisation 20.1
ICG Recovery Fund 2008 Realisation 196.5 Realisation 420.1
Intermediate Capital Asia Pacific Fund II 2008 Realisation 296.1 Investment 435.7
Intermediate Capital Asia Pacific Mezzanine Fund I 2005 Realisation 18.4 Realisation 16.3
Intermediate Capital Asia Pacific Fund III Fundraising 67.3 – –
North American Private Debt Fund Fundraising 411.3 – –
Nomura ICG Fund A Fundraising 67.9 – –
Strategic Secondaries Carbon Fund Realisation 138.7 – –
ICG Europe Fund IV 2006 B Realisation 816.0 – –
ICG Europe Fund VI Fundraising 1,308.7 – –
Confluent I Ltd Realisation 63.7 Investment 165.6
Eos Loan Fund I Realisation 1.1 Realisation 237.2
Eurocredit CDO III 2003 Realisation 22.7 Realisation 80.9
Eurocredit CDO IV 2004 Realisation 47.9 Realisation 103.2
Eurocredit CDO V PLC 2006 Realisation 183.2 Realisation 316.9
Eurocredit CDO VI PLC 2006 Realisation 189.8 Realisation 334.0
Eurocredit CDO VII 2007 Realisation 251.0 Investment 393.8
Eurocredit CDO VIII PLC 2007 Realisation 130.3 Realisation 260.9
Eurocredit Opportunities Fund I PLC 2005 – – Realisation 103.7
Eurocredit Opportunities Parallel Funding I – – Realisation 2.5
St Paul’s CLO I B.V. 2010 Investment 267.5 Investment 277.8
St Paul’s II (CLO) Investment 380.7 – 387.5
St Paul’s III (CLO) Investment 520.3 – 528.8
St Paul’s IV (CLO) Investment 400.7 – 419.8
St Paul’s V (CLO) Investment 350.6 – –
US CLO I Investment 298.7 – 238.7
US CLO II Investment 356.4 – –
US CLO III Investment 355.0 – –
European Investment Fund I Investment 83.0 Investment 72.7
European Investment Fund II Investment 101.6 Investment 93.0
ICG UUC Senior Loan Fund Investment 80.1 – –
ICG European High Yield Bond Fund I – – Investment 54.3
ICG European Loan Fund Realisation 6.5 Investment 45.6
Segregated Mandates Investment 69.0 Investment 7.9
ICG Senior Debt Partners Fund I Investment 1,905.6 Fundraising 1,381.5
ICG Senior Debt Partners Fund II Fundraising 1,324.5 – –
ICG Total Credit Fund Fundraising 185.0 Fundraising 211.2
Longbow UK Real Estate Debt Investments II Realisation 136.2 Realisation 193.3
ICG Longbow Senior Secured UK Property Debt Investments Limited Investment 134.0 Investment 111.6
ICG Longbow UK Real Estate Debt Investments III Realisation 820.9 Fundraising 787.3
ICG Longbow Senior Debt Program I Investment 553.3 Fundraising 181.7
ICG Longbow Senior Debt Program II Investment 345.8 – –
ICG Longbow Development Fund Investment 278.7 – –
ICG Longbow UK Real Estate Debt Investments IV Fundraising 434.0 – –
TOTAL 15,671.9 10,669.3
M
C
R
FUND TYPE KEY
M MEZZANINE C CREDIT FUNDS R REAL ESTATE
28 / 29
STRATEGIC REPORT
GOVERNANCE REPORT
FINANCIAL STATEMENTS

A reconciliation between the internally reported management information and the financial statements is shown below with more detail in note 7 on page 138.
2015Internally reported
£m
2015 Consolidate
structured entities and
joint venture£m
2015 EBT
settlement£m
2015 Financial
statements£m
2014 Internally reported
£m
2014 Consolidate
structured entities and
joint venture£m
2014 Restated financial
statements£m
Income statement
Revenue, net of interest expense 339.8 21.3 – 361.1 373.2 18.0 391.2
Profit before tax 177.0 19.4 (17.9) 178.5 158.7 5.7 164.4
Statement of financial position
Total assets 2,335.1 1,464.1 – 3,799.2 2,240.9 1,048.8 3,289.7
Total equity and liabilities 2,335.1 1,464.1 – 3,799.2 2,240.9 1,048.8 3,289.7
As announced in March, the Group settled a claim for taxes in respect of an EBT during the year which resulted in costs of £17.9m and the receipt of a tax credit of £38.2m. This was recognised in the year giving a net increase in profit after tax of £20.3m.
The information in this review is presented on an internally reported basis and excludes the impact of these adjustments.
OVERVIEW
The Group’s profit before tax for the year was up 12% at £177.0m (2014: £158.7m). We continue to make operational progress in developing our fund management franchise, with new strategies contributing to profit. The record FMC profits in the year include a higher level of performance fee income. IC profits were in line with prior year as lower interest income and capital gains from lower realisations were offset by significantly lower impairments.
Internally reported – Unadjusted Internally reported – Adjusted
31 March 2015 £m
31 March 2014£m
31 March 2015£m
31 March 2014£m
Fund Management Company 52.0 35.1 52.0 35.1
Investment Company 125.0 123.6 132.1 140.0
Profit before tax 177.0 158.7 184.1 175.1
Tax (26.1) (21.5) (26.1) (21.5)
Profit after tax 150.9 137.2 158.0 153.6
STATUTORY PROFIT BEFORE TAX
178.5£M
ICG ANNUAL REPORT & ACCOUNTS 2015 BUSINESS MODEL
CASE STUDIES RISKSPERFORMANCE RESOURCES & RELATIONSHIPS
MARKETPLACE & STRATEGY
CHIEF FINANCIAL OFFICER’S REVIEWThe financial statements include the impact of the Employee Benefit Trust (EBT) settlement and those credit funds and CLOs required to be consolidated under IFRS 10. Internally reported information excludes these items.
PHILIP KELLERCHIEF FINANCIAL OFFICER
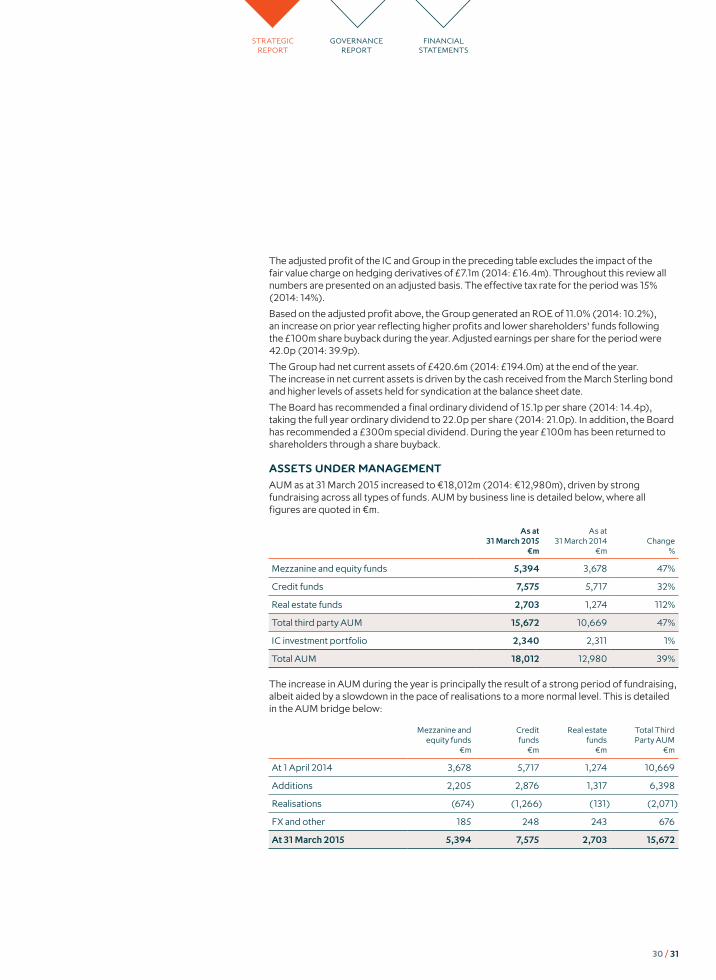
The adjusted profit of the IC and Group in the preceding table excludes the impact of the fair value charge on hedging derivatives of £7.1m (2014: £16.4m). Throughout this review all numbers are presented on an adjusted basis. The effective tax rate for the period was 15% (2014: 14%).
Based on the adjusted profit above, the Group generated an ROE of 11.0% (2014: 10.2%), an increase on prior year reflecting higher profits and lower shareholders’ funds following the £100m share buyback during the year. Adjusted earnings per share for the period were 42.0p (2014: 39.9p).
The Group had net current assets of £420.6m (2014: £194.0m) at the end of the year. The increase in net current assets is driven by the cash received from the March Sterling bond and higher levels of assets held for syndication at the balance sheet date.
The Board has recommended a final ordinary dividend of 15.1p per share (2014: 14.4p), taking the full year ordinary dividend to 22.0p per share (2014: 21.0p). In addition, the Board has recommended a £300m special dividend. During the year £100m has been returned to shareholders through a share buyback.
ASSETS UNDER MANAGEMENT
AUM as at 31 March 2015 increased to €18,012m (2014: €12,980m), driven by strong fundraising across all types of funds. AUM by business line is detailed below, where all figures are quoted in €m.
As at 31 March 2015
€m
As at 31 March 2014
€mChange
%
Mezzanine and equity funds 5,394 3,678 47%
Credit funds 7,575 5,717 32%
Real estate funds 2,703 1,274 112%
Total third party AUM 15,672 10,669 47%
IC investment portfolio 2,340 2,311 1%
Total AUM 18,012 12,980 39%
The increase in AUM during the year is principally the result of a strong period of fundraising, albeit aided by a slowdown in the pace of realisations to a more normal level. This is detailed in the AUM bridge below:
Mezzanine and equity funds
€m
Credit funds
€m
Real estatefunds
€m
Total Third Party AUM
€m
At 1 April 2014 3,678 5,717 1,274 10,669
Additions 2,205 2,876 1,317 6,398
Realisations (674) (1,266) (131) (2,071)
FX and other 185 248 243 676
At 31 March 2015 5,394 7,575 2,703 15,672
30 / 31
STRATEGIC REPORT
GOVERNANCE REPORT
FINANCIAL STATEMENTS

The €6.4bn of new AUM includes €3.1bn in respect of our European funds, thereby extending the fee streams of those established strategies, and €2.5bn relating to strategies developed in the last two years. The new strategies have introduced new long term revenue streams to the business. Furthermore, given that a strategy will typically reach profitable maturity on its third fund, the fee stream growth from our new strategies will become more visible into the medium term. Fees on these new strategies are typically charged on invested capital so fee income ramps up as the fund is invested, as can be seen in the fee earning AUM bridge below:
Mezzanine and equity funds
€m
Credit funds
€m
Real estatefunds
€m
Total Third Party Fee
Earning AUM€m
At 1 April 2014 3,477 4,747 588 8,812
Additions 1,930 1,879 1,091 4,900
Realisations (468) (1,339) (70) (1,877)
FX and other 125 160 157 442
At 31 March 2015 5,064 5,447 1,766 12,277
PROFIT AND LOSS ACCOUNT
FUND MANAGEMENT COMPANY
FEE INCOMEThird party fee income increased 21% in the year to £95.8m (2014: £79.0m), and total fee income increased by 15% in the period to £114.5m (2014: £99.7m), both benefiting from an increase in performance fees. Excluding mezzanine fund performance fees, third party income increased 6% to £69.2m (2014: £65.1m) in the year. Details of movements are shown below:
31 March 2015 £m
31 March 2014£m
Change%
Mezzanine and equity funds 62.2 53.6 16%
Credit funds 22.9 19.0 21%
Real estate funds 10.7 6.4 67%
Total third party funds 95.8 79.0 21%
IC management fee 18.7 20.7 (10)%
Total fee income 114.5 99.7 15%
Mezzanine and equity third party fees include £26.6m of performance fees (2014: £13.9m) earned as the realisation of assets from older vintages helped trigger the performance hurdles, primarily in respect of European Mezzanine Fund 2006. Although an integral part of the fee income profile and profitability stream of the Group, the quantum of performance fees in any particular year is unpredictable. The raising of ICG Europe Fund VI will benefit third party fees as it charges fees on committed capital from April 2015, following the closure of the final investment in ICG Europe Fund V, and has been included within fee earning AUM at the end of the year.
THIRD PARTY FEE INCOME
95.8£M
ICG ANNUAL REPORT & ACCOUNTS 2015 BUSINESS MODEL
CASE STUDIES RISKSPERFORMANCE RESOURCES & RELATIONSHIPS
MARKETPLACE & STRATEGY
CHIEF FINANCIAL OFFICER’S REVIEWCONTINUED

Credit funds third party fee income increased 21% with fees from new funds partially offset by the decrease in fees on older credit funds that are in their realisation phase. The increase in fees is due to the ongoing European and US CLO programme. In addition, fee income on Senior Debt Partners continues to rise as the money raised through the original and successor funds is invested.
Fees for our real estate and credit products are typically charged on an invested basis, although this has little impact for the CLOs which are invested quickly. The 67% increase in Real estate third party fee income reflects the investment of money raised for ICG Longbow Fund III and senior debt mandates. This trend is expected to continue with the raising and investing of ICG Longbow Fund IV.
The weighted average fee rate, excluding performance fees, across our fee earning AUM is 0.91% (2014: 0.86%).
OPERATING EXPENSESOperating expenses of the FMC were £75.3m (2014: £65.5m), including salaries and incentive scheme costs. Salaries were £27.4m (2014: £23.5m) as average FMC headcount increased from 160 to 190. This increase is directly related to investing in the growth areas of the business namely Real Estate and the US teams. Incentive scheme costs have increased to £19.0m (2014: £13.6m) reflecting the higher awards made in May 2014, which are being expensed to the income statement over their vesting period. Other administrative costs of £28.9m (2014: £28.4m) increased more slowly by 2%.
INVESTMENT COMPANY
BALANCE SHEET INVESTMENTSThe balance sheet investment portfolio decreased 11% in the period to £1,691m at 31 March 2015, as the realisation of older assets was partially offset by new investments. The impact of the realisations is illustrated in the investment portfolio bridge below:
£m
At 1 April 2014 1,908
New and follow on investments 360
Accrued interest income 119
Realisations (609)
Impairments (38)
Fair value gains 85
FX and other (134)
At 31 March 2015 1,691
Realisations comprise the return of £471.8m of principal, the crystallisation of £93.8m of rolled up interest and £43.2m of realised capital gains.
In the period £209.1m was co-invested alongside our mezzanine funds for new and follow on investments. In addition, £150.7m was invested across our CLOs and credit funds. The investment in our credit funds is lower risk as the funds are principally investing in senior debt assets.
The sterling value of the portfolio decreased by £131.2m due to foreign exchange movements. The portfolio is 57% Euro denominated and 15% US dollar denominated. Sterling denominated assets account only for 16% of the portfolio. The Group minimises foreign exchange impact of non sterling assets through non sterling liabilities and derivative transactions.
BALANCE SHEET INVESTMENT PORTFOLIO
1,691£M
32 / 33
STRATEGIC REPORT
GOVERNANCE REPORT
FINANCIAL STATEMENTS

An analysis of the portfolio by instrument is outlined below:
As at 31 March 2015
£m%
of total
As at31 March 2014*
£m%
of total
Senior mezzanine and senior debt 433 26% 755 40%
Junior mezzanine 169 10% 128 7%
Interest bearing equity 164 10% 253 13%
Non interest bearing equity 414 24% 375 20%
Co-investment portfolio 1,180 70% 1,511 80%
Investment in credit and equity funds 288 17% 208 11%
Investment in CLOs 134 8% 124 6%
Investment in real estate funds 89 5% 65 3%
Total balance sheet portfolio 1,691 100% 1,908 100%
*Figures at 31 March 2014 have been restated to present ICG Europe Fund V on the basis of its underlying assets.
In addition to the balance sheet portfolio, there were £243.9m (2014: £115.8m) of current assets being held on the balance sheet at 31 March 2015 that will be transferred to third party funds once their fundraising is complete. The use of the balance sheet in this way enables our investment teams to continue to source attractive deals whilst a fund is being raised, and in turn facilitates the fundraising as potential investors can see the types of assets they will be investing in.
NET INTEREST INCOME Net interest income of £118.8m (2014: £149.0m) comprised interest income of £158.6m (2014: £194.0m), less interest expense of £39.8m (2014: £45.0m). Interest income was below the prior period due to a decrease in the average IC portfolio. Cash interest income represented 30% (2014: 31%) of the total. The Group utilised the cash generated from realisations over the last two years to reduce its average borrowings leading to a reduction in interest expense. Average borrowings and interest expense will increase as the Group re-gears its balance sheet.
DIVIDEND INCOME Dividend income of £3.4m (2014: £19.7m) was lower than the prior year due to two equity investments making one-off distributions in the prior year following a refinancing of their debt.
OPERATING EXPENSESOperating expenses of the IC amounted to £49.9m (2014: £36.6m), of which incentive scheme costs of £30.5m (2014: £22.6m) were the largest component. Other staff and administrative costs were £19.4m compared to £14.0m last year, a £5.4m increase. Of these costs, £5.2m (2014: £2.6m) related to the cost of business development, including the establishment of Alternative Credit and Australian Senior Loans teams.
The management fee on IC investments managed by the FMC reduced to £18.7m (2014: £20.7m) as a result of the reduction in the average size of the loan book.
CAPITAL GAINSNet realised capital gains in the year were £46.7m (2014: £140.8m), of which £21.9m (2014: £18.7m) had previously been recognised as unrealised gains in the P&L with the remaining £24.8m (2014: £122.1m) recognised in the current year. The prior year included the realisation of the Group’s largest equity asset, Allflex.
NET REALISED CAPITAL GAINS
46.7£M
ICG ANNUAL REPORT & ACCOUNTS 2015 BUSINESS MODEL
CASE STUDIES RISKSPERFORMANCE RESOURCES & RELATIONSHIPS
MARKETPLACE & STRATEGY
CHIEF FINANCIAL OFFICER’S REVIEWCONTINUED

Fair valuing the equity and warrants gave rise to a further £84.7m (2014: £17.6m) of unrealised gains in the current year reflecting the improved performance of our portfolio companies and a strong stock market at 31 March 2015. Of this, £86.8m (2014: £12.0m) is recognised in the income statement and £(2.1)m (2014: £5.6m) as a movement in reserves.
IMPAIRMENTSNet impairments for the year were, as expected, lower than the prior year at £37.6m (2014: £112.4m). Gross impairments amounted to £53.5m (2014: £133.6m) and recoveries were £15.9m (2014: £21.2m) in the year.
GROUP CASH FLOW, DEBT AND CAPITAL POSITION
CASH FLOWOperating cash inflow for the year was £150.1m (2014: £683.9m), reflecting that our operating model is highly cash generative. The decrease in the cash inflows is largely as a result of the prior year seeing a record level of repayment activity, as analysed below:
31 March 2015£m
Restated 31 March 2014
£m
Cash in from realisations 505.6 903.0
Cash in from dividends 35.1 25.2
Cash in from fees 94.4 80.2
Cash in from cash interest 124.8 277.2
Total cash receipts 759.9 1,285.6
Cash interest paid (33.8) (37.8)
Cash paid to purchase loans and investments (359.8) (393.5)
Cash movement in assets held in warehouse or for syndication (126.4) (81.4)
Operating expenses paid (89.8) (89.0)
Total cash paid (609.8) (601.7)
Total cash generated from operating activities 150.1 683.9
The lower balance sheet portfolio has impacted the amount of cash interest received. Interest paid was 11% lower, in line with lower average borrowings.
Cash generated from operating activities in the period was in part returned to shareholders through the share buyback programme and acquiring shares, resulting in total debt of £707m compared to £587m at 31 March 2014.
CAPITAL POSITIONShareholders’ funds decreased by 4% to £1,456.4m (2014: £1,509.4m) in the year, due to the £100m share buyback and dividends paid during the year. Total debt to shareholders’ funds (gearing) as at 31 March 2015 increased to 0.49x from 0.39x. Adjusted return on equity of 11.0% is up 0.8% from 31 March 2014.
ICG’s strong balance sheet positions the Group to generate and realise shareholder value through co-investing into our existing and new funds, investing in new opportunities and returning capital to shareholders. Accordingly, the Board has recommended that, subject to shareholder approval, £300m of capital is returned to shareholders by means of a special dividend, with an associated share consolidation. On a pro-forma basis, assuming the proposed special dividend had been paid during the year, shareholders’ funds as at 31 March 2015 would have reduced to £1,156.4m, increasing gearing to 0.72x.
Further growth in the profitability of the business and the Group’s ongoing initiatives to re-gear the balance sheet are expected to result in a further increase in return on equity over the coming year.
TOTAL CASH GENERATED FROM OPERATING ACTIVITIES
150.1£M
The Group has continued to actively manage its sources of financing, extending debt facilities and lowering pricing where possible. The balance sheet remains strong, with £758.4m of available cash and debt facilities at 31 March 2015. The movement in the Group’s unutilised cash and debt facilities during the period is detailed below:
£m
Headroom at 31 March 2014 678.3
Bank facilities matured (86.5)
Secured floating rate notes matured (86.8)
Increase in drawn bank facilities 16.5
New medium term notes (including a £160m Sterling bond) 172.9
Movement in cash 168.8
Movement in drawn debt (119.7)
Other (including FX) 14.9
Headroom at 31 March 2015 758.4
Since the year end, the Group has further diversified and extended the maturity of its funding sources. The Group’s bank facilities that matured in FY17 have been extended for an additional two years. In addition, the Group has established a further £258m equivalent of private placements with maturities of between five and 10 years. This reinforces the strength of the Group’s balance sheet which continues to support the ongoing development of the business.
34 / 35
STRATEGIC REPORT
GOVERNANCE REPORT
FINANCIAL STATEMENTS

VIABILITY STATEMENT
– The Directors confirm that they have a reasonable expectation that the Group will continue to operate and meets its liabilities, as they fall due, for the next three years. The Directors’ assessment has been made with reference to the Group’s current position and prospects, the Group’s strategy, the Board’s risk appetite and the Group’s principal risks and how these are managed, as detailed in the Strategic Report.
– The strategy and associated principal risks underpin the Group’s three year plan and scenario testing, which the Directors review at least annually. The three year plan is built on a fund by fund basis using a bottom up model. The three year plan makes certain assumptions about the launch and investment of successor funds and new strategies, the ability to refinance debt as it falls due and the acceptable performance of the underlying
portfolio. The plan is stress tested in a robust downside scenario as part of the Board’s review of the Group’s Internal Capital Adequacy Assessment Process (ICAAP). The stress test uses the 2008/09 financial crisis as its basis, thereby reflecting the principal risks of the business, primarily through reducing new funds raised, lowering the deployment of capital and increasing impairments.
– The three year plan review is underpinned by the regular Board briefings provided by the business unit heads and the discussion of any new strategies undertaken by the Board in its normal course of business. These reviews consider both the market opportunity and the associated risks, principally the ability to raise third party funds and invest capital. These risks are considered within the Board’s risk appetite framework.
OUR APPROACH
Risk management is the responsibility of the Board and is integral to the ability of the Group to deliver on its strategic priorities. The Board establishes the culture of effective risk management throughout the business by identifying and monitoring the material risks, setting risk appetite and determining the risk tolerances of the Group.
The Board is responsible for establishing and maintaining appropriate systems and controls to manage risk within the Group and to ensure compliance with regulation.
The Group’s risk management systems are regularly monitored by the Risk Committee under delegation from the Board. The Risk Committee is responsible for overseeing the effectiveness of the internal control environment of the Group. Details of the activities of the Risk Committee in this financial
year can be found in the Risk Committee report on page 68. An internal audit function was established during the year to provide independent assurance that the Group’s risk management, governance and internal control processes are operating effectively. Further details of the activities of internal audit can be found in the Audit Committee and Risk Committee reports on pages 59 and 68.
IDENTIFYING AND MONITORING MATERIAL RISKS
Material risks are identified through a detailed analysis of individual processes and procedures (bottom up approach) and a consideration of the strategy and operating environment of the Group (top down approach).
The bottom up review encompasses the identification, management and monitoring
of risks in each area of the business and ensures risk management controls are embedded in the business’ operations. The Risk Committee monitors these processes, reviewing the Risk Register and reporting material risks to the Board. In identifying risks, consideration is also given to risks identified by other asset managers in the sector and regulatory expectations. The materiality and severity of each risk is assessed through a combination of each risk’s likelihood of an adverse outcome and its impact. In assessing impact, consideration is given to financial, reputational and regulatory factors, the impact on management resources and risk mitigation plans established.
The top down review, led by the Risk Committee, evaluates the material risks of the Group with reference to its strategy and the operating environment.
The Group considers its material risks are as follows:
BUSINESS RISK (INCLUDING CREDIT RISK)
The risk of loss resulting from the failure to meet the business’s strategic priorities.
MACROECONOMIC RISK
The financial risk of loss arising as a result of economic uncertainty, macroeconomic or political factors.
LIQUIDITY RISK
The risk of loss resulting from an inability to meet financial commitments as they fall due.
OPERATIONAL RISK
The risk of loss resulting from inadequate or failed internal processes, people and systems, or from external events.
ICG ANNUAL REPORT & ACCOUNTS 2015 BUSINESS MODEL
CASE STUDIES RISKSPERFORMANCE RESOURCES & RELATIONSHIPS
MARKETPLACE & STRATEGY
MANAGING RISK TO DELIVER OUR STRATEGYEffective risk management is critical to enable us to deliver our strategic priorities.
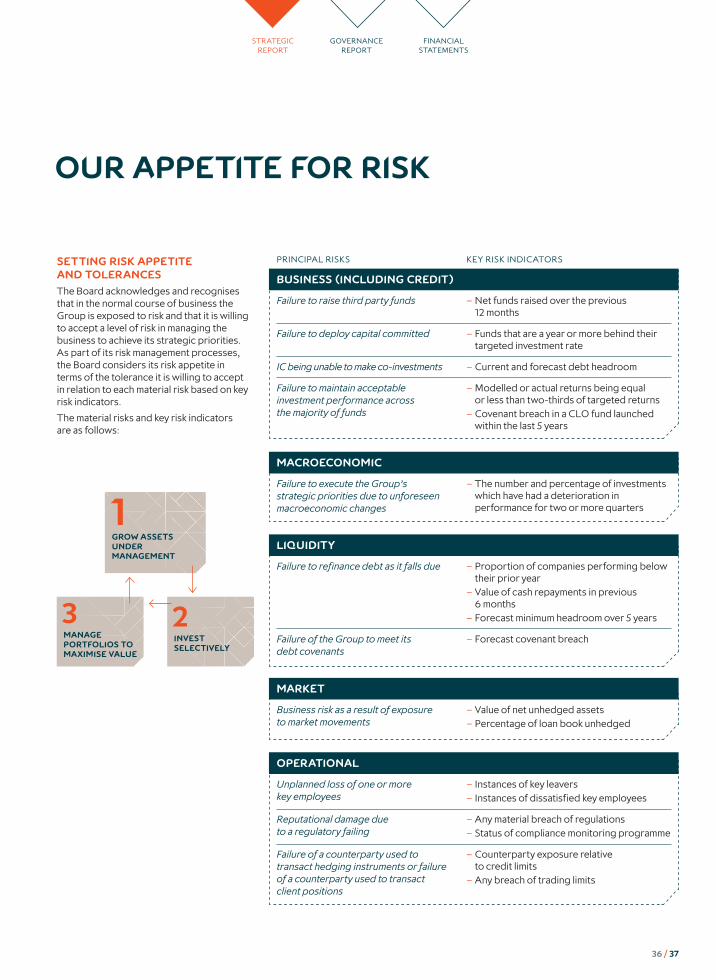
OUR APPETITE FOR RISK
SETTING RISK APPETITE AND TOLERANCES
The Board acknowledges and recognises that in the normal course of business the Group is exposed to risk and that it is willing to accept a level of risk in managing the business to achieve its strategic priorities. As part of its risk management processes, the Board considers its risk appetite in terms of the tolerance it is willing to accept in relation to each material risk based on key risk indicators.
The material risks and key risk indicators are as follows:
PRINCIPAL RISKS KEY RISK INDICATORS
BUSINESS (INCLUDING CREDIT)
Failure to raise third party funds – Net funds raised over the previous 12 months
Failure to deploy capital committed – Funds that are a year or more behind their targeted investment rate
IC being unable to make co-investments – Current and forecast debt headroom
Failure to maintain acceptable investment performance across the majority of funds
– Modelled or actual returns being equal or less than two-thirds of targeted returns
– Covenant breach in a CLO fund launched within the last 5 years
MACROECONOMIC
Failure to execute the Group’s strategic priorities due to unforeseen macroeconomic changes
– The number and percentage of investments which have had a deterioration in performance for two or more quarters
LIQUIDITY
Failure to refinance debt as it falls due – Proportion of companies performing below their prior year
– Value of cash repayments in previous 6 months
– Forecast minimum headroom over 5 years
Failure of the Group to meet its debt covenants
– Forecast covenant breach
MARKET
Business risk as a result of exposure to market movements
– Value of net unhedged assets – Percentage of loan book unhedged
OPERATIONAL
Unplanned loss of one or more key employees
– Instances of key leavers – Instances of dissatisfied key employees
Reputational damage due to a regulatory failing
– Any material breach of regulations – Status of compliance monitoring programme
Failure of a counterparty used to transact hedging instruments or failure of a counterparty used to transact client positions
– Counterparty exposure relative to credit limits
– Any breach of trading limits
1GROW ASSETS UNDER MANAGEMENT
2invest selectively
3Manage portfolios to maximise value
36 / 37
STRATEGIC REPORT
GOVERNANCE REPORT
FINANCIAL STATEMENTS

MACROECONOMIC RISKSOUR FUNDS AND PORTFOLIO
Our diversified balance sheet portfolio across developed markets enables us to mitigate the impact of any sector or country specific macroeconomic risk. The diversification of the Investment Company portfolio outlined on these pages excludes the investment in funds which are themselves diversified.
22Our deals span 22 geographies
PORTFOLIO BY SECTOR
1415
13
18
12
11
10
9 8
7
6 5 4
3
2
1
16
17
1 Business Services 11.0%2 Investment in Funds 23.0%3 Financial Services 9.8%4 Healthcare 5.6%5 Manufacturing & Engineering 1.4%6 Packaging 3.1%7 Publishing & Advertising 0.2%8 Utilities & Waste Management 2.5%9 Telecoms, Media & Technology 7.9%10 Retail 6.6%11 Food & Consumer Products 6.1%12 Entertainment & Leisure 4.9%13 Transport 4.7%14 Construction Materials 5.6%15 Automotive 0.7%16 Pharmaceuticals & Chemicals 0.6%17 Portfolio 0.5%18 Real Estate 5.8%
9.3%
north America
ICG ANNUAL REPORT & ACCOUNTS 2015 BUSINESS MODEL
CASE STUDIES PERFORMANCE RESOURCES & RELATIONSHIPS
MARKETPLACE & STRATEGY

8.7%Germany
1.9%Spain
4.2%ITALY
5.7%nordic
22.3%
france
38.1%
UK
0.1%BEnelux
1.0%Asia
8.1%australia
0.6%New zealand
GOVERNANCE REPORT
FINANCIAL STATEMENTS
38 / 3938 / 39

TOP 20 ASSETS
COMPANY SECTOR INVESTMENT YEAR COUNTRY £M*
1 Gerflor Business materials 2006 France 64.0
2 Parkeon Business services 2007 France 58.6
3 Minimax Electronics 2014 Germany 50.5
4 N&W Global Vending Retail 2008 Italy 47.1
5 AAS Link Financial services 2007 Australia 46.4
6 SAG Utilities 2008 Germany 42.4
7 Fort Dearborn Packaging and paper 2010 US 41.7
8 Euro Cater Retail 2013 Denmark 38.3
9 Education Personnel Employment agency 2014 UK 36.6
10 ATPI Leisure 2012 UK 34.7
11 Fraikin Transport 2007 France 30.9
12 Inspecta Business services 2007 Finland 29.8
13 Flaktwoods Telecoms, media and technology 2007 France 25.9
14 Casa Reha Healthcare 2008 Germany 25.5
15 Menissez Food and consumer products 2006 France 21.5
16 Intelsat Telecoms, media and technology 2008 US 21.4
17 Tractel Manufacturing and engineering 2007 France 20.5
18 Symingtons Food and consumer products 2012 UK 19.5
19 Via Location Shipping and transport 2007 France 18.7
20 Westbury Food and consumer products 2013 UK 17.9
*Total carrying value on ICG balance sheet at 31 March 2015. Includes equity stake listed below where relevant.
TOP 10 EQUITY ASSETS
COMPANY SECTOR £M*
1 Gerflor Building materials 64.0
2 Parkeon Business services 49.5
3 AAS Link Financial services 46.4
4 Menissez Food and consumer products 21.5
5 Intelsat Telecoms, media and technology 21.4
6 Quorn Food manufacturing 16.6
7 Minimax Electronics 16.6
8 ATPI Leisure 15.4
9 Euro Cater Retail 14.6
10 Education Personnel Employment agency 13.9
TOP 10 INTEREST BEARING ASSETS
COMPANY SECTOR £M*
1 N&W Global Vending Retail 47.1
2 SAG Utilities 42.4
3 Fort Dearborn Packaging and paper 40.5
4 Education Personnel Employment agency 36.1
5 ATPI Leisure 34.7
6 Minimax Electronics 33.9
7 Fraikin Transport 30.9
8 Inspecta Business services 29.8
9 Flaktwoods Telecoms, media and technology 25.9
10 Casa Reha Healthcare 25.5
ICG ANNUAL REPORT & ACCOUNTS 2015 BUSINESS MODEL
CASE STUDIES RISKSPERFORMANCE RESOURCES & RELATIONSHIPS
MARKETPLACE & STRATEGY
MACROECONOMIC RISKSCONTINUED
*Carrying value on ICG balance sheet at 31 March 2015, included in the top 20 where relevant.

PRINCIPAL RISKS AND UNCERTAINTIES
EXTERNAL RISKS
RISK IMPACT MITIGATION AND MOVEMENT IN THE YEAR
MACROECONOMIC RISK
Failure to execute the Group’s strategic priorities due to unforeseen macroeconomic changes
2 3
Adverse macroeconomic conditions could reduce the opportunity to deploy capital and impair the ability of the Group to manage effectively its portfolios, reducing the value of future management fees, investment income and performance fees.
The Board regularly receives detailed market reports, reviewing the latest developments in the Group’s key markets. The Investment Committees receive ongoing detailed and specific market reviews for each investment.
During the year the economic indicators in Europe and other key markets are stable or improving.
LIQUIDITY RISK
Failure to refinance debt as it falls due
1
An ongoing failure to refinance its liabilities could result in the Group failing to meet its payment obligations as they fall due. As a result the Group would not be a going concern.
The Group has a policy which seeks to ensure that debt funding is obtained from diversified sources and that the repayment profile is managed to minimise material repayment events.
During the year the Group has renewed and increased its sources of funding.
OPERATIONAL RISKS
Reputational damage due to a regulatory failing
1
The Group’s ability to raise new funds and operate its fund management business would be impaired as a result of a regulatory failing.
The Group has a governance structure in place, supported by a risk framework that allows for the identification, control and mitigation of material risks resulting from the geographical and product diversity of the Group. The adequacy of the systems and controls the Group has in place to comply with the regulations and to mitigate the risks that these represent is periodically assessed. This includes a tailored compliance monitoring programme that specifically addresses regulatory and reputational risks.
During the year the continued expansion of the Group’s product portfolio and increasing product complexity has led to increased regulatory risk.
MARKET RISK
Business risk as a result of exposure to market movements
3
The Group is exposed to loss as a result of adverse market fluctuations in foreign exchange rates and interest rates.
The Group has a policy which seeks to ensure that any non-sterling income, expenditure, assets and liabilities are appropriately hedged and that the residual exposure to market risk is managed to minimise volatility in the financial results of the Group.
During the year the Group has applied its hedging policy consistently.
40 / 41
STRATEGIC REPORT
GOVERNANCE REPORT
FINANCIAL STATEMENTS

INTERNAL RISKS
RISK IMPACT MITIGATION AND MOVEMENT IN THE YEAR
BUSINESS RISKS
Failure to raise third party funds
1
A failure to raise new funds would reduce the Group’s long term income from fund management fees, performance fees and carried interest.
The Group has built dedicated fundraising and scalable infrastructure teams to grow and diversify its institutional client base by geography and type.
The Group has expanded its product portfolio to address a range of investor requirements and continues to build a strong product pipeline.
A record level of fundraising was achieved during the year across a range of products.
Failure to deploy capital committed
2
Failure to deploy capital reduces the value of future management fees, investment income, performance fees and carried interest.
The rate of investment is kept under review by the Investment Committees and senior management to ensure acceptable levels are maintained in current market conditions.
In a competitive landscape the Group has continued to deploy funds in line with the expected run rate during the year.
Failure to maintain acceptable investment performance across the majority of funds
3
Failure to maintain adequate performance in the funds may result in a failure to raise new funds, reducing the Group’s long term income from fund management fees, performance fees and carried interest. Investors in open ended funds may reduce or cancel their commitments, reducing AUM and fund management fees.
The Group has disciplined investment policies and all investments are selected and regularly monitored by the Group’s Investment Committees. Disciplined credit procedures are applied both before and during the period of investment. The Group limits the extent of credit risk by diversifying its portfolio assets by sector, size and geography.
Continued focus by senior management and executives ensures maximum recovery is achieved.
During the year the Group has maintained its investment performance.
PRINCIPAL RISKS AND UNCERTAINTIES CONTINUED
ICG ANNUAL REPORT & ACCOUNTS 2015 BUSINESS MODEL
CASE STUDIES RISKSPERFORMANCE RESOURCES & RELATIONSHIPS
MARKETPLACE & STRATEGY

RISK IMPACT MITIGATION AND MOVEMENT IN THE YEAR
LIQUIDITY RISK
Failure of the Group to meet its debt covenants
1
In the event that the Group breached its covenants, the lenders could potentially call on their commitments.
The Group continually monitors forecast covenant levels. The Board reviews the forecast and actual position on a regular basis.
During the year the Group has not identified any forecasted covenant breach.
OPERATIONAL RISK
Unplanned loss of one or more key employees
2
Breach of any ‘Key Man’ clause or unexpected loss of one or more key employees could result in the Group having to stop making investments for the relevant fund or may impair the ability of the Group to raise new funds.
The Group rewards its investment professionals and other key employees in line with market practice. Senior investment professionals typically receive long term incentives and carried interest as part of their remuneration. The Group periodically engages external consultants to benchmark the rewards offered by the Group to ensure they remain attractive and competitive.
The Group has an appraisal and development process for all its employees to ensure that individuals remain sufficiently motivated and appropriately competent to ensure the ongoing operation and development of the business.
There was no significant impact in the year as a result of the loss of any employee.
42 / 43
STRATEGIC REPORT
GOVERNANCE REPORT
FINANCIAL STATEMENTS

The contribution of our people to the value of our business is demonstrated through our:
– Investment management skills
– Distribution capabilities
– Scalable infrastructure
OUR RESOURCES AND RELATIONSHIPSOur business model can only function because it is supported by several critical resources and relationships.
AWARDS
OUR RESOURCES AND RELATIONSHIPS
It is through our people that over the last 26 years we have generated a brand and track record making us a well known and highly respected fund manager in our core markets. Evidence of the quality of our business has been recognised as we have received three awards during the last year.
OUR PEOPLE MANAGE THE INVESTMENT PROCESS
The Group has a consistent, efficient and robust investment culture across its products. We deliver a disciplined investment process, demonstrate core credit principles and are focused on capital preservation. Our rigorous risk analysis and engagement with our portfolio management processes continue throughout the life of the investment, encompassing regular reviews, active management of the investment and a proactive approach to realisation.
Our investment professionals are specialists, with the skills required to understand and assess the relevant risks and opportunities for their product, to originate investments and then manage those assets to realise returns for investors. Successful application of those skills has supported the development of our longstanding track record.
We value the local knowledge of our investment professionals. We believe that this is crucial to maintain a strong flow of investment opportunities and to effectively manage our investments. Our teams speak the local languages, understand local laws and customs and have the necessary depth of relationships required to operate successfully.
OUR PEOPLE DISTRIBUTE OUR PRODUCTS
Our dedicated distribution team is embedded within the business. Our relationships with third party fund investors have strengthened since the
team was established in 2011. The team has increased investor awareness of our products, expanding our fund investor network both geographically and by investor type. This enhanced network promotes continuous engagement and supports the development of investment products which provide solutions to investors.
Our distribution team have replicated the local model established by the investment business. Their local market knowledge, supported with an understanding of what the Group can offer, is giving us access to new investors.
OUR PEOPLE MANAGE OUR SCALABLE INFRASTRUCTURE
Our infrastructure teams support the whole business, ensuring consistency and quality of service to our counterparties and fund investors. They have established, manage and continue to develop systems and controls to support our investment activities and effectively report on the performance and activities of the Group and our funds.
Our employees have the market skills, knowledge and relationships to support the business as we progress our strategic priorities, expanding both our product range and our geographical coverage.
OUR PEOPLE MANAGE OUR KEY RELATIONSHIPS
Building and maintaining our key relationships is essential to both support the growth of the business and deliver our strategic objectives.
ICG ANNUAL REPORT & ACCOUNTS 2015 BUSINESS MODEL
CASE STUDIES RISKSPERFORMANCE RESOURCES & RELATIONSHIPS
MARKETPLACE & STRATEGY

1
GROW ASSETS UNDER MANAGEMENT
The Group is expanding and strengthening its relationships with third party investors. Our products offer investors an opportunity to diversify their portfolio and generate yield. We are continuously engaged with our investors to understand their current and future needs and to ensure that we have the products to meet these requirements.
The availability of balance sheet capital to co-invest and to support product development is underpinned by our relationships with our key finance counterparties. These include banks, bondholders, other lenders and rating agencies.
Our active compliance team works with the business and our regulators to both identify and manage regulatory risk and also to promote best practice within the marketing, investment and infrastructure teams. The profile of this area is increasing as we expand our product range.
2
INVEST SELECTIVELY
Our investment professionals manage the relationships necessary to originate and source investment opportunities for our funds. These relationships include financial advisers, banks and other investment managers. Our reputation, built up over 26 years, has generated strong, supportive, asset sourcing networks.
ICG is a signatory to the UN Principles for Responsible Investment. We acknowledge the relevance to the investor of environmental, social and governance factors, and of the long-term health and stability of the market as a whole. Our investment committees and investment professionals take responsibility for applying the principles in practice, taking a proactive approach to considering environmental, social and corporate governance factors in all our investment decisions.
3
MANAGE PORTFOLIOS TO MAXIMISE VALUE
We invest money across the capital structure of companies and property assets. We seek to develop strong relationships both with owners and the management teams. Our investment teams have local market knowledge and access to the Group’s extensive sector and market experience to support those businesses. Attendance at board meetings of originated corporate investments both increases our knowledge of the business and allows our investment professionals to develop strong relationships with management teams.
OUR RESPONSIBILITY TO OUR PEOPLE
To successfully deliver our strategic priorities the Group is focused on engaging with and motivating its employees. The current engagement of our people is demonstrated by our staff retention rate of 93.3%.
Effective two way communication with our people is essential to build and maintain engagement. We have a number of formal and informal channels to achieve this. These include quarterly whole business briefings, an intranet and regular team and manager meetings.
The Group conducts regular, confidential, employee surveys to identify the areas of the business in need of further development, and those areas that are performing well. The last survey was conducted in 2012 and demonstrated that the Group was performing well above financial services norms. It also demonstrated clear progress on the initiatives identified in the prior survey.
The Group considers that training and development are essential to attract and retain people of the highest calibre and has always invested significantly in this. We are committing to enhancing the knowledge and skills of our people and nurturing their talent. We run an extensive programme of internal and external training to develop and enhance core skills, increase technical competency and to develop future leaders.
The ongoing development of our people is supported by our performance management system. This provides a regular forum for employees and managers to review performance against agreed objectives and to identify areas for further development.
Our people are offered access to a range of benefits designed to attract, develop and retain talented employees. We ensure our levels of overall remuneration are sufficient to attract and retain talent. Benefits include: pension contributions, healthcare and health screening, life assurance, child care vouchers, travel insurance, share save scheme, gym membership and cycle to work schemes.
The Group supports flexible working, with 8.5% of employees benefitting from these arrangements. Our employee initiated turnover is 7.6%.
44 / 45
STRATEGIC REPORT
GOVERNANCE REPORT
FINANCIAL STATEMENTS

Operational scope Greenhouse gas emission source 2015 2014 Units
Direct emissions (Scope 1)
On-site air conditioning refrigerant loss 177 14 Tonnes CO2e
Indirect emissions (Scope 2) Purchased electricity/heat 910 870 Tonnes CO2e
Indirect emissions (Scope 3) Business travel: flights and rail 1,900 3,554 Tonnes CO2e
Total 2,987 4,438 Tonnes CO2e
Emissions per FTE 12.4 20.6 Tonnes CO2e per FTE
OUR RESOURCES AND RELATIONSHIPS CONTINUED
FIVE YEAR COMMITMENT TO IMPETUS – PEF THINKFORWARD PROGRAMME
500£K
– For more information about Impetus-PEF please visit: http://impetus-pef.org.uk
– For more information about ThinkForward please visit: http://think-forward.org.uk
– For more information about Tower Hamlets Pupil Referral Unit please visit: www.towerhamletspru.org.uk
DIVERSITY AND VALUES
The permanent employee population of 236 represents 28 different nationalities. Of our permanent employees 82 are women and 154 men. We do not record the religion or ethnicity of employees. The senior management team (excluding the Group’s Board) comprises two women and three men and ICG’s Board comprises eight individuals of which one is a woman.
We are committed to providing a safe and healthy work environment for our people where diversity is valued, where everyone is treated fairly and with dignity and respect, regardless of age, gender, race, sexual orientation, disability, religion or beliefs. We do not tolerate discrimination of any nature and comply fully with appropriate human rights legislation. We aim for employees to have a sense of wellbeing and we promote a working culture where employees can freely question practices and suggest alternatives.
OUR RESPONSIBILITY TO OUR COMMUNITY
Our social and community policies and practices are grounded in promoting opportunities to young people, through education or work experience. In practice this means making a contribution through creating work experience opportunities across the Group and supporting a charity (ThinkForward) which helps young people make the often difficult transition from education to the workplace. In addition, employees are encouraged to donate time to activities supporting ThinkForward or have the opportunity to receive matched contributions for their fundraising efforts for other charities.
The Group runs an internship programme which offers a number of placements for young graduates who have achieved academically but are not readily able to access opportunities in the financial sector.
The fully funded internship offers the opportunity to rotate through ICG’s key business areas, building a strong understanding of our business model with the opportunities to specialise in a specific role. The internship programme is expected to provide that difficult first step on the career ladder. The programme is now in its third year, with both of its previous cohorts having successfully secured a permanent job in their chosen field.
The Group has made a five year, £500k commitment to Impetus-PEF’s ThinkForward programme. ThinkForward was set up by the Private Equity Foundation (now merged with Impetus to form Impetus-PEF) in 2010 to dramatically reduce the risk of young people becoming NEETs (not in education, employment or training). According to Impetus-PEF, 15% of young people are failing to make a successful move from education into employment. The charity places dedicated coaches in schools where there are young people who have been identified as ‘at risk’ of becoming NEETs. The coaches work with individuals to help them achieve their goals, providing support both at school and at home.
The Group’s commitment has provided funding to support a full time coach for the Harpley Tower Hamlets Pupil Referral Unit. The coach works with young people to support them to maximise their opportunities while in full time education and to improve their chances of a successful transition into long term employment. ICG is the first company to make such a commitment to a Pupil Referral Unit and is very proud of its association.
OUR RESPONSIBILITY TO OUR ENVIRONMENT
ICG recognises that businesses have a responsibility to protect the environment and understand the impact their operations have, and we take appropriate measures to limit our energy use and carbon output.
The Group is required to state the annual quantity of emissions in tonnes of carbon dioxide equivalent from activities for which the Group is responsible. The Group’s carbon emissions result predominantly from business travel. Using Defra/DECC’s GHG conversion factors for company reporting, emissions for the year to 31 March 2015 were 2,987 tonnes of CO2.
We have reported on all of the emission sources required under the Companies Act 2006 (Strategic report and Directors’ report) Regulations 2013. These sources fall within our consolidated financial statements. We do not have responsibility for any emission sources that are not included in our consolidated financial statements.
ICG ANNUAL REPORT & ACCOUNTS 2015 BUSINESS MODEL
CASE STUDIES RISKSPERFORMANCE RESOURCES & RELATIONSHIPS
MARKETPLACE & STRATEGY

GOVERNANCE REPORT
CONTENTS
Letter from the Chairman 48
Board of Directors 50
Our corporate governance framework 52
The Board’s year 54
Training and induction 56
Board evaluation 57
Engaging with stakeholders 58
Audit Committee report 59
Risk Committee report 68
Nominations Committee report 73
Remuneration Committee report 76
Compensation at a glance 79
Directors’ remuneration policy summary 80
Annual report on remuneration 88
Directors’ report 98
Directors’ responsibilities 105
Auditor’s report 106
46 / 47
FINANCIAL STATEMENTS
STRATEGIC REPORT

LETTER FROM THE CHAIRMAN
DEAR SHAREHOLDER
Your Board is committed to maintaining high standards in the area of corporate governance. This has been an important area of focus for the Board during the year, as we continue to be mindful of our duty to manage the Company for the long term benefit of our Shareholders.
To fulfil this duty, the Board provides leadership of the Group within a framework of controls which enable risk to be assessed and managed, and which ensure that the necessary financial and human resources are in place for the Company to meet its objectives and increase shareholder value. In fulfilling these roles we aim to exercise robust supervision while fostering a corporate culture that permits growth and empowers the entrepreneurial spirit of our employees.
Some of our key priorities in this area during the last financial year were:
– Receiving detailed reports on business units – the Board is keen to ensure that areas of significant expansion are monitored and has received detailed presentations from a number of business unit heads about their products, markets and operations.
– Holding a Board strategy session – separate from the normal cycle of Board meetings, a detailed strategy session was held in March 2015 at which Executive Directors presented a strategic update for review and discussion by the Board as a whole. As a result of the session, an update to the five year business plan is being prepared for Board sign off. Please see page 54 for more details.
– Increasing focus on risk management – Controls in this area are regularly reviewed and, where necessary, enhanced. The Group has formed an Operational Risk Group (ORG), which meets monthly and is comprised of the heads of the Group’s control functions. The ORG’s remit is to identify and monitor potential operational risks and recommend solutions or improvements to processes and controls; it will be chaired by the Group’s Chief Risk Officer, a new appointment, and reports its findings to the Risk Committee. In addition, the Group has established an Internal Audit function to review the functionality and effectiveness of our risk management process. Please see page 67 for more details.
– The appointment of a new Non Executive Director – the appointment of Kathryn Purves as a Non Executive Director in October 2014 is detailed in the report of the Nominations Committee on page 73. Kathryn’s executive experience and background in risk management provides support and insight to our increasing risk management focus.
JUSTIN DOWLEYCHAIRMAN
THIS YEAR’S GOVERNANCE REPORT IS DIFFERENT
We have engaged with shareholders throughout the year better to understand their requirements and have enhanced the report to reflect this.
On pages 52 to 53, we explain how ICG is governed, what the Board has been up to during the year, how our Directors are trained and introduced to the business, the results of the Board evaluation and how we engage with our stakeholders.
The Committee Reports, beginning with the Audit Committee Report, can be found on pages 59 to 97.
Further, detailed information on how the Group complied with the UK Corporate Governance Code during the year is set out on pages 98 and 104.
ICG ANNUAL REPORT & ACCOUNTS 2015 CHAIRMAN’S LETTER
BOARD OF DIRECTORS
REMUNERATIONCOMMITTEE REPORTS
DIRECTORS’ REPORT
CORPORATE GOVERNANCE

BOARD OF DIRECTORS
As at 31 March 2015 (and at the date of publication), the Board comprised a Non Executive Chairman, four independent Non Executive Directors and three Executive Directors. Having duly considered their independence in accordance with the Code, the Board considers each of its Non Executive Directors to be independent in character and judgement. They each provide effective challenge both at and outside of Board meetings. The Non Executive Directors are considered to be of the appropriate calibre and experience to bring significant influence to bear on the Board’s decision making process.
During the financial year, Kathryn Purves replaced Lindsey McMurray as a Non Executive Director. Please see the report of the Nominations Committee on page 73 for further details of this change.
The Chairman has acted as a Non Executive Director of Melrose Industries PLC and the National Crime Agency during the year. We do not consider these appointments to have any adverse impact on his ability to perform his role effectively as Chairman of the Board.
– Conducting a Board evaluation – this process, led by me as Chairman in May 2014, generated 360 degree feedback for each Director and highlighted areas for the Board to focus on in future to ensure proper oversight of the Group. This was supplemented by a further evaluation in May 2015. Please see page 57 for more details
– Increasing the level of shareholder meetings – members of the Board have met with a greater number of shareholders to deliver updates on the performance and strategy of the Group’s business and to allow shareholders to air any concerns. We have made a number of changes to our approach as a result of the input received from shareholders, including disclosing Executive Directors’ KPIs and introducing Malus and Clawback provisions in Executive Directors’ remuneration. Please see page 77 for more details of our interactions with stakeholders.
I can confirm that throughout the year to 31 March 2015, the Group was in compliance with the provisions of the UK Corporate Governance Code (the Code) issued by the Financial Reporting Council. A copy of the Code is publicly available on the Financial Reporting Council’s website www.frc.org.uk.
I find each of my fellow Directors to be a valuable contributor at Board and Committee meetings, and Board discussions remain robust and detailed. Our strong governance framework will remain integral to our business model during the coming financial year as we seek to grow our assets under management and deliver growth for our shareholders without compromising our risk management and internal controls.
If any shareholder has questions on the work of the Board, I am very happy to respond to these, at the Company’s Annual General Meeting or at any other time.
Justin DowleyChairman
21 May 2015
48 / 49
STRATEGIC REPORT
GOVERNANCE REPORT
FINANCIAL STATEMENTS

CHRISTOPHE EVAINEXECUTIVE DIRECTOR AND CHIEF EXECUTIVE OFFICER
JUSTIN DOWLEY CHAIRMAN
BENOÎT DURTESTEEXECUTIVE DIRECTOR AND HEAD OF EUROPEAN INVESTMENTS
PHILIP KELLEREXECUTIVE DIRECTOR AND CHIEF FINANCIAL OFFICER
Christophe Evain has been CEO of ICG since 2010, during which time he has led the strategic development of the Group to a fund management model. Prior to his appointment as CEO, Christophe had worked at ICG for 16 years and has been a key figure in the development of the Group’s business. He has led the expansion of the Group to new geographies by opening ICG’s offices in Paris, Hong Kong and New York. Before ICG, he held a number of roles in other leading financial institutions, specialising in leverage and structured finance. Christophe also serves as Chief Investment Officer of the Group; he has a thorough and detailed knowledge of the Group’s investment portfolio and maintains a focus on investment discipline and quality.
Justin Dowley brings a wealth of experience of the financial services industry to the Board, having had a 30 year career in investment banking. He qualified as a Chartered Accountant at Price Waterhouse. Between 1981 and 2011, Justin was a Director of Morgan Grenfell before becoming Head of Investment Banking at Merrill Lynch Europe and then a founder partner of Tricorn Partners. In addition, having served on a number of company boards during his career, Justin has gained broad corporate governance and commercial expertise which he brings to his role as Chairman of the Group.
Benoît Durteste is an experienced investment manager with a strong understanding of European private equity markets. He is the Group’s Head of European Investments and a Fund Manager for three of our key mezzanine investment funds. His executive role provides the Board with detailed insight into the markets in which the Group operates, and he contributes a thorough understanding of financial markets and the Group’s investment portfolio to Board proceedings. Benoît joined ICG in September 2002 from Swiss Re where he worked as a Managing Director in the Structured Finance division in London. Prior to Swiss Re, he had roles at BNP Paribas and at GE Capital, notably as CFO of one of their portfolio companies.
Philip Keller has been CFO of ICG for nine years and has responsibility for finance, operations and human resources. Philip is a Chartered Accountant and he brings sound financial management skills to the Board. He also has a strong focus on operational matters and stakeholder communications, and during his time as an Executive Director has overseen the significant expansion of the Group’s platform and infrastructure. Prior to joining ICG, he was Finance Director of ERM, a global environmental consultancy, where he was part of a management team that led two leveraged buyouts in 2001 and 2005. This experience provides him with a management-side perspective on buyouts which is a valuable additional viewpoint for the Board.
COMMITTEES Chairs the Nominations Committee and is a member of the Remuneration Committee and the Risk Committee
COMMITTEES Chairs the Executive Committee
COMMITTEES Member of the Executive Committee
COMMITTEES Member of the Executive Committee
OTHER DIRECTORSHIPS Non Executive Director of Melrose Industries PLC, the National Crime Agency, Ascot Authority (Holdings) Limited and a number of private companies
OTHER DIRECTORSHIPS ICG Group entities
OTHER DIRECTORSHIPS ICG Group entities and current Chairman of the BVCA Alternative Lending Committee
OTHER DIRECTORSHIPS ICG Group entities
JOINED BOARD 2006 and was appointed Chairman in 2010
JOINED BOARD 2003 and was appointed CEO in 2010
JOINED BOARD 2012
JOINED BOARD2006
ICG ANNUAL REPORT & ACCOUNTS 2015 CHAIRMAN’S LETTER
BOARD OF DIRECTORS
REMUNERATIONCOMMITTEE REPORTS
DIRECTORS’ REPORT
CORPORATE GOVERNANCE
BOARD OF DIRECTORS

COMMITTEES Chairs the Audit Committee and Risk Committee and is a member of the Remuneration Committee and the Nominations Committee
COMMITTEES Chairs the Remuneration Committee and is a member of the Audit Committee, the Risk Committee and the Nominations Committee
COMMITTEES Member of the Remuneration Committee, the Audit Committee, the Risk Committee and the Nominations Committee
COMMITTEES Member of the Audit Committee, the Risk Committee and the Nominations Committee
OTHER DIRECTORSHIPS Standard Life PLC, Daily Mail and General Trust plc and the Homes and Communities Agency
OTHER DIRECTORSHIPS Ashmore Group plc, Aspect Capital Limited and Bank of America Merrill Lynch (UK) Pension Plan Trustees Ltd
OTHER DIRECTORSHIPS Ceki AS, Stromstangen AS, UPM Kymmene Oy, Voxtra Foundation and DNB Bank ASA
OTHER DIRECTORSHIPS Partnership Life Assurance Company Limited, Partnership Home Loans Limited and Partnership Services Limited
JOINED BOARD 2009
JOINED BOARD 2010
JOINED BOARD 2012
JOINED BOARD2014
PETER GIBBSNON EXECUTIVE DIRECTOR
KATHRYN PURVESNON EXECUTIVE DIRECTOR
KEVIN PARRYNON EXECUTIVE DIRECTOR AND SENIOR INDEPENDENT DIRECTOR
KIM WAHLNON EXECUTIVE DIRECTOR
Peter Gibbs’s extensive asset management experience has proved invaluable to the Board during the Group’s transition to a fund management model. His career in the sector has given him an informed view of the issues facing the Group, which allows him to provide detailed insight into investor and shareholder concerns. He served as Chief Investment Officer of Merrill Lynch’s Investment Management activities outside the US and prior to this was Co-Head of Equity Investments worldwide. He also served as a Director of UK Financial Investments, the body established to hold the UK government’s stake in financial institutions. His roles on this and other boards has given him a detailed understanding of corporate governance and company proceedings.
Kathryn Purves is Chief Risk Officer of Partnership Assurance Group plc, a leading provider of non-standard annuities. Kathryn’s executive experience in risk management has already proved a valuable resource to the Board as she is able to enhance oversight in a key area for the Group. She also has valuable investment experience for the Board to draw upon; before joining Partnership in 2008, she worked within the private equity industry for approximately 10 years, most recently at Phoenix Equity Partners. Prior to that, she worked as an Investment Manager for Deutsche Bank in Europe and UBS Capital in Australia and Asia.
During his career, Kevin Parry’s roles have included Chief Financial Officer of Schroders plc and a managing partner at KPMG, as well as other positions. This combination of roles has given him a thorough understanding of both the operations of listed companies and the applicable audit and accounting frameworks. He is a Chartered Accountant with extensive experience of auditing and advising large international groups. Kevin’s detailed knowledge of financial accounting and his experience on a number of company boards brings a diverse range of experience to Board and Committee proceedings.
Kim Wahl has a wide and detailed knowledge of European investment markets gained from a lengthy career in the private equity industry; he is the owner and Chairman of the investment firm Stromstangen AS which he established in 2004, and he also co-founded IK Investment Partners in 1989. Kim had previously worked at Goldman, Sachs & Co. The insight gained during his career is particularly useful for the Board when considering the Group’s investment portfolio at an oversight level. He is based in Norway and assists greatly in providing the Board with an international view of the Group’s business and markets.
50 / 51
STRATEGIC REPORT
GOVERNANCE REPORT
FINANCIAL STATEMENTS
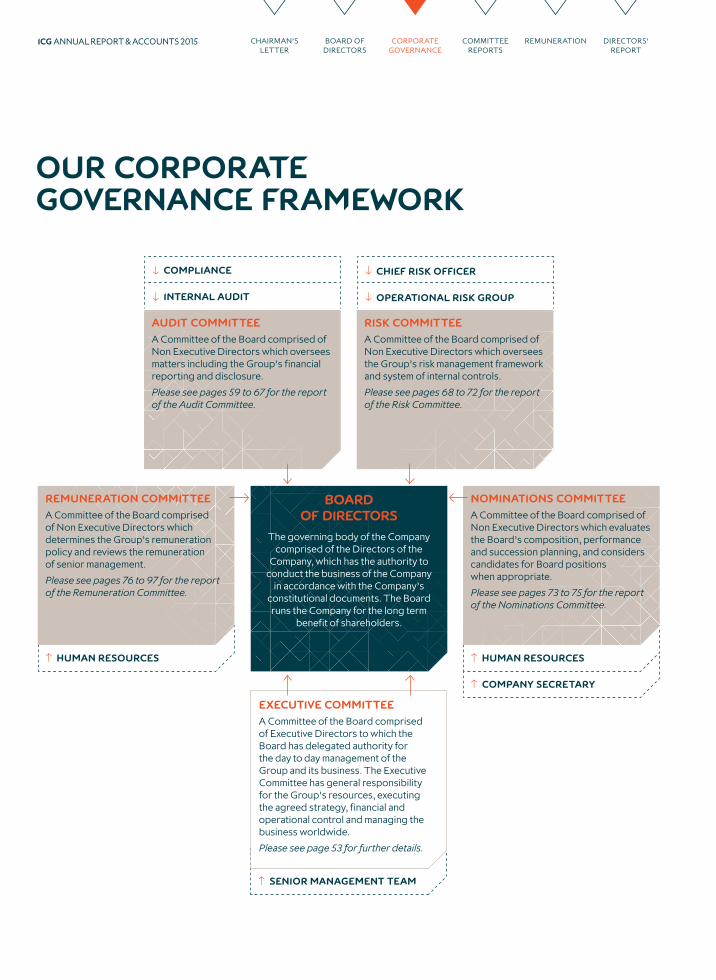
SENIOR MANAGEMENT TEAM
COMPANY SECRETARY
COMPLIANCE
HUMAN RESOURCES HUMAN RESOURCES
CHIEF RISK OFFICER
INTERNAL AUDIT OPERATIONAL RISK GROUP
EXECUTIVE COMMITTEE
A Committee of the Board comprised of Executive Directors to which the Board has delegated authority for the day to day management of the Group and its business. The Executive Committee has general responsibility for the Group’s resources, executing the agreed strategy, financial and operational control and managing the business worldwide.
Please see page 53 for further details.
AUDIT COMMITTEE
A Committee of the Board comprised of Non Executive Directors which oversees matters including the Group’s financial reporting and disclosure.
Please see pages 59 to 67 for the report of the Audit Committee.
REMUNERATION COMMITTEE
A Committee of the Board comprised of Non Executive Directors which determines the Group’s remuneration policy and reviews the remuneration of senior management.
Please see pages 76 to 97 for the report of the Remuneration Committee.
NOMINATIONS COMMITTEE
A Committee of the Board comprised of Non Executive Directors which evaluates the Board’s composition, performance and succession planning, and considers candidates for Board positions when appropriate.
Please see pages 73 to 75 for the report of the Nominations Committee.
RISK COMMITTEE
A Committee of the Board comprised of Non Executive Directors which oversees the Group’s risk management framework and system of internal controls.
Please see pages 68 to 72 for the report of the Risk Committee.
OUR CORPORATE GOVERNANCE FRAMEWORK
BOARD OF DIRECTORS
The governing body of the Company comprised of the Directors of the
Company, which has the authority to conduct the business of the Company
in accordance with the Company’s constitutional documents. The Board runs the Company for the long term
benefit of shareholders.
ICG ANNUAL REPORT & ACCOUNTS 2015 CHAIRMAN’S LETTER
BOARD OF DIRECTORS
REMUNERATIONCOMMITTEE REPORTS
DIRECTORS’ REPORT
CORPORATE GOVERNANCE
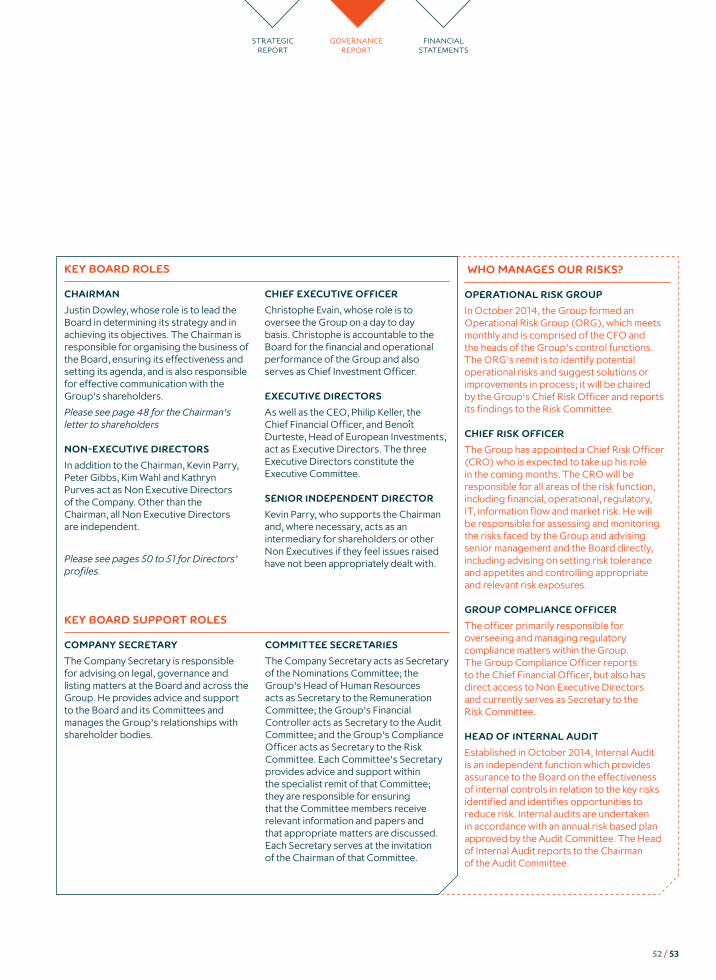
WHO MANAGES OUR RISKS?
OPERATIONAL RISK GROUP
In October 2014, the Group formed an Operational Risk Group (ORG), which meets monthly and is comprised of the CFO and the heads of the Group’s control functions. The ORG’s remit is to identify potential operational risks and suggest solutions or improvements in process; it will be chaired by the Group’s Chief Risk Officer and reports its findings to the Risk Committee.
CHIEF RISK OFFICER
The Group has appointed a Chief Risk Officer (CRO) who is expected to take up his role in the coming months. The CRO will be responsible for all areas of the risk function, including financial, operational, regulatory, IT, information flow and market risk. He will be responsible for assessing and monitoring the risks faced by the Group and advising senior management and the Board directly, including advising on setting risk tolerance and appetites and controlling appropriate and relevant risk exposures.
GROUP COMPLIANCE OFFICER
The officer primarily responsible for overseeing and managing regulatory compliance matters within the Group. The Group Compliance Officer reports to the Chief Financial Officer, but also has direct access to Non Executive Directors and currently serves as Secretary to the Risk Committee.
HEAD OF INTERNAL AUDIT
Established in October 2014, Internal Audit is an independent function which provides assurance to the Board on the effectiveness of internal controls in relation to the key risks identified and identifies opportunities to reduce risk. Internal audits are undertaken in accordance with an annual risk based plan approved by the Audit Committee. The Head of Internal Audit reports to the Chairman of the Audit Committee.
KEY BOARD ROLES
CHAIRMAN
Justin Dowley, whose role is to lead the Board in determining its strategy and in achieving its objectives. The Chairman is responsible for organising the business of the Board, ensuring its effectiveness and setting its agenda, and is also responsible for effective communication with the Group’s shareholders.
Please see page 48 for the Chairman’s letter to shareholders
NON-EXECUTIVE DIRECTORS
In addition to the Chairman, Kevin Parry, Peter Gibbs, Kim Wahl and Kathryn Purves act as Non Executive Directors of the Company. Other than the Chairman, all Non Executive Directors are independent.
Please see pages 50 to 51 for Directors’ profiles.
CHIEF EXECUTIVE OFFICER
Christophe Evain, whose role is to oversee the Group on a day to day basis. Christophe is accountable to the Board for the financial and operational performance of the Group and also serves as Chief Investment Officer.
EXECUTIVE DIRECTORS
As well as the CEO, Philip Keller, the Chief Financial Officer, and Benoît Durteste, Head of European Investments, act as Executive Directors. The three Executive Directors constitute the Executive Committee.
SENIOR INDEPENDENT DIRECTOR
Kevin Parry, who supports the Chairman and, where necessary, acts as an intermediary for shareholders or other Non Executives if they feel issues raised have not been appropriately dealt with.
KEY BOARD SUPPORT ROLES
COMPANY SECRETARY
The Company Secretary is responsible for advising on legal, governance and listing matters at the Board and across the Group. He provides advice and support to the Board and its Committees and manages the Group’s relationships with shareholder bodies.
COMMITTEE SECRETARIES
The Company Secretary acts as Secretary of the Nominations Committee; the Group’s Head of Human Resources acts as Secretary to the Remuneration Committee; the Group’s Financial Controller acts as Secretary to the Audit Committee; and the Group’s Compliance Officer acts as Secretary to the Risk Committee. Each Committee’s Secretary provides advice and support within the specialist remit of that Committee; they are responsible for ensuring that the Committee members receive relevant information and papers and that appropriate matters are discussed. Each Secretary serves at the invitation of the Chairman of that Committee.
52 / 53
STRATEGIC REPORT
GOVERNANCE REPORT
FINANCIAL STATEMENTS

THE BOARD’S YEAR
TIMELINE
REGULAR MATTERS
Note that the above table refers only to scheduled and recurring matters; in addition, time is allocated at each meeting to discuss ad hoc matters.
MAY JULY SEPTEMBER
ANNUAL MATTERS
+ Board appraisal
+ Approve Annual Report and AGM Notice
+ Insurance renewal
+ Review of Executive shareholdings
+ Results feedback
OTHER MEETINGS
+ Remuneration Committee
+ Audit Committee
+ Annual General Meeting
+ Risk Committee
+ Nominations Committee
+ Remuneration Committee
+ Audit Committee
+ Risk Committee
OTHER MATTERS DISCUSSED
The other principal matters considered by the Board during the year included:
– The Group’s performance and outlook – Feedback from a shareholder survey commissioned by the Board – New products of the Group and potential expansion to new jurisdictions – Opportunities for the Group to expand by acquisition and by launching new products
– The use of balance sheet capital in supporting funds managed by the Group – The capital structure and the leverage options available to the Group – The training programme for Directors – A detailed review of the operations team of the Group and the Group’s data systems
In addition, the Board held a specific strategy session in March 2015 to consider the future direction of the Group. The proposed strategy for the Group over the medium term period was presented by the Executive Directors to the rest of the Board and then debated by the entire Board. This included a detailed look at the core businesses of the Group, a discussion of new opportunities and areas for expansion, projections for performance over the next financial cycle and a discussion around risks and threats to the Group. All Directors participated fully in the session, and as a result a detailed operational business plan is being prepared for further Board discussion and, in due course, approval.
KEY
Prior minutes/action points and matters arising
Executive Directors’ Report
Investment Portfolio Update
Business Unit Update
Finance Update
ICG ANNUAL REPORT & ACCOUNTS 2015 CHAIRMAN’S LETTER
BOARD OF DIRECTORS
REMUNERATIONCOMMITTEE REPORTS
DIRECTORS’ REPORT
CORPORATE GOVERNANCE

NOVEMBER JANUARY MARCH
+ Organisation update/ succession planning
+ Approve half year results
+ Half year results feedback
+ Confirmation of outside interests of Directors
+ Approval of annual budget
+ Annual compliance reports
+ Approval of terms of reference for Committees
+ Audit Committee
+ Risk Committee
+ Remuneration Committee + Remuneration Committee
+ Audit Committee
+ Risk Committee
ATTENDANCE AT BOARD AND COMMITTEE MEETINGS
The following table shows the number of Board and Committee meetings held during the year and the attendance record of individual Directors.
BoardAudit Committee*
Risk Committee
Remuneration Committee
Nominations Committee
Justin Dowley 6 / 6 4 / 4** 4 / 4 4 / 4 2 / 2
Christophe Evain 6 / 6 4 / 4** 4 / 4** 4 / 4** 2 / 2**
Philip Keller 6 / 6 4 / 4** 4 / 4** 4 / 4** 2 / 2**
Benoît Durteste 6/ 6 3 / 4** 3 / 4** N/A 2 / 2**
Peter Gibbs 5 / 6 3 / 4 4 / 4 4 / 4 2 / 2
Lindsey McMurray*** 2 / 3 1 / 2 1 / 2 1 / 1 1 / 2
Kevin Parry 6 / 6 4 / 4 4 / 4 4 / 4 2 / 2
Kathryn Purves*** 3 / 3 2 / 2 2 / 2 3 / 3** N/A
Kim Wahl 5 / 6 3 / 4 3 / 4 4 / 4 1 / 2
To the extent Directors were unable to attend meetings, they received and read the papers for consideration at that meeting, relayed their comments in advance and, where necessary, followed up with the Chairman on the decisions taken. Each meeting of the Board and Nominations Committee was attended by the Company Secretary, while each of the other Committee meetings was attended by the Secretary to that Committee.
* The Audit Committee also held three sub-Committee meetings in April and May 2014 to consider in detail various sections the Group’s year end reports and accounts for the 2014 financial year. These were not full Committee meetings as the report and accounts were also formally reviewed at a full Audit Committee meeting. Each member of the Audit Committee attended at least two of the three sub-Committees.
** Attended part or all of these meetings at the invitation of the relevant Chairman but was not a member of the relevant Committee.
*** Lindsey McMurray ceased to be a Director on 17 October 2014 and was replaced by Kathryn Purves with effect from that date. Kathryn Purves has attended all Board and Committee meetings since appointment.
54 / 55
STRATEGIC REPORT
GOVERNANCE REPORT
FINANCIAL STATEMENTS

Induction meetings have included:
– One on one meetings with the Chairman, the Senior Independent Director and other Non Executive Directors
– At least one meeting with each of the Executive Directors (and multiple meetings with the CFO), and presentations from executive management on the Group’s business
– A briefing from the General Counsel and Company Secretary on the legal governance and control framework of the Group, as well as the duties and obligations of Directors
– A briefing from the Group Compliance Officer on the Group’s regulatory framework
– Sessions with the heads of Credit Funds, Internal Audit, Treasury, Operations, Human Resources, Finance and Investor Relations
– Discussions with the Group’s Audit Partner (from Deloitte) and Remuneration adviser (from PwC).
The Board recognises the importance of the continued professional development of the Directors in order to build on their existing skills and experience. During the year the Board received detailed presentations about specific products and business units, to ensure that the non executive members of the Board are fully aware of the detailed operations of the Group. In addition, a regular training programme has been established. Under this programme, the five Non Executive Directors of the Company receive detailed presentations from staff members about specialist areas relating to the Group’s business. As well as presentations to the Board as a whole, a bespoke induction programme was carried out for Kathryn Purves as an incoming Non Executive Director.
ONGOING TRAINING AND DEVELOPMENT
The main focus of development for the Board has been in continuing to improve their detailed understanding of the Group’s business. On a regular basis, business unit heads have presented to the Board in relation to developments in their business areas, including risks and opportunities for growth. Presentations were received by the Directors during the financial year from the Heads of Asia Pacific Mezzanine, North American Debt, Real Estate Lending, Alternative Credit and Private Equity Secondaries. Presentations were also given by the Heads of Marketing and
Client Relations, Operations, Treasury, Investor Relations, Legal, Compliance, IT and Human Resources. Sessions on the Group’s European Mezzanine Lending and Credit Funds businesses are planned for the forthcoming financial year. As well as deepening their understanding of the Group’s business, products and markets, these sessions allow Non Executive Directors to understand team structures and assist with succession planning.
In addition, the Board and its various Committees regularly receive technical or governance updates from external advisers. During the year, the Audit Committee received regular updates from Deloitte as to market and industry developments, the Risk Committee was given a presentation by Travers Smith on regulatory developments affecting the Group’s business, and the Remuneration Committee received presentations from PwC on trends in governance practice and other relevant developments relating to remuneration.
Outside of scheduled meetings, a regular training programme has been established to allow a more detailed look at certain topics; under this programme, the five Non Executive Directors of the Company receive a detailed and more operationally focussed presentation from staff members about specialist topics relating to the Company’s business. The first two sessions held have been a workshop on the Group’s fund marketing process, including the production and verification of marketing documents, and a session on risk monitoring in certain credit funds.
AS A RESULT OF THE WIDE-RANGING AND BESPOKE INDUCTION PROGRAMME, I WAS ABLE TO QUICKLY BUILD A THOROUGH AND COMPREHENSIVE PICTURE OF THE GROUP AND ITS BUSINESS, WHICH MEANT I COULD CONTRIBUTE TO THE BOARD AND ITS COMMITTEES FROM AN EARLY STAGE FOLLOWING MY APPOINTMENT.
KATHRYN PURVES NON EXECTUTIVE DIRECTOR
INDUCTION
The goal of the Group’s induction process for new Directors is to create a programme of briefings, concentrated in the early period of a Director’s appointment, which enable that Director to contribute to Board proceedings from the time of joining the Board. The programme is tailored to the particular skills and experience of the incoming Director. Kathryn Purves was appointed to the Board during the financial year; on appointment she received a pack of relevant documentation and policies and has subsequently had a detailed induction to the Group, its business and its personnel through a series of meetings and presentations.
ICG ANNUAL REPORT & ACCOUNTS 2015 CHAIRMAN’S LETTER
BOARD OF DIRECTORS
REMUNERATIONCOMMITTEE REPORTS
DIRECTORS’ REPORT
CORPORATE GOVERNANCE
TRAINING AND INDUCTION

BOARD PERFORMANCE
In line with the effective governance requirements of the Code, the Board reviews its own performance annually. The assessment covers the effectiveness and performance of the Board as a whole, the functioning of the Executive Committee, an evaluation of individual Directors and the effectiveness of the Board Committees. The Non Executive Directors, led by the Senior Independent Director, and taking into account the views of Executive Directors, are responsible for evaluating the performance of the Chairman.
This exercise was carried out in both May 2014 and May 2015 and the feedback obtained was collated and presented to the Board for a detailed discussion. Neither evaluation identified any significant areas for concern and the Board is satisfied with its performance and that of its members, and also the performance of its Committees. Certain points raised during this exercise will be addressed at Board meetings during the forthcoming financial year.
During this financial year a number of the points raised in May 2014 were addressed. These included the addition of a regular update at each Board meeting from the head of a different business unit; a detailed Board strategy session, a review of matters delegated from the Board to the Risk Committee to ensure the Board’s time is spent effectively, and considering whether to appoint a Chief Risk Officer.
In 2013, the Board also employed the services of an external independent third party for these purposes. This considered the effectiveness and performance of the Board in relation to: Board composition, expertise and dynamics; time management and Board support; strategic oversight; risk management and internal control; and succession planning and human resource management. The independent Board evaluation concluded that the Board was effective in all areas.
ELECTION AND RE-ELECTION OF DIRECTORS
The Company’s current Articles of Association provide that a Director appointed by the Board shall retire at the Annual General Meeting following their appointment and that at each Annual General Meeting of the Company one third of the Directors must retire by rotation. In addition to Kathryn Purves (who will stand for election as a Director appointed since the last Annual General Meeting) the Board has decided that, in accordance with the Code, each of the other Directors will retire and stand for re-election at each year’s Annual General Meeting.
In relation to the Directors who are standing for election or re-election, the Chairman is satisfied that, following the formal performance evaluation described above, each of the other Directors continues to be effective and demonstrates commitment to their role. In the case of the Chairman, the Non Executive Directors are satisfied that he continues to be effective and demonstrates commitment to his role.
Key conclusions and observations from the May 2015 evaluation:
– The Board continues to operate effectively
– The views of each member were openly communicated and appropriately taken into account
– The results of the evaluation process formed part of the Chairman’s appraisal of the overall effectiveness of the Board and its members, as well as part of the Non Executives’ assessment of the Chairman
– Additional specialist training in the area of Audit and Risk should be made available to Non Executive Directors
– Reporting lines to Executive Directors should be considered to ensure that they have the appropriate number of people reporting to them
– The Audit Committee should conduct a review of the newly formed internal audit function during the year to ensure it is operating effectively
I FIND THIS BOARD TO HAVE A GOOD AND OPEN ATMOSPHERE. THE DIRECTORS ARE AN ENGAGED GROUP WITH A GOOD MIX OF COMPETENCIES AND ALL CONTRIBUTE TO CANDID DISCUSSIONS.
KIM WAHL NON EXECUTIVE DIRECTOR
56 / 57
STRATEGIC REPORT
GOVERNANCE REPORT
FINANCIAL STATEMENTS
BOARD EVALUATION

The Company has a comprehensive stakeholder engagement programme which aims to help existing and potential investors understand and communicate with the Group. The programme is designed to ensure regular engagement with institutional investors, shareholder groups and debt investors. Regular feedback is provided to the Board to ensure that they understand the views of stakeholders. During the year, the programme included:
– Meetings with principal shareholders: throughout the year, the Chairman, Chair of the Remuneration Committee, Chief Executive Officer and Chief Financial Officer have met with a number of principal shareholders on at least one occasion. These meetings were largely after the interim and full year results announcements and in the lead up to the Annual General Meeting. The full Board have been kept informed of the issues raised at these meetings and the views of shareholders on a regular basis. The Chairman, Chief Executive Officer and other Directors will continue to make themselves available to meet with shareholders as required. Points raised at these meetings have been considered and, to the extent felt appropriate, adopted by the Group.
– Analyst meetings: in addition to presentations to analysts that coincide with the announcement of the Group’s full year and half year financial results, the Group’s Chief Financial Officer and the Head of Investor Relations have regularly met with analysts to enhance the financial community’s understanding of the Group. The Chief Executive Officer has met with analysts during the year and is available to do so on request.
– Independent feedback report: during the year the Board commissioned a report from the leading independent adviser Makinson Cowell on investor perceptions of the Company, its management, strategy and communication. This included face-to-face interviews with principal investors to obtain their views on management and business performance. The results were then presented to the Board, with suggestions and improvements being taken forward by management. Recommendations and actions included enhancing our results presentations to include a clear view of our operating model and targets, to introduce a data pack as a single source of all financial information, and to enhance our activity with potential shareholders who are currently underweight or non-holders.
– Engagement with debt investors: the Chief Financial Officer and Head of Treasury have held regular meetings with the Group’s key relationship banks, and have also actively engaged with potential lenders. Update meetings were also held with current and potential holders of public and private debt instruments issued by the Group, and with both Standard & Poor’s and Fitch rating agencies.
– Annual General Meeting: at the Annual General Meeting held in July 2014, the Chairman, Chief Executive Officer and other Directors were available to shareholders for discussion and to answer any questions. All shareholders are welcome to attend the Annual General Meeting.
– Informal feedback: Executive Directors and the Head of Investor Relations also received feedback from analysts and investors during the year both directly and through the Group’s corporate advisers. The Company Secretary also received feedback on governance matters from investors and shareholder bodies. This information was shared with the Board to help members develop their understanding of shareholders’ views and expectations.
RELATIONSHIPS WITH SHAREHOLDERS
The Company recognises the importance of communication with its shareholders. Accordingly, the Board is happy to enter into a dialogue with institutional shareholders based on a mutual understanding of objectives, subject to its duties regarding equal treatment of shareholders and the dissemination of inside information. The Chief Executive Officer and the Chief Financial Officer meet institutional shareholders on a regular basis, and the Chairman periodically contacts the Company’s major shareholders and offers to meet with them. The Board as a whole is kept fully informed of the views and concerns of the major shareholders. When requested to do so, Non Executive Directors are happy to attend meetings with major shareholders.
ENGAGEMENT WITH STAKEHOLDERS
ICG ANNUAL REPORT & ACCOUNTS 2015 CHAIRMAN’S LETTER
BOARD OF DIRECTORS
REMUNERATIONCOMMITTEE REPORTS
DIRECTORS’ REPORT
CORPORATE GOVERNANCE

58 / 59
STRATEGIC REPORT
GOVERNANCE REPORT
FINANCIAL STATEMENTS
AUDIT COMMITTEE REPORT
WE FOCUS OUR WORK ON THE JUDGEMENTAL AREAS
OF ACCOUNTING AND THE QUALITY OF THE GROUP’S
CONTROL ENVIRONMENT. WE MONITOR NEW
ACCOUNTING AND REGULATORY DEVELOPMENTS, AND
CONSIDER THEIR IMPACT ON THE GROUP. WE PERFORM
THIS WORK AGAINST A BACKDROP OF INCREASING
GEOGRAPHICAL AND PRODUCT DIVERSITY IN LINE
WITH OUR STRATEGIC OBJECTIVES.
KEVIN PARRYCHAIRMAN OF THE AUDIT COMMITTEE
KEY ACHIEVEMENTS DURING THE YEAR
– Reviewed the process undertaken and judgements made by management in implementing the new accounting standard on consolidation
– Undertook a detailed review of the valuation of the portfolio
– Challenged the effectiveness and robustness of the external audit
– Established an internal audit function, led by a Head of Internal Audit, supported by co-source partners

accounting of businesses over which we have significant influence as investors or which are joint ventures. This has necessitated a detailed review of our portfolio. The inclusion of such businesses in the consolidated financial statements makes those statements more complex. The Committee challenged management’s judgements, reviewing the process for reaching entity by entity conclusions and carefully considered the appropriateness of additional non-GAAP disclosures to assist understanding of the required presentation.
– Valuation of the portfolio and assessment of impairments – the valuation of unquoted illiquid assets and any impairment requires considerable professional judgement. Consequently, the Committee undertakes a comprehensive review at each balance sheet date challenging management’s assessments based on established processes and a judgemental sample of direct file reviews. This year the assurance was enhanced by the work of internal audit.
– Relationship with the external auditors – it is fundamental that our external auditors are independent of management and provide robust challenge to the financial reporting and related disclosures. Based on our expanded enquiries and enhanced reporting from Deloitte LLP, we are satisfied that Deloitte and the
incumbent audit partner, who rotates off the engagement at this year’s AGM, are effective and that they have robust processes for maintaining their objectivity and independence in accordance with our and their procedures.
– Establishing an internal audit function – the Committee agreed the charter for the operation of Internal Audit; has determined the scope of and reviewed all of the work undertaken during the year; and approved the forward plan for the year ending 31 March 2016.
– Planning to be in a position to report next year on the effectiveness of the risk management and internal control systems, in accordance with the revised Combined Code.
In the year ahead the Committee will continue to monitor new accounting and regulatory developments, particularly as they impact the use of auditors for non audit services, and consider the audit risks associated with the continued growth of the Group.
I would be pleased to discuss the Committee’s work with any shareholder.
Kevin ParryChairman of the Audit Committee
21 May 2015
The following pages set out the Audit Committee report for financial year 2015. The report is structured in five parts:1. Committee governance: roles
and responsibilities, composition and effectiveness
2. Review of the year: the significant financial reporting and auditing issues we addressed
3. Internal controls: the assessment of the adequacy of the control framework
4. External auditors: ensuring their independence, effectiveness and objectivity; and their appointment
5. Internal audit: the establishment and commencement of activities.
DEAR SHAREHOLDER
I am pleased to report that the auditing of the Group expanded in the year ended 31 March 2015 by the establishment of an internal audit function. We appointed our first Head of Internal Audit who reports directly to me in my capacity of Chairman of the Audit Committee and following a competitive tender two co-source service providers: KPMG and Baker Tilly. The internal audit work undertaken is summarised in a new fifth section of this report.
The Group has expanded its investment services during the year. The Committee has consequently focussed on the accounting and control of risks associated with the broadened product range, consistent with the Committee’s established focus on judgemental areas of accounting and the quality of the control environment.
The Audit Committee continues to work closely with the Risk Committee and the Remuneration Committee throughout the year with the aim of effectively covering pertinent topics in the most suitable forum.
From my perspective, the most important issues considered during the year were:
– Implementation of the new accounting standard on consolidation (IFRS10) – the standard requires the full consolidation of businesses or funds that we control as investors; or equity
AUDIT COMMITTEE REPORT CONTINUED
COMMITTEE MEMBERS IN THE YEAR ATTENDANCE
A. KEVIN PARRY 4 / 4 AUDIT COMMITTEE CHAIRMAN
B. PETER GIBBS 3 / 4 NON EXECUTIVE DIRECTOR
C. KIM WAHL 3 / 4 NON EXECUTIVE DIRECTOR
D. KATHRYN PURVES 2 / 2 NON EXECUTIVE DIRECTOR*
E. LINDSEY MCMURRAY 1 / 2 NON EXECUTIVE DIRECTOR*
* Lindsey McMurray ceased to be a Director on 17 October 2014 and was replaced by Kathryn Purves with effect from that date.
ABCDE
ICG ANNUAL REPORT & ACCOUNTS 2015 CHAIRMAN’S LETTER
BOARD OF DIRECTORS
REMUNERATIONCOMMITTEE REPORTS
DIRECTORS’ REPORT
CORPORATE GOVERNANCE

COMMITTEE GOVERNANCE
On behalf of the Board, the Committee encourages and seeks to safeguard high standards of integrity and conduct in financial reporting and internal control.
ROLE AND RESPONSIBILITIES
The Committee meets regularly, at least four times a year. The terms of reference which are set out below are unchanged from last year except in respect of the Committee’s duties relating to internal audit, as set out in the ultimate and penultimate bullet points:
– Selecting and recommending the appointment and reappointment of the external auditor, approving their terms of reference and fees
– Reviewing the performance of the external auditor and ensuring the rotation of audit partner to an individual with relevant experience and skills
– Reviewing the independence and remuneration of the external auditor and the relationship between audit and non audit work performed by the external auditor
– Reviewing the annual and interim accounts before they are presented to the Board, in particular addressing any significant issues arising from the audit; accounting policies and clarity of disclosures; compliance with applicable accounting and legal standards; and issues requiring significant judgement
– Reviewing the provisioning policy for the investment portfolio on a six monthly basis
– Monitoring the integrity of the financial statements of the Group, including its annual and half yearly reports, interim management statements and any other formal announcement relating to its financial performance
– Approving the appointment or termination of the Head of Internal Audit, approving the internal audit charter and monitoring the effectiveness of the internal audit function in the context of the Group’s overall risk management framework
– Reviewing and assessing the annual internal audit plan, receiving internal audit reports, monitoring management’s responsiveness to internal audit findings and recommendations.
The Committee has fulfilled its responsibilities during the year and confirms the Group is in compliance with The Statutory Audit Services for Large Companies Market Investigation (Mandatory Use of Competitive Tender Processes and Audit Committee Responsibilities) Order 2014.
COMPOSITION
The Committee consists of independent Non Executive Directors only. The current members are Kevin Parry (Chairman of the Committee), Peter Gibbs, Kim Wahl and Kathryn Purves. Lindsey McMurray was a member of the Committee up to the date of her resignation from the Board.
Biographical details can be found on pages 50 and 51.
The Committee members have a wide range of business and financial experience, including risk management, fund management and investment, regulation and compliance, M&A, tax and international business practices. These skills enable the Committee to fulfil its terms of reference in a robust and independent manner. Kevin Parry, a Chartered Accountant, was previously the Chief Financial Officer at Schroders plc, a managing partner at KPMG and currently chairs two other audit committees. The Board considers that he has recent and relevant financial experience for the purposes of the Code.
The Executive Directors and Chairman of the Board are not members of the Committee but regularly attend meetings at the invitation of the Chairman of the Committee, together with Deloitte LLP, the Company’s external auditor and the Head of Internal Audit.
The Committee meets the external auditors and Head of Internal Audit without management present twice a year to ensure that they are receiving full cooperation from management, obtaining all the information they require and are able to raise matters directly with the Audit Committee if they consider it is desirable to do so.
EFFECTIVENESS
The Committee reviews its terms of reference and effectiveness annually. The terms of reference are summarised above. The 2014 effectiveness review identified that Audit Committee members would like more training on market developments. Special sessions have commenced for all Non Executive Directors. The first such session was on global marketing encompassing compliance requirements.
The 2015 effectiveness review largely mirrored the comprehensive 2014 review to allow direct comparison of performance. This year it encouraged narrative as well as quantitative assessment. It was completed by all Audit Committee members and regular invited attendees. The review included best practice questions. The results confirmed that the Committee continues to operate effectively, fulfils its terms of reference and receives reliable and trustworthy information from management and auditors. Reviewers commented on the need to monitor closely the development of the internal audit function. Consequently, a formal review of Internal Audit’s performance will take place in the latter part of the next financial year. In addition, members noted that the breadth of work in this area had increased and that sufficient time should be allowed to enable full consideration of the relevant issues.
60 / 61
STRATEGIC REPORT
GOVERNANCE REPORT
FINANCIAL STATEMENTS

SUMMARY OF MEETINGS IN THE YEAR
The Committee held four meetings during the year in line with the financial reporting dates. In addition, in May 2015 there was one sub-Committee meeting to review key aspects of the report and accounts. The bulk of the Committee’s time has been spent on financial reporting policies and presentation, the valuation of investments and the external and internal audit arrangements.
REVIEW OF THE YEAR
Over the course of the year, the Committee considered and discussed the following significant matters:
THE ISSUE AND ITS SIGNIFICANCE
WORK UNDERTAKEN
COMMENTS AND CONCLUSION
FINANCIAL REPORTING
The content of the annual, semi-annual and quarterly financial reporting needs to be appropriate, complying with laws and regulation. (see page 105 and the Auditors’ report on pages 106 to 110)
We reviewed all sections of the Annual Report having particular regard for the Committee’s specific responsibilities for the financial statements. We spent considerable time assessing the implications of IFRS10 (Consolidated Financial Statements). Prior to the interim results, we reviewed management’s assessment as to whether the Group met the definition of an investment entity. That determination determines the presentation of the consolidated financial statements. We reviewed the Group’s strategic objectives to assess whether they were consistent with being an investment entity and considered whether the Group managed its investments on a fair value basis. This was re-reviewed following the interim results because an amendment to the accounting standard changed the definition of an investment entity. We subsequently reviewed and challenged work undertaken to assess which third party funds and portfolio companies are either controlled by the Group or over which the Group exercises significant influence.
We reviewed all accounting policies for continued appropriateness and consistency.
We concluded at the half year that the Group met the definition of an investment entity and had appropriately prepared its interim financial statements on that basis.
We reconsidered this conclusion following the publication of the amendment to the accounting standard and concluded that the Group no longer met the definition of an investment entity. We concluded that the Group did not control any portfolio companies, exercised significant influence and controlled eight credit funds. Accordingly the controlled entities have been consolidated into the Group’s financial statements and the entities over which the Group exercises significant influence have been equity accounted.
We concluded that the accounting policies (see pages 119 to 123) are appropriate and, based on our enquiries of management and external auditors, are being properly applied. We also concluded that the areas of judgement (see pages 123 and 124) are properly explained. We gained comfort from financial management and the external auditors that the Group complied with reporting requirements.
Taken as a whole, the Annual Report needs to be fair, balanced and understandable so that it is relevant to readers. (see page 105 of the Annual Report)
We held preparatory discussions with management to determine the format of the Annual Report and then assigned responsibilities for the content of the Annual Report and its overall cohesion and understandability. We commented on design and detailed content, ensuring that feedback on the prior year Annual Report had been addressed and examples of best practice had been carefully considered in the context of the Group. A late draft of the Report and Accounts was reviewed by both the Audit Committee and the Board. We used the Executive Directors’, the external auditor’s and the Committee’s knowledge to determine the overall fairness, balance and understandability prior to final approval by the Board.
We received confirmation that individuals’ responsibilities had been fulfilled and confirmed that the overall report was consistent with the Directors’ knowledge. This allowed the Audit Committee and the Board to be satisfied that the Annual Report taken as a whole is fair balanced and understandable.
We will continue to monitor feedback for future enhancements.
AUDIT COMMITTEE REPORT CONTINUED
ICG ANNUAL REPORT & ACCOUNTS 2015 CHAIRMAN’S LETTER
BOARD OF DIRECTORS
REMUNERATIONCOMMITTEE REPORTS
DIRECTORS’ REPORT
CORPORATE GOVERNANCE

THE ISSUE AND ITS SIGNIFICANCE
WORK UNDERTAKEN
COMMENTS AND CONCLUSION
FINANCIAL REPORTING CONTINUED
Investments represent 78% of our total assets. 79% are carried at fair value and 21% are carried at amortised cost. As the assets are mainly unquoted and illiquid, considerable professional judgement is required in determining their valuations and associated provisions.(see notes 4 and 9 to the financial statements and the Auditors’ report on pages 106 to 110)
We reviewed a detailed paper on the valuation process management have undertaken and the judgements made in determining the value of the portfolio. In addition to reliance on executive management procedures and the work of the auditors, the Committee continued its practice of a member of the Committee (who is selected in rotation) reviewing a small judgemental sample of the investments including a file review and challenge of management. The review focused on key assumptions, macro-economic factors and sponsorless transaction monitoring. The Committee accordingly gained substantive evidence of the appropriateness of reliance on compliance with the Group’s valuation procedures.
At the year end, the balance sheet also included an asset of £26.9m and a liability of £13.4m of derivatives not held for hedging; and £14.2m of secondary private equity assets held via a fund structure. These investments represent a diversification of the business into alternative credit and secondaries. Accordingly, we reviewed a paper from executive management on the valuation methodologies.
The Committee concurred with the valuations and did not determine there was a need for any adjustment.
Provisions are required for actual and potential liabilities that cannot be quantified accurately as to timing or quantum.(see note 10 of the financial statements]
We reviewed the Group’s legal, tax and other exposures. For the 2014 Annual Report it was determined that the biggest judgements concerned tax and, in particular, a long standing employee taxation issue. The issue affected former and current employees and there was a risk of conflicts of interests arising. Accordingly, the Chairmen of the Remuneration and Audit Committees formed an ad hoc group to oversee the communications with HMRC and current and former employees based on professional advice and opinions. The work allowed affected former and current employees to enter into a settlement agreement with HM Revenue and Customs and for the settlement to be properly quantified.
The Committee determined that in 2014, there remained uncertainty over the quantum of the EBT settlement that it anticipated concluding with HMRC and accordingly it was premature to amend existing estimates which were quantified in the notes to the financial statements. Following settlement, the Committee concluded that the financial impact of the settlement was appropriately disclosed in note 7 of the 2015 Annual Report.
Other changes in estimates of other provisions were determined to be appropriate.
Revenue recognition and cash flows are not entirely aligned which can result in income being recognised prematurely or too late. (see note 3 to the financial statements and the Auditors’ report on pages 106 to 110)
During the year, there was the early redemption of a major fund, European Mezzanine Fund 2006 which increased income recognition in 2015. We reviewed the income recognition of performance fees carefully to ensure that the treatments were consistent with the Group’s accounting policies. Additional assurance on fairness was obtained from an internal audit review. In FY15 all conditions relating to performance fees had been met by the year end.
We concluded that revenue has been properly recognised in the financial statements.
Non-GAAP measures aid understanding of the financial statements but must not detract from GAAP measures. (see KPIs on pages 22 and 23)
The Group uses the following non-GAAP measures:
– Total AUM – Fee rate on new AUM – Performance of investments – Return on equity
We discussed the make-up of the non-GAAP measures and reviewed consistency with prior years.
We concluded that whilst the consolidation of credit funds and equity accounting of some portfolio companies are required under IFRS10, the accounting is inconsistent with the management of the investments and the way that credit agencies and Committees review the Group. Accordingly, the non-GAAP measures assist important readers of the financial statements.
62 / 63
STRATEGIC REPORT
GOVERNANCE REPORT
FINANCIAL STATEMENTS

AUDIT COMMITTEE REPORT CONTINUED
THE ISSUE AND ITS SIGNIFICANCE
WORK UNDERTAKEN
COMMENTS AND CONCLUSION
FINANCIAL REPORTING CONTINUED
The Group fails to comply with regulations to which it is subject.
During the year the Committee was advised that management had identified a breach in the level of regulatory capital within a regulated subsidiary company. The breach had been advised to the regulator and immediately rectified.
KPMG was appointed to review the circumstances giving rise to the breach and to make recommendations for improvements in the systems and controls. The Committee oversaw the scope, findings and recommendations of KPMG’s review and monitored the implementation of the actions taken by management in response to KPMG’s recommendations.
The Group is highly focused on compliance (see Risk Committee report on pages 68 to 72). Consequently, the Committee wished to determine the root cause of the failing whilst recognising that the Group had sufficient capital and the compliance breach related to the allocation of capital between Group companies.
Steps including additional sign offs and training have been implemented to reduce the likelihood of a repeat or similar error.
EXTERNAL AUDIT
The auditor needs to be independent of management to report on the truth and fairness of the Annual Report without conflicts of interest.(see the Auditors’ report on pages 106 to 110)
We reviewed the standing policies on services that can be provided by Deloitte (see External auditors on page 66) for their continued appropriateness as to scope and fees. We received confirmations from management and Deloitte of adherence and agreed the fees paid. We also reviewed the audit fees in the context of the size and complexity of the audit.
We concluded that with only minor amendments, our policy remains appropriate and in line with best practice.
We determined that the Group audit fee needed to increase from £0.8m to £0.9m to reflect the increase in scope and complexity of the work undertaken by Deloitte. This is in part due to the expansion of the business and in part due to the work surrounding new accounting standards.
The audit process needs to be effective so that the auditor’s opinion is robust.(see the Auditors’ report on pages 106 to 110)
We discussed the risks faced by the Group extensively with Deloitte. We determined that we had a shared understanding of the risks.
Whilst planning the audit, Deloitte set out for the Audit Committee the key tests that they would perform on the higher risk areas and the Committee was satisfied with the proposed scope. The Committee requested detailed feedback on findings and discussed those findings prior to the approval of the Annual Report.
The Committee asked Deloitte whether the audit of ICG for 2014 had been independently quality reviewed either by the firm or by a regulator. There has been no such review.
The Committee chairman, the CFO and the Group Financial Controller had an extended discussion with Deloitte about its approach to the audit of the financial statements and was satisfied based on the representations that the approach was directed to provide a reliable audit opinion with a reasonable expectation of detecting errors, irregularities and fraud.
The generic findings of the Audit Quality Review of Deloitte were reviewed for application to the Group.
For the first time, the Committee also received oral reports from subsidiary audit partners in Hong Kong and Sydney at the conclusion of their local audits.
Having extended the scope of our review of Deloitte’s work, we are satisfied that the audit is effective and the opinion is robust.
ICG ANNUAL REPORT & ACCOUNTS 2015 CHAIRMAN’S LETTER
BOARD OF DIRECTORS
REMUNERATIONCOMMITTEE REPORTS
DIRECTORS’ REPORT
CORPORATE GOVERNANCE

THE ISSUE AND ITS SIGNIFICANCE
WORK UNDERTAKEN
COMMENTS AND CONCLUSION
EXTERNAL AUDIT CONTINUED
The audit is conducted to an appropriate level of materiality to ensure that there is strong comfort that the financial statements are true and fair.(see the Auditors’ report on pages 106 to 110)
We determined in conjunction with Deloitte that it is appropriate to base materiality on 1% of net assets. Further for FMC, it was determined that materiality should be set at 5% of Group pre-tax profits excluding capital gains and losses and impairments. This is a change from the 2014 approach which used a measure of 10% of normalised profits, being profit before capital gains and losses and impairments.
The FY15 profit is overstated by £0.2m as a result of audit differences, which will not recur in FY16. The Committee has deemed this amount immaterial.
The audit materiality was set at approximately 1% of net assets equivalent to £14.4m (2014: £12m). This is equivalent to 8.1% (2014: 7.6%) of pre-tax profits. As explained in the Auditor’s report on page 106, a materiality of £4.4m, equating to 5% of normalised profit before tax, has been used in FMC. The Committee considered this provides appropriate comfort as to the quantification of the robustness of Deloitte’s audit opinion.
Whilst the overall level of materiality was similar to the previous year, the Committee preferred the logic of the changed approach and its consistency with other similar companies.
INTERNAL AUDIT
The establishment of an internal audit capability.(see the Governance framework on page 52)
During the year the Committee considered and approved the formation of an internal audit function.
Following the establishment of the function the Committee considered and approved the Internal Audit Charter and Strategy, considering in detail compliance with the Internal Audit Financial Services Code.
The Committee discussed the scope and findings of the reviews undertaken and is actively monitoring progress against agreed actions.
We are satisfied that the structure and resourcing of the function is appropriate. We consider that the plan over an estimated three year period will cover the organisation’s key risks and has commenced work by focussing on the areas the Committee believes should be covered as a priority.
64 / 65
STRATEGIC REPORT
GOVERNANCE REPORT
FINANCIAL STATEMENTS

AUDIT COMMITTEE REPORT CONTINUED
In addition to the significant matters addressed above, the Committee maintained a rolling agenda of items for its review including the capital strategy, financial and treasury management capabilities, the going concern concept of accounting (see page 100, the viability statement on page 36 and the Auditors’ report on pages 106 to 110), accounting developments and the auditors’ management letter. No issues of significance arose.
INTERNAL CONTROLS
Risk management and internal control matters are the responsibility of the Group’s Risk Committee. Its report is set out on pages 68 and 72. The Audit Committee reviewed the competence and quantity of the financial management resource and was satisfied that the complement was able to fulfil its first line of defence duties. It was noted that projects often required external specialised resource.
The Group has an established control framework as described on page 36. The framework is designed to manage but not eliminate risks and is designed to provide reasonable but not absolute assurance against material losses or misstatements. The Group is expanding and this adds to complexity and risk.
With effect from 2015, the revised Combined Code expands the Board’s responsibilities for the management of risk. This is addressed further in the report of the Risk Committee.
EXTERNAL AUDITOR
Deloitte LLP has been the Company’s external auditor since its commencement of trading. In accordance with professional and regulatory standards the lead audit partner has changed regularly since that time to safeguard the independence and objectivity of the audit process. The most recent audit partner rotation was in 2010 and the current audit partner’s five year term ends at this year’s AGM. We have been monitoring audit regulatory developments determined by the FRC, Competition Commission and the EU. These require us to change our audit firm by no later than after the 2020 year end. Absent any major service or quality issues, the desirability of a change of auditor is a delicate balance between a ‘fresh pair of eyes’ and accumulated knowledge applied to produce a robust audit. Deloitte will rotate their audit partner ahead of the 2016 audit.
David Barnes will succeed Calum Thomson as our audit partner, and we are satisfied that he has the experience and industry knowledge to be the lead audit partner. In good time for the 2020 year end the audit will be tendered and rotated to another firm of auditors. These plans will be kept under annual review and if legislation changes, or there are any concerns as to Deloitte’s independence, the quality of their audit or the service levels, the audit tender might be undertaken sooner.
The Committee undertakes an annual evaluation to assess the independence and objectivity of the external auditor and the effectiveness of the audit process, taking into consideration relevant professional and regulatory requirements. The assessment focuses on quality of service and so aims to be broader than just reaching views on a particular audit. This assessment is based on the results of questionnaires completed by the Committee members, the Executive Directors and other relevant senior management. The results of the evaluation were last reported to the Audit Committee in September 2014. Having completed the review, and discussed its findings with the auditors, the Committee remains content with Deloitte’s work whilst identifying some areas for service improvement including early discussion of the practical applications of new accounting standards. The Audit Committee discussed the output with Deloitte and they have assured the Committee they will seek to address the areas where they can improve the service delivery.
The Committee regularly monitors non audit services being provided to the Group by its external auditor to ensure there is no impairment to their independence or objectivity. Stringent procedures are in place to ensure that all significant non audit work performed by the auditor in excess of £50,000 is approved in advance by the Committee. Engagements are only approved if they do not and will not impair, or appear to impair, the auditor’s judgement or independence. The procedures set out the categories of non audit services which the external auditor will and will not be allowed to provide to the Group, including those which are pre-approved by the Committee and those which require specific approval before they are contracted for, subject to de minimis levels. A copy of the policy can be found on the Group’s website www.icgplc.com.
ICG ANNUAL REPORT & ACCOUNTS 2015 CHAIRMAN’S LETTER
BOARD OF DIRECTORS
REMUNERATIONCOMMITTEE REPORTS
DIRECTORS’ REPORT
CORPORATE GOVERNANCE

During the year the Group paid £0.3mto Deloitte LLP for the provision of corporate non audit services. Of this, £0.1m is in respect of services in their capacity as auditor and £0.2m in the form of tax compliance and advisory services not related to the audit of the financial statements. These were provided by Deloitte as they are judged to be a market leader in these areas, having a reputation for quality, and having a local presence in the countries in which the services were performed. Audit objectivity and independence was safeguarded in these instances through the advice being provided by partners and staff that have no involvement in the audit of the financial statements. The advice was not dependent on a particular accounting treatment and the outcome or consequences of the advice did not have a material effect on the Group’s financial statements. No services were provided pursuant to contingent fee arrangements.
A detailed analysis of fees paid to Deloitte LLP is shown in note 11 on page 142.
In addition Deloitte provides services to funds that are managed by the Group but over which it does not exercise control. The fees paid by the Group to the auditors are set out in note 11 to the financial statements. The scope of the audit and Deloitte’s fee was negotiated and agreed by the Committee. All non audit services were approved by the Committee.
EU audit legislation introduces certain restrictions on the provision of non audit services including a 70% non audit services fee cap. The restrictions on non audit services will become effective two years from the date of entry into force of the regulation; as such, it is expected to be in force for the 2016 financial year. The FRC’s consultation period on the UK application of these rules closed at the end of March 2015. We await the outcome of the consultation before determining what actions, if any, need to be undertaken.
INTERNAL AUDIT
Last year, we reported that we would establish an internal audit function during the course of the year ended 31 March 2015. We were keen to ensure that the business embraced the formation of the function. We selected an internal candidate to head the function who had previously worked closely with the Audit Committee on resolving the personal tax issues referred to above. During that time she demonstrated an ability to challenge management constructively and a strong knowledge of the business. She is not a qualified auditor but in conjunction with co-sourcing third party internal auditors, we considered that we would be able to establish a strong function. Following a competitive tender, the Audit Committee selected two firms from which to source internal audit services: RSM Baker Tilly LLP and KPMG LLP. Baker Tilly will typically undertake general audits with a UK bias and KPMG will typically undertake specialist regulatory audits with less of a UK bias. Both firms are additionally transferring internal audit knowledge to the Group. Whilst the function is still less than one year old, initial indications are that the arrangements are working well. The arrangements will be formally reviewed in the latter part of the next financial year.
The Audit Committee has agreed the charter and strategy for the internal audit function, the terms of business with the co-source providers; the necessary resources and the scope of all audits. The duties of the Audit Committee itself have broadened to encompass its responsibility for internal audit. For example, the internal auditor attends Audit Committee meetings at which she presents findings, the Committee monitors responses to internal audit findings and the Committee meets in private with the Head of Internal Audit without management being present.
During the year, four audits were performed: IT governance and key controls; compliance framework and governance; a review of the European Mezzanine Fund 2006 transaction for valuation and conflicts of interest; a review of the valuations and monitoring processes.
A programme of reviews for the next financial year has been approved by the Audit Committee which will be reviewed on a quarterly basis for amendment due to changed circumstances.
66 / 67
STRATEGIC REPORT
GOVERNANCE REPORT
FINANCIAL STATEMENTS

ICG ANNUAL REPORT & ACCOUNTS 2015 CHAIRMAN’S LETTER
BOARD OF DIRECTORS
REMUNERATIONCOMMITTEE REPORTS
DIRECTORS’ REPORT
CORPORATE GOVERNANCE
RISK COMMITTEE REPORT
THE IDENTIFICATION, CONTROL, MITIGATION AND
REPORTING OF RISKS IS CORE TO THE SUCCESSFUL
DELIVERY OF THE GROUP’S STRATEGIC OBJECTIVES.
OUR WORK FOCUSES ON ENSURING THE GROUP
UNDERSTANDS THE MATERIAL RISKS ARISING FROM
BOTH THE GEOGRAPHIC AND PRODUCT EXPANSION OF
THE GROUP AND FROM NEW EXTERNAL REGULATIONS,
AND MANAGES THOSE RISKS TO WITHIN THE BOARD’S
RISK APPETITE.
KEVIN PARRYCHAIRMAN OF THE RISK COMMITTEE
KEY ACHIEVEMENTS DURING THE YEAR
– Reviewed the process undertaken by management to stay abreast of, and implement, regulatory changes
– Undertook detailed reviews of the risks associated with the Group’s geographic and product expansion
– Confirmed the effectiveness of management’s process for managing the unplanned loss of key employees
– Advanced the recruitment of the Chief Risk Officer
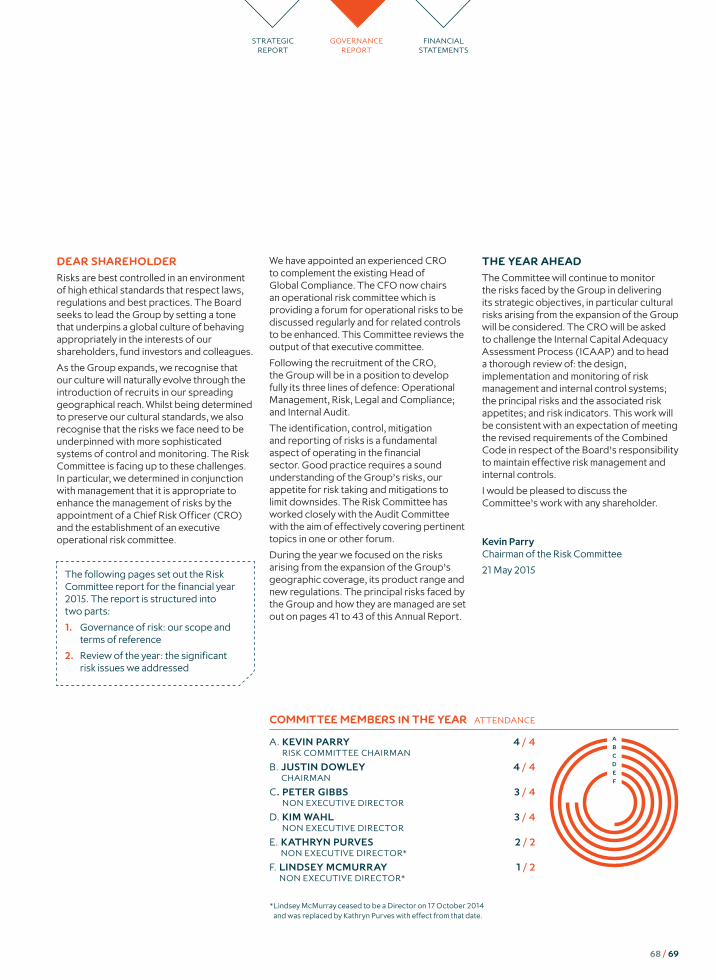
DEAR SHAREHOLDER
Risks are best controlled in an environment of high ethical standards that respect laws, regulations and best practices. The Board seeks to lead the Group by setting a tone that underpins a global culture of behaving appropriately in the interests of our shareholders, fund investors and colleagues.
As the Group expands, we recognise that our culture will naturally evolve through the introduction of recruits in our spreading geographical reach. Whilst being determined to preserve our cultural standards, we also recognise that the risks we face need to be underpinned with more sophisticated systems of control and monitoring. The Risk Committee is facing up to these challenges. In particular, we determined in conjunction with management that it is appropriate to enhance the management of risks by the appointment of a Chief Risk Officer (CRO) and the establishment of an executive operational risk committee.
We have appointed an experienced CRO to complement the existing Head of Global Compliance. The CFO now chairs an operational risk committee which is providing a forum for operational risks to be discussed regularly and for related controls to be enhanced. This Committee reviews the output of that executive committee.
Following the recruitment of the CRO, the Group will be in a position to develop fully its three lines of defence: Operational Management, Risk, Legal and Compliance; and Internal Audit.
The identification, control, mitigation and reporting of risks is a fundamental aspect of operating in the financial sector. Good practice requires a sound understanding of the Group’s risks, our appetite for risk taking and mitigations to limit downsides. The Risk Committee has worked closely with the Audit Committee with the aim of effectively covering pertinent topics in one or other forum.
During the year we focused on the risks arising from the expansion of the Group’s geographic coverage, its product range and new regulations. The principal risks faced by the Group and how they are managed are set out on pages 41 to 43 of this Annual Report.
THE YEAR AHEAD
The Committee will continue to monitor the risks faced by the Group in delivering its strategic objectives, in particular cultural risks arising from the expansion of the Group will be considered. The CRO will be asked to challenge the Internal Capital Adequacy Assessment Process (ICAAP) and to head a thorough review of: the design, implementation and monitoring of risk management and internal control systems; the principal risks and the associated risk appetites; and risk indicators. This work will be consistent with an expectation of meeting the revised requirements of the Combined Code in respect of the Board’s responsibility to maintain effective risk management and internal controls.
I would be pleased to discuss the Committee’s work with any shareholder.
Kevin ParryChairman of the Risk Committee
21 May 2015The following pages set out the Risk Committee report for the financial year 2015. The report is structured into two parts:
1. Governance of risk: our scope and terms of reference
2. Review of the year: the significant risk issues we addressed
ABCDEF
COMMITTEE MEMBERS IN THE YEAR ATTENDANCE
A. KEVIN PARRY 4 / 4 RISK COMMITTEE CHAIRMAN
B. JUSTIN DOWLEY 4 / 4 CHAIRMAN
C. PETER GIBBS 3 / 4 NON EXECUTIVE DIRECTOR
D. KIM WAHL 3 / 4 NON EXECUTIVE DIRECTOR
E. KATHRYN PURVES 2 / 2 NON EXECUTIVE DIRECTOR*
F. LINDSEY MCMURRAY 1 / 2 NON EXECUTIVE DIRECTOR*
* Lindsey McMurray ceased to be a Director on 17 October 2014 and was replaced by Kathryn Purves with effect from that date.
68 / 69
STRATEGIC REPORT
GOVERNANCE REPORT
FINANCIAL STATEMENTS

GOVERNANCE OF RISK
On behalf of the Board, the Committee encourages and seeks to safeguard high standards of risk management and effective internal controls.
ROLES AND RESPONSIBILITIES
The Committee meets regularly, at least three times a year, and is responsible for:
– Reviewing the Group’s identification of current and forward looking risk exposures
– Advising the Board on risk appetite and tolerance, ensuring that final judgments are properly reflected in the ICAAP
– Assessing the risk management framework and the effectiveness of the Group’s risk management systems by commissioning and reviewing reports on effectiveness
– Reviewing and approving the statements to be included in the Annual Report concerning risk management
– Reviewing the Group’s procedures for identifying, assessing, controlling and mitigating the material risks faced by the Group
– Ensuring procedures allow for proportionate and independent investigation of identified issues and appropriate follow up action
– Advising the Remuneration Committee on the alignment of remuneration with risk appetite
COMPOSITION
The Committee consists of Non Executive Directors only. The current members are Kevin Parry (Chairman of the Committee), Justin Dowley, Peter Gibbs, Kathryn Purves and Kim Wahl. Lindsey McMurray was a member of the Committee up to the date of her resignation from the Board.
Biographical details can be found on pages 50 and 51.
The Committee members have a wide range of business and financial experience, including risk management, fund management and investment, regulation and compliance, M&A, tax and international business practices. In particular, Kevin Parry is the former chairman of Schroder plc’s executive risk committee and Kathryn Purves is the Chief Risk Officer of Partnership Insurance Group plc. These skills enable the Committee to fulfil its Terms of Reference in a robust and independent manner.
The Executive Directors of the Board are not members of the Committee but attend meetings at the invitation of the Chairman of the Committee.
EFFECTIVENESS
The Committee reviews its Terms of Reference and effectiveness annually.
The 2014 effectiveness review identified that Risk Committee members would like more training on market developments. Special sessions have commenced for all Non Executive Directors. The first such session was on global marketing encompassing compliance requirements. Additionally, Committee members requested more formality in papers prepared for the Committee and more time for discussion of emerging issues. Consequently, a rolling agenda of specific risk reviews was established based on papers prepared by management and there was a round table session to re-identify risks that was subsequently refined to restate the risk register.
The 2015 effectiveness review largely mirrored the comprehensive 2014 review to allow direct comparison of performance. It was completed by all Risk Committee members and regular invited attendees. The review included best practice questions. The results confirmed that the breadth of the Committee’s work has expanded in line with Group developments and that it operates effectively, fulfils its terms of reference and receives reliable and trustworthy information from management. Most respondents looked forward to the presence of a CRO which will allow for the preparation of more comprehensive papers and improvements in formal regulatory documents.
STAYING ABREAST OF REGULATORY CHANGE
The Group is exposed to risk as the regulatory requirements for its activities change. Consequently the Committee received regular updates of known and anticipated regulatory changes and challenged management’s approach to preparing for and implementing new requirements. We worked through a specific example of how we manage compliance risk overseas using outsourced partners.
KEY BUSINESS INITIATIVES
During the year the Group expanded its activities resulting in new commercial and regulatory exposures. The Committee focused on the risks associated with those key initiatives. In particular, we looked at the use of derivatives for alpha generation in the alternative credit fund and associated regulatory risks. We made changes to the investment oversight of derivatives by the establishment of a new executive investment committee. We also supported the establishment of an executive operational risk committee comprising the infrastructure heads of departments.
RISK COMMITTEE REPORT CONTINUED
ICG ANNUAL REPORT & ACCOUNTS 2015 CHAIRMAN’S LETTER
BOARD OF DIRECTORS
REMUNERATIONCOMMITTEE REPORTS
DIRECTORS’ REPORT
CORPORATE GOVERNANCE

REVIEW OF THE YEAR
The Committee held four meetings during the year. In each of its meetings, it discusses top and emerging risks with management, reviews the work of the Operational Risk Committee and receives reports on global compliance (including the monitoring programme) and regulatory developments; funds’ risk management and operational controls. Other work is undertaken periodically, either once or twice a year. Over the course of the year the Committee considered and discussed the following significant matters:
THE ISSUE AND ITS SIGNIFICANCE
WORK UNDERTAKEN
COMMENTS AND CONCLUSION
The Group is exposed to risk as the regulatory requirements for its activities change. (see page 41)
The Committee has received regular updates setting out the enacted and expected changes to regulations to which the Group is subject. In particular, the Committee reviewed readiness for compliance with the Alternative Investment Fund Management Directive (EU); the European Market Infrastructure Regulation (EU); the Capital Resources Directive IV (EU) and the Foreign Account Tax Compliance Act (US) all of which materially affect the Group. The Committee monitored overseas registrations with the SEC (US), CFTC (US) and MAS (Singapore) in addition to overseeing the establishment of a Japanese mezzanine fund, in partnership with Nomura, and a senior loan fund in Australia, utilising existing UK regulatory licences. The Committee received a presentation from Travers Smith on future UK regulations that would impact the Group. In addition, the Committee has specifically reviewed the arrangements in place to support the marketing function in complying with the complex and country specific requirements for their activities working through a country specific example.
The regular updates provided sufficient information to enable the Committee to be satisfied that the Group managed its compliance affairs with appropriate due diligence. The Committee supported the recruitment of a deputy head of global compliance based in New York with particular responsibility for US compliance.
The Committee decided that the programme of inviting local advisers to provide updates on the ongoing and expected regulatory changes in their region should continue.
During the year the Group expanded its activities resulting in new regulatory exposures. (see page 41)
The Committee has been kept informed of the development of policies and procedures to satisfy the respective regulations arising from undertaking new regulated activities in existing or new jurisdictions. It has challenged management’s assessment of the adequacy of the proposed policies and procedures.
The Committee was and is satisfied that appropriate policies and procedures were and are in place to meet the Group’s expanded regulatory obligations.
The unplanned loss of one or more key employees is considered a key risk to the Group.(see page 43)
The Committee has reviewed employee turnover across the Group, with particular attention paid to those considered to be key individuals. The Committee considered any mitigation of key employee risk and discussed the possible consequences of the growth in headcount as the business expands its activities.
The Committee reviewed key leavers and the reason for their departure and concluded that the Group is effectively managing this risk.
This remains a significant risk and will be kept under review.
Other material risks (see pages 41 to 43) – the Group uses a risk scorecard as a key part of its risk management framework. The scorecard summarises the material risks faced by the Group, the tolerance of the Group to each respective material risk, and key risk indicators that indicate, for each material risk, the extent to which the tolerance is being approached or has been exceeded.
The Committee has overseen and challenged the assessment and management of material risks faced by the Group by reference to the risk scorecard which has been presented to the Committee regularly during the year.
The challenge reaffirmed the relevance of the majority of the prevailing material risks while highlighting the need to add or remove a small number of material risks as the Group’s business strategy and its execution evolves.
The Committee considers that the material risks faced by the Group and the tolerances and key risk indicators for each material risk are adequately captured by the process. The Committee is satisfied that the risk scorecard is an effective mechanism for identifying and monitoring the material risks to which the Group is exposed but decided that there needs to be some recalibration of tolerances to reflect the growth in the size of the Group.
70 / 71
STRATEGIC REPORT
GOVERNANCE REPORT
FINANCIAL STATEMENTS

THE ISSUE AND ITS SIGNIFICANCE
WORK UNDERTAKEN
COMMENTS AND CONCLUSION
Treasury risks – including liquidity risk, foreign exchange risk and interest rate risk. (see page 41)
The Committee has received regular updates of the activities of the Treasury Committee in managing the Group’s exposure to financial risks and, in particular, the Group has suffiient resources and liquidty to meet its requirements.
The Committee concluded that the Treasury Committee was effective in managing these risks for the Group and will continue to receive regular reports of their activities.
Funds risk management and operational controls.(see page 41)
The Committee received regular reports on the risk management framework established in respect of the funds the Group advise or manage.
The Committee paid particular attention in the year to the framework developed to support the new investment strategy, Alternative Credit.
The Committee is satisfied that the risk management and operation control systems are effective and that the regular reports it receives are sufficient to monitor effectively the risks.
The Committee remains highly focussed on the development of controls over Alternative Credit and will carry out a deep review in the next financial year.
ICAAP – the Internal Capital Adequacy Assessment Process of the FCA.
During the year, the Committee formally reviewed the current and future impact of the material risks facing the Group on the Group’s capital adequacy as required under the ICAAP. The ‘Pillar 3’ disclosures required to be made public as a result are available on the Company’s website at www.icgplc.com.
The Committee is satisfied that the Group has and will have adequate capital in the event of the crystallisation of material risks faced by the Group.
The new CRO will be tasked with challenging the ICAAP.
Specific risk reviews. The Committee reviewed the management of seed capital; IT systems and cyber security; concentration of exposures to geographies and industries.
The Committee has tasked management with reducing the quantity of seed capital applied to each strategy and is fully supportive of the extensive investment being undertaken in IT systems, including security.
Compliance with internal policies. Internal policies are reviewed on a rolling basis. For example, reviews covered the financial crime avoidance policy (including money laundering); the anti-bribery and corruption policy; the whistleblowing policy; the conflicts of interest policy and the liquidity policy.
The Committee approved amendments for geographical and product expansion and was satisfied that the Group had complied with its policies.
INTERNAL AUDIT AND COMPLIANCE MONITORING
There were four internal audits concluded during the year encompassing IT governance and general controls; conflicts of interest in connection with the early redemption of European Fund IV, the compliance function and valuation and monitoring processes. The findings of each report were presented by the internal audit team to the Committee who discussed their findings, recommendations for improvements and management responses.
Additionally, in March the Committee reviews and approves the programme of monitoring to be undertaken during the following fiscal year and at each of its subsequent meetings reviews the status and output of compliance monitoring actually undertaken relative to the planned programme. During the year the Committee ensured appropriate monitoring was undertaken in accordance with the approved programme for the year and oversaw the appropriate resolution of any significant matters of concern identified.
The provisional scope of the internal audit programme for the next financial year has been agreed with the Committee. It is designed to permit changes to the programme in the light of changed circumstances.
AMENDMENTS TO THE COMBINED CODE
The Committee has considered the new requirements of the Combined Code in respect of a viability statement and reporting on the existing risk management framework and processes. The viability statement was carefully considered by the Audit Committee and work has commenced to allow the Group to be in a position to make relevant risk related statements in next year’s Annual Report and Accounts.
RISK COMMITTEE REPORT CONTINUED
ICG ANNUAL REPORT & ACCOUNTS 2015 CHAIRMAN’S LETTER
BOARD OF DIRECTORS
REMUNERATIONCOMMITTEE REPORTS
DIRECTORS’ REPORT
CORPORATE GOVERNANCE

72 / 73
STRATEGIC REPORT
GOVERNANCE REPORT
FINANCIAL STATEMENTS
NOMINATIONS COMMITTEE REPORT
WE FOCUS ON THE COMPOSITION OF THE BOARD AND THE SKILLS AND EXPERIENCE OF ITS MEMBERS. THIS ENSURES THAT THE BOARD HAS THE NECESSARY KNOWLEDGE AND BROAD MARKET AWARENESS TO MEET THE CHALLENGES FACED BY THE GROUP.
JUSTIN DOWLEYCHAIRMAN OF THE NOMINATIONS COMMITTEE
KEY ACHIEVEMENTS DURING THE YEAR
– Continuous review of the size, structure and composition of the Board and the skills of its members
– Management of the focussed search for and the appointment of a new Non Executive Director
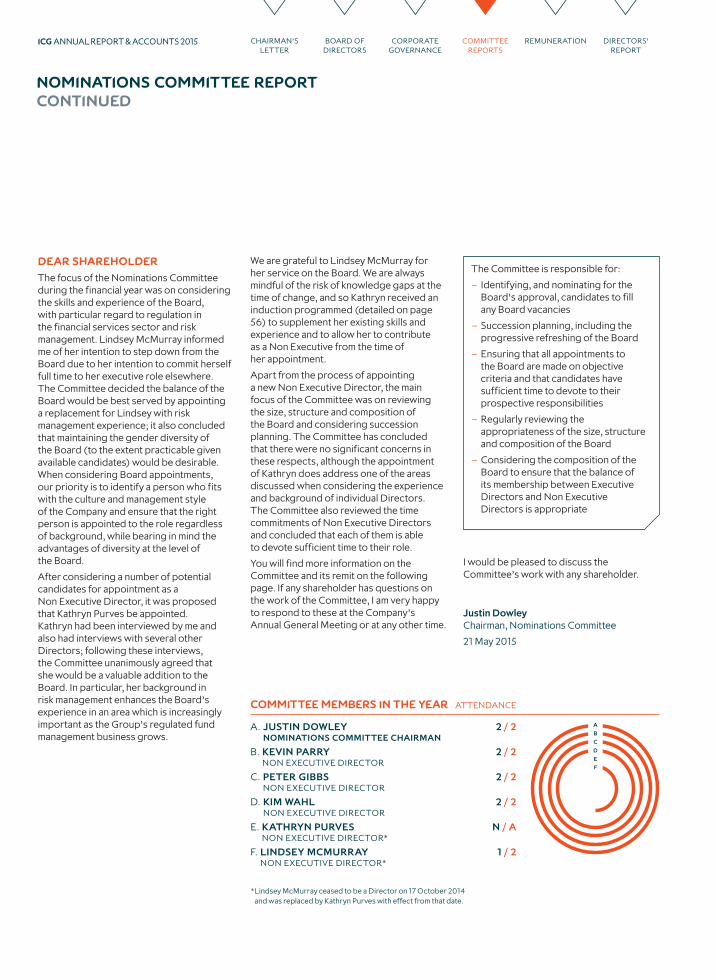
COMMITTEE MEMBERS IN THE YEAR ATTENDANCE
A. JUSTIN DOWLEY 2 / 2 NOMINATIONS COMMITTEE CHAIRMAN
B. KEVIN PARRY 2 / 2 NON EXECUTIVE DIRECTOR
C. PETER GIBBS 2 / 2 NON EXECUTIVE DIRECTOR
D. KIM WAHL 2 / 2 NON EXECUTIVE DIRECTOR
E. KATHRYN PURVES N / A NON EXECUTIVE DIRECTOR*
F. LINDSEY MCMURRAY 1 / 2 NON EXECUTIVE DIRECTOR*
DEAR SHAREHOLDER
The focus of the Nominations Committee during the financial year was on considering the skills and experience of the Board, with particular regard to regulation in the financial services sector and risk management. Lindsey McMurray informed me of her intention to step down from the Board due to her intention to commit herself full time to her executive role elsewhere. The Committee decided the balance of the Board would be best served by appointing a replacement for Lindsey with risk management experience; it also concluded that maintaining the gender diversity of the Board (to the extent practicable given available candidates) would be desirable. When considering Board appointments, our priority is to identify a person who fits with the culture and management style of the Company and ensure that the right person is appointed to the role regardless of background, while bearing in mind the advantages of diversity at the level of the Board.
After considering a number of potential candidates for appointment as a Non Executive Director, it was proposed that Kathryn Purves be appointed. Kathryn had been interviewed by me and also had interviews with several other Directors; following these interviews, the Committee unanimously agreed that she would be a valuable addition to the Board. In particular, her background in risk management enhances the Board’s experience in an area which is increasingly important as the Group’s regulated fund management business grows.
We are grateful to Lindsey McMurray for her service on the Board. We are always mindful of the risk of knowledge gaps at the time of change, and so Kathryn received an induction programmed (detailed on page 56) to supplement her existing skills and experience and to allow her to contribute as a Non Executive from the time of her appointment.
Apart from the process of appointing a new Non Executive Director, the main focus of the Committee was on reviewing the size, structure and composition of the Board and considering succession planning. The Committee has concluded that there were no significant concerns in these respects, although the appointment of Kathryn does address one of the areas discussed when considering the experience and background of individual Directors. The Committee also reviewed the time commitments of Non Executive Directors and concluded that each of them is able to devote sufficient time to their role.
You will find more information on the Committee and its remit on the following page. If any shareholder has questions on the work of the Committee, I am very happy to respond to these at the Company’s Annual General Meeting or at any other time.
The Committee is responsible for:
– Identifying, and nominating for the Board’s approval, candidates to fill any Board vacancies
– Succession planning, including the progressive refreshing of the Board
– Ensuring that all appointments to the Board are made on objective criteria and that candidates have sufficient time to devote to their prospective responsibilities
– Regularly reviewing the appropriateness of the size, structure and composition of the Board
– Considering the composition of the Board to ensure that the balance of its membership between Executive Directors and Non Executive Directors is appropriate
ABCDEF
NOMINATIONS COMMITTEE REPORT CONTINUED
* Lindsey McMurray ceased to be a Director on 17 October 2014 and was replaced by Kathryn Purves with effect from that date.
I would be pleased to discuss the Committee’s work with any shareholder.
Justin DowleyChairman, Nominations Committee
21 May 2015
ICG ANNUAL REPORT & ACCOUNTS 2015 CHAIRMAN’S LETTER
BOARD OF DIRECTORS
REMUNERATIONCOMMITTEE REPORTS
DIRECTORS’ REPORT
CORPORATE GOVERNANCE

NOMINATIONS COMMITTEE
The Nominations Committee consists of five Non Executive Directors, these being Justin Dowley (Chairman of the Committee), Kevin Parry, Peter Gibbs, Kim Wahl and Kathryn Purves. The Company Secretary acts as Secretary to the Committee.
Biographical details can be found on pages 50 and 51.
Appointments of Executive Directors and Non Executive Directors are made as necessary as a result of discussions by the Committee and are subject to full Board approval and election or re-election at a general meeting of the shareholders.
Prior to any appointment to the Board, the Nominations Committee considers the balance of skills, experience, independence and knowledge appropriate to determine the requirements and necessary capabilities of the role. In addition, any new Director normally meets all existing Directors prior to appointment.
DIVERSITY
The Committee has a standing policy on the background and diversity of Board members. The policy provides that, prior to any appointment to the Board, the Nominations Committee considers the balance of skills, experience, independence and knowledge appropriate to the role. In considering candidates, appointments are made with regard to a number of different criteria, including diversity of gender, background and personal attributes, alongside the appropriate skills, experience and expertise. The Committee seeks to ensure that long lists and short lists of possible appointments to the Board reflect that position. The Committee will always seek to appoint the candidate with the most appropriate skills and experience regardless of their background, gender, race, marital status, age, disability, religious belief or sexual orientation. The Committee and the Board are committed to diversity both at Board level and throughout the organisation.
The Committee is supportive of increased gender diversity at Board level, but recognises that it may not always be in the best interest of shareholders to prioritise this above other factors. The Committee will consider gender diversity, along with all other relevant factors, when making future recommendations to the Board.
PRIORITIES
The Committee is not currently aware of any planned changes to the Board; as such, its focus during the year will be on considering the balance of skills and experience of Directors, and reviewing the structure and composition of the Board in general.
TERMS OF REFERENCE
The Committee’s terms of reference are approved and reviewed by the Board on a regular basis, most recently in March 2015. The terms of reference are available on the Company’s website or by contacting the Company Secretary.
COMMITTEE EVALUATION
An evaluation of the Committee’s effectiveness was undertaken by the Committee Chairman. The responses were shared with the Committee and it was concluded that the Committee continues to operate effectively.
Based on the results of the review a more detailed structure will be put in place for the operation of the Committee. The review concluded that the current Board had an appropriate mix of skills, but may be enhanced by broader geographic and asset class experience. This will be considered by the Committee during the year.
74 / 75
STRATEGIC REPORT
GOVERNANCE REPORT
FINANCIAL STATEMENTS

ICG ANNUAL REPORT & ACCOUNTS 2015 CHAIRMAN’S LETTER
BOARD OF DIRECTORS
REMUNERATIONCOMMITTEE REPORTS
DIRECTORS’ REPORT
CORPORATE GOVERNANCE
REMUNERATION COMMITTEE REPORT
OUR OBJECTIVE IS TO ENSURE, ON BEHALF OF THE
SHAREHOLDERS, THAT REMUNERATION IS SUFFICIENT
TO ATTRACT, RETAIN AND MOTIVATE OUR STAFF TO
DELIVER THE GROUP STRATEGY. WE SEEK TO ALIGN
SHAREHOLDERS AND EMPLOYEES AND FOCUS ON
RISK MANAGEMENT AND APPROPRIATE OVERSIGHT.
PETER GIBBSCHAIRMAN OF THE REMUNERATION COMMITTEE
KEY ACHIEVEMENTS DURING THE YEAR
– Introduction of Malus and Clawback of amounts paid or vesting in the event of fraud or misstatement
– Disclosure of key performance indicators considered by the Remuneration Committee when determining each Managing Director’s award

DEAR SHAREHOLDER
I am pleased to present the Directors’ Remuneration Report for the financial year ended 31 March 2015, which explains the remuneration decisions in respect of our Managing Directors (MDs) and the amounts which have been paid and awarded to them in respect of the year.
We are not amending our Directors’ Remuneration Policy this year, following its approval by shareholders at the 2014 AGM, and anticipate that we shall continue to operate within this policy until at least the 2017 AGM. There have been no significant changes to the way in which we reward our MDs during FY15: all variable remuneration earned by our staff (other than third party carry and similar arrangements, which do not give rise to a liability on the Company) is payable out of the Annual Award Pool (AAP), which we target at an average of 30% of cash profit over a rolling five year period.
The remuneration philosophy at ICG is unusual for a FTSE 250 company, because it emulates the arrangements commonly found in private equity firms, against which we compete for talent. The approach does, in my and the Committee’s view, ensure close alignment to the long term interest of both shareholders and our investors.
VOTING OUTCOME AT 2014 AGM AND ADDRESSING SHAREHOLDERS’ CONCERNS
My fellow Remuneration Committee members and I were disappointed with the level of support from shareholders last year for the Directors’ Remuneration Policy (79.85% in favour) and the Annual Report on Remuneration and Annual Statement (77.3% in favour). Since the 2014 AGM, the Chairman and I have made contact with a number of shareholders to better understand their concerns. The main areas of discussion related to the following:
1. The disclosure of the rationale for individual MDs’ incentive amounts, in particular their linkage with Return on Equity (ROE).
2. The lack of provision for clawback.
3. The rationale for using cash profit as the driver of the AAP.
I am pleased to report that we have made changes to address the first two areas:
1. We have included in the Annual Report on Remuneration details of the key performance indicators that the Remuneration Committee considered when determining each MD’s share of the AAP.
2. We have introduced a provision in all our incentive arrangements for Clawback and/or Malus of amounts paid or vested in the event of fraud or misstatement.
We continue to believe realised cash profit is the most relevant measure of our success in executing the business of ICG. Cash profit reflects not only our profits from the FMC but also the net realised cash profit
on our balance sheet investments, which typically take a number of years to emerge. In this way our employees are rewarded only when we have profitably exited investments (in a similar way to investment executives employed in private equity firms). The Remuneration Committee continues to keep the percentage of cash profit under review and is comfortable that the current level of 30% remains appropriate.
To ensure alignment of our MDs’ interests with those of our shareholders, a significant proportion (67–74%) of the MDs’ remuneration from the AAP is delivered in ICG plc shares. These shares vest over a period of between one and five years and are subject to Malus during that time. Any bonus paid in cash and all vested share awards are at risk of Clawback for a further two years, in the event of fraud or misstatement of accounts.
Third party investors demand our senior investment executives and MDs to participate in carried interest arrangements in the funds which they manage. Carried interest is paid by the investors of the Fund (not ICG) and only when investments have been realised and a return paid to the investors. During the course of FY15, we successfully sold the remaining assets of our European Mezzanine Fund 2006. This transaction crystallised the Fund’s carried interest payments which typically would have been paid over a number of years. This has resulted in a payment of carried interest by the Fund of �29.7m to ICG and �44.1m to past and present Managing Directors (including �24.7m to the current MDs).
ABCDE
COMMITTEE MEMBERS IN 2015 ATTENDANCE
A. PETER GIBBS 4 / 4 REMUNERATION COMMITTEE CHAIRMAN
B. JUSTIN DOWLEY 4 / 4 CHAIRMAN
C. KEVIN PARRY 4 / 4 NON EXECUTIVE DIRECTOR
D. KIM WAHL 4 / 4 NON EXECUTIVE DIRECTOR
E. LINDSEY MCMURRAY 1 / 1 NON EXECUTIVE DIRECTOR*
* Lindsey McMurray ceased to be a Director on 17 October 2014.
76 / 77
STRATEGIC REPORT
GOVERNANCE REPORT
FINANCIAL STATEMENTS

BUSINESS PERFORMANCE IN FY15
It has been a very successful year for ICG in FY15:
– Group profit before tax of £178.5m vs £164.4m in FY14
– Cash profit of £182.6m vs £339.1m in FY14
– Record AUM of €18bn up 39% on FY14
– Fundraising momentum strong, particularly in Europe
– All funds investing on target
– Net impairments were significantly lower than last year and below the long term average
– Initiatives underway to improve ROE
The results have made a healthy contribution to the AAP. The overall cost of incentives remains well within the average annual 30% limit over the first four years of the five year cycle, as shown below.
FY ending 31 March
Realised cash
profit (£m)
Available Award
Pool (£m)
Actual spend on
incentives (£m)
Cumulative % of
cash profit
2012 164.9 49.5 29.5 17.9%
2013 (10.7) (3.2) 22.1 22.7%
2014 339.1 101.7 50.2 20.6%
2015 182.6 54.8 48.6 22.3%
REMUNERATION DECISIONS FOR FY15
As in previous years, the Committee have focused to ensure that individual allocations from the AAP are clearly reflective of the achievements of each of the MDs. In FY15, our European business has had outstanding success with the sale of the assets in European Mezzanine Fund 2006 contributing significantly to cash profit. Benoît Durteste, in particular, has contributed to this achievement and the Committee was anxious to recognise this with an exceptional allocation from the AAP.
We remain comfortable that staff reward remains strongly linked to the performance of the business and that:
– It is appropriate to drive all of our incentives off a cash profit measure as it ensures staff remain focused on the delivery of successful investment outcomes;
– The remuneration structure provides alignment with shareholders through the delivery of the majority of variable pay in ICG plc shares;
– The introduction of Malus and Clawback on all incentive pay ensures that employees are exposed to the longer term impact of their actions.
I look forward to your support at the AGM where I will be happy to address any questions you may have.
Peter GibbsChairman of the Remuneration Committee
21 May 2015
ICG ANNUAL REPORT & ACCOUNTS 2015 CHAIRMAN’S LETTER
BOARD OF DIRECTORS
REMUNERATIONCOMMITTEE REPORTS
DIRECTORS’ REPORT
CORPORATE GOVERNANCE
REMUNERATION COMMITTEE REPORT CONTINUED

78 / 79
STRATEGIC REPORT
GOVERNANCE REPORT
FINANCIAL STATEMENTS
ICG CASH PROFIT
available for Annual Award Pool
1. GROW ASSETS UNDER MANAGEMENT
2. INVEST SELECTIVELY
3. MANAGE OUR PORTFOLIO TO MAXIMISE VALUE
INVESTMENT RETURNS
EXTERNAL INVESTORS
PAY PERFORMANCE FEES/CARRY
STRATEGIC PRIORITIES
Aligns staff and shareholders 30% of cash profit cap on expected value of awards ensures long term affordability
Supports the Long Term Corporate Strategy BSC awards reflect the long term corporate strategy to invest successfully and maximise returns. Key staff are remunerated to grow value in the FMC
Promotes Staff Equity Ownership Majority of Executive Directors’ remuneration is in the form of equity,
and shareholding guidelines have been introduced
Cash on Cash Employees are only rewarded for realised gains
Aligns interests of fund management teams with those
of fund investors Encourages the best returns
to be obtained, whilst minimising defaults and losses
availAble for Shareholders
EMPLOYEES
up to 30% 70%
ANNUAL BONUS*
PLC EQUITY
FMC EQUITY
BALANCE SHEET CARRY
(BSC)
PERFORMANCE FEES
up to 80%
20%
*Including Deferred Share Awards
COMPENSATION AT A GLANCE

ICG ANNUAL REPORT & ACCOUNTS 2015 CHAIRMAN’S LETTER
BOARD OF DIRECTORS
REMUNERATIONCOMMITTEE REPORTS
DIRECTORS’ REPORT
CORPORATE GOVERNANCE
This section describes the remuneration policy for Executive Directors (Managing Directors) that has been in operation since 2010 and which was approved at, and is intended to continue to apply from the AGM held on 23 July 2014.
A full copy of the Policy approved by shareholders at the 2014 AGM is available on the ICG website (www.icgplc.com) under the shareholders governance section. Minor amendments have been made to this policy to reflect changes in Board Membership, dates of re-election and the extension of existing SAYE plans.
ANNUAL AWARD POOL (AAP)
The central feature of ICG’s remuneration policy is the AAP. All incentives awarded across the Group under
– The Omnibus Plan
– The Balance Sheet Carry Plan
– Any performance fees paid to the Fund Management Company (FMC) that are distributed to employees
are governed by an overall limit that is currently 30% of cash profit over a rolling five year period. This percentage may be exceeded in any year but must not be exceeded on an aggregate average basis over five years.
Cash profit, as internally reported, is defined as profit before tax and incentive schemes, adjusted so that:
– Interest income and capital gains are only recognised on a cash basis
– Net impairments are only recognised on principal investment
– Fair value movement of derivatives is excluded
A further adjustment is made to cash profit to reflect the remuneration cost of our in house distribution team. The variable pay of all employees (including the distribution team) is awarded out of the expanded AAP.
The current AAP limit is considered by the Committee to be appropriate for our existing business model. As the Group’s business develops and expands into new markets and products, the Committee will assess the ongoing appropriateness of the 30% limit. Should it be determined that the limit should be amended, the Committee will engage with shareholders.
AWARDS FALLING WITHIN THE AAP
The Omnibus Plan provides for three different award types to be made over ICG shares: Deferred Share Award, PLC Equity Awards and FMC Equity Awards. FMC Equity Awards are not made to individuals who are Managing Directors. In addition, performance fees receivable by the FMC together with any other incentives funded by ICG are distributed under the umbrella of the AAP. Only Third Party Carry (TPC) and similar arrangements in respect of ICG direct investment funds or business acquisitions that do not give rise to a cost or liability to the Company are outside of the AAP.
DIRECTORS’ REMUNERATION POLICY SUMMARY
REMUNERATION PRINCIPLES
Five guiding principles are reflected in the design of the staff compensation arrangements.
ALIGNMENT BETWEEN STAFF AND SHAREHOLDERS
AAP – 30% of cash profit cap on expected value of awards ensures long term affordability
SUPPORT THE LONG TERM CORPORATE STRATEGY
Balance Sheet Carry awards reflect the long term corporate strategy to invest successfully and maximise returns. Key staff remunerated to grow value in the FMC
PROMOTE STAFF EQUITY OWNERSHIP
The majority of executive remuneration is in the form of equity; and shareholding guidelines have been introduced
TRANSPARENT
All aspects of remuneration are clear to employees and openly communicated to employees and shareholders
‘CASH ON CASH’
The ‘cash on cash’ principle ensures that employees are only rewarded for realised gains
Annual award pool
(30% of cash profit)
ANNUAL BONUS
(including Deferred Share Awards)
PLC EQUITY
FMC EQUITY
BALANCE SHEET CARRY
PERFORMANCE FEES
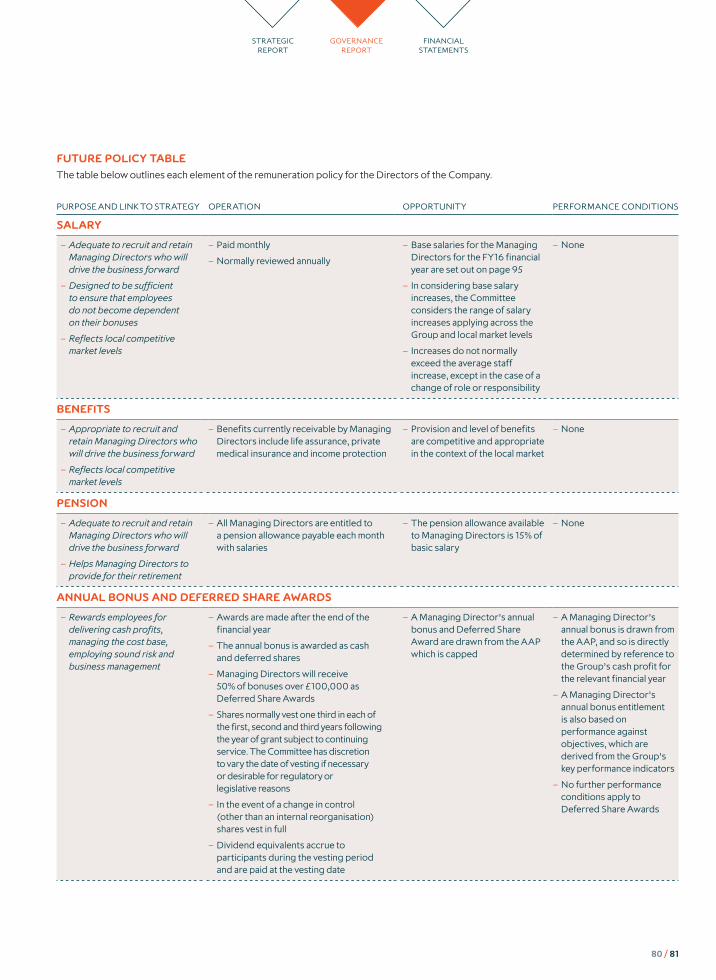
80 / 81
STRATEGIC REPORT
GOVERNANCE REPORT
FINANCIAL STATEMENTS
FUTURE POLICY TABLE
The table below outlines each element of the remuneration policy for the Directors of the Company.
PURPOSE AND LINK TO STRATEGY OPERATION OPPORTUNITY PERFORMANCE CONDITIONS
SALARY
– Adequate to recruit and retain Managing Directors who will drive the business forward
– Designed to be sufficient to ensure that employees do not become dependent on their bonuses
– Reflects local competitive market levels
– Paid monthly
– Normally reviewed annually
– Base salaries for the Managing Directors for the FY16 financial year are set out on page 95
– In considering base salary increases, the Committee considers the range of salary increases applying across the Group and local market levels
– Increases do not normally exceed the average staff increase, except in the case of a change of role or responsibility
– None
BENEFITS
– Appropriate to recruit and retain Managing Directors who will drive the business forward
– Reflects local competitive market levels
– Benefits currently receivable by Managing Directors include life assurance, private medical insurance and income protection
– Provision and level of benefits are competitive and appropriate in the context of the local market
– None
PENSION
– Adequate to recruit and retain Managing Directors who will drive the business forward
– Helps Managing Directors to provide for their retirement
– All Managing Directors are entitled to a pension allowance payable each month with salaries
– The pension allowance available to Managing Directors is 15% of basic salary
– None
ANNUAL BONUS AND DEFERRED SHARE AWARDS
– Rewards employees for delivering cash profits, managing the cost base, employing sound risk and business management
– Awards are made after the end of the financial year
– The annual bonus is awarded as cash and deferred shares
– Managing Directors will receive 50% of bonuses over £100,000 as Deferred Share Awards
– Shares normally vest one third in each of the first, second and third years following the year of grant subject to continuing service. The Committee has discretion to vary the date of vesting if necessary or desirable for regulatory or legislative reasons
– In the event of a change in control (other than an internal reorganisation) shares vest in full
– Dividend equivalents accrue to participants during the vesting period and are paid at the vesting date
– A Managing Director’s annual bonus and Deferred Share Award are drawn from the AAP which is capped
– A Managing Director’s annual bonus is drawn from the AAP, and so is directly determined by reference to the Group’s cash profit for the relevant financial year
– A Managing Director’s annual bonus entitlement is also based on performance against objectives, which are derived from the Group’s key performance indicators
– No further performance conditions apply to Deferred Share Awards

ICG ANNUAL REPORT & ACCOUNTS 2015 CHAIRMAN’S LETTER
BOARD OF DIRECTORS
REMUNERATIONCOMMITTEE REPORTS
DIRECTORS’ REPORT
CORPORATE GOVERNANCE
PURPOSE AND LINK TO STRATEGY OPERATION OPPORTUNITY PERFORMANCE CONDITIONS
PLC EQUITY AWARD
– Rewards senior employees for increasing long term shareholder value
– Aligns the interests of senior employees with those of shareholders
– Awards are made after the end of the financial year
– The awards are over shares in the Company
– Shares normally vest one third in each of the third, fourth and fifth years following the year of grant unless the Executive leaves for cause or to join a competitor. The Committee has discretion to vary the date of vesting if necessary or desirable for regulatory or legislative reasons
– In the event of a change in control (other than an internal reorganisation) shares vest in full
– Dividend equivalents accrue to participants during the vesting period and are paid at the vesting date
– A Managing Director’s PLC Equity Award is drawn from the AAP which is capped
– A Managing Director’s PLC Equity Award is drawn from the AAP, and so is directly determined by reference to the Group’s cash profit in the relevant financial year
– A Managing Director’s PLC Equity Award is also based on performance against objectives, which are derived from the Group’s key performance indicators
– No further performance conditions apply to the PLC Equity Awards
FMC EQUITY AWARD
– Incentivises those employees charged with accelerating the expansion of the Company’s fund management business
– Awards are made after the end of the financial year
– The awards are over shares in FMC
– Shares normally vest one third in each of the first, second and third years following the year of grant subject to continuing service. The Committee has discretion to vary the date of vesting if necessary or desirable for regulatory or legislative reasons
– A holding period applies until the third year following the year of grant, at which time all vested FMC shares are automatically ‘exchanged’ for Company shares of an equivalent value
– In the event of a change in control (other than an internal reorganisation) shares vest in full
– The value of a share is determined by an independent valuation every year
– All employees are eligible to participate in the FMC Equity Award scheme. No awards have been made under this plan to any individual while they have been a Managing Director and it is not intended that any will be made to Managing Directors in the future
– FMC Equity Awards are drawn from the AAP, and so are directly determined by reference to the Group’s cash profit in the relevant financial year
– Awards are based on performance against objectives, which are derived from the Group’s key performance indicators
– No further performance conditions apply to FMC Equity Awards
DIRECTORS’ REMUNERATION POLICY SUMMARY CONTINUED
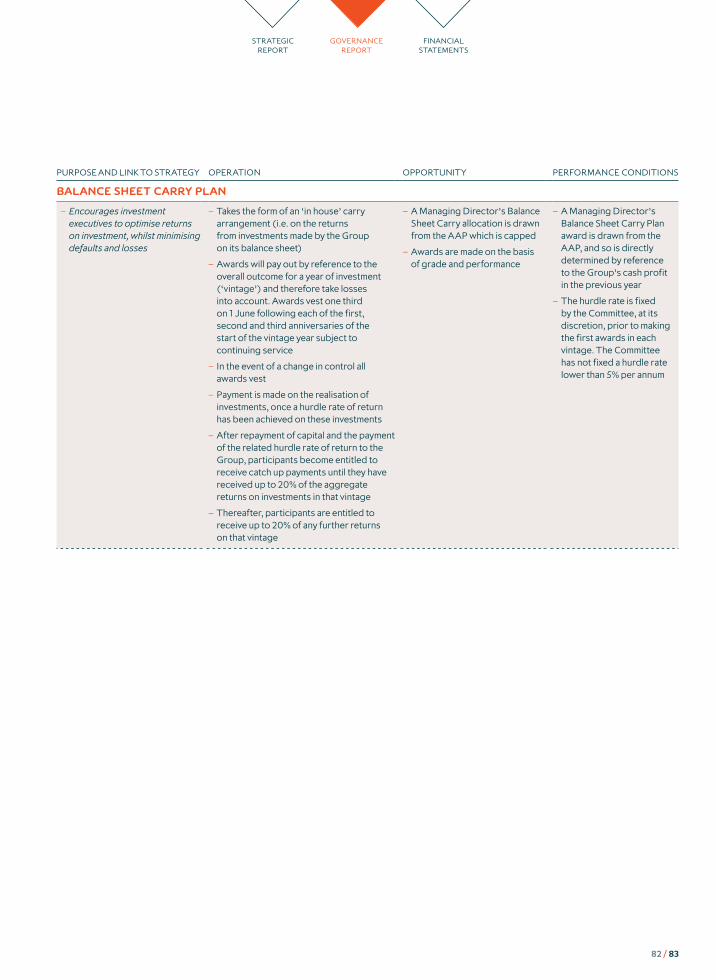
82 / 83
STRATEGIC REPORT
GOVERNANCE REPORT
FINANCIAL STATEMENTS
PURPOSE AND LINK TO STRATEGY OPERATION OPPORTUNITY PERFORMANCE CONDITIONS
BALANCE SHEET CARRY PLAN
– Encourages investment executives to optimise returns on investment, whilst minimising defaults and losses
– Takes the form of an ‘in house’ carry arrangement (i.e. on the returns from investments made by the Group on its balance sheet)
– Awards will pay out by reference to the overall outcome for a year of investment (‘vintage’) and therefore take losses into account. Awards vest one third on 1 June following each of the first, second and third anniversaries of the start of the vintage year subject to continuing service
– In the event of a change in control all awards vest
– Payment is made on the realisation of investments, once a hurdle rate of return has been achieved on these investments
– After repayment of capital and the payment of the related hurdle rate of return to the Group, participants become entitled to receive catch up payments until they have received up to 20% of the aggregate returns on investments in that vintage
– Thereafter, participants are entitled to receive up to 20% of any further returns on that vintage
– A Managing Director’s Balance Sheet Carry allocation is drawn from the AAP which is capped
– Awards are made on the basis of grade and performance
– A Managing Director’s Balance Sheet Carry Plan award is drawn from the AAP, and so is directly determined by reference to the Group’s cash profit in the previous year
– The hurdle rate is fixed by the Committee, at its discretion, prior to making the first awards in each vintage. The Committee has not fixed a hurdle rate lower than 5% per annum

ICG ANNUAL REPORT & ACCOUNTS 2015 CHAIRMAN’S LETTER
BOARD OF DIRECTORS
REMUNERATIONCOMMITTEE REPORTS
DIRECTORS’ REPORT
CORPORATE GOVERNANCE
PURPOSE AND LINK TO STRATEGY OPERATION OPPORTUNITY PERFORMANCE CONDITIONS
CARRIED INTEREST OVER THIRD PARTY FUNDS (THIRD PARTY CARRY OR TPC)
– Offers the types of incentive arrangements that are expected by fund investors and are offered by the Group’s competitors for talent
– Aligns the interests of the fund management teams with those of the fund investors, encouraging the best returns to be obtained, whilst minimising defaults and losses
– Shadow Carry facilitates the participation by Managing Directors and other employees in TPC after the inception of the fund and after investments have been made
– Certain employees who are involved in the management of a fund are invited to invest in the fund by acquiring interests in a carry partnership at the fair market value of the interests at the time of acquisition. The investment is made through an external structure established at the inception of the fund such that no liability arises to the Group
– TPC participants receive a share of the profits arising on the realisation of investments made in that fund. No payments are made to TPC participants until the external investors have received an internal rate of return (IRR) (the hurdle) on the fund
– Shadow Carry is the notional allocation of TPC interests that have not otherwise been acquired by employees. Payments are made to participants in respect of Shadow Carry when the hurdle has been met, through payroll, but are designed to mirror TPC payments in all other respects
– TPC, Shadow Carry and similar arrangements that do not give rise to a cost or liability to the Company are outside the AAP
– Awards of TPC and Shadow Carry are made to Managing Directors to reflect their seniority and involvement in the management of the relevant funds
– No performance conditions are considered to attach to TPC
– Because participants in Shadow Carry have not made an investment in the carry partnership, the hurdle is considered to be a performance condition
THE INTERMEDIATE CAPITAL GROUP PLC SAYE PLAN 2004
– Provides an opportunity for all employees to participate in the success of the Group
– UK employees are offered the opportunity to save a regular amount each month over 36 months and receive a bonus at the end of the saving contract (subject to HMRC legislation)
– At maturity, employees can exercise their option to acquire and purchase shares in ICG at the discounted price set at the award date or receive the accumulated cash
– Employees may save the maximum permitted by legislation each month with this scheme
– The Plan is not subject to any performance conditions, as per HMRC legislation
– All UK employees are eligible to participate in the Plan
SHAREHOLDING REQUIREMENTS
– To align the interests of the Company’s Managing Directors with those of shareholders
– To promote share ownership
– A Managing Director is required to acquire ownership of a number of ordinary shares in the Company with a market value equal to a multiple of two times the Director’s annual base salary
– A period of up to three years from 1 April 2012 has been agreed for Managing Directors to build up to the required shareholding
– If the shareholding requirement is not met within the timeframe specified, the Board will propose a course of action to bring the Managing Director’s shareholding to the required level
– Not applicable
DIRECTORS’ REMUNERATION POLICY SUMMARY CONTINUED

84 / 85
STRATEGIC REPORT
GOVERNANCE REPORT
FINANCIAL STATEMENTS
PURPOSE AND LINK TO STRATEGY OPERATION OPPORTUNITY PERFORMANCE CONDITIONS
FEES PAID TO NON EXECUTIVE DIRECTORS
– To facilitate the recruitment of Non Executive Directors who will oversee the development of strategy and monitor the Managing Directors’ stewardship of the business
– Fees are payable to Non Executive Directors for their services in positions upon the Board and various Committees
– Fees for the Chairman are determined and reviewed annually by the Committee and fees for Non Executive Directors are determined by the Board
– The Committee relies upon objective research on up to date relevant information for similar companies
– Non Executive Directors cannot participate in any of the Company’s share schemes and are not eligible to join the designated Group pension plan
– Fees are set and reviewed in line with market rates. Aggregate annual fees do not exceed the limit set out in the Articles of Association of £600,000
– None of the Non Executive Directors’ remuneration is subject to performance conditions
LEGACY REMUNERATION SCHEMES
The following remuneration schemes formed part of the Company’s remuneration policy in previous years and are being phased out following a review of remuneration in 2010. No new awards will be made but some awards granted in earlier years and held by Managing Directors may vest when the approved policy is in force.
PURPOSE AND LINK TO STRATEGY OPERATION OPPORTUNITY PERFORMANCE CONDITIONS
THE KEY EMPLOYEE RETENTION SHARE PLAN (KERSP)
– To align the interests of the Company’s Managing Directors with those of shareholders
– The Key Employee Retention Share Plan (KERSP) was adopted on 23 May 2005, under which an amount, up to 5% of the value of the MTIS pool (a legacy incentive scheme which has now closed), may be distributed to key Managing Directors in the form of share options with an exercise price equal to nil
– This is a legacy remuneration scheme – no new options have been awarded since June 2008
– Vesting of options previously awarded is subject to the performance conditions set out below
– The limit on any individual’s participation is 20% of the value of their monetary remuneration in the year of award
– In order to exercise these options, the Company must achieve a growth in earnings per share (EPS) of 5% per annum from the date of grant to the vesting date. It is unlikely that this performance condition will be met

ICG ANNUAL REPORT & ACCOUNTS 2015 CHAIRMAN’S LETTER
BOARD OF DIRECTORS
REMUNERATIONCOMMITTEE REPORTS
DIRECTORS’ REPORT
CORPORATE GOVERNANCE
NOTES TO THE POLICY TABLE
PERFORMANCE MEASURES AND TARGETS
The Annual Award Pool is determined by the Executive Committee and Remuneration Committee through an assessment of the Group’s financial performance. Cash profit provides a link between income generation for shareholders and employee compensation, ensuring that excessive awards to employees are not made and that any awards that are made are affordable on a cash basis. Management information is provided to the Executive Committee and Remuneration Committee on performance to ensure that financial results are put into the context of wider performance and risk appetite.
The AAP is calculated as a cumulative average of 30% of cash profit from the year ending 31 March 2012 until the year ending 31 March 2016, after which it is calculated as a five year rolling average. The 30% cap may be exceeded in any year as long as, over a five year period, on average the AAP does not exceed 30% of cash profit. A further adjustment is made to cash profit to reflect the remuneration cost of our in house fund distribution team. This team can significantly reduce the cost of external placement agent fees. The AAP is increased by the amount of this adjustment and the variable pay of all employees (including the fund distribution team) is awarded out of the expanded AAP.
Once the AAP has been determined, it is then distributed based on an individual’s contribution and performance as determined by the annual appraisal process.
DIFFERENCE IN REMUNERATION POLICY FOR ALL EMPLOYEES
All employees of ICG are entitled to base salary, benefits and, in most locations, pension. The variable compensation mix for all employees is drawn from the Annual Award Pool and is allocated according to the framework below, by reference to role, responsibility and performance.
Employee Annual bonus PLC Equity Award FMC Equity Award Balance Sheet Carry Performance fees
Managing Director • • •
Credit Fund Management Partner • • •
Investment Partner • • • •
ICG Business Infrastructure Partner • •
Investment Director • • •
Credit Fund Management Investment Director • • •
ICG Business Infrastructure Director • • •
Investment Associate Director • • •
Credit Fund Management Associate Director • • •
All other staff •
The variable compensation mix may be varied from the above if required by law or regulation.
The quantum of each of these awards is determined by the size of the Annual Award Pool, an individual’s seniority, contribution and their individual performance as determined by the annual appraisal process. In addition, all UK employees are eligible to join the Intermediate Capital Group plc SAYE Plan 2014.
DIRECTORS’ REMUNERATION POLICY SUMMARY CONTINUED

86 / 87
STRATEGIC REPORT
GOVERNANCE REPORT
FINANCIAL STATEMENTS
SERVICE CONTRACTS
MANAGING DIRECTORS
The Company’s policy is for Managing Directors to have one year rolling contracts which are deemed appropriate for the nature of the Company’s business.
Service contracts are held, and are available for inspection, at the Company’s registered office. The details of the service contracts for Managing Directors serving during the year are shown below.
Managing DirectorDate of service
contractLast
re-electedRe-election
frequencyNotice period
Non-compete provisions
Compensation on termination by the Company without notice or cause
Christophe Evain 30 May 2006 23 July 2014 Annual 12 monthsRestraint period of
12 months
The salary for any unexpired period of notice plus the cost to the Company
(excluding NI contributions) of providing insurance benefits for the same period
Philip Keller 12 October 2006 23 July 2014 Annual 12 months
Benoît Durteste 21 May 2012 23 July 2014 Annual 12 months
The Committee reserves discretion to make an annual bonus award to a Managing Director in respect of the final full year of service, taking into account the circumstances of the individual’s termination of office and performance for the financial year concerned.
NON EXECUTIVE DIRECTORS
Non Executive Directors do not have contracts of service and are not eligible to join the designated Group pension plan. Details of Non Executive Directors’ letters of appointment are as shown below.
Non Executive Director Date appointedLast
re-electedRe-election
frequency
Notice period (unless not
re-elected)
Policy on payment for
loss of office
Justin Dowley February 2006 July 2014 Annual 3 months None
Peter Gibbs March 2010 July 2014 Annual 3 months None
Kevin Parry June 2009 July 2014 Annual 3 months None
Kim Wahl July 2012 July 2014 Annual 3 months None
Kathryn Purves* October 2014 – Annual 3 months None
*Lindsey McMurray retired and Kathryn Purves was appointed on 17 October 2014.
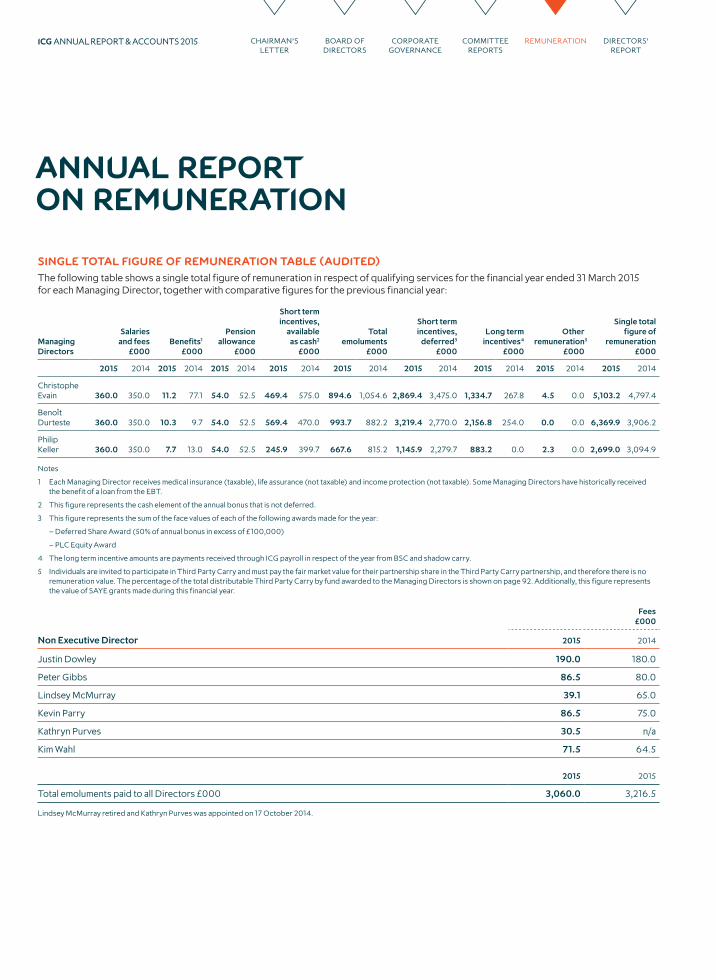
ICG ANNUAL REPORT & ACCOUNTS 2015 CHAIRMAN’S LETTER
BOARD OF DIRECTORS
REMUNERATIONCOMMITTEE REPORTS
DIRECTORS’ REPORT
CORPORATE GOVERNANCE
SINGLE TOTAL FIGURE OF REMUNERATION TABLE (AUDITED)
The following table shows a single total figure of remuneration in respect of qualifying services for the financial year ended 31 March 2015 for each Managing Director, together with comparative figures for the previous financial year:
Managing Directors
Salaries and fees
£000Benefits1
£000
Pension allowance
£000
Short term incentives,
available as cash2
£000
Total emoluments
£000
Short term incentives,
deferred3
£000
Long termincentives4
£000
Otherremuneration5
£000
Single total figure of
remuneration£000
2015 2014 2015 2014 2015 2014 2015 2014 2015 2014 2015 2014 2015 2014 2015 2014 2015 2014
Christophe Evain 360.0 350.0 11.2 77.1 54.0 52.5 469.4 575.0 894.6 1,054.6 2,869.4 3,475.0 1,334.7 267.8 4.5 0.0 5,103.2 4,797.4
Benoît Durteste 360.0 350.0 10.3 9.7 54.0 52.5 569.4 470.0 993.7 882.2 3,219.4 2,770.0 2,156.8 254.0 0.0 0.0 6,369.9 3,906.2
Philip Keller 360.0 350.0 7.7 13.0 54.0 52.5 245.9 399.7 667.6 815.2 1,145.9 2,279.7 883.2 0.0 2.3 0.0 2,699.0 3,094.9
Notes
1 Each Managing Director receives medical insurance (taxable), life assurance (not taxable) and income protection (not taxable). Some Managing Directors have historically received the benefit of a loan from the EBT.
2 This figure represents the cash element of the annual bonus that is not deferred.
3 This figure represents the sum of the face values of each of the following awards made for the year:
– Deferred Share Award (50% of annual bonus in excess of £100,000)
– PLC Equity Award
4 The long term incentive amounts are payments received through ICG payroll in respect of the year from BSC and shadow carry.
5 Individuals are invited to participate in Third Party Carry and must pay the fair market value for their partnership share in the Third Party Carry partnership, and therefore there is no remuneration value. The percentage of the total distributable Third Party Carry by fund awarded to the Managing Directors is shown on page 92. Additionally, this figure represents the value of SAYE grants made during this financial year.
Non Executive Director
Fees £000
2015 2014
Justin Dowley 190.0 180.0
Peter Gibbs 86.5 80.0
Lindsey McMurray 39.1 65.0
Kevin Parry 86.5 75.0
Kathryn Purves 30.5 n/a
Kim Wahl 71.5 64.5
2015 2015
Total emoluments paid to all Directors £000 3,060.0 3,216.5
Lindsey McMurray retired and Kathryn Purves was appointed on 17 October 2014.
ANNUAL REPORT ON REMUNERATION

88 / 89
STRATEGIC REPORT
GOVERNANCE REPORT
FINANCIAL STATEMENTS
ADDITIONAL INFORMATION IN RESPECT OF THE SINGLE TOTAL FIGURE
In the financial year under review, in line with the Directors’ remuneration policy, the base salary payable to each Managing Director has been increased to £360,000 per annum. The percentage increase received is in line with other employees.
Managing Director
Salaries and fees £000
Y/E 31 March2015
Y/E 31 March2014
%change
Christophe Evain 360.0 350.0 +2.86
Philip Keller 360.0 350.0 +2.86
Benoît Durteste 360.0 350.0 +2.86
PERFORMANCE MEASURES AND TARGETS (AUDITED)
The central feature of the Remuneration Policy is the Annual Award Pool. All incentives are governed by an overall limit expressed in terms of cash profit. The table below includes the cost of incentives drawn from the Annual Award Pool for the financial year under review and the three previous years.
FYCash profit
£m
Annual Award Pool
£m
Spend on incentives
£m
2012 164.9 49.5 29.5
2013 (10.7) (3.2) 22.1
2014 339.1 101.7 50.2
2015 182.6 54.8 48.6
The Annual Award Pool is limited to 30% of cash profit over a rolling five year period. This percentage may be exceeded in any year but must not be exceeded on an aggregate average basis over five years. The cumulative spend as a percentage of profit to date is 22.3%.

ANNUAL REPORT ON REMUNERATION CONTINUED
ICG ANNUAL REPORT & ACCOUNTS 2015 CHAIRMAN’S LETTER
BOARD OF DIRECTORS
REMUNERATIONCOMMITTEE REPORTS
DIRECTORS’ REPORT
CORPORATE GOVERNANCE
As discussed in the policy table, a Managing Director’s annual incentive award is governed by the size of the Annual Award Pool in addition to their individual performance as determined by the annual appraisal process. At the beginning of the financial year under review, the Company assigned each Managing Director a number of Key Performance Indicators (KPIs) broadly in the areas of fundraising and growth, investment portfolios, operational and risk management measures, people and performance management and financial performance. A summary of the KPIs, and the Managing Directors’ performance against these objectives is set out below:
KPI
Performance
Underperforming Performing Outperforming Narrative
Long Term Fundraising Objective (third party capital committed)
Very good year for fundraising at €6.4bn which exceeded the expected average through the cycle of €4bn per annum
Short Term Fundraising Objective (third party capital committed)
Exceptional year for fundraising at €6.4bn which exceeded the FY15 target based on fundraising targets for specific strategies
Deliver Strategic Initiatives Key initiatives on track, with a first close on the new Japanese Mezzanine fund and the successful launch of Secondaries business during FY15
% of full realisations above fund hurdle rate
All realised assets exited above the hurdle rate, including EF06 which exited in its entirety
Fund deployment in line with expectations
The year ended with six of the Direct Investment funds at, or ahead of their expected deployment rate and two behind
Impairments Impairments are 2.3% of the opening loan book, below the long term guidance of 2.5%
FMC profit margin FY15 outcome of 40.8% is in excess of the profit margin target of above 40% by FY17
Gearing Group has taken significant steps to bring gearing within the target range, including raising debt and returning capital to shareholders
Target ROE In addition to its progress in returning capital, the Group has achieved increased profitability in the FMC, aided by lower impairments in the Investment Company
In addition to the above KPIs, each Managing Director is also measured against the effective application of commercially appropriate risk management practices, metrics and controls.
Deferred Share Awards are made in respect of 50% of any annual bonus in excess of £100,000. The vesting of these awards is subject to a continued service condition.
Payments from shadow carry arrangements were made to certain Managing Directors during the year which are included in the single total figure of remuneration on page 88. The hurdle rate of return (8%) in respect of the relevant vintage(s) has been met.
The split between variable elements of pay from the Annual Award Pool for the Managing Directors in 2014/15 was as follows:
Elements of variable pay %
PLC Equity 64
Balance Sheet Carry 13
Annual Cash Bonus 13
Deferred Share Award 10
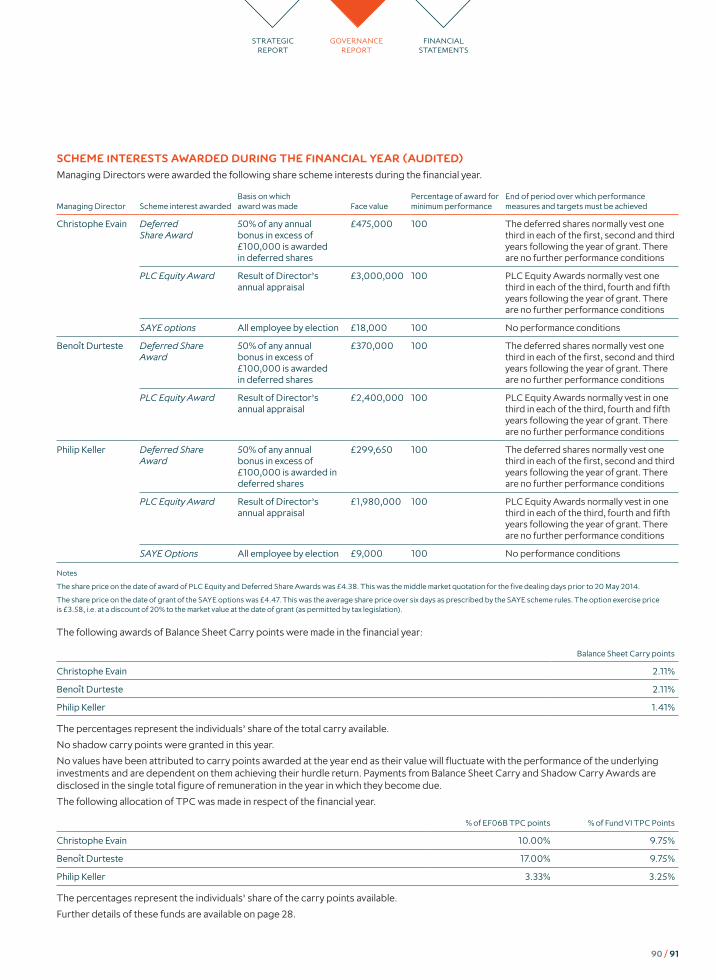
90 / 91
STRATEGIC REPORT
GOVERNANCE REPORT
FINANCIAL STATEMENTS
SCHEME INTERESTS AWARDED DURING THE FINANCIAL YEAR (AUDITED)
Managing Directors were awarded the following share scheme interests during the financial year.
Managing Director Scheme interest awardedBasis on which award was made Face value
Percentage of award for minimum performance
End of period over which performance measures and targets must be achieved
Christophe Evain Deferred Share Award
50% of any annual bonus in excess of £100,000 is awarded in deferred shares
£475,000 100 The deferred shares normally vest one third in each of the first, second and third years following the year of grant. There are no further performance conditions
PLC Equity Award Result of Director’s annual appraisal
£3,000,000 100 PLC Equity Awards normally vest one third in each of the third, fourth and fifth years following the year of grant. There are no further performance conditions
SAYE options All employee by election £18,000 100 No performance conditions
Benoît Durteste Deferred Share Award
50% of any annual bonus in excess of £100,000 is awarded in deferred shares
£370,000 100 The deferred shares normally vest one third in each of the first, second and third years following the year of grant. There are no further performance conditions
PLC Equity Award Result of Director’s annual appraisal
£2,400,000 100 PLC Equity Awards normally vest in one third in each of the third, fourth and fifth years following the year of grant. There are no further performance conditions
Philip Keller Deferred Share Award
50% of any annual bonus in excess of £100,000 is awarded in deferred shares
£299,650 100 The deferred shares normally vest one third in each of the first, second and third years following the year of grant. There are no further performance conditions
PLC Equity Award Result of Director’s annual appraisal
£1,980,000 100 PLC Equity Awards normally vest in one third in each of the third, fourth and fifth years following the year of grant. There are no further performance conditions
SAYE Options All employee by election £9,000 100 No performance conditions
Notes
The share price on the date of award of PLC Equity and Deferred Share Awards was £4.38. This was the middle market quotation for the five dealing days prior to 20 May 2014.
The share price on the date of grant of the SAYE options was £4.47. This was the average share price over six days as prescribed by the SAYE scheme rules. The option exercise price is £3.58, i.e. at a discount of 20% to the market value at the date of grant (as permitted by tax legislation).
The following awards of Balance Sheet Carry points were made in the financial year:
Balance Sheet Carry points
Christophe Evain 2.11%
Benoît Durteste 2.11%
Philip Keller 1.41%
The percentages represent the individuals’ share of the total carry available.
No shadow carry points were granted in this year.
No values have been attributed to carry points awarded at the year end as their value will fluctuate with the performance of the underlying investments and are dependent on them achieving their hurdle return. Payments from Balance Sheet Carry and Shadow Carry Awards are disclosed in the single total figure of remuneration in the year in which they become due.
The following allocation of TPC was made in respect of the financial year.
% of EF06B TPC points % of Fund VI TPC Points
Christophe Evain 10.00% 9.75%
Benoît Durteste 17.00% 9.75%
Philip Keller 3.33% 3.25%
The percentages represent the individuals’ share of the carry points available.
Further details of these funds are available on page 28.

ANNUAL REPORT ON REMUNERATION CONTINUED
ICG ANNUAL REPORT & ACCOUNTS 2015 CHAIRMAN’S LETTER
BOARD OF DIRECTORS
REMUNERATIONCOMMITTEE REPORTS
DIRECTORS’ REPORT
CORPORATE GOVERNANCE
DIRECTORS’ INTERESTS IN SHARES (AUDITED)
At 31 March 2015, Directors held the following interests in shares of the Company:
Managing Directors
Shareholding requirement
Shares held outright
DSA, FMC Equity Award and PLC
Equity Award interests
SAYE options subject
to service condition
Share options subject to
performance
Share options vested but
unexercisedProportion of annual salary
Number of shares
Shareholding requirement met?
Christophe Evain 200% 134,921 Yes 1,097,977 2,731,541 5,027 60,855 104,035
Philip Keller 200% 134,921 Yes 527,866 1,809,458 5,106 27,983 181,439
Benoît Durteste 200% 134,921 Yes 296,359 1,133,160 2,593 48,687 67,840
Non Executive Directors
Justin Dowley N/A – – 119,639 – – – –
Peter Gibbs N/A – – – – – – –
Kevin Parry N/A – – – – – – –
Kathryn Purves N/A – – – – – – –
Kim Wahl N/A – – – – – – –
Subsequently, DSA and PLC Equity Awards were made to Managing Directors on 20 May 2015 in respect of their prior year performance. A total of 524,476 interests over shares were awarded to Christophe Evain, a total of 588,450 interests over shares were awarded to Benoît Durteste and a total of 209,443 interests over shares were awarded to Philip Keller. Other than these awards, there were no changes to the shareholdings between the year end and 21 May 2015.
During the year, 111,997 options over shares in favour of Christophe Evain were exercised. The market price on the date of exercise was £4.8622 and the total gain on exercise was £64,532.67.
The share price at 31 March 2015 was £5.035. The average option exercise price of vested but unexercised options held by Managing Directors is £5.4386.
SHAREHOLDER DILUTION
For all awards made during the 2010/11 financial year and subsequent financial years, the Company has and intends in the future to use market purchased shares to satisfy any equity settled incentive awards.
The Committee has set a dilution limit for FMC Equity Awards (the FMC Equity Pool) of 20% of the issued share capital of the FMC that may be made the subject of FMC Equity Awards.
The Company established the Intermediate Capital Group plc 2002 Employee Benefit Trust which may be used to hold shares and cash in conjunction with employee incentive schemes established by the Company from time to time.
CARRIED INTEREST ON THIRD PARTY FUNDS
The Company has established for its executives (including Managing Directors) carried interest arrangements under which between 60% and 80% of the carried interest negotiated by the Company in respect of managed funds raised since 21 January 1998 is available for allocation to its executives. Those executives to whom allocations are made pay full market value for the interests at the time of acquisition hence no remuneration arises. The allocation of carried interest entitlements as at 31 March 2015 was as follows:
ICG Mezzanine Fund 2000
ICG Mezzanine Fund 2003
Intermediate Capital
Asia Pacific Mezzanine Fund 2005
Intermediate Capital
Asia Pacific
Fund 2008
ICG Minority Partners
Fund 2008
ICG Recovery
Fund 2008
ICG EuropeFund V
ICG Minority
Debt Partners
EF06 B Fund
ICGEuropeFund VI
Managing Directors 4.7% 12.4% 9.5% 21.3% 21.1% 22.0% 21.6% 20.0% 30.0% 22.8%
Former Managing Directors 26.0% 25.1% 21.6% 4.3% 21.0% 7.0% 0.0% 0.0% 0.0% 0.0%
Other executives 29.3% 37.5% 43.9% 54.4% 37.9% 51.0% 58.4% 60.0% 50.0% 57.2%
ICG 40.0% 25.0% 25.0% 20.0% 20.0% 20.0% 20.0% 20.0% 20.0% 20.0%
Total 100.0% 100.0% 100.0% 100.0% 100.0% 100.0% 100.0% 100.0% 100.0% 100.0%
These carry holdings include third party carry and shadow carry.
Further details of each of these funds can be found on page 28.

92 / 93
STRATEGIC REPORT
GOVERNANCE REPORT
FINANCIAL STATEMENTS
MANAGING DIRECTORS’ CO-INVESTMENT IN THIRD PARTY FUNDS
Increasingly, fund investors expect Managing Directors to co-invest in funds. The following amounts have been invested by current Managing Directors from their own resources into third party funds operated by ICG:
Managing Director EOS Longbow III Total Credit EF 06 EF 06 B ICAP 08 IMP 08 RF 08 Fund V SDP
Christophe Evain €250,000 – – €750,000 €775,407 $250,000 €375,000 €150,000 €2,100,000 €250,000
Benoît Durteste €400,000 – – – €616,542 – €11,700 – €2,250,000 €250,000
Philip Keller €100,000 £150,000 €100,000 €350,000 €428,307 – – €150,000 €500,000 –
FEES PAID TO NON EXECUTIVE DIRECTORS (AUDITED)
In the financial year under review, Non Executive Directors’ fees were as follows:
Committee membership
Non Executive Directors
Board membership
fees£000
Board and Committee
Chairman fees £000
Senior Independent Director fee
£000Audit
£000Remuneration
£000 Risk £000
Annualised total for year ending 2015
£000
Annualised total for year ending 2014
£000
Justin Dowley (Chairman) – 180.0 – – 5.0 5.0 190.0 180.0
Peter Gibbs 56.5 20.0 – 5.0 – 5.0 86.5 80.0
Lindsey McMurray* 56.5 – – 5.0 5.0 5.0 71.5 65.0
Kevin Parry 56.5 20.0 5.0 – 5.0 – 86.5 75.0
Kathryn Purves* 56.5 – – 5.0 – 5.0 66.5 –
Kim Wahl 56.5 – – 5.0 5.0 5.0 71.5 64.5
*Lindsey McMurray retired and Kathryn Purves was appointed on 17 October 2014.
PAYMENTS FOR LOSS OF OFFICE (AUDITED)
No payments were made for loss of office in the financial year under review.
PAYMENTS MADE TO PAST DIRECTORS (AUDITED)
In the financial year ended 31 March 2015, the following payments were made to former Directors in respect of shadow carry and the vesting of PLC Equity awarded while they were Managing Directors.
Employee PLC Equity Vesting Shadow Carry Payments Total
Tom Attwood £885,039.08 £121,651.96 £1,006,691.04
Francois de Mitry £2,181,777.39 £81,172.41 £2,262,949.80
Andrew Phillips – £790,072.89 £790,072.89
Paul Piper – £54,081.69 £54,081.69

ANNUAL REPORT ON REMUNERATION CONTINUED
ICG ANNUAL REPORT & ACCOUNTS 2015 CHAIRMAN’S LETTER
BOARD OF DIRECTORS
REMUNERATIONCOMMITTEE REPORTS
DIRECTORS’ REPORT
CORPORATE GOVERNANCE
PERFORMANCE GRAPH OF TOTAL SHAREHOLDER RETURN
The graph below shows a comparison between the Company’s total shareholder return performance and the total shareholder return for all the financial services companies in the FTSE All Share index. The graph compares the value, at 31 March 2009, of £100 invested in Intermediate Capital Group plc to the FTSE All Share Financial Index over the subsequent six years. This index has been chosen to give a comparison with the average returns that shareholders could have received by investing in a range of other major financial services companies.
31 Mar 13
500
600
400
300
200
100
031 Mar 09 31 Mar 11 31 Mar 1231 Mar 10 31 Mar 14 31 Mar 15
Intermediate Capital Group FTSE All Shares financials Source: Bloomberg
£
TOTAL REMUNERATION OF THE CHIEF EXECUTIVE OFFICER
The table below details the total remuneration of the Director holding the position of Chief Executive Officer of Intermediate Capital Group plc for the past six years.
Total remuneration
£000
Percentage of maximum opportunity of short term
incentives awarded
Percentage of maximum opportunity of long term
incentives awarded
2015 Christophe Evain 5,103 80% 98%
2014 Christophe Evain 4,797 97% 20%
2013 Christophe Evain 1,492 24% 1%
2012 Tom Attwood 2,973 0% 100%
2011 Tom Attwood 5,941 29% 97%
2010 Tom Attwood 4,631 44% 100%
The long term incentive figures above for Tom Attwood include payments made under the Medium Term Incentive Scheme (MTIS), a compensation arrangement which has now closed.
PERCENTAGE CHANGE IN REMUNERATION OF DIRECTOR UNDERTAKING THE ROLE OF CHIEF EXECUTIVE
The table below details how changes to the CEO’s pay compare with the change in the average pay across all employees of the Group. Each figure is a percentage change of the values between the previous financial year and the financial year under review. The total permanent workforce has been selected as the comparator for salaries and fees and short term incentives. The comparison of the increase in taxable benefits has been made for UK permanent employees only as their remuneration packages are most similar to that of the Chief Executive.
Salaries and fees Taxable benefits Short term incentives
Chief Executive Officer 2.5% - 93.27% - 17.56%
All employees 3.88% - 68.29% - 37.25%
The reduction in the average short term incentives for all employees is largely a reflection of the changing underlying profile of ICG’s workforce, as we move into new products and businesses and continue building our business infrastructure.

94 / 95
STRATEGIC REPORT
GOVERNANCE REPORT
FINANCIAL STATEMENTS
RELATIVE IMPORTANCE OF SPEND ON PAY
The graph below illustrates the relative importance of spend on pay compared with other disbursements from profit (namely distributions to shareholders) for the financial year under review and the previous financial year. The current year shareholder distributions include a proposed special dividend of £300m which the Group announced with its 2015 results. The prior year includes a share buyback of £100m.
+108% change
1514
Shareholder distributions(£m)
+31% change
1514
staffcosts(£m)
380.4183.3 87.266.4
STATEMENT OF IMPLEMENTATION OF REMUNERATION POLICY IN FOLLOWING FINANCIAL YEAR
The proposed salaries for the Managing Directors and fees for the Non Executive Directors for the 2015/16 financial year are set out below, together with the increase from the previous financial year.
Annual salaries and fees £000
Managing Director Y/E 31 March 2016 Y/E 31 March 2015 % change
Christophe Evain 369.0 360.0 2.5%
Philip Keller 369.0 360.0 2.5%
Benoît Durteste 369.0 360.0 2.5%
Justin Dowley 195.0 190.0 2.6%
Peter Gibbs 88.0 86.5 2.1%
Kathryn Purves 68.0 66.5 2.2%
Kevin Parry 98.0 86.5 11.7%
Kim Wahl 73.0 71.5 2.1%
The increased fees for Kevin Parry relate to his Chairmanship of the Risk and Audit Committees and reflect the increasing demands and responsibilities of these positions.
For 2015/16, the Annual Award Pool will be calculated as a percentage of cash profits which, over a period of five years, will not exceed 30% on average. The Annual Award Pool will be calculated as described in the Directors’ remuneration policy. All incentives (excluding TPC and similar arrangements in respect of business acquisitions or ICG direct investment funds that do not give rise to a cost or liability to the Group) payable to employees of the Group will be funded out of the Annual Award Pool.
The Managing Directors’ annual bonus and other incentives will be dependent on them achieving the objectives set for them in the following areas:
– Fundraising and growth
– Investment performance
– Risk management measures
– Financial performance
Where applicable, the long term targets for these objectives will be consistent with those set out on page 90. Where targets are not already stated, the Board considers that these are commercially sensitive at this point in time.
Awards made from June 2015 will be subject to both Malus and Clawback (which will apply for two years post vesting). Although Awards made to Managing Directors are made from the AAP, which is derived from realised gains, the Board felt it appropriate to increase accountability and shareholder alignment by introducing these provisions. Forfeiture of compensation may be triggered by, amongst other things, a misstatement of the accounts, fraud, regulatory breaches and serious breaches of contract.

ANNUAL REPORT ON REMUNERATION CONTINUED
ICG ANNUAL REPORT & ACCOUNTS 2015 CHAIRMAN’S LETTER
BOARD OF DIRECTORS
REMUNERATIONCOMMITTEE REPORTS
DIRECTORS’ REPORT
CORPORATE GOVERNANCE
REMUNERATION COMMITTEE
COMPOSITION, REMIT AND OPERATION
The Committee is authorised by the Board to determine and agree the framework for the remuneration of the Chairman of the Company, the Managing Directors and such other members of the executive management as it is instructed by the Board to consider and is also responsible for determining the total individual remuneration package of each Managing Director, having given due regard to the contents of the Code, as well as the Listing Rules. The Committee is responsible for determining targets for any performance related pay schemes operated by the Company as well as the policy for pension arrangements for each Managing Director. The Committee is responsible for the overall remuneration policy for all the Group’s staff and takes into account the requirement that the remuneration arrangements should:
– Be consistent with and promote sound and effective risk management, and do not encourage excessive risk taking
– Be in line with the strategic priorities, objectives, values and long term interests of the Group
– Include measures to avoid conflict of interest
– Take into account the long term interests of shareholders, investors and other stakeholders
– Be formulated on the basis of advice from the Group’s compliance function, particularly in relation to performance measurement
The Committee comprises four independent Non Executive Directors:
– Peter Gibbs (Chairman)
– Justin Dowley
– Kevin Parry
– Kim Wahl
None of the Committee members have any personal financial interests (other than as shareholders or investors in ICG funds), conflicts of interest arising from cross directorships or day to day involvement in running the business. The Company therefore considers that it complies with the Code recommendations regarding the composition of the Committee.
The Committee meets at least three times a year and more frequently if necessary. Managing Directors and Kathryn Purves attend the meetings by invitation and the Committee consults the Managing Directors about its proposals and has access to professional advice from outside the Company. The Head of Human Resources also attends the meetings as secretary. No Director is involved in any decisions as to their own remuneration.
A table showing the number of Committee meetings held during the year and the attendance record of individual Directors can be found in the Corporate Governance section on page 55.
COMMITTEE EVALUATION
In May 2015 an evaluation of the Committee’s effectiveness was undertaken by the Committee Chairman. The responses were shared with the Committee.The Chairman’s evaluation of the Remuneration Committee concluded that in general, the Committee operates well. The evaluation did note the importance for the Committee to have available an appropriate range of benchmarking data for comparator companies. The Committee recognised the importance of ensuring appropriate time was allocated to discussion of Committee matters, including both with and without Managing Directors present.

96 / 97
STRATEGIC REPORT
GOVERNANCE REPORT
FINANCIAL STATEMENTS
ADVISERS TO THE COMMITTEE
PricewaterhouseCoopers (PwC)has been appointed by the Committee and advises management on remuneration issues. PwC also provides advice to the Committee on other HR issues on request. Advisers are selected on the basis of their expertise in the area and with a view to ensuring independence from other advisers to the Group. The Committee is therefore confident that independent and objective advice is received from their advisers.
Mayer Brown have been available to advise the Committee during the year to 31 March 2015. These advisers were appointed by the Company.
The fees charged for advice to the Committee were £96,051 (PwC). Fees are charged on the basis of time spent. The following topics were discussed and addressed as required:
STATEMENT OF VOTING AT GENERAL MEETING
At the last Annual General Meeting, votes on the Remuneration report were cast as follows:
Votes for Votes against Abstentions Reasons for votes against, if known and actions taken by the Committee
Directors’ remuneration report
77.32% 22.68% 53,190,123 As disclosed in the Engagement with Stakeholders section of the Governance Report on page 58, Directors of the Company have met with a number of shareholders in the period subsequent to this vote to understand their concerns. A number of the points raised by shareholders have been addressed during the year; in particular, the Company has enhanced disclosure of key performance indicators for Executive Directors (see page 90) and has introduced provisions in respect of Malus and Clawback (see page 95).
Remuneration Policy
79.85% 20.15% 18,112,805
MEETINGS TOPICS ADDRESSED
May Review and approval of compensation recommendations for FY13 and awards for FY14 taking into account advice from the Group’s compliance function in relation to performance measurement
Review of FMC valuation
Remuneration Committee Terms of Reference
Review of EBT settlement arrangements
Cash profit
Compensation market data
November Regulatory Update
SAYE Rule Amendments
Reviews of EBT settlement arrangements
Review of bonus commitments
Carried Interest Allocations
Shareholder feedback
January Review of emerging trends within remuneration regulation and governance
Review of EBT settlement arrangements
BSC Rule Amendments
Approval of Remuneration Committee annual timetable
Directors’ remuneration report including Malus and Clawback provisions
ICG Remuneration Policy annual review
March Review of Annual Award Pool and market data
Directors’ remuneration report
European Fund VI carried interest allocations
Review of EBT arrangements
BSC Point Allocations
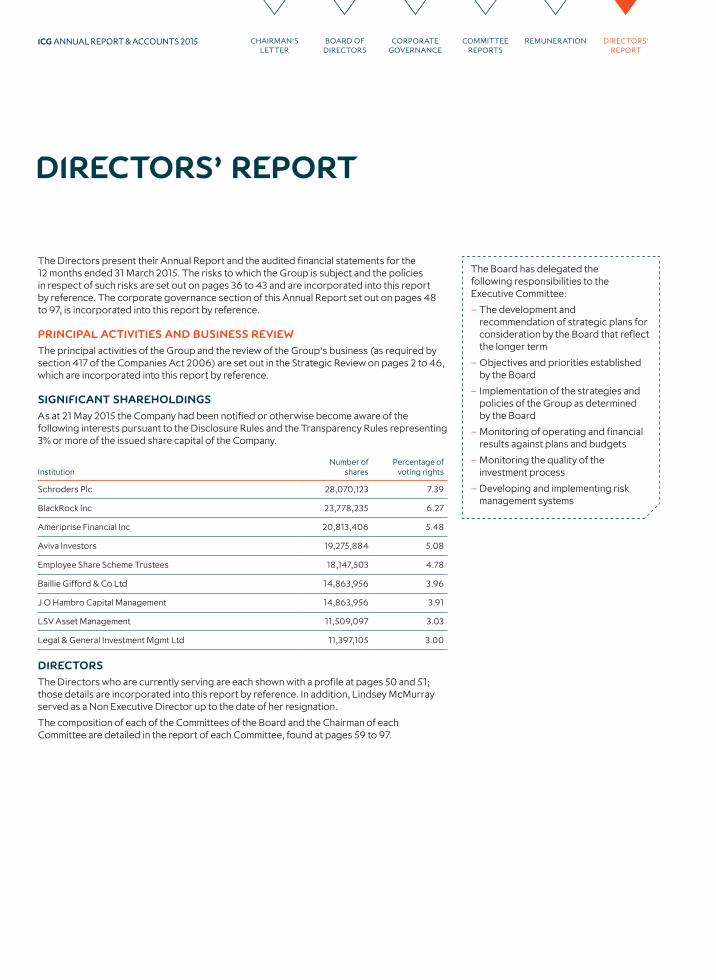
The Board has delegated the following responsibilities to the Executive Committee:
– The development and recommendation of strategic plans for consideration by the Board that reflect the longer term
– Objectives and priorities established by the Board
– Implementation of the strategies and policies of the Group as determined by the Board
– Monitoring of operating and financial results against plans and budgets
– Monitoring the quality of the investment process
– Developing and implementing risk management systems
DIRECTORS’ REPORT
The Directors present their Annual Report and the audited financial statements for the 12 months ended 31 March 2015. The risks to which the Group is subject and the policies in respect of such risks are set out on pages 36 to 43 and are incorporated into this report by reference. The corporate governance section of this Annual Report set out on pages 48to 97, is incorporated into this report by reference.
PRINCIPAL ACTIVITIES AND BUSINESS REVIEW
The principal activities of the Group and the review of the Group’s business (as required by section 417 of the Companies Act 2006) are set out in the Strategic Review on pages 2 to 46, which are incorporated into this report by reference.
SIGNIFICANT SHAREHOLDINGS
As at 21 May 2015 the Company had been notified or otherwise become aware of the following interests pursuant to the Disclosure Rules and the Transparency Rules representing 3% or more of the issued share capital of the Company.
InstitutionNumber of
sharesPercentage of
voting rights
Schroders Plc 28,070,123 7.39
BlackRock Inc 23,778,235 6.27
Ameriprise Financial Inc 20,813,406 5.48
Aviva Investors 19,275,884 5.08
Employee Share Scheme Trustees 18,147,503 4.78
Baillie Gifford & Co Ltd 14,863,956 3.96
J O Hambro Capital Management 14,863,956 3.91
LSV Asset Management 11,509,097 3.03
Legal & General Investment Mgmt Ltd 11,397,105 3.00
DIRECTORS
The Directors who are currently serving are each shown with a profile at pages 50 and 51; those details are incorporated into this report by reference. In addition, Lindsey McMurray served as a Non Executive Director up to the date of her resignation.
The composition of each of the Committees of the Board and the Chairman of each Committee are detailed in the report of each Committee, found at pages 59 to 97.
ICG ANNUAL REPORT & ACCOUNTS 2015 CHAIRMAN’S LETTER
BOARD OF DIRECTORS
REMUNERATIONCOMMITTEE REPORTS
DIRECTORS’ REPORT
CORPORATE GOVERNANCE

DIRECTORS’ INTERESTS
The interests of Directors who held office at 31 March 2015 and their connected persons, as defined by the Companies Act, are disclosed in the report of the Remuneration Committee at page 92. There have been no changes to the Directors’ interests in shares at 31 March 2015 as set out above as at 21 May 2015.
Details of Directors’ share options are provided in the report of the Remuneration Committee on pages 76 to 97. During the financial year ending 31 March 2015, the Directors had no options over or other interests in the shares of any subsidiary company. No Company shares were issued to Directors under the Executive Share Option Schemes during the year.
THE ROLES OF THE CHAIRMAN AND CHIEF EXECUTIVE
In accordance with the Code, the Board has adopted a formal division of responsibilities between the Chairman and the CEO, with the intention to establish a clear division of responsibilities between the running of the Board and the executive responsibility for the running of the Company’s business.
The Chairman was considered independent at the date of his appointment as Chairman.
DISCLOSURE DOCUMENTS
The Terms of Reference of each of the Board Committees, together with the Directors’ service agreements, the terms and conditions of appointment of Non Executive Directors and Directors’ deeds of indemnity, are available for inspection at the Company’s registered office during normal business hours.
COMMITTEE PROCEEDINGS
Each Committee has access to such external advice as it may consider appropriate. The Terms of Reference of each Committee are considered regularly by the respective Committee and referred to the Board for approval.
EXECUTIVE COMMITTEE
The Executive Committee consists of the three Executive Directors, each of whom has a specific area of responsibility. The Executive Committee has general responsibility for ICG’s resources, determining strategy, financial and operational control and managing the business worldwide. Christophe Evain is Chief Executive Officer and in addition to his strategic and operational remit he oversees the Group’s Investment Committees in his role as the Chief Investment Officer. He is also responsible for the Group’s credit funds business. Philip Keller is Chief Financial Officer and is responsible for finance and infrastructure. Benoît Durteste is Head of European Investments and Fund Manager.
No one Executive Director is able to significantly affect the running of the Company without consulting his colleagues.
BOARD PROCESS
Each Board member receives a comprehensive Board pack at least five days prior to each meeting which incorporates a formal agenda together with supporting papers for items to be discussed at the meeting. Further information is obtained by the Board from the Managing Directors and other relevant members of senior management, as the Board, particularly its Non Executive Directors, consider appropriate. A similar process is followed for each Committee.
ADVICE FOR DIRECTORS
All Directors have access to the advice and services of the Company Secretary and the Secretaries to each of the Committees on which they serve, and may take independent professional advice at the Company’s expense in the furtherance of their duties. The appointment or removal of the Company Secretary would be a matter for the Board.
MEETINGS WITH CHAIRMAN
The Non Executive Directors, at least annually, hold meetings in the absence of the Managing Directors and, separately, in the absence of the Chairman.
SENIOR INDEPENDENT DIRECTOR
Kevin Parry holds the position of Senior Independent Director of the Company. In accordance with the Code, any shareholder concerns not resolved through the usual mechanisms for investor communication can be conveyed to the Senior Independent Director.
DIRECTORS’ INDEMNITY
The Company has entered into contractual indemnities with each of the Directors pursuant to the amendment to the Company’s Articles of Association authorised at the 2010 AGM and these remain in force. The Company also provides Directors’ and Officers’ insurance for the Directors.
CONFLICTS OF INTEREST
Directors have a statutory duty to avoid conflicts of interest with the Company. The Company’s Articles of Association allow the Directors to authorise conflicts of interest and the Board has adopted a policy and effective procedures for managing and, where appropriate, approving potential conflicts of interest.
98 / 99
STRATEGIC REPORT
GOVERNANCE REPORT
FINANCIAL STATEMENTS

INTERNAL CONTROL
The Board has overall responsibility for the Company’s internal control system and reviews its effectiveness at least annually. Such a system of control is in place to give reasonable, but not absolute, assurance that assets are safeguarded, transactions are authorised and recorded properly and that material errors and irregularities are prevented or detected within a timely period.
Through the regular meetings of the Board and the schedule of matters reserved to the Board or its duly authorised Committees, the Board aims to maintain full and effective control over appropriate strategic, financial, operational and compliance issues. The Board has put in place an organisational structure with clearly defined lines of responsibility and delegation of authority.
The Board annually considers and approves a strategic plan and budget. In addition there are established procedures and processes in place for the making and monitoring of investments and the planning and controlling of expenditure. The Board also receives regular reports from the Executive Committee on the Company’s operational and financial performance, measured against the annual budget as well as regulatory and compliance matters.
The Company has in place arrangements whereby employees may raise matters of concern in confidence about possible improprieties in matters of financial reporting or other matters.
The rationale for the system of internal control is to maximise effectiveness for the commercial management of the business and to provide the Board with regular and effective reporting on the identified significant risk factors. The Board is responsible for determining strategies and policies for risk control, and management is responsible for implementing such strategies and policies.
The Board confirms that an ongoing process for identifying, evaluating and managing the Group’s significant risks has operated throughout the year and that, up to the date of the approval of the Directors’ report and financial statements, the Board continues to apply the procedures necessary to comply with the requirements of the Turnbull Committee guidelines ‘Internal Control – Guidance for Directors on the Combined Code’. For further details of the risks relating to the Group, please see pages 36 to 43 and the report of the Risk Committee on pages 68 to 72.
GOING CONCERN STATEMENT
The Directors have at the time of approving the financial statements, a reasonable expectation that the Company and the Group have adequate resources to continue in operational existence for the foreseeable future. Therefore they continue to adopt the going concern basis of preparing the financial accounts.
The Directors have made this assessment in light of the £758.4m cash and unutilised debt facilities following a period of high realisations, no significant bank facilities maturing within the next two years, and after reviewing the Group’s latest forecasts for a period of two years from year end.
The Group’s business activities, together with the factors likely to affect its future development, performance and position are set out in the Strategic Report on pages 4 to 46. The financial position of the Group, its cash flows, liquidity position and borrowing facilities are described in the Financial Review on pages 30 to 35. In addition, note 5 to the financial statements includes the Group’s objectives, policies and processes for managing its capital; its financial risk management objectives; details of its financial instruments and hedging activities; and its exposures to credit risk and liquidity risk.
The Directors believe that the Group and Company are well placed to manage its business risks successfully in the current economic environment.
The Directors continually monitor the debt profile of the Group and Company, and seek to refinance senior facilities a substantial period before they mature. The Group and Company have a total of £40.9m of drawn debt facilities due to mature within the next 12 months. The Directors are satisfied that this is not material in the overall context of the Group’s debt profile.
FORWARD-LOOKING STATEMENTS
This Annual Report includes statements that are, or may be deemed to be, ‘forward-looking statements’. These forward-looking statements can be identified by the use of forward-looking expressions, including the terms ‘believes’, ‘estimates’, ‘anticipates’, ‘expects’, ‘intends’, ‘may’, ‘will’, or ‘should’ or, in each case, their negative or other variations or similar expressions, or by discussions of strategy, plans, objectives, goals, future events or intentions. These forward-looking statements include all matters that are not historical facts. They appear in a number of places throughout this Annual Report and include, but are not limited to, the following: statements regarding the intentions, beliefs or current expectations of the Directors, the Company and the Group concerning, amongst other things, the Group’s results of operations, financial condition, liquidity, prospects, growth, strategies and the industries in which the Group operates.
DIRECTORS’ REPORT CONTINUED
ICG ANNUAL REPORT & ACCOUNTS 2015 CHAIRMAN’S LETTER
BOARD OF DIRECTORS
REMUNERATIONCOMMITTEE REPORTS
DIRECTORS’ REPORT
CORPORATE GOVERNANCE

By their nature, forward-looking statements involve risk and uncertainty because they relate to future events and circumstances. Forward-looking statements are not guarantees of future performance and the actual results of the Group’s operations, financial condition and liquidity, and the development of the countries and the industries in which the Group operates may differ materially from those described in, or suggested by, the forward-looking statements contained in this Annual Report. In addition, even if the results of operations, financial condition and liquidity, and the development of the countries and the industries in which the Group operates, are consistent with the forward-looking statements contained in this Annual Report, those results or developments may not be indicative of results or developments in subsequent periods. Many of these factors are beyond the control of the Directors, the Company and the Group. Should one or more of these risks or uncertainties materialise, or should underlying assumptions on which the forward-looking statements are based prove incorrect, actual results may vary materially from those described in this Annual Report. Except to the extent required by laws and regulations, the Directors, the Company and the Group do not intend, and do not assume any obligation, to update any forward-looking statements set out in this Annual Report.
CHANGE OF CONTROL AGREEMENTS
There are no significant agreements to which the Group is a party that take effect, alter or terminate upon a change of control of the Group, other than:
1. The Private Placement arrangement totalling £81m equivalent dated 28 February 2007 where a change of control gives rise to a downgrade in the credit rating and the loans are thereafter repayable on demand
2. The Private Placement arrangement totalling £35m equivalent dated 26 June 2008, the Private Placement arrangement totalling $150m dated 8 May 2013 and the Private Placement arrangement totalling £258m equivalent dated 11 May 2015 where a change of control in the Company gives rise to an event of default under the agreements. The loans are thereafter repayable on demand
3. £75m Private loan arrangements signed on 9 November 2011 under which a change of control triggers an immediate prepayment obligation of all outstanding principal, accrued interest and all other amounts due under the agreement, and a further Private Placement arrangement for €11m agreed in November 2012 on the same terms
4. Six bilateral loan facility agreements totalling £657m of available facility amounts each amended and extended in May 2015 where a change of control gives lenders the right, but not the obligation, to cancel their commitments to the facility and declare the loans repayable on demand
5. The terms and conditions of (a) the £35m retail bond issue which took place in December 2011 (b) the £80m retail bond issue which took place in September 2012 (c) the €50m wholesale bond issue which took place in March 2014 (d) the €25m wholesale bond issue which took place in June 2014 and (e) the £160m bond issue which took place in March 2015 each set out that following change of control event, investors have the right but not the obligation to sell their notes to ICG if the change of control results in either a credit ratings downgrade from investment grade to sub-investment grade, or a downgrade of one or more notches if already sub-investment grade
6. The employee share schemes, details of which can be found in the Report of the Remuneration Committee on pages 62 to 80, Awards and options under the 2001 Approved and Unapproved Executive Share Option Schemes and SAYE Plan 2004 become exercisable for a limited period following a change of control whereas awards under the KERSP will only become exercisable if the Remuneration Committee so decides. Awards and options under the Omnibus Plan and the BSC Plan vest immediately on a change of control
There are no agreements between the Group and its Directors or employees providing for compensation for loss of office or employment that occurs because of a takeover bid apart from (1) those described at 6 above and (2) the usual payment in lieu of notice.
100 / 101
STRATEGIC REPORT
GOVERNANCE REPORT
FINANCIAL STATEMENTS

DIVIDEND
The Directors recommend a final net ordinary dividend payment in respect of the ordinary shares of the Company at a rate of 15.1p per share (2014: 14.4p), which when added to the interim net dividend of 6.9p per share (2014: 6.6p), gives a total net dividend for the year of 22.0p per share (2014: 21.0p). The amount of dividend paid in the year was £81.0m (2014: £78.2m). In addition, the Directors recommend a £300m special dividend payable at a rate of 82.6 pence per share. An associated share consolidation is also recommended. All recommendations are subject to the approval of shareholders at the Company’s AGM on 15 July 2015.
DISCLOSURES REQUIRED UNDER UK LISTING RULE 9.8.4
Dividend waivers have been issued in respect of shares which are (a) held by the Group’s Employee Benefit Trust, or (b) held as Treasury Shares; other than this, there are no disclosures required to be made under UK Listing Rule 9.8.4.
AUDITOR
A resolution for the reappointment of the current auditor, Deloitte LLP, will be proposed at the forthcoming AGM. Details of auditor’s remuneration for audit and non audit work are disclosed in note 11 to the accounts.
INTERMEDIATE CAPITAL MANAGERS LIMITED
A French branch of Intermediate Capital Managers Limited was opened during the year.
DISCLOSURE OF INFORMATION TO THE AUDITOR
Each of the persons who is a Director at the date of approval of this report confirms that:
(a) So far as the Director is aware, there is no relevant audit information of which the Company’s auditor is unaware
(b) The Director has taken all reasonable steps that they ought to have taken as a Director in order to make themselves aware of any relevant audit information and to ensure that the Company’s auditor is aware of that information
This confirmation is given and should be interpreted in accordance with the provisions of section 418 of the Companies Act 2006.
POST BALANCE SHEET EVENTS
Material events since the balance sheet date are described in note 35 and form part of the Directors’ report disclosures.
POLITICAL AND CHARITABLE CONTRIBUTIONS
No contributions were made during the current and prior year for political purposes. The charitable donations made by the Company are detailed at page 46, which forms part of the Directors’ report disclosures.
GREENHOUSE GAS EMISSIONS
All disclosures concerning the Group’s greenhouse gas emissions are detailed on page 46, which forms part of the Directors’ report disclosures.
ACQUISITION OF SHARES BY EMPLOYEE BENEFIT TRUST
Acquisitions of shares by the Intermediate Capital Group Employee Benefit Trust 2002 purchased during the year are as described in note 22 to the financial statements.
SHARE CAPITAL AND RIGHTS ATTACHING TO THE COMPANY’S SHARES
As at 31 March 2015 the issued share capital of the Company was 402,804,840 ordinary shares of 20p each (including 22,586,197 shares held in treasury). Certain key matters regarding the Company’s share capital are noted below:
– Under the Company’s Articles of Association, any share in the Company may be issued with such rights or restrictions, whether in regard to dividend, voting, transfer, return of capital or otherwise as the Company may from time to time by ordinary resolution determine or, in the absence of any such determination, as the Board may determine. All shares currently in issue are ordinary shares of 20p each carrying equal rights
– At a general meeting of the Company every member present in person or by a duly appointed proxy has one vote on a show of hands and on a poll one vote for each share held
– The Intermediate Capital Group Employee Benefit Trust 2002 holds shares which may be used to satisfy options and awards granted under the Company’s employee share schemes including its long term incentive plans. The voting rights of these shares are exercisable by the trustees in accordance with their fiduciary duties
DIRECTORS’ REPORT CONTINUED
ICG ANNUAL REPORT & ACCOUNTS 2015 CHAIRMAN’S LETTER
BOARD OF DIRECTORS
REMUNERATIONCOMMITTEE REPORTS
DIRECTORS’ REPORT
CORPORATE GOVERNANCE

– The notice of any general meeting specifies deadlines for exercising voting rights either by proxy or present in person in relation to resolutions to be passed at a general meeting
– No shareholder is, unless the Board decides otherwise, entitled to attend or vote either personally or by proxy at a general meeting or to exercise any other right conferred by being a shareholder if:
–They or any person with an interest in shares has been sent a notice under section 793 of the Companies Act 2006 (which confers upon public companies the power to require information with respect to interests in their voting shares)
–They or any interested person has failed to supply the Company with the information requested within 14 days where the shares subject to the notice (the ‘default shares’) represent at least 0.25% of their class or in any other case 28 days after delivery of the notice. Where the default shares represent 0.25% of their class, unless the Board decides otherwise, no dividend is payable in respect of those default shares and no transfer of any default shares shall be registered. These restrictions end seven days after receipt by the Company of a notice of an approved transfer of the shares or all the information required by the relevant section 793 notice, whichever is the earlier
– The Directors may refuse to register any transfer of any share which is not a fully paid share, although such discretion may not be exercised in a way which the Financial Conduct Authority regards as preventing dealings in the shares of the relevant class or classes from taking place on an open and proper basis. The Directors may likewise refuse to register any transfer of a share in favour of more than four persons jointly
The Company is not aware of any other restrictions on the transfer of ordinary shares in the Company other than:
– Certain restrictions that may from time to time be imposed by laws and regulations (for example, insider trading laws or the UK Takeover Code)
– Pursuant to the Listing Rules of the Financial Conduct Authority whereby certain employees of the Company require approval of the Company to deal in the Company’s shares
The Company is not aware of any agreements between shareholders that may result in restrictions on the transfer of securities or voting rights.
At the 2014 Annual General Meeting the Directors were given the power to allot shares and grant rights to subscribe for, or convert any security into, shares: up to an aggregate nominal amount of £26,780,000 and, in the case of a fully pre-emptive rights issue only, up to a total amount of £53,560,000.
A resolution will be proposed to renew the Company’s authority to allot further new shares at the forthcoming AGM. In accordance with applicable institutional guidelines, the proposed new authority will allow the Directors to allot ordinary shares equal to an amount of up to one third of the Company’s issued ordinary share capital as at 21 May 2015 plus, in the case of a fully pre-emptive rights issue only, a further amount of up to an additional one third of the Company’s issued share capital as at 21 May 2015. The authority for Directors to allot shares in the Company’s shares is renewed annually and approval will be sought at the forthcoming AGM for its renewal.
The Directors’ authority to effect purchases of the Company’s shares on the Company’s behalf is conferred by resolution of shareholders. At the 2014 AGM the Company was granted authority to purchase its own shares up to an aggregate value of approximately 10% of the issued ordinary share capital of the Company as at 23 May 2014. During the year 22,586,197 shares were bought back and held as Treasury shares. The authority to effect purchases of the Company’s shares is renewed annually and approval will be sought at the forthcoming AGM for its renewal.
POWERS OF DIRECTORS
Subject to its Articles of Association and relevant statutory law and to such direction as may be given by the Company by special resolution, the business of the Company is managed by the Board, who may exercise all powers of the Company whether relating to the management of the business or not.
The Company’s Articles of Association give power to the Board to appoint Directors. The Articles also require any Directors appointed by the Board to submit themselves for election at the first AGM following their appointment and for one third of the Company’s Directors to retire by rotation at each AGM. Directors may resign or be removed by an ordinary resolution of shareholders. Notwithstanding the above, the Company has elected, in accordance with the UK Corporate Governance Code to have all Directors reappointed on an annual basis.
RELATIONSHIPS WITH SHAREHOLDERS
The Company recognises the importance of communication with its shareholders, particularly through interim and annual reports and the AGM. The Chief Executive, Chief Financial Office and the Chairmen of the Board and each of its Committees will be available to answer shareholders’ questions at the AGM. The number of proxy votes lodged in connection with the Company’s AGM are announced following the conclusion of the relevant meeting.
102 / 103
STRATEGIC REPORT
GOVERNANCE REPORT
FINANCIAL STATEMENTS

DIRECTORS’ REPORT CONTINUED
RESULTS OF RESOLUTIONS PROPOSED AT 2014 ANNUAL GENERAL MEETING
Resolution Votes for Votes against Votes withheld
Receive the financial statements and reports of the Directors and auditors for the financial year ended 31 March 2014 1 290,455,606 1,500 197,190
Approve the Directors’ remuneration report for the financial year ended 31 March 2014 2 183,610,904 53,853,267 53,190,123
Approve the Directors’ Remuneration policy (as contained in the Directors’ Remuneration Report) for the financial year ended 31 March 2014 3 217,622,528 54,918,962 18,112,805
Declare a final dividend of 14.4 pence per ordinary share for the financial year ended 31 March 2014 4 290,636,174 1,500 16,622
Reappoint Deloitte LLP as auditors of the Company to hold office as the Company’s auditors until the conclusion of the Company’s Annual General Meeting in 2015 5 279,148,005 3,519,715 7,986,575
Authorise the Directors to set the remuneration of the auditors 6 287,573,168 3,064,188 16,939
Reappoint Justin Dowley as a Director 7 274,785,599 5,844,324 24,372
Reappoint Kevin Parry as a Director 8 289,076,201 1,556,473 21,622
Reappoint Peter Gibbs as a Director 9 285,130,915 5,501,759 21,622
Reappoint Kim Wahl as a Director 10 281,437,883 2,280,094 6,936,318
Reappoint Lindsey McMurray as a Director 11 281,439,592 2,278,385 6,936,318
Reappoint Christophe Evain as a Director 12 289,247,269 1,385,405 21,622
Reappoint Philip Keller as a Director 13 287,640,508 2,992,166 21,622
Reappoint Benoît Durteste as a Director 14 287,638,720 2,993,954 21,622
Grant the Directors authority to allot shares pursuant to section 551 of the Companies Act 2006 15 271,849,802 14,556,372 4,248,122
Subject to the passing of resolution 15, to authorise the directors to dis-apply pre-emption rights pursuant to sections 570 (1) and 573 of the Companies Act 2006 16 285,691,330 713,031 4,249,935
Authorise the Company to make market purchases of its ordinary shares pursuant to section 701 of the Companies Act 2006. 17 289,391,099 4,246,575 16,622
Approve that a general meeting of the Company (other than the Annual General Meeting) may be called on less than 14 clear days’ notice. 18 259,267,644 31,370,004 16,647
Amend the rule of the Intermediate Capital Group plc Save As You Earn Plan 2004, to extend the plan for a period of 10 years from 23 July 2014 19 285,677,558 398,159 4,578,579
Amend the rule of the Intermediate Capital Group Omnibus Plan and the Intermediate Capital Group plc BSC Plan 20 244,454,274 28,108,762 18,091,259
The issued share capital of the Company at the date of the Annual General Meeting was 399,017,770 ordinary shares of 20 pence each.
2015 ANNUAL GENERAL MEETING
The Annual General Meeting (AGM) of the Company will take place at the London office of the Company on 15 July 2015 at 12:00p.m. Details of the resolutions to be proposed at the AGM along with explanatory notes are set out in the circular to be posted to shareholders on 15 June 2015 convening the meeting. in line with market practice, if votes of more than 20% of those voting are cast against a resolution, the Company will make a statement when announcing the results of the vote to explain any actions it intends to take to understand the reasons behind the vote result.
ICG ANNUAL REPORT & ACCOUNTS 2015 CHAIRMAN’S LETTER
BOARD OF DIRECTORS
REMUNERATIONCOMMITTEE REPORTS
DIRECTORS’ REPORT
CORPORATE GOVERNANCE

DIRECTORS’ RESPONSIBILITIES
The Directors are responsible for preparing the Annual Report and the financial statements in accordance with applicable law and regulations.
Company law requires the Directors to prepare financial statements for each financial year. Under that law the Directors are required to prepare the Group financial statements in accordance with International Financial Reporting Standards (IFRS) as adopted by the European Union (EU) and Article 4 of the IAS Regulation and have also chosen to prepare the Parent Company financial statements under IFRS as adopted by the EU. Under company law the Directors must not approve the accounts unless they are satisfied that they give a true and fair view of the state of affairs of the Company and of the profit or loss of the Company for that period. In preparing these financial statements, IAS 1 requires that Directors:
– Properly select and apply accounting policies
– Present information, including accounting policies, in a manner that provides relevant, reliable, comparable and understandable information
– Provide additional disclosures when compliance with the specific requirements of IFRS are insufficient to enable users to understand the impact of particular transactions, other events and conditions or the entity’s financial position and financial performance
– Make an assessment of the Company’s ability to continue as a going concern
The Directors are responsible for keeping adequate accounting records that are sufficient to show and explain the Company’s transactions and disclose with reasonable accuracy at any time the financial position of the Company and enable them to ensure that the financial statements comply with the Companies Act 2006. They are also responsible for safeguarding the assets of the Company and hence for taking
reasonable steps for the prevention and detection of fraud and other irregularities.
The Directors are responsible for the maintenance and integrity of the corporate and financial information included on the Company’s website. Legislation in the United Kingdom governing the preparation and dissemination of financial statements may differ from legislation in other jurisdictions.
RESPONSIBILITY STATEMENT
We confirm that to the best of our knowledge:
– The financial statements, prepared in accordance with IFRS as adopted by the European Union, give a true and fair view of the assets, liabilities, financial position and profit or loss of the Company and the undertakings included in the consolidation taken as a whole
– The management report, which is incorporated into the Directors’ report, includes a fair review of the development and performance of the business and the position of the Company and the undertakings included in the consolidation taken as a whole, together with a description of the principal risks and uncertainties that they face
– The Directors consider that this Annual Report and Accounts, taken as a whole, is fair, balanced and understandable and provides the information necessary for shareholders to assess the Company’s and the Group’s performance, business model and strategy
By order of the Board
Christophe EvainChief Executive Officer
21 May 2015
Philip KellerChief Financial Officer
21 May 2015
CHRISTOPHE EVAINCHIEF EXECUTIVE OFFICER
PHILIP KELLERCHIEF FINANCIAL OFFICER
104 / 105
STRATEGIC REPORT
GOVERNANCE REPORT
FINANCIAL STATEMENTS

OPINION ON THE PARENT COMPANY FINANCIAL STATEMENTS AND THE GROUP FINANCIAL STATEMENTS (THE FINANCIAL STATEMENTS) OF INTERMEDIATE CAPITAL GROUP PLC
INDEPENDENT AUDITOR’S REPORT TO THE MEMBERS OF INTERMEDIATE CAPITAL GROUP PLC
In our opinion:
– The financial statements give a true and fair view of the state of the group’s and of the parent company’s affairs as at 31 March 2015 and of the group’s profit for the year then ended;
– The group financial statements have been properly prepared in accordance with International Financial Reporting Standards (IFRSs) as adopted by the European Union;
– The parent company financial statements have been properly prepared in accordance with IFRSs as adopted by the European Union and as applied in accordance with the provisions of the Companies Act 2006; and
– The financial statements have been prepared in accordance with the requirements of the Companies Act 2006 and, as regards the group financial statements, Article 4 of the IAS Regulation.
The financial statements comprise the Consolidated Income Statement, the Consolidated and Parent Company Statements of Comprehensive Income, the Consolidated and Parent Company Statements of Financial Position, the Consolidated and Parent Company Statements of Cash Flow and the Consolidated and Parent Company Statements of Changes in Equity and the related notes 1 to 35. The financial reporting framework that has been applied in their preparation is applicable law and IFRSs as adopted by the European Union and, as regards the parent company financial statements, as applied in accordance with the provisions of the Companies Act 2006.
GOING CONCERN AND THE DIRECTORS’ ASSESSMENT OF THE PRINCIPAL RISKS THAT WOULD THREATEN THE SOLVENCY OR LIQUIDITY OF THE GROUPAs required by the Listing Rules we have reviewed the directors’ statement contained within the Corporate Governance Statements that the Group is a going concern.
As disclosed in the Governance Report, the Group has adopted the provisions of the 2014 UK Corporate Governance code relating to principal risks that would threaten the solvency or liquidity of the Group.
We have nothing material to add or draw attention to in relation to:
– The directors’ confirmation on page 105 that they have carried out a robust assessment of the principal risks facing the Group, including those that would threaten its business model, future performance, solvency or liquidity;
– The disclosures on pages 36–43 that describe those risks and explain how they are being managed or mitigated;
– The directors’ statement in note 3 to the financial statements about whether they considered it appropriate to adopt the going concern basis of accounting in preparing them, and their identification of any material uncertainties to the Group’s ability to continue to do so over a period of at least twelve months from the date of approval of the financial statements. We agreed with the directors’ adoption of the going concern basis of accounting and we did not identify any such material uncertainties; and
– The director’s explanation on page 36 as to how they have assessed the prospects of the Group, over what period they have done so and why they consider that period to be appropriate, and their statement as to whether they have a reasonable expectation that the Group will be able to continue in operation and meet its liabilities as they fall due over the period of their assessment, including any related disclosures drawing attention to any necessary qualifications or assumptions.
Because not all future events or conditions can be predicted, the directors’ statement in note 3 and page 36 is not a guarantee as to the group’s ability to continue as a going concern.
AUDITOR’S REPORT
ICG ANNUAL REPORT & ACCOUNTS 2015 CHAIRMAN’S LETTER
BOARD OF DIRECTORS
REMUNERATIONCOMMITTEE REPORTS
DIRECTORS’ REPORT
CORPORATE GOVERNANCE

OUR ASSESSMENT OF RISKS OF MATERIAL MISSTATEMENT
The assessed risks of material misstatement described below are those that had the greatest effect on our audit strategy, the allocation of resources in the audit and directing the efforts of the engagement team. The Audit Committee has requested that while not required under International Standards on Auditing (UK and Ireland), we include in our report any significant findings in respect of these assessed risks of material misstatement.
RISKHOW THE SCOPE OF OUR AUDIT RESPONDED TO THE RISK FINDINGS
VALUATION OF UNQUOTED EQUITIES, COLLATERALISED LOAN OBLIGATIONS (‘CLOS’) AND WARRANTS
Unquoted equities, CLOs and warrants represented £755million (20% of Group net assets) at 31 March 2015. See note 5 to the financial statements.
Valuing unquoted equities, CLOs and warrants requires management to make a number of judgements, including valuation methodology and the discount or premium applied to unquoted equities and the prepayment rate or default rates applied to CLOs. As valuations are sensitive to these judgments, there is a risk that small changes in key assumptions can have a significant impact on fair value and therefore reported results.
The valuation techniques and inputs, as well as the significant unobservable inputs are disclosed in note 5 to the financial statements.
We assessed the Group’s valuation methodology and tested the operating effectiveness of related controls to determine that appropriate oversight from senior investment executives had been exercised within the valuations process. We also engaged with our internal fair value specialists to discuss the valuation methodology and challenge its appropriateness.
We tested a sample of unquoted equities and warrants by considering and challenging the appropriateness of the underlying assumptions, specifically including discount rates and comparable companies. We verified the inputs to the valuations (specifically management information and earnings multiples) by agreeing these to underlying supporting documentation and testing their arithmetical accuracy. We assessed the reasonableness of management estimates in previous valuations by performing a retrospective review of valuations based on recent exits. Any valuation differences greater than 5% were investigated.
For a sample of CLOs, we recalculated the fair value with reference to an independent third party cash flow model. The significant assumptions around the generation of cash flows from the underlying loan portfolio were challenged; specifically: the CPR (Constant or Conditional Prepayment Rate), the CDR (Conditional Default Rate), the severity on defaulted loans and the interest margin on reinvestment amounts. These assumptions were obtained from an independent source.
Unquoted equitiesWe determined the valuation methodology of the unquoted equities to be appropriate and are satisfied that the assumptions that management have made are appropriate and that the valuation at year end is acceptable.
CLOsAs a result of our independent testing performed over the valuation of the loan tranches of two CLOs, we noted that ICG used “purchase price plus accrued income” to fair value the tranches, which is not the same as fair value. The results of our fair value testing for these CLO tranches fell outside a tolerable threshold of 5%. Based on these results, we believed the CLOs were misstated. After communicating these errors to management, they fair valued the loan tranches using their cash flow model to determine the CLO tranche prices. Management agreed to post the correction of the misstatement resulting in a decrease of the CLO balance by £504,000. We are now satisfied that the valuation of CLOs at year end is acceptable.
WarrantsWe determined the valuation methodology of the warrants to be appropriate and are satisfied that the valuation at year end is acceptable.
106 / 107
STRATEGIC REPORT
GOVERNANCE REPORT
FINANCIAL STATEMENTS
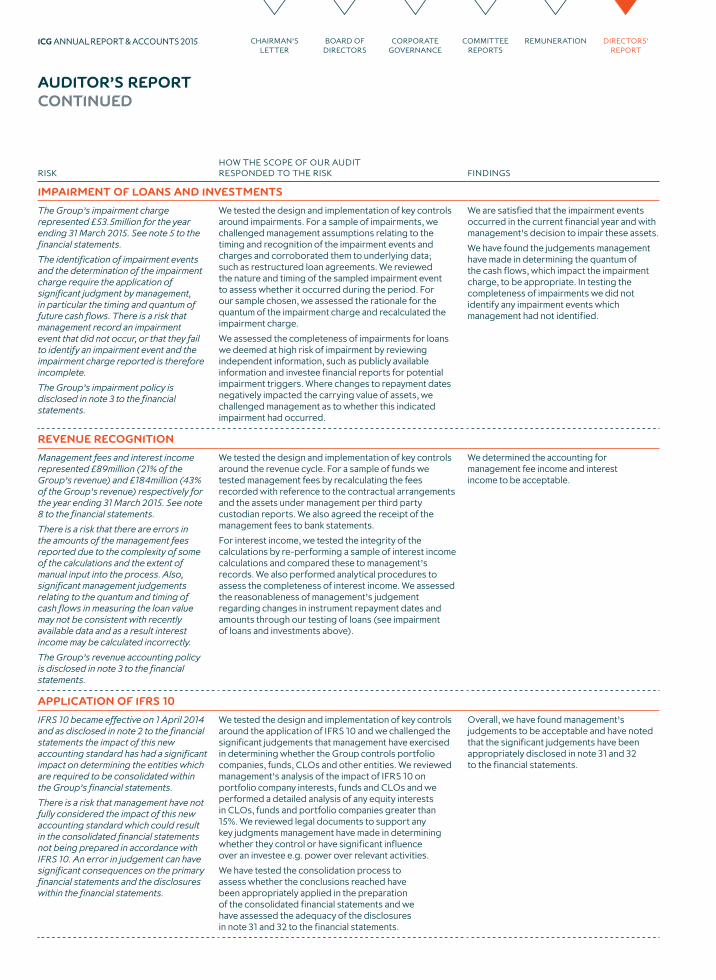
AUDITOR’S REPORT CONTINUED
RISKHOW THE SCOPE OF OUR AUDIT RESPONDED TO THE RISK FINDINGS
IMPAIRMENT OF LOANS AND INVESTMENTS
The Group’s impairment charge represented £53.5million for the year ending 31 March 2015. See note 5 to the financial statements.
The identification of impairment events and the determination of the impairment charge require the application of significant judgment by management, in particular the timing and quantum of future cash flows. There is a risk that management record an impairment event that did not occur, or that they fail to identify an impairment event and the impairment charge reported is therefore incomplete.
The Group’s impairment policy is disclosed in note 3 to the financial statements.
We tested the design and implementation of key controls around impairments. For a sample of impairments, we challenged management assumptions relating to the timing and recognition of the impairment events and charges and corroborated them to underlying data; such as restructured loan agreements. We reviewed the nature and timing of the sampled impairment event to assess whether it occurred during the period. For our sample chosen, we assessed the rationale for the quantum of the impairment charge and recalculated the impairment charge.
We assessed the completeness of impairments for loans we deemed at high risk of impairment by reviewing independent information, such as publicly available information and investee financial reports for potential impairment triggers. Where changes to repayment dates negatively impacted the carrying value of assets, we challenged management as to whether this indicated impairment had occurred.
We are satisfied that the impairment events occurred in the current financial year and with management’s decision to impair these assets.
We have found the judgements management have made in determining the quantum of the cash flows, which impact the impairment charge, to be appropriate. In testing the completeness of impairments we did not identify any impairment events which management had not identified.
REVENUE RECOGNITION
Management fees and interest income represented £89million (21% of the Group’s revenue) and £184million (43% of the Group’s revenue) respectively for the year ending 31 March 2015. See note 8 to the financial statements.
There is a risk that there are errors in the amounts of the management fees reported due to the complexity of some of the calculations and the extent of manual input into the process. Also, significant management judgements relating to the quantum and timing of cash flows in measuring the loan value may not be consistent with recently available data and as a result interest income may be calculated incorrectly.
The Group’s revenue accounting policy is disclosed in note 3 to the financial statements.
We tested the design and implementation of key controls around the revenue cycle. For a sample of funds we tested management fees by recalculating the fees recorded with reference to the contractual arrangements and the assets under management per third party custodian reports. We also agreed the receipt of the management fees to bank statements.
For interest income, we tested the integrity of the calculations by re-performing a sample of interest income calculations and compared these to management’s records. We also performed analytical procedures to assess the completeness of interest income. We assessed the reasonableness of management’s judgement regarding changes in instrument repayment dates and amounts through our testing of loans (see impairment of loans and investments above).
We determined the accounting for management fee income and interest income to be acceptable.
APPLICATION OF IFRS 10
IFRS 10 became effective on 1 April 2014 and as disclosed in note 2 to the financial statements the impact of this new accounting standard has had a significant impact on determining the entities which are required to be consolidated within the Group’s financial statements.
There is a risk that management have not fully considered the impact of this new accounting standard which could result in the consolidated financial statements not being prepared in accordance with IFRS 10. An error in judgement can have significant consequences on the primary financial statements and the disclosures within the financial statements.
We tested the design and implementation of key controls around the application of IFRS 10 and we challenged the significant judgements that management have exercised in determining whether the Group controls portfolio companies, funds, CLOs and other entities. We reviewed management’s analysis of the impact of IFRS 10 on portfolio company interests, funds and CLOs and we performed a detailed analysis of any equity interests in CLOs, funds and portfolio companies greater than 15%. We reviewed legal documents to support any key judgments management have made in determining whether they control or have significant influence over an investee e.g. power over relevant activities.
We have tested the consolidation process to assess whether the conclusions reached have been appropriately applied in the preparation of the consolidated financial statements and we have assessed the adequacy of the disclosures in note 31 and 32 to the financial statements.
Overall, we have found management’s judgements to be acceptable and have noted that the significant judgements have been appropriately disclosed in note 31 and 32 to the financial statements.
ICG ANNUAL REPORT & ACCOUNTS 2015 CHAIRMAN’S LETTER
BOARD OF DIRECTORS
REMUNERATIONCOMMITTEE REPORTS
DIRECTORS’ REPORT
CORPORATE GOVERNANCE
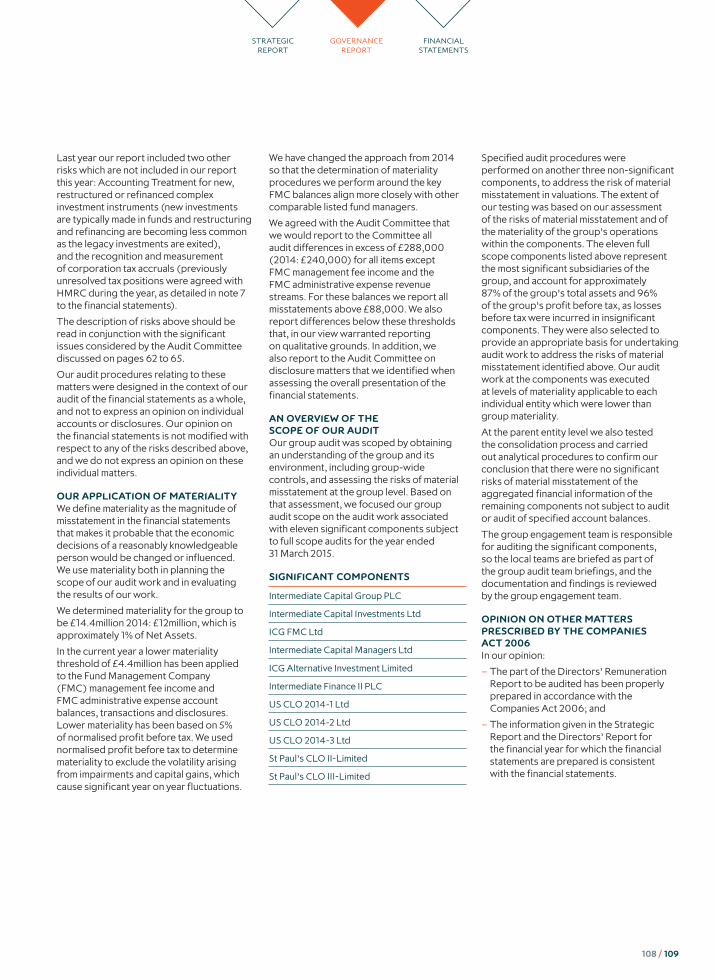
Last year our report included two other risks which are not included in our report this year: Accounting Treatment for new, restructured or refinanced complex investment instruments (new investments are typically made in funds and restructuring and refinancing are becoming less common as the legacy investments are exited), and the recognition and measurement of corporation tax accruals (previously unresolved tax positions were agreed with HMRC during the year, as detailed in note 7 to the financial statements).
The description of risks above should be read in conjunction with the significant issues considered by the Audit Committee discussed on pages 62 to 65.
Our audit procedures relating to these matters were designed in the context of our audit of the financial statements as a whole, and not to express an opinion on individual accounts or disclosures. Our opinion on the financial statements is not modified with respect to any of the risks described above, and we do not express an opinion on these individual matters.
OUR APPLICATION OF MATERIALITYWe define materiality as the magnitude of misstatement in the financial statements that makes it probable that the economic decisions of a reasonably knowledgeable person would be changed or influenced. We use materiality both in planning the scope of our audit work and in evaluating the results of our work.
We determined materiality for the group to be £14.4million 2014: £12million, which is approximately 1% of Net Assets.
In the current year a lower materiality threshold of £4.4million has been applied to the Fund Management Company (FMC) management fee income and FMC administrative expense account balances, transactions and disclosures. Lower materiality has been based on 5% of normalised profit before tax. We used normalised profit before tax to determine materiality to exclude the volatility arising from impairments and capital gains, which cause significant year on year fluctuations.
We have changed the approach from 2014 so that the determination of materiality procedures we perform around the key FMC balances align more closely with other comparable listed fund managers.
We agreed with the Audit Committee that we would report to the Committee all audit differences in excess of £288,000 (2014: £240,000) for all items except FMC management fee income and the FMC administrative expense revenue streams. For these balances we report all misstatements above £88,000. We also report differences below these thresholds that, in our view warranted reporting on qualitative grounds. In addition, we also report to the Audit Committee on disclosure matters that we identified when assessing the overall presentation of the financial statements.
AN OVERVIEW OF THE SCOPE OF OUR AUDITOur group audit was scoped by obtaining an understanding of the group and its environment, including group-wide controls, and assessing the risks of material misstatement at the group level. Based on that assessment, we focused our group audit scope on the audit work associated with eleven significant components subject to full scope audits for the year ended 31 March 2015.
SIGNIFICANT COMPONENTS
Intermediate Capital Group PLC
Intermediate Capital Investments Ltd
ICG FMC Ltd
Intermediate Capital Managers Ltd
ICG Alternative Investment Limited
Intermediate Finance II PLC
US CLO 2014-1 Ltd
US CLO 2014-2 Ltd
US CLO 2014-3 Ltd
St Paul’s CLO II-Limited
St Paul’s CLO III-Limited
Specified audit procedures were performed on another three non-significant components, to address the risk of material misstatement in valuations. The extent of our testing was based on our assessment of the risks of material misstatement and of the materiality of the group’s operations within the components. The eleven full scope components listed above represent the most significant subsidiaries of the group, and account for approximately 87% of the group’s total assets and 96% of the group’s profit before tax, as losses before tax were incurred in insignificant components. They were also selected to provide an appropriate basis for undertaking audit work to address the risks of material misstatement identified above. Our audit work at the components was executed at levels of materiality applicable to each individual entity which were lower than group materiality.
At the parent entity level we also tested the consolidation process and carried out analytical procedures to confirm our conclusion that there were no significant risks of material misstatement of the aggregated financial information of the remaining components not subject to audit or audit of specified account balances.
The group engagement team is responsible for auditing the significant components, so the local teams are briefed as part of the group audit team briefings, and the documentation and findings is reviewed by the group engagement team.
OPINION ON OTHER MATTERS PRESCRIBED BY THE COMPANIES ACT 2006In our opinion:
– The part of the Directors’ Remuneration Report to be audited has been properly prepared in accordance with the Companies Act 2006; and
– The information given in the Strategic Report and the Directors’ Report for the financial year for which the financial statements are prepared is consistent with the financial statements.
108 / 109
STRATEGIC REPORT
GOVERNANCE REPORT
FINANCIAL STATEMENTS

AUDITOR’S REPORT CONTINUED
MATTERS ON WHICH WE ARE REQUIRED TO REPORT BY EXCEPTION
Adequacy of explanations received and accounting recordsUnder the Companies Act 2006 we are required to report to you if, in our opinion:
– We have not received all the information and explanations we require for our audit; or
– Adequate accounting records have not been kept by the parent company, or returns adequate for our audit have not been received from branches not visited by us; or
– The parent company financial statements are not in agreement with the accounting records and returns.
We have nothing to report in respect of these matters.
Directors’ remunerationUnder the Companies Act 2006 we are also required to report if in our opinion certain disclosures of directors’ remuneration have not been made or the part of the Directors’ Remuneration Report to be audited is not in agreement with the accounting records and returns. We have nothing to report arising from these matters.
Corporate Governance StatementUnder the Listing Rules we are also required to review the part of the Corporate Governance Statement relating to the company’s compliance with ten provisions of the UK Corporate Governance Code. We have nothing to report arising from our review.
Our duty to read other information in the Annual ReportUnder International Standards on Auditing (UK and Ireland), we are required to report to you if, in our opinion, information in the annual report is:
– Materially inconsistent with the information in the audited financial statements; or
– Apparently materially incorrect based on, or materially inconsistent with, our knowledge of the group acquired in the course of performing our audit; or
– Otherwise misleading.
In particular, we are required to consider whether we have identified any inconsistencies between our knowledge acquired during the audit and the directors’ statement that they consider the annual report is fair, balanced and understandable and whether the annual report appropriately discloses those matters that we communicated to the audit committee which we consider should have been disclosed. We confirm that we have not identified any such inconsistencies or misleading statements.
RESPECTIVE RESPONSIBILITIES OF DIRECTORS AND AUDITORAs explained more fully in the Directors’ Responsibilities Statement, the directors are responsible for the preparation of the financial statements and for being satisfied that they give a true and fair view. Our responsibility is to audit and express an opinion on the financial statements in accordance with applicable law and International Standards on Auditing (UK and Ireland). Those standards require us to comply with the Auditing Practices Board’s Ethical Standards for Auditors. We also comply with International Standard on Quality Control 1 (UK and Ireland). Our audit methodology and tools aim to ensure that our quality control procedures are effective, understood and applied. Our quality controls and systems include our dedicated professional standards review team and independent partner reviews.
This report is made solely to the company’s members, as a body, in accordance with Chapter 3 of Part 16 of the Companies Act 2006. Our audit work has been undertaken so that we might state to the company’s members those matters we are required to state to them in an auditor’s report and for no other purpose. To the fullest extent permitted by law, we do not accept or assume responsibility to anyone other than the company and the company’s members as a body, for our audit work, for this report, or for the opinions we have formed.
SCOPE OF THE AUDIT OF THE FINANCIAL STATEMENTSAn audit involves obtaining evidence about the amounts and disclosures in the financial statements sufficient to give reasonable assurance that the financial statements are free from material misstatement, whether caused by fraud or error. This includes an assessment of: whether the accounting policies are appropriate to the group’s and the parent company’s circumstances and have been consistently applied and adequately disclosed; the reasonableness of significant accounting estimates made by the directors; and the overall presentation of the financial statements. In addition, we read all the financial and non-financial information in the annual report to identify material inconsistencies with the audited financial statements and to identify any information that is apparently materially incorrect based on, or materially inconsistent with, the knowledge acquired by us in the course of performing the audit. If we become aware of any apparent material misstatements or inconsistencies we consider the implications for our report.
Calum ThomsonSenior statutory auditor for and on behalf of Deloitte LLP Chartered Accountants and Statutory Auditor London, United Kingdom
21 May 2015
ICG ANNUAL REPORT & ACCOUNTS 2015 CHAIRMAN’S LETTER
BOARD OF DIRECTORS
REMUNERATIONCOMMITTEE REPORTS
DIRECTORS’ REPORT
CORPORATE GOVERNANCE

FINANCIAL STATEMENTS
CONTENTS
Consolidated income statement 112
Consolidated and parent company statements of comprehensive income 113
Consolidated and parent company statements of financial position 114
Consolidated and parent company statements of cash flow 115
Consolidated and parent company statements of changes in equity 116
Notes to the accounts 118
110 / 111
STRATEGIC REPORT
GOVERNANCE REPORT

ICG ANNUAL REPORT & ACCOUNTS 2015
CONSOLIDATED INCOME STATEMENTFOR THE YEAR ENDED 31 MARCH 2015
Notes2015
£m
Restated 2014
£m
Finance income 8 193.3 218.2
Gains on investments 9 137.9 160.5
Fee and other operating income 9 95.0 84.8
Total revenue 426.2 463.5
Finance costs 8 (65.1) (72.3)
Impairments 10 (37.6) (112.4)
Share of results of joint ventures accounted for using equity method 32 (0.5) –
Administrative expenses 11 (144.5) (114.4)
Profit before tax 178.5 164.4
Tax credit/(charge) 13 12.1 (21.5)
Profit for the year 190.6 142.9
Attributable to:
Equity holders of the parent 189.3 142.3
Non controlling interests 18 1.3 0.6
190.6 142.9
Earnings per share 15 50.3p 37.0p
Diluted earnings per share 15 50.3p 37.0p
All activities represent continuing operations.
The accompanying notes are an integral part of these financial statements.
The prior year Group numbers have been restated following the adoption of IFRS 10. For more information see note 2.

112 / 113
STRATEGIC REPORT
GOVERNANCE REPORT
FINANCIAL STATEMENTS
Group Notes
2015 £m
Restated 2014
£m
Profit for the year 190.6 142.9
Available for sale financial assets:
Loss arising in the year 9 (7.3) (1.9)
Reclassification adjustment for gains recycled to profit 9 (16.1) (125.7)
Exchange differences on translation of foreign operations (3.7) (0.6)
(27.1) (128.2)
Tax credit on items taken directly to or transferred from equity 26 4.9 30.9
Other comprehensive expense for the year (22.2) (97.3)
Total comprehensive income for the year 168.4 45.6
Attributable to:
Equity holders of the parent 170.4 45.0
Non controlling interests (2.0) 0.6
168.4 45.6
Company2015
£m2014
£m
Profit for the year 200.7 145.2
Available for sale financial assets:
Gains arising in the year 4.9 11.2
Reclassification adjustment for gains recycled to profit (2.1) (10.5)
2.8 0.7
Tax (charge)/credit on items taken directly to or transferred from equity 26 (0.5) 0.1
Other comprehensive income for the year 2.3 0.8
Total comprehensive income for the year 203.0 146.0
The accompanying notes are an integral part of these financial statements.
The prior year Group numbers have been restated following the adoption of IFRS 10. For more information see note 2.
CONSOLIDATED AND PARENT COMPANY STATEMENTS OF COMPREHENSIVE INCOMEFOR THE YEAR ENDED 31 MARCH 2015

ICG ANNUAL REPORT & ACCOUNTS 2015
CONSOLIDATED AND PARENT COMPANY STATEMENTS OF FINANCIAL POSITIONAS AT 31 MARCH 2015
Notes
2015 Group
£m
Restated2014
Group £m
2015 Company
£m
2014 Company
£m
NON CURRENT ASSETS
Intangible assets 16 6.8 5.7 1.4 –
Property, plant and equipment 17 6.6 4.9 5.3 3.7
Financial assets: loans, investments and warrants 19 2,981.4 2,784.7 1,389.1 1,470.5
Derivative financial assets 19 15.6 6.2 15.3 5.8
3,010.4 2,801.5 1,411.1 1,480.0
CURRENT ASSETS
Trade and other receivables 20 127.8 84.6 503.7 469.5
Financial assets: loans and investments 21 243.9 115.8 169.4 115.8
Derivative financial assets 21 11.3 12.8 10.7 12.8
Current tax debtor 13.9 1.5 30.2 6.2
Cash and cash equivalents 391.9 273.5 206.8 70.5
788.8 488.2 920.8 674.8
Total assets 3,799.2 3,289.7 2,331.9 2,154.8
EQUITY AND RESERVES
Called up share capital 22 80.6 80.4 80.6 80.4
Share premium account 674.3 672.4 674.3 672.4
Capital redemption reserve 1.4 1.4 1.4 1.4
Own shares reserve 22 (162.0) (62.4) (97.6) –
Other reserves 78.3 104.3 54.8 60.0
Retained earnings 783.8 713.3 654.7 535.0
Equity attributable to owners of the Company 1,456.4 1,509.4 1,368.2 1,349.2
Non controlling interest 18 2.2 4.7 – –
Total equity 1,458.6 1,514.1 1,368.2 1,349.2
NON CURRENT LIABILITIES
Provisions 23 2.6 3.2 2.6 3.2
Financial liabilities 24 2,038.8 1,523.6 631.5 457.2
Derivative financial liabilities 0.7 4.9 0.7 4.8
Deferred tax liabilities 26 33.9 21.0 10.8 3.2
2,076.0 1,552.7 645.6 468.4
CURRENT LIABILITIES
Provisions 23 0.6 0.4 0.6 0.4
Trade and other payables 25 208.8 194.0 289.7 332.3
Financial liabilities 24 40.9 – 15.1 –
Current tax creditor 1.6 24.0 – –
Derivative financial liabilities 12.7 4.5 12.7 4.5
264.6 222.9 318.1 337.2
Total liabilities 2,340.6 1,775.6 963.7 805.6
Total equity and liabilities 3,799.2 3,289.7 2,331.9 2,154.8
Company Registration Number: 02234775. The accompanying notes are an integral part of these financial statements.
The prior year Group numbers have been restated following the adoption of IFRS 10. For more information see note 2.
These financial statements were approved and authorised for issue by the Board of Directors on 21 May 2015 and were signed on its behalf by:
JUSTIN DOWLEY PHILIP KELLER Director Director

114 / 115
STRATEGIC REPORT
GOVERNANCE REPORT
FINANCIAL STATEMENTS
Notes
2015 Group
£m
Restated2014
Group £m
2015 Company
£m
2014 Company
£m
Operating activities
Interest received 183.4 303.3 93.7 209.6
Fees received 90.3 78.8 31.6 22.2
Dividends received 25.0 25.2 60.4 122.4
Interest paid (67.3) (43.5) (31.4) (33.7)
Payments to suppliers and employees (97.8) (113.9) (65.3) (75.9)
Purchase of current financial assets (126.4) (81.4) (55.4) (82.1)
Purchase of loans and investments (1,684.0) (1,347.6) (94.6) (163.3)
Recoveries on previously impaired assets 0.7 0.8 0.4 0.5
Proceeds from sale of loans and investments – principal 1,245.3 953.1 279.3 573.9
Proceeds from sale of loans and investments – gains on investments 42.3 144.8 7.2 14.3
Cash (used in)/generated from operating activities (388.5) (80.4) 225.9 587.9
Taxes (paid)/received (5.2) (28.1) 8.9 (25.4)
Net cash (used in)/generated from operating activities (393.7) (108.5) 234.8 562.5
Investing activities
Cash flow on behalf of subsidiary undertakings – – (225.2) (86.8)
Purchase of property, plant and equipment 17 (3.8) (2.7) (3.6) (2.2)
Purchase of intangible assets 16 (2.1) – (1.6) –
Purchase of remaining 49% of Longbow Real Estate Capital LLP 18 (14.0) – – –
Net cash used in investing activities (19.9) (2.7) (230.4) (89.0)
Financing activities
Dividends paid 14 (81.0) (78.2) (81.0) (78.2)
Increase/(decrease) in long term borrowings 592.6 370.9 172.6 (407.6)
Cash inflow from derivative contracts 152.9 80.1 135.4 80.6
Net purchase of own shares (124.0) (27.1) (95.0) –
Proceeds on issue of shares 1.0 0.7 1.0 0.7
Net cash generated from/(used in) financing activities 541.5 346.4 133.0 (404.5)
Net increase in cash 127.9 235.2 137.4 69.0
Cash and cash equivalents at beginning of year 273.5 46.0 70.5 6.3
Effect of foreign exchange rate changes (9.5) (7.7) (1.1) (4.8)
Net cash and cash equivalents at end of year 391.9 273.5 206.8 70.5
Presented on the statements of financial position as:
Cash and cash equivalents 391.9 273.5 206.8 70.5
The accompanying notes are an integral part of these financial statements.
The prior year Group numbers have been restated following the adoption of IFRS 10. For more information see note 2.
CONSOLIDATED AND PARENT COMPANY STATEMENTS OF CASH FLOWFOR THE YEAR ENDED 31 MARCH 2015
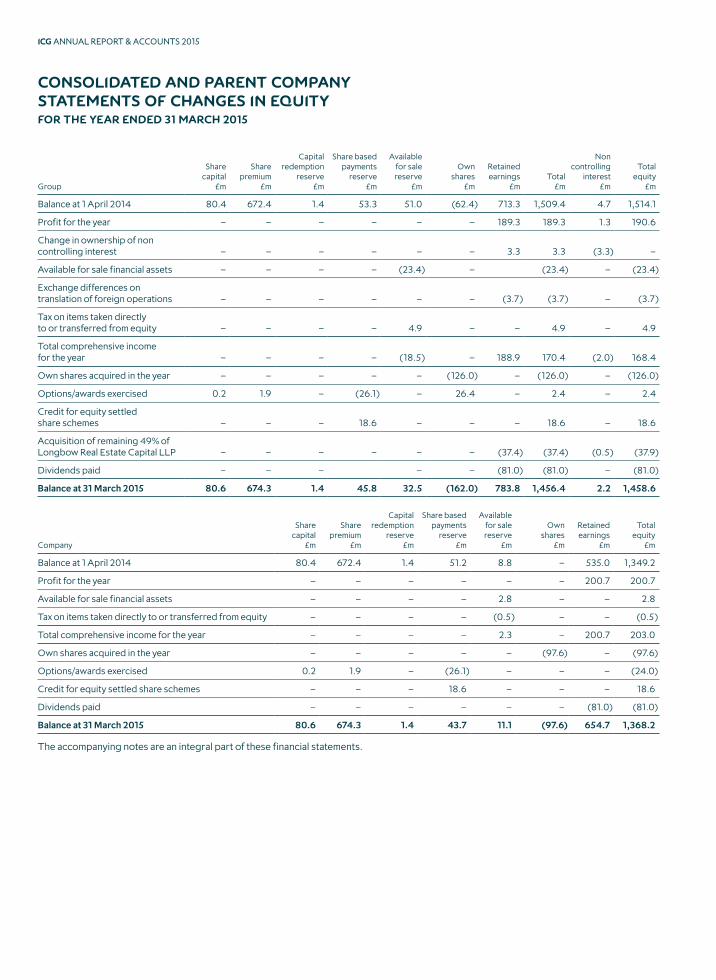
ICG ANNUAL REPORT & ACCOUNTS 2015
Group
Share capital
£m
Share premium
£m
Capital redemption
reserve £m
Share based payments
reserve £m
Available for sale reserve
£m
Own shares
£m
Retained earnings
£mTotal
£m
Non controlling
interest £m
Total equity
£m
Balance at 1 April 2014 80.4 672.4 1.4 53.3 51.0 (62.4) 713.3 1,509.4 4.7 1,514.1
Profit for the year – – – – – – 189.3 189.3 1.3 190.6
Change in ownership of non controlling interest – – – – – – 3.3 3.3 (3.3) –
Available for sale financial assets – – – – (23.4) – (23.4) – (23.4)
Exchange differences on translation of foreign operations – – – – – – (3.7) (3.7) – (3.7)
Tax on items taken directly to or transferred from equity – – – – 4.9 – – 4.9 – 4.9
Total comprehensive income for the year – – – – (18.5) – 188.9 170.4 (2.0) 168.4
Own shares acquired in the year – – – – – (126.0) – (126.0) – (126.0)
Options/awards exercised 0.2 1.9 – (26.1) – 26.4 – 2.4 – 2.4
Credit for equity settled share schemes – – – 18.6 – – – 18.6 – 18.6
Acquisition of remaining 49% of Longbow Real Estate Capital LLP – – – – – – (37.4) (37.4) (0.5) (37.9)
Dividends paid – – – – – (81.0) (81.0) – (81.0)
Balance at 31 March 2015 80.6 674.3 1.4 45.8 32.5 (162.0) 783.8 1,456.4 2.2 1,458.6
Company
Share capital
£m
Share premium
£m
Capital redemption
reserve £m
Share based payments
reserve £m
Available for sale reserve
£m
Own shares
£m
Retained earnings
£m
Total equity
£m
Balance at 1 April 2014 80.4 672.4 1.4 51.2 8.8 – 535.0 1,349.2
Profit for the year – – – – – – 200.7 200.7
Available for sale financial assets – – – – 2.8 – – 2.8
Tax on items taken directly to or transferred from equity – – – – (0.5) – – (0.5)
Total comprehensive income for the year – – – – 2.3 – 200.7 203.0
Own shares acquired in the year – – – – – (97.6) – (97.6)
Options/awards exercised 0.2 1.9 – (26.1) – – – (24.0)
Credit for equity settled share schemes – – – 18.6 – – – 18.6
Dividends paid – – – – – – (81.0) (81.0)
Balance at 31 March 2015 80.6 674.3 1.4 43.7 11.1 (97.6) 654.7 1,368.2
The accompanying notes are an integral part of these financial statements.
CONSOLIDATED AND PARENT COMPANY STATEMENTS OF CHANGES IN EQUITYFOR THE YEAR ENDED 31 MARCH 2015

116 / 117
STRATEGIC REPORT
GOVERNANCE REPORT
FINANCIAL STATEMENTS
RestatedGroup
Share capital
£m
Share premium
£m
Capital redemption
reserve £m
Share based payments
reserve £m
Available for sale reserve
£m
Own shares
£m
Retained earnings
£mTotal
£m
Non controlling
interest £m
Total equity
£m
Balance at 1 April 2013 80.4 671.7 1.4 46.6 147.7 (45.7) 657.9 1,560.0 4.1 1,564.1
Profit for the year – – – – – – 142.3 142.3 0.6 142.9
Available for sale financial assets – – – – (127.6) – – (127.6) – (127.6)
Exchange differences on translation of foreign operations – – – (0.1) – – (0.5) (0.6) – (0.6)
Tax on items taken directly to or transferred from equity – – – – 30.9 – – 30.9 – 30.9
Total comprehensive income for the year – – – (0.1) (96.7) – 141.8 45.0 0.6 45.6
Own shares acquired in the year – – – – – (35.4) (35.4) – (35.4)
Options/awards exercised – 0.7 – (10.5) – 18.7 (8.2) 0.7 – 0.7
Credit for equity settled share schemes – – – 17.3 – – – 17.3 – 17.3
Dividends paid – – – – – – (78.2) (78.2) – (78.2)
Balance at 31 March 2014 80.4 672.4 1.4 53.3 51.0 (62.4) 713.3 1,509.4 4.7 1,514.1
Company
Share capital
£m
Share premium
£m
Capital redemption
reserve £m
Share based payments
reserve £m
Available for sale reserve
£m
Retained earnings
£m
Total equity
£m
Balance at 1 April 2013 80.4 671.7 1.4 44.4 8.0 468.0 1,273.9
Profit for the year – – – – – 145.2 145.2
Available for sale financial assets – – – – 0.7 – 0.7
Tax on items taken directly to or transferred from equity – – – – 0.1 – 0.1
Total comprehensive income for the year – – – – 0.8 145.2 146.0
Options/awards exercised – 0.7 – (10.5) – – (9.8)
Credit for equity settled share schemes – – – 17.3 – – 17.3
Dividends paid – – – – – (78.2) (78.2)
Balance at 31 March 2014 80.4 672.4 1.4 51.2 8.8 535.0 1,349.2
The accompanying notes are an integral part of these financial statements.
The prior year Group numbers have been restated following the adoption of IFRS 10. For more information see note 2.
CONSOLIDATED AND PARENT COMPANY STATEMENTS OF CHANGES IN EQUITYFOR THE YEAR ENDED 31 MARCH 2015 CONTINUED

ICG ANNUAL REPORT & ACCOUNTS 2015
NOTES TO THE ACCOUNTSFOR THE YEAR ENDED 31 MARCH 2015
1. GENERAL INFORMATION
Intermediate Capital Group plc is incorporated in the United Kingdom with Company Registration Number 02234775. The registered office is Juxon House, 100 St Paul’s Churchyard, London EC4M 8BU.
The nature of the Group’s operations and its principal activities are detailed in the Directors’ report.
2. ADOPTION OF NEW AND REVISED STANDARDS
At the date of signing of these financial statements, certain new standards and interpretations have been issued but are not yet effective and have not been early adopted by the Group. The Directors are in the process of assessing the impact of the forthcoming standards on the operations of the Group.
INTERNATIONAL FINANCIAL REPORTING STANDARDS (IAS/IFRS)
Accounting periods commencing on or after
IFRS 9 Financial Instruments Subject to EU endorsement
IFRS 14 Regulatory Deferral Accounts EU effective date to be confirmed
IFRS 15 Revenue from Contracts with Customers EU effective date to be confirmed
IFRIC 21 Levies 17 June 2014
Improvements 2012 Annual Improvements to IFRSs: 2010-2012 Cycle 1 February 2015
Improvements 2013 Annual Improvements to IFRSs: 2011-2013 Cycle 1 January 2015
Improvements 2014 Annual Improvements to IFRSs: 2012-2014 Cycle 1 January 2016
Amendments to IFRS 11 Accounting for Acquisitions of Interests in Joint Operations EU endorsement date to be confirmed
Amendments to IAS 16 and IAS 38 Clarification of Acceptable Methods of Depreciation and Amortisation EU endorsement date to be confirmed
Amendments to IAS 16 and IAS 41 Agriculture: Bearer Plants EU endorsement date to be confirmed
Amendments to IAS 19 Defined Benefit Plans: Employee Contributions 1 February 2015
Amendments to IAS 27 Equity Method in Separate Financial Statements EU endorsement date to be confirmed
Amendments to IFRS 10/IAS 28 Sale or Contribution of Assets between an Investor and its Associate or Joint Venture
EU endorsement date to be confirmed
Amendments to IFRS 10, IFRS 12 and IAS 28
Investment Entities: Applying the Consolidation Exception 1 January 2016
Amendments to IAS 1 Disclosure Initiative 1 January 2016
IFRS 10 ‘CONSOLIDATED FINANCIAL STATEMENTS’ (IFRS 10)
IFRS 10 replaces the portion of IAS 27 Consolidated and Separate Financial Statements that addresses the accounting for consolidated financial statements and SIC -12 Consolidation Special Purpose Entities. IFRS 10 sets out the requirements for the preparation and presentation of consolidated financial statements, requiring an entity to consolidate entities it controls. The standard changes the definition of control and the new criteria for control are outlined in the basis of consolidation accounting policy on page 119. The requirements have been retrospectively applied, in line with the transitional provision of the standard. Following the application of IFRS 10, the Group consolidates eight credit funds of which seven were not previously consolidated. The restatement resulted in an increase in previously reported revenue of £28.9m and profit after tax of £5.5m. Financial assets increased by £703.9m, cash by £108.7m and financial liabilities by £747.2m. The impact on total equity was an increase of £6.1m.
As at 30 September 2014, the Company met the definition of an Investment Entity per IFRS 10, and was required to account for subsidiaries, associates and joint ventures held for investment purposes only, at fair value through profit or loss. Subsidiaries that provided services related to the Investment Entity’s activities continued to be consolidated. On 18 December 2014, the International Accounting Standards Board released an immediately effective clarification to the definition of an Investment Entity, which requires that the Investment Entity’s business purpose and, therefore, its core activity is providing investment management services to its investors and investing the funds obtained from its investors solely for returns from capital appreciation, investment income, or both. The key change is the insertion that investment management services must be the core activity of the business. The Company’s strategy is to grow its alternative asset manager franchise and to use its balance sheet to support this business development. This is at odds with a business whose core activities are the investment of the balance sheet for capital appreciation and investment income and therefore means that ICG plc no longer meets the definition of an Investment Entity.

118 / 119
STRATEGIC REPORT
GOVERNANCE REPORT
FINANCIAL STATEMENTS
IFRS 11 ‘JOINT ARRANGEMENTS’ (IFRS 11)
IFRS 11 replaces IAS 31 Interests in Joint Ventures. IFRS 11 defines and establishes accounting principles for joint arrangements. The standard distinguishes between two types of joint arrangements – joint ventures and joint operations – based on how rights and obligations are shared by parties to the arrangements. The adoption of IFRS 11 has no impact on the consolidated financial statements in the current or prior period.
IFRS 12 ‘DISCLOSURE OF INTERESTS IN OTHER ENTITIES’ (IFRS 12)
IFRS 12 includes the disclosure requirements for all forms of interests in other entities, including subsidiaries, joint arrangements, associates, and unconsolidated structured entities. The adoption of IFRS 12 has resulted in significant additional disclosures in respect of these interests. The additional disclosures are included in notes 31 to 33.
3. SIGNIFICANT ACCOUNTING POLICIES
BASIS OF PREPARATION
The financial statements have been prepared in accordance with International Financial Reporting Standards (IFRS) as adopted for use in the European Union and in compliance with Article 4 of the EU IAS Regulation.
The financial statements have been prepared under the historical cost convention, except for derivative financial instruments and non derivative financial instruments valued at fair value through profit or loss and available for sale financial assets, valued at fair value through equity.
The functional and presentational currency of the Group and Company is Sterling.
The accounting policies set out below have been applied consistently to all periods presented in these consolidated financial statements.
GOING CONCERN
The Directors have, at the time of approving the financial statements, a reasonable expectation that the Company and the Group have adequate resources to continue in operational existence for the foreseeable future. Therefore they continue to adopt the going concern basis of preparing the financial statements.
The Directors have made this assessment in light of the £758.4m cash and unutilised debt facilities following a period of high realisations, no significant bank facilities maturing within the next two years, and after reviewing the Group’s latest forecasts for a period of two years from the reporting date.
The Group’s business activities, together with the factors likely to affect its future development, performance and position are set out in the Strategic Review on pages 4 to 46. This includes on pages 30 to 35 the Chief Financial Officer’s Review detailing the financial position of the Group, its cash flows, liquidity position and borrowing facilities. In addition, note 5 to the financial statements includes the Group’s objectives, policies and processes for managing its capital; its financial risk management objectives; details of its financial instruments and hedging activities; and its exposures to credit risk and liquidity risk.
The Directors continually monitor the debt profile of the Group and Company, and seek to refinance senior facilities a substantial period before they mature. The Group and Company have no significant facilities due to mature within the next 12 months.
BASIS OF CONSOLIDATION
The Group’s financial statements consolidate the results of Intermediate Capital Group plc and entities controlled by the Company for the period to 31 March each year.
Subsidiaries are all entities over which the Company has control. The Company controls an investee when it has power over the relevant activities, exposure to variable returns from the investee, and the ability to affect those returns through its power over the investee. The assessment of control is based on all relevant facts and circumstances and the Company re-assesses its conclusion if there is an indication that there are changes in facts and circumstances. Subsidiaries are included in the consolidated financial statements from the date that control commences until the date that control ceases.
Each component of other comprehensive income and profit or loss is attributed to the owners of the Company and to the non-controlling interests.
Adjustments are made to the financial statements of subsidiaries for consistency with the accounting policies of the Group. All intra-group transactions, balances, unrealised income and expenses are eliminated on consolidation.
BUSINESS COMBINATIONS
Business combinations are accounted for using the acquisition method. The acquisition method involves the recognition of all assets, liabilities and contingent liabilities of the acquired business at their fair value at the acquisition date. Contingent consideration is measured at fair value on the date of acquisition. Subsequent changes in contingent consideration resulting from events after the date of acquisition are recognised through the income statement.
The excess of the fair value at the date of acquisition of the cost of investments in subsidiaries over the fair value of the net assets acquired which is not allocated to individual assets and liabilities is determined to be goodwill. When the Group acquires additional shares in an entity it already controls, any excess of the fair value of consideration over the net assets acquired is immediately deducted from equity and attributed to the owners of the Company.

ICG ANNUAL REPORT & ACCOUNTS 2015
NOTES TO THE ACCOUNTSFOR THE YEAR ENDED 31 MARCH 2015 CONTINUED
3. SIGNIFICANT ACCOUNTING POLICIES CONTINUED
INVESTMENT IN SUBSIDIARIES
Investments in subsidiaries in the Parent Company Statement of Financial Position are recorded at cost less provision for impairments or at fair value through profit or loss.
INVESTMENT IN ASSOCIATES
An associate is an entity over which the Group has significant influence, but no control, over the financial and operating policy decisions of the entity. As the investments in associates are held for venture capital purposes they are designated as fair value through profit or loss.
INVESTMENT IN JOINT VENTURES
A joint venture is a joint arrangement whereby the parties that have joint control over the arrangement have rights to the net assets of the arrangements. The results and assets and liabilities of joint ventures are incorporated in these financial statements using the equity method of accounting from the date on which the investee becomes a joint venture except when the investment is held for venture capital purposes in which case they are designated as fair value through profit and loss. Under the equity method, an investment in a joint venture is initially recognised in the Consolidated Statement of Financial Position at cost, and adjusted thereafter to recognise the Group’s share of the joint venture’s profit or loss.
EMPLOYEE BENEFIT TRUST
The Employee Benefit Trust (EBT) acts as a special purpose vehicle, with the purpose of purchasing and holding shares of the Company for the hedging of future liabilities arising as a result of the employee share based compensation scheme. The EBT is consolidated into the Group’s financial statements.
OWN SHARES HELD
Shares of the Company acquired by the EBT for the purpose of hedging share based payment transactions, or repurchased directly by the Company, are recognised and held at cost in the reserve for own shares. No gain or loss is recognised on the purchase, sale, issue or cancellation of the Company’s own shares.
INCOME RECOGNITION
Finance income includes interest income and dividend income. Interest income on financial assets held at amortised cost is measured using the effective interest rate method.
Dividend income is recognised in the income statement when the Group’s right to receive income is established.
Fair value movements comprise gains on disposal of available for sale financial assets and fair value gains and losses on both financial assets and financial liabilities at fair value through profit or loss. Movements are recognised as incurred.
Fund management fees and commissions are recognised in the income statement when the related service has been performed.
The Group receives carried interest from the third party funds it manages once those funds exceed a performance target. Carried interest income is recognised only when all performance conditions have been or have a high probability of being met.
FINANCE COSTS
Finance costs comprise interest expense on financial liabilities, fair value losses on derivatives and net foreign exchange losses.
Interest expense on financial liabilities held at amortised cost is measured using the effective interest rate method, as outlined on page 124. The expected life of the liability is based upon the maturity date.
Interest expense on financial liabilities held at fair value through profit or loss are recognised when the obligation to pay interest is established.
Changes in the fair value of derivatives are recognised in the income statement as incurred.
OPERATING LEASES
Operating lease payments, net of lease incentives, are recognised as an expense in the income statement on a straight line basis over the lease term.
EMPLOYEES BENEFITS
Contributions to the Group’s defined contribution pension schemes are charged to the income statement as incurred.
The Group issues compensation to its employees under equity settled share based payment plans. Equity settled share based payments are measured at the fair value of the awards at grant date. The fair value includes the effect of non market based vesting conditions. The fair value determined at the date of grant is expensed on a straight line basis over the vesting period. At each reporting date, the Group revises its estimate of the number of equity instruments expected to vest as a result of non market based vesting conditions. The impact of the revision of the original estimates, if any, is recognised in the income statement with a corresponding adjustment to equity.

120 / 121
STRATEGIC REPORT
GOVERNANCE REPORT
FINANCIAL STATEMENTS
TAXATION
Tax expense comprises current and deferred tax.
Current taxCurrent tax assets and liabilities comprise those obligations to, or claims from, fiscal authorities relating to the current or prior reporting period, that are unpaid at the reporting date.
Deferred taxDeferred tax is provided in respect of temporary differences between the carrying amounts of assets and liabilities and their tax bases. Deferred tax liabilities are recognised for all taxable temporary differences. Deferred tax assets are recognised to the extent that it is probable that future taxable profits will be available against which the deferred tax assets can be utilised.
Deferred tax is not recognised if the temporary difference arises from the initial recognition of goodwill or from the initial recognition of other assets and liabilities in a transaction, other than a business combination, that affects neither the tax nor the accounting profit.
Deferred tax assets and liabilities are calculated at the tax rates that are expected to be applied to their respective period of realisation, provided they are enacted or substantially enacted at the reporting date.
Deferred tax assets and liabilities are offset when there is a legally enforceable right of set off, when they relate to income taxes levied by the same taxation authority and the Group intends to settle on a net basis.
Changes in deferred tax assets or liabilities are recognised as a component of tax expense in the income statement, except where they relate to items that are charged or credited directly to equity, in which case the related deferred tax is also charged or credited directly to equity.
FOREIGN CURRENCIES
Transactions denominated in foreign currencies are translated using the exchange rates prevailing at the date of the transactions. At each reporting date, monetary assets and liabilities denominated in a foreign currency are retranslated at the rates prevailing at the reporting date. Non monetary assets and liabilities denominated in foreign currencies that are measured at fair value are translated at the rate prevailing at the date the fair value was determined. Non monetary items that are measured at historical cost are translated using rates prevailing at the date of the transaction.
The assets and liabilities of the Group’s foreign operations are translated using the exchange rates prevailing at the reporting date. Income and expense items are translated using the average exchange rates during the year. Exchange differences arising from the translation of foreign operations are taken directly to the translation reserve.
FINANCIAL ASSETS
Financial assets are classified into the following categories: financial assets ‘at fair value through profit or loss’ (FVTPL), ‘available-for-sale’ (AFS) financial assets and ‘loans and receivables’. The classification depends on the nature and purpose of the financial assets.
Financial assets at fair value through profit or loss (FVTPL)Financial assets at fair value through profit or loss include held for trading derivative financial instruments and debt and equity instruments designated as fair value through profit or loss. A financial asset is classified as at FVTPL if:
– it is a derivative that is not designated and effective as a hedging instrument, or
– the designation eliminates or significantly reduces a measurement or recognition inconsistency that would otherwise arise, or
– if the financial asset is managed, evaluated and reported internally on a fair value basis, in accordance with the Group’s documented risk management or investment strategy.
Financial assets at fair value through profit or loss are initially recognised and subsequently measured at fair value on a recurring basis with gains or losses arising from changes in fair value recognised through gains in investments in the income statement. Dividends or interest earned on the financial asset are excluded from gains on investments and recognised separately within finance income.
Loans and receivablesLoans and receivables are held at amortised cost, less any impairment. They are non derivative financial assets with fixed or determinable payments that are not quoted in an active market. They include loans made as part of the Group’s operating activities as well as trade and other receivables.
Loans and receivables are initially recognised at fair value including direct and incremental transaction costs and subsequently valued at amortised cost using the effective interest rate method as outlined on page 124. The carrying value of loans and receivables is considered a reasonable approximation of fair value. Any premium or discount on disposal of a loan or receivable to a third party is recognised through gains on investments,
Available For Sale financial assets (AFS)AFS financial assets are financial assets not classified elsewhere and include listed bonds and listed and unlisted equity instruments.
AFS financial assets are initially recognised at fair value. They are subsequently measured at fair value on a recurring basis with gains and losses arising from changes in fair value included as a separate component of equity until its sale or impairment, at which time the cumulative gain or loss previously recognised in equity is recognised through gains in investments in the income statement. Dividend income earned on the financial asset is excluded from gains on investments and recognised separately within finance income.

ICG ANNUAL REPORT & ACCOUNTS 2015
NOTES TO THE ACCOUNTSFOR THE YEAR ENDED 31 MARCH 2015 CONTINUED
3. SIGNIFICANT ACCOUNTING POLICIES CONTINUED
DERECOGNITION OF FINANCIAL ASSETS
The Group derecognises a financial asset when the contractual rights to the cash flows from the asset expire, or when substantially all the risks and rewards of ownership of the asset are transferred to another party. On derecognition of a financial asset in its entirety, the difference between the asset’s carrying value amount and the sum of the consideration received and receivable, and the cumulative gain or loss previously recognised in other comprehensive income and accumulated in equity, is recognised in profit or loss.
OFFSETTING OF FINANCIAL ASSETS
Financial assets and liabilities are offset and the net amount presented in the Statement of Financial Position when the Group has a legal right to offset the amounts and intends to either settle on a net basis, or to realise the asset and settle the liability simultaneously.
IMPAIRMENT OF FINANCIAL ASSETS
With the exception of financial assets classified as fair value through profit or loss, the Group assesses whether there is objective evidence that financial assets may be impaired at each reporting date such as a covenant breach or restructuring. A financial asset is impaired when objective evidence indicates that a loss event has occurred after the initial recognition of the asset and that the loss event has an impact on the estimated future flows.
For an investment in an equity instrument held as an AFS financial asset, a significant or prolonged decline in its fair value below cost is considered objective evidence of impairment.
If an impairment event has occurred on financial assets measured at amortised cost, the amount of the loss is measured as the difference between the asset’s carrying amount and the present value of estimated future cash flows, discounted at the original effective interest rate.
Impairment losses are recognised in the income statement. If the impairment relates to AFS financial assets, the loss is recycled from other comprehensive income to the income statement.
With the exception of AFS assets if, in a subsequent period, the amount of impairment loss decreases and the decrease can be related objectively to an event occurring after the impairment was recognised, the previously recognised impairment loss is reversed through the income statement to the extent that the carrying value of the investment at the date the impairment is reversed does not exceed what the amortised cost would have been had the impairment not been recognised.
In respect of AFS financial assets, impairment losses previously recognised in the income statement are not reversed through the income statement. Any increase in value, subsequent to an impairment loss, is recognised in other comprehensive income.
FINANCIAL ASSETS HELD FOR SALE
The Group classifies non current financial assets that are expected to be recovered primarily from sale as held for sale. This condition is regarded as met only when the asset is available for immediate sale, the Directors are committed to the sale, and the sale is expected to be completed within one year from date of classification.
Non current assets held for sale are initially recognised at cost, and subsequently measured at the lower of their carrying amount and fair value less costs to sell.
FINANCIAL LIABILITIES
Financial liabilities which include borrowings, with the exception of financial liabilities designated as fair value through profit or loss, are initially recognised at fair value net of transaction costs and subsequently measured at amortised cost using the effective interest rate method, with interest expense recognised on an effective yield basis.
Financial liabilities at fair value through profit or loss (FVTPL) include derivative liabilities and other financial liabilities designated as fair value through profit or loss. A financial instrument is classified as at FVTPL if it is a derivative that is not designated and effective as a hedging instrument, or the designation eliminates or significantly reduces a measurement or recognition inconsistency that would otherwise arise.
Financial liabilities at fair value through profit or loss are initially recognised and subsequently measured at fair value on a recurring basis with gains or losses arising from changes in fair value recognised through gains in investments in the income statement. Interest paid on the financial instruments is excluded from gains on investments and recognised separately within finance costs.
The Group derecognises financial liabilities when, and only when, the Group’s obligations are discharged, cancelled or expire.
DERIVATIVE FINANCIAL INSTRUMENTS FOR HEDGE ACCOUNTING
The Group holds derivative financial instruments to hedge foreign currency and interest rate exposures. Derivatives, including embedded derivatives which are not considered to be closely related to the host contract, are recognised at fair value determined using independent third party valuations or quoted market prices on a recurring basis. Changes in fair values of derivatives are recognised immediately in the income statement.
A derivative with a positive fair value is recognised as a financial asset whilst a derivative with a negative fair value is recognised as a financial liability. A derivative is presented as a non current asset or non current liability if the remaining maturity of the instrument is more than 12 months, otherwise a derivative will be presented as a current asset or current liability.

122 / 123
STRATEGIC REPORT
GOVERNANCE REPORT
FINANCIAL STATEMENTS
INTANGIBLE ASSETS
GoodwillGoodwill is initially recognised and measured as set out in the Business Combinations accounting policy and is reviewed at least annually for impairment. Any impairment is recognised immediately in the Group’s income statement and is not subsequently reversed.
Other intangible assetsIntangible assets with finite useful lives that are acquired separately, including investment management contracts and contact databases, are carried at cost less accumulated depreciation and impairment losses. These are measured at cost and are being amortised on a straight line basis over the expected life of the contract, currently three to five years.
DIVIDENDS PAID
Dividends paid to the Company’s Shareholders are recognised in the period in which the dividends are declared. In the case of final dividends, this is when they are approved by the Company’s Shareholders at the AGM. Dividends paid are recognised as a deduction from equity.
CASH AND CASH EQUIVALENTS
Cash and cash equivalents comprise cash and short term bank deposits with an original maturity of three months or less.
4. CRITICAL JUDGEMENTS AND KEY SOURCES OF ESTIMATION UNCERTAINTY
The significant accounting estimates used in preparing the financial statements are considered to relate to the determination of fair values and impairment of financial instruments. The estimates and associated assumptions are based on historical experience and other relevant factors, and are reviewed on an ongoing basis. Actual results may differ from these estimates.
DETERMINATION OF FAIR VALUES
Fair value is the amount for which an asset could be exchanged, or liability settled, between knowledgeable, willing parties in an arm’s length transaction at measurement date.
The following methods and assumptions are used to estimate the fair values:
AFS FINANCIAL ASSETS AND FINANCIAL ASSETS AT FVTPL
The fair value of equity investments and warrants are based on quoted prices, where available. Where quoted prices are not available, the fair value is based on recent significant transactions using an earnings based valuation technique.
The valuation techniques applied follow the International Private Equity and Venture Capital valuation guidelines (December 2012) and include some assumptions which are not supportable by observable market prices or rates. The majority of the portfolio of unquoted shares and warrants is valued using an earnings based technique.
Earnings multiples are applied to the maintainable earnings of the private company being valued to determine the enterprise value. From this, the value attributable to the Group is calculated based on its holding in the company after making deductions for higher ranking instruments in the capital structure.
The Group’s policy is to use reported earnings based on the latest management accounts available from the Company, adjusted for non recurring items. For each company being valued, the earnings multiple is derived from a set of comparable listed companies or relevant market transaction multiples that have been approved by the Investment Committee. A premium or discount is applied to the earnings multiple to adjust for points of difference relating to risk and earnings growth prospects between the comparable company set and the private company being valued. Across the portfolio being valued, the discount applied is generally in a range of 5% to 30% and exceptionally as high as 55%. The adjusted multiple is the key valuation input which could change fair values significantly if a reasonably possible alternative assumption was made. The sensitivity analysis of this input is disclosed in note 5.
OTHER DERIVATIVES
The fair value of the derivatives used for hedging purposes is derived from pricing models which take account of the contract terms, as well as quoted market parameters such as interest rates and volatilities. The Group has loans and receivables with a conversion option embedded. Given the low probability of conversion by the Group, the value attributed to these embedded derivatives is nil.
IMPAIRMENT
On a quarterly basis the Investment Committee reviews each asset in the Group’s portfolio. Assets which are underperforming or which the Committee wishes to receive regular updates on are added to the watch list. During the quarterly review the Committee will identify any impairment events and subsequently determine the level of impairment required. Typical impairment events include, but are not limited to, non payment of cash interest, covenant breach, deterioration in trading or a restructuring.
Impairment losses are recognised as the difference between the carrying value of the investment and the discounted value of management’s best estimates of future cash flow. These estimates take into account the level and quality of the investee’s earnings, the amount and sources of cash flows, the industry in which the investee operates and the likelihood of cash recovery. Estimating the quantum and timing of these future proceeds involves significant judgement.
The actual amount of future cash flows and the date that they are received may differ from these estimates and consequently actual losses incurred may differ from those initially recognised in the financial statements.

ICG ANNUAL REPORT & ACCOUNTS 2015
NOTES TO THE ACCOUNTSFOR THE YEAR ENDED 31 MARCH 2015 CONTINUED
4. CRITICAL JUDGEMENTS AND KEY SOURCES OF ESTIMATION UNCERTAINTY CONTINUED
EFFECTIVE INTEREST RATE
The effective interest rate is the rate that exactly discounts estimated future cash flows of a debt instrument, including agency and arranging fees, over the expected life of the financial instrument. The expected life of an asset is estimated by the relevant investment executive using knowledge gained from close monitoring of the investment and, where applicable, their presence on the Board. The expected life of a liability is determined by the maturity date of the debt, except for the secured debt where the expected life is estimated based on the expected life of the assets which the debt is secured on.
PROVISIONS AND CONTINGENT LIABILITIES
Provisions are recognised when it is probable that an outflow of economic resources will be required to settle a current legal or constructive obligation, which has arisen as a result of a past event, and for which a reliable estimate can be made of the amount of the obligation.
The Group’s onerous contract provision is measured at the present value of the lower of the ongoing cost of the contract and its expected termination cost.
The Group’s contingent liabilities include potential amounts, if any, for legal claims arising in the course of business. Contingent liabilities are possible obligations that arise from past events whose existence will be confirmed by the occurrence or non occurrence of one or more uncertain events not wholly within the control of the Group.
Contingent liabilities are not recognised in the financial statements but are disclosed unless the possibility of an outflow of economic resources is remote.
CONTROL AND SIGNIFICANT INFLUENCE ASSESSMENT
Those entities that are determined to be controlled by the Group are consolidated into the Group’s financial statements. At each reporting date an assessment is undertaken of third party funds and directly invested portfolio assets to determine control. In the intervening period assessments are undertaken where circumstances change that may give rise to a change in the control assessment. These include a restructuring of a portfolio company, a direct investment into a new third party fund, or an amendment to existing fund documentation or processes.
When assessing whether the Group has the power to affect its variable returns, and therefore control portfolio entities, a granular assessment is undertaken of the Group’s ability to influence the relevant activities of the investee company. These activities include looking at who can appoint key management, what decision making powers are reserved for the Board and whether the Group can make Board decisions.
The assessment undertaken for third party funds considers the Group’s level of investment into the fund. In addition, where the Group is the fund manager, a review of whether the manager is acting as principal or agent is undertaken.
As a result, determining whether any third party funds or portfolio companies are controlled by the Group involves significant judgement, as outlined in notes 31 to 33.
The consideration to acquire the remaining 49% of Longbow Real Estate Capital LLP is payable in two instalments, with a deferred payment in 2016 based on the valuation of the business as at 31 March 2016. At the time of the acquisition, £24m was accrued for the deferred payment based on an estimate of the valuation of the business as at 31 March 2016. This estimate was prepared in accordance with the valuation methodology being laid out in the Sale and Purchase Agreement and has been reconfirmed as at 31 March 2015. The final payment may be different to the current valuation, with any adjustment going through the income statement at the time.
5. FINANCIAL RISK MANAGEMENT
The Board of Directors have overall responsibility for the establishment and oversight of the Group’s risk management framework. There are systems of controls in place to create an acceptable balance between the potential costs, should such a risk occur, and the cost of managing those risks. Risk management policies and systems are reviewed regularly to reflect changes in the market conditions and the Group’s activities.
The Group has exposure to the following risks arising from financial instruments:
– market risk
– liquidity risk
– credit risk
This section provides details of the Group’s approach to financial risks and describes the methods used by the Board to mitigate and control such risk.
MARKET RISK
Market risk includes exposure to interest rates and foreign currency.
Interest rate riskThe Group’s assets include both fixed and floating rate loans and non interest bearing equity investments. The Group’s operations are financed with a combination of its Shareholders’ funds, bank borrowings, private placement notes, public bonds, and fixed and floating rate notes. The Group manages its exposure to market interest rate movements by matching, to the extent possible, the interest rate profiles of assets and liabilities and by using derivative financial instruments. As a result, the Group does not have material financial exposure to interest rate movements. The sensitivity of assets and liabilities to interest rate risk is disclosed below.

124 / 125
STRATEGIC REPORT
GOVERNANCE REPORT
FINANCIAL STATEMENTS
Sensitivity to interest rate risk
2015Restated
2014
Floating £m
Fixed £m
Total £m
Floating £m
Fixed £m
Total £m
Financial assets 2,216.5 1,528.5 3,745.0 2,041.7 1,216.9 3,258.6
Financial liabilities (1,638.3) (653.4) (2,291.7) (1,298.2) (423.0) (1,721.2)
578.2 875.1 1,453.3 743.5 793.9 1,537.4
The sensitivity of floating rate financial assets to the 100 basis points interest rate increase is an increase of £22.2m (2014: £20.4m) and the sensitivity of financial liabilities to the same interest rate increase is an increase of £16.4m (2014: £13.0m). There is no interest rate risk exposure on fixed rate financial assets or liabilities.
Foreign exchange riskThe Group is exposed to currency risk in relation to the translation of net assets and currency transactions, and the income statements of foreign subsidiaries. The Group’s most significant exposures are to the Euro and the US dollar. Exposure to market currency risk is managed by matching assets with liabilities to the extent possible and through the use of derivative instruments.
The Group regards its interest in overseas subsidiaries as long term investments. Consequently it does not normally hedge the translation effect of exchange rate movements on the financial statements of these businesses.
The Group is also exposed to currency risk arising on the translation of fund management fee income receipts, which are primarily denominated in Euro and US dollar. Fund management fee income is hedged to provide more certainty over the value of future cash inflows.
The sensitivity to movements in exchange rates is assumed by applying a percentage measure, based on the volatility of the applicable currency, as defined in the Group’s treasury policy, to the net currency asset or liability at the balance sheet date.
The effect of fluctuations in other currencies is considered by the Directors to be insignificant in the current and prior year. The net assets/(liabilities) by currency and the sensitivity of the balances to foreign exchange rates are shown below:
2015
Net statement of financial
position exposure
£m
Forward exchange contracts
£m
Net exposure
£m
Sensitivity to strengthening
%
Increase in net assets
£m
Sterling 8.4 1,192.6 1,201.0 – –
Euro 1,006.5 (809.4) 197.1 15 29.6
US dollar 187.6 (171.7) 15.9 20 3.2
Other currencies 250.8 (198.0) 52.8 10-25 –
1,453.3 13.5 1,466.8 – 32.8
Restated2014
Net statement of financial
position exposure
£m
Forward exchange contracts
£m
Net exposure
£m
Sensitivity to strengthening
%
Increase in net assets
£m
Sterling (25.6) 1,386.1 1,360.5 – –
Euro 1,210.5 (1,093.2) 117.3 15 17.6
US dollar 137.6 (95.9) 41.7 20 8.3
Other currencies 214.9 (187.4) 27.5 10-25 –
1,537.4 9.6 1,547.0 – 25.9
The weakening of the above currencies would have resulted in an equal but opposite impact, being a decrease in net assets.

ICG ANNUAL REPORT & ACCOUNTS 2015
NOTES TO THE ACCOUNTSFOR THE YEAR ENDED 31 MARCH 2015 CONTINUED
5. FINANCIAL RISK MANAGEMENT CONTINUED
LIQUIDITY RISK
The Group manages its liquidity risk by maintaining headroom on its financing facilities, particularly its bank facilities.
The table below shows the liquidity profile of the Group’s financial liabilities, based on contractual repayment dates of principal and interest payments. Future interest and principal cash flows have been calculated based on exchange rates and floating rate interest rates as at 31 March 2015. It is assumed that Group borrowings under its senior debt facilities remain at the same level as at 31 March 2015 until contractual maturity. Included in financial liabilities maturing in less than one year are contractual interest payments.
Liquidity profile
Contractual maturity analysis
As at 31 March 2015
Less than one year
£m
One to two years
£m
Two to five years
£m
More than five years
£mTotal
£m
Non derivative financial liabilities
Private placements 34.2 123.9 183.8 73.4 415.3
Listed notes and bonds 17.8 17.8 137.7 266.5 439.8
Unsecured bank debt 0.7 20.1 – – 20.8
Floating rate secured notes 0.6 0.6 1.9 36.6 39.7
Secured bank debt 26.7 – – – 26.7
Structured entities controlled by the Group 48.6 48.6 145.7 1,873.8 2,116.7
Derivative financial instruments
Derivative financial instruments (1.9) (10.4) (1.1) – (13.4)
126.7 200.6 468.0 2,250.3 3,045.6
As at 31 March 2015 the Group has unutilised debt facilities of £758.4m (2014: £678.3m) which consists of undrawn debt of £505.7m (2014: £594.3m) and £252.7m (2014: £84.0m) of unencumbered cash. Unencumbered cash excludes £139.2m (2014: £189.5m) of restricted cash held principally by Intermediate Finance II plc and structured entities controlled by the Group.
Contractual maturity analysis
RestatedAs at 31 March 2014
Less than one year
£m
One to two years
£m
Two to five years
£m
More than five years
£mTotal
£m
Non derivative financial liabilities
Private placements 19.3 31.9 302.8 49.2 403.2
Listed notes and bonds 9.3 9.3 104.0 85.0 207.6
Unsecured bank debt 0.7 0.7 20.1 – 21.5
Floating rate secured notes 2.1 2.1 6.1 131.5 141.8
Secured bank debt 0.5 9.6 – – 10.1
Structured entities controlled by the Group 26.6 26.6 79.7 1,420.5 1,553.4
Derivative financial instruments
Derivative financial instruments (12.1) (4.5) 5.1 – (11.5)
46.4 75.7 517.8 1,686.2 2,326.1
The Group’s policy is to maintain continuity of funding. Due to the long term nature of the Group’s assets, the Group seeks to ensure that the maturity of its debt instruments is matched to the expected maturity of its assets. This has been achieved by the ongoing private placement programme with notes maturing between one and five years, short term borrowings under bank facilities, three public bonds and by issuing floating and fixed rate notes. Work to maintain this diversity continued throughout the year, raising £189.4m, including a £160m listed bond.
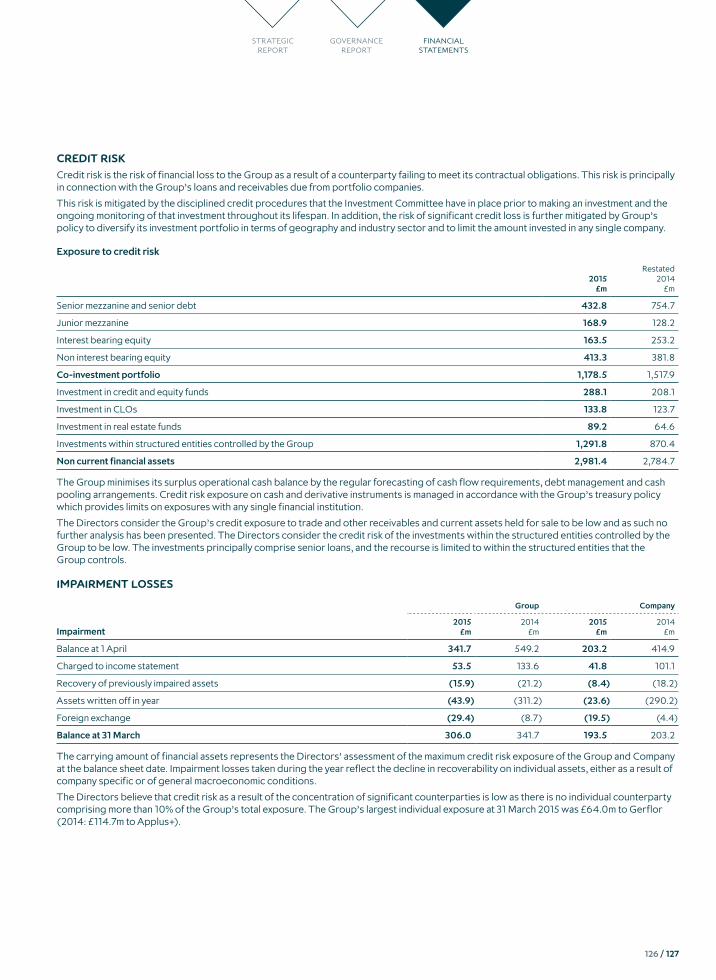
126 / 127
STRATEGIC REPORT
GOVERNANCE REPORT
FINANCIAL STATEMENTS
CREDIT RISK
Credit risk is the risk of financial loss to the Group as a result of a counterparty failing to meet its contractual obligations. This risk is principally in connection with the Group’s loans and receivables due from portfolio companies.
This risk is mitigated by the disciplined credit procedures that the Investment Committee have in place prior to making an investment and the ongoing monitoring of that investment throughout its lifespan. In addition, the risk of significant credit loss is further mitigated by Group’s policy to diversify its investment portfolio in terms of geography and industry sector and to limit the amount invested in any single company.
Exposure to credit risk
2015 £m
Restated2014
£m
Senior mezzanine and senior debt 432.8 754.7
Junior mezzanine 168.9 128.2
Interest bearing equity 163.5 253.2
Non interest bearing equity 413.3 381.8
Co-investment portfolio 1,178.5 1,517.9
Investment in credit and equity funds 288.1 208.1
Investment in CLOs 133.8 123.7
Investment in real estate funds 89.2 64.6
Investments within structured entities controlled by the Group 1,291.8 870.4
Non current financial assets 2,981.4 2,784.7
The Group minimises its surplus operational cash balance by the regular forecasting of cash flow requirements, debt management and cash pooling arrangements. Credit risk exposure on cash and derivative instruments is managed in accordance with the Group’s treasury policy which provides limits on exposures with any single financial institution.
The Directors consider the Group’s credit exposure to trade and other receivables and current assets held for sale to be low and as such no further analysis has been presented. The Directors consider the credit risk of the investments within the structured entities controlled by the Group to be low. The investments principally comprise senior loans, and the recourse is limited to within the structured entities that the Group controls.
IMPAIRMENT LOSSES
Group Company
Impairment2015
£m2014
£m2015
£m2014
£m
Balance at 1 April 341.7 549.2 203.2 414.9
Charged to income statement 53.5 133.6 41.8 101.1
Recovery of previously impaired assets (15.9) (21.2) (8.4) (18.2)
Assets written off in year (43.9) (311.2) (23.6) (290.2)
Foreign exchange (29.4) (8.7) (19.5) (4.4)
Balance at 31 March 306.0 341.7 193.5 203.2
The carrying amount of financial assets represents the Directors’ assessment of the maximum credit risk exposure of the Group and Company at the balance sheet date. Impairment losses taken during the year reflect the decline in recoverability on individual assets, either as a result of company specific or of general macroeconomic conditions.
The Directors believe that credit risk as a result of the concentration of significant counterparties is low as there is no individual counterparty comprising more than 10% of the Group’s total exposure. The Group’s largest individual exposure at 31 March 2015 was £64.0m to Gerflor (2014: £114.7m to Applus+).

ICG ANNUAL REPORT & ACCOUNTS 2015
NOTES TO THE ACCOUNTSFOR THE YEAR ENDED 31 MARCH 2015 CONTINUED
5. FINANCIAL RISK MANAGEMENT CONTINUED
FAIR VALUE MEASUREMENTS RECOGNISED IN THE STATEMENT OF FINANCIAL POSITION
The information set out below provides information about how the Group determines fair values of various financial assets and financial liabilities.
The following table provides an analysis of financial instruments that are measured subsequent to initial recognition at fair value, grouped into Levels 1 to 3 based on the degree to which the fair value is observable.
– Level 1 fair value measurements are those derived from quoted prices (unadjusted) in active markets for identical assets or liabilities
– Level 2 fair value measurements are those derived from inputs other than quoted prices included within Level 1 that are observable for the asset or liability, either directly (i.e. as prices) or indirectly (i.e. derived from prices)
– Level 3 fair value measurements are those derived from valuation techniques that include inputs for the asset or liability that are not based on observable market data (i.e. unobservable inputs)
This is followed by a more detailed analysis of the financial instruments which are based on unobservable inputs (Level 3 assets). The subsequent tables provide reconciliations of movement in their fair value during the year split by asset category and by geography. The Group is required to provide disclosures at a more detailed level than by asset category, segregating each asset category by sector or geography. The Group has chosen to present financial instruments by geography as the diverse nature of the Group’s assets makes any disclosure of assets by industry less meaningful to the Group’s risk profile than geographical factors.
Financial assets/ financial liabilities
Fair value as at 31 March 2015£m
Restated Fair value as at 31 March 2014 £m
Fair value hierarchy
Valuation techniques and inputs
Significant unobservable inputs
Relationship of unobservable inputs to fair value
Listed portfolioinvestments
136.8 31.6 1 A small number of assets have been listed on various stock exchanges around the world, providing an external basis for valuing the Group's holdings
n/a n/a
Listedcredit fundinvestments
58.6 62.1 1 Quoted bid prices in an active market n/a n/a
Level 2 assets within structured entities controlled by the Group
1,349.1 905.4 2 The fair value has been determined using independent broker quotes based on observable inputs
n/a n/a
Level 3 investments
270.2 280.8 3 Earnings based technique. The earnings multiple is derived from a set of comparable listed companies or relevant market transaction multiples. A premium or discount is applied to the earnings multiple to adjust for points of difference relating to risk and earnings growth prospects between the comparable company set and the private company being valued. Earnings multiples are applied to the maintainable earnings to determine the enterprise value. From this, the value attributable to the Group is calculated based on its holding in the Company after making deductions for higher ranking instruments in the capital structure. To determine the value of warrants, the exercise price is deducted
The discount applied is generally in a range of 5% to 30% and exceptionally as high as 55%. A premium has been applied to three assets in the range of 17%–38%. The earnings multiple is generally in the range of 9–15, and exceptionally as high as 29 or as low as 5
The higher the adjusted multiple, the higher the valuation

128 / 129
STRATEGIC REPORT
GOVERNANCE REPORT
FINANCIAL STATEMENTS
Financial assets/ financial liabilities
Fair value as at 31 March 2015£m
Restated Fair value as at 31 March 2014 £m
Fair value hierarchy
Valuation techniques and inputs
Significant unobservable inputs
Relationship of unobservable inputs to fair value
Level 3 assets within structured entities controlled by the Group
55.0 144.1 3 Where there are no recent transactions, fair value may be determined from the last market price adjusted for all changes in risks and information since that date. Where a close proxy instrument is quoted in an active market, then fair value is determined by adjusting the proxy value for differences in the risk profile of the instruments
A premium/discount is applied taking into account market comparisons, seniority of debt, credit rating, current debt, interest coupon, maturity of the loan and jurisdiction of the loan
The higher the premium, the higher the valuation. The higher the discount, the lower the valuation
Investmentsin unlistedfunds
452.4 295.5 3 The Net Asset Value (NAV) of the fund is based on the underlying investments which are held either as FVTPL assets or as loans and receivables initially recognised at fair value and subsequently valued at amortised cost. The carrying value of loans and receivables held at amortised cost are considered a reasonable approximation of fair value. We have reviewed the underlying valuation techniques of the funds and consider them to be in line with those of the Group
The NAV of the underlying fund, typically calculated under IFRS
The higher the NAV, the higher the fair value
Investmentsin unlistedCLOs
33.1 28.0 3 Discounted cash flow at a discount rate of 8% (debt at market rates). The following assumptions are applied to each investment’s cashflows: 3% annual default rate, 20% annual prepayment rate, 70% recovery rate
Discounted cash flows The higher the cash flows the higher the fair value. The higher the discount, the lower the fair value
Level 2 liabilities within structured entities controlled by the Group
(1,373.4) (747.2) 2 The fair value of debt securities issued at fair value through profit or loss is dependent upon the fair value of investment securities and derivative financial instruments. Any changes in the valuation have a direct impact to the fair value of debt securities issued
n/a n/a
Level 3 liabilities within structured entities controlled by the Group
– (189.6) 3 The loan notes have significant unobservable inputs as they trade infrequently. The fair value of the loan notes is determined primarily by reference to a market value of the underlying assets in the CLO structures which are determined using independent broker quotes based on observable inputs. These liabilities were transferred to level 2 in FY15 when the notes started trading and market prices became available
The loan notes are limited recourse debt obligation payable solely from the underlying collateral of the CLO. The loan notes therefore provide a return equal to the residual economic value of the underlying collateral
The higher the residual economic value of the underlying collateral the higher the fair value
Derivatives 13.5 9.6 2 The Group uses widely recognised valuation models for determining the fair values of over-the-counter interest rate swaps and forward foreign exchange contracts. The most frequently applied valuation techniques include forward pricing and swap models, using present value calculations. The valuations are market observable, internally calculated and verified to externally sourced data and are therefore included within level 2
n/a n/a
Total 995.3 820.3
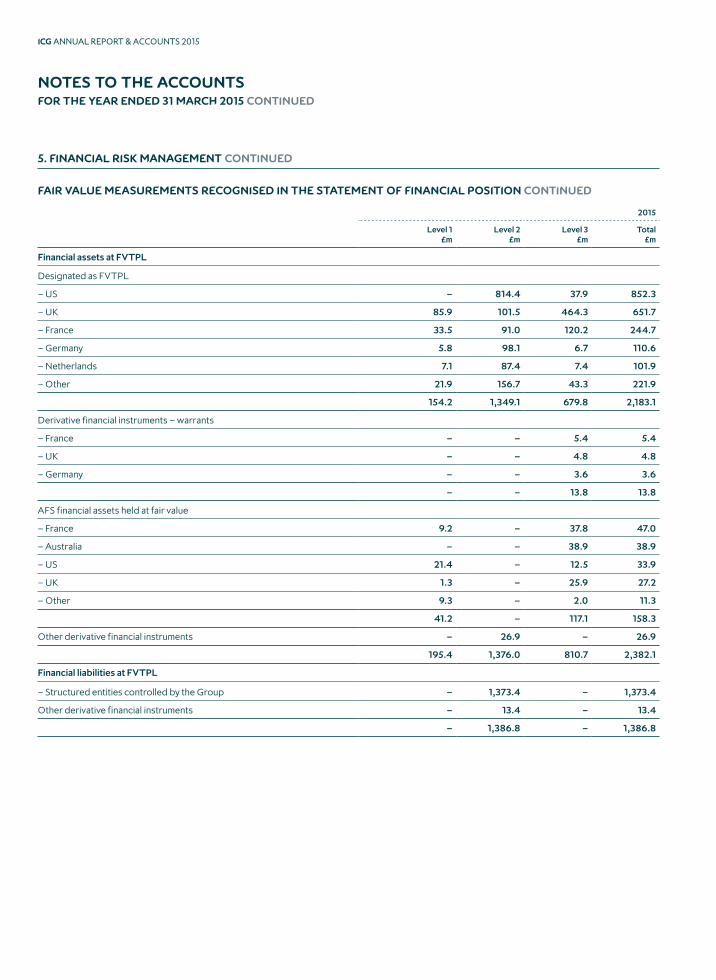
ICG ANNUAL REPORT & ACCOUNTS 2015
NOTES TO THE ACCOUNTSFOR THE YEAR ENDED 31 MARCH 2015 CONTINUED
5. FINANCIAL RISK MANAGEMENT CONTINUED
FAIR VALUE MEASUREMENTS RECOGNISED IN THE STATEMENT OF FINANCIAL POSITION CONTINUED
2015
Level 1 £m
Level 2 £m
Level 3 £m
Total £m
Financial assets at FVTPL
Designated as FVTPL
– US – 814.4 37.9 852.3
– UK 85.9 101.5 464.3 651.7
– France 33.5 91.0 120.2 244.7
– Germany 5.8 98.1 6.7 110.6
– Netherlands 7.1 87.4 7.4 101.9
– Other 21.9 156.7 43.3 221.9
154.2 1,349.1 679.8 2,183.1
Derivative financial instruments – warrants
– France – – 5.4 5.4
– UK – – 4.8 4.8
– Germany – – 3.6 3.6
– – 13.8 13.8
AFS financial assets held at fair value
– France 9.2 – 37.8 47.0
– Australia – – 38.9 38.9
– US 21.4 – 12.5 33.9
– UK 1.3 – 25.9 27.2
– Other 9.3 – 2.0 11.3
41.2 – 117.1 158.3
Other derivative financial instruments – 26.9 – 26.9
195.4 1,376.0 810.7 2,382.1
Financial liabilities at FVTPL
– Structured entities controlled by the Group – 1,373.4 – 1,373.4
Other derivative financial instruments – 13.4 – 13.4
– 1,386.8 – 1,386.8

130 / 131
STRATEGIC REPORT
GOVERNANCE REPORT
FINANCIAL STATEMENTS
Restated2014
Level 1 £m
Level 2 £m
Level 3 £m
Total £m
Financial assets at FVTPL
Designated as FVTPL
– UK 62.1 131.2 316.9 510.2
– US – 255.2 23.6 278.8
– France – 122.5 112.7 235.2
– Germany – 103.7 41.8 145.5
– Netherlands – 114.8 12.6 127.4
– Others – 178.0 45.9 223.9
62.1 905.4 553.5 1,521.0
Derivative financial instruments – warrants
– France – – 8.7 8.7
– Denmark – – 3.8 3.8
– Germany – – 3.8 3.8
– UK – – 2.2 2.2
– – 18.5 18.5
AFS financial assets held at fair value
– France – – 63.7 63.7
– US 31.6 – 14.5 46.1
– Australia – – 34.0 34.0
– UK – – 25.2 25.2
– Others – – 39.0 39.0
31.6 – 176.4 208.0
Other derivative financial instruments – 19.0 – 19.0
93.7 924.4 748.4 1,766.5
Financial liabilities at FVTPL
– Structured entities controlled by the Group – 747.2 189.6 936.8
Other derivative financial instruments – 9.4 – 9.4
– 756.6 189.6 946.2

ICG ANNUAL REPORT & ACCOUNTS 2015
NOTES TO THE ACCOUNTSFOR THE YEAR ENDED 31 MARCH 2015 CONTINUED
5. FINANCIAL RISK MANAGEMENT CONTINUED
FAIR VALUE MEASUREMENTS RECOGNISED IN THE STATEMENT OF FINANCIAL POSITION CONTINUED
Reconciliation of Level 3 fair value measurements of financial assets
The tables detail the movements in financial assets valued using the Level 3 basis of measurement in aggregate.
Within the income statement, realised gains and fair value movements are included within gains on investments, and foreign exchange is included within finance costs. Within other comprehensive income, fair value movements and foreign exchange are included within fair value movements.
Financial assets at
FVTPL £m
Derivative financial
instruments – warrants
£m
AFS assets
£mTotal
£m
At 1 April 2014 553.5 18.5 176.4 748.4
Total gains or losses in the income statement
– Realised gains (24.2) (1.0) (14.0) (39.2)
– Fair value gains 109.9 (2.0) – 107.9
– Foreign exchange (50.3) (1.7) (10.2) (62.2)
Total gains or losses in other comprehensive income
– Unrealised gains – – 1.0 1.0
Purchases 256.6 – 2.0 258.6
Realisations (129.7) – (16.5) (146.2)
Transfer between assets 3.5 – – 3.5
Transfers between levels (39.5) – (21.6) (61.1)
At 31 March 2015 679.8 13.8 117.1 810.7

132 / 133
STRATEGIC REPORT
GOVERNANCE REPORT
FINANCIAL STATEMENTS
Restated
Financial assets at
FVTPL £m
Derivative financial
instruments – warrants
£m
AFS assets
£mTotal
£m
At 1 April 2013 192.0 40.2 325.4 557.6
Total gains or losses in the income statement
– Realised gains (16.9) (11.2) (125.7) (153.8)
– Fair value gains 20.9 7.3 – 28.2
– Foreign exchange (17.9) 2.5 (16.6) (32.0)
Total gains or losses in other comprehensive income
– Unrealised gains – – 7.8 7.8
Purchases 365.6 – 19.7 385.3
Realisations (32.5) – (18.5) (51.0)
Conversion debt to equity 41.0 – 3.3 44.3
Exercise of options 1.3 (20.3) 19.0 –
Transfer between levels – – (38.0) (38.0)
At 31 March 2014 553.5 18.5 176.4 748.4
The level 3 fair value movements by geography are as follows:
Financial assets at FVTPLUS £m
UK £m
France £m
Germany £m
Netherlands £m
Other £m
Total £m
At 1 April 2014 23.6 316.9 112.7 41.8 12.6 45.9 553.5
Total gains or losses in the income statement
– Realised gains 0.5 (5.5) (9.3) – – (9.9) (24.2)
– Fair value gains 2.4 49.2 48.0 (0.5) (0.7) 11.5 109.9
– Foreign exchange 3.9 (35.4) (12.5) (1.8) – (4.5) (50.3)
Purchases 27.2 201.9 1.8 6.3 5.1 14.3 256.6
Realisations (7.8) (55.5) (28.3) (16.9) (9.6) (11.6) (129.7)
Transfer between assets – (3.1) 6.3 – – 0.3 3.5
Transfer between levels (11.9) (4.2) 1.5 (22.2) – (2.7) (39.5)
At 31 March 2015 37.9 464.3 120.2 6.7 7.4 43.3 679.8
Derivative financial instruments – warrantsFrance
£mUK £m
Germany£m
Denmark £m
Total £m
At 1 April 2014 8.7 2.2 3.8 3.8 18.5
Total gains or losses in the income statement
– Realised gains (0.3) (0.5) (0.2) – (1.0)
– Fair value gains (2.1) 3.1 0.6 (3.6) (2.0)
– Foreign exchange (0.9) – (0.6) (0.2) (1.7)
At 31 March 2015 5.4 4.8 3.6 – 13.8

ICG ANNUAL REPORT & ACCOUNTS 2015
NOTES TO THE ACCOUNTSFOR THE YEAR ENDED 31 MARCH 2015 CONTINUED
FAIR VALUE MEASUREMENTS RECOGNISED IN THE STATEMENT OF FINANCIAL POSITION CONTINUED
AFS assetsFrance
£mAustralia
£mUS £m
UK £m
Other £m
Total £m
At 1 April 2014 63.7 34.0 14.5 25.2 39.0 176.4
Total gains or losses in the income statement
– Realised gains 1.2 (3.4) – (2.0) (9.8) (14.0)
– Foreign exchange (5.7) (2.0) 1.6 (2.4) (1.7) (10.2)
Total gains or losses in other comprehensive income
– Unrealised gains (7.3) 18.1 (3.6) 5.7 (11.9) 1.0
Purchases 0.1 – – 2.0 (0.1) 2.0
Realisations (2.9) (7.8) – (2.2) (3.6) (16.5)
Transfer between levels (11.3) – – (0.4) (9.9) (21.6)
At 31 March 2015 37.8 38.9 12.5 25.9 2.0 117.1
RestatedFinancial assets at FVTPL
UK £m
US£m
France£m
Germany£m
Netherlands£m
Other£m
Total£m
At 1 April 2013 119.0 5.7 32.4 – 0.1 34.8 192.0
Total gains or losses in the income statement
–Realised gains (11.8) – – – – (5.1) (16.9)
–Fair value gains 20.6 (0.7) (3.6) 0.2 0.2 4.2 20.9
–Foreign exchange (6.1) (0.9) (3.1) (1.2) (0.3) (6.3) (17.9)
Purchases 218.8 19.5 46.4 44.6 12.6 23.7 365.6
Realisations (23.6) – (1.7) (1.8) – (5.4) (32.5)
Conversion debt to equity – – 41.0 – – – 41.0
Exercise of options – – 1.3 – – – 1.3
At 31 March 2014 316.9 23.6 112.7 41.8 12.6 45.9 553.5
Derivative financial instruments – warrantsFrance
£mGermany
£mDenmark
£mUK £m
Other £m
Total £m
At 1 April 2013 9.8 5.0 3.8 5.5 16.1 40.2
Total gains or losses in the income statement
– Realised gains (0.2) (0.6) – (7.7) (2.7) (11.2)
–Fair value gains 0.6 (0.4) – 4.4 2.7 7.3
– Foreign exchange (0.2) (0.2) – – 2.9 2.5
Exercise options (1.3) – – – (19.0) (20.3)
At 31 March 2014 8.7 3.8 3.8 2.2 – 18.5

134 / 135
STRATEGIC REPORT
GOVERNANCE REPORT
FINANCIAL STATEMENTS
AFS assetsFrance
£mUS £m
Australia £m
UK £m
Other £m
Total £m
At 1 April 2013 64.3 54.8 36.0 136.0 34.3 325.4
Total gains or losses in the income statement
– Realised gains (0.8) – (3.6) (120.4) (0.9) (125.7)
– Foreign exchange (1.5) (1.4) (12.8) (0.2) (0.7) (16.6)
Total gains or losses in other comprehensive income
– Unrealised gains 4.2 (0.9) (18.7) 19.8 3.4 7.8
Purchases 0.1 – 15.2 4.3 0.1 19.7
Realisations (2.6) – (1.1) (14.3) (0.5) (18.5)
Conversion debt to equity – – – – 3.3 3.3
Exercise of options – – 19.0 – – 19.0
Transfer between levels – (38.0) – – – (38.0)
At 31 March 2014 63.7 14.5 34.0 25.2 39.0 176.4
Reconciliation of Level 3 fair value measurements of financial liabilities
This table details the movements in financial liabilities valued using the Level 3 basis of measurement in aggregate.
Financial liabilities at FVTPL – Structured entities controlled by the Group 2015
£m2014
£m
At 1 April 189.6 –
Total gains or losses in other comprehensive income
– Unrealised gains – 1.8
Purchases – 187.8
Transferred to level 2 (189.6) –
At 31 March – 189.6
FAIR VALUE
The following table shows the sensitivity of fair values grouped in Level 3 to adjusted earnings multiples in the valuation models, for a selection of the largest financial assets. It is assumed that the multiple was changed by 10% while all the other variables were held constant.
Sensitivity of financial asset to adjusted earnings multiple
Financial assets at fair value
Value in accounts
£m+10%
£m–10%
£m
2015
Financial assets designated as FVTPL 679.8 785.5 546.1
Derivative financial instruments held at fair value – warrants 13.8 18.7 8.9
AFS financial assets held at fair value 117.1 137.0 92.8
810.7 941.2 647.8
Restated 2014
Financial assets designated as FVTPL 553.5 621.4 466.6
Derivative financial instruments held at fair value – warrants 18.5 23.9 13.1
AFS financial assets held at fair value 176.4 208.4 142.2
748.4 853.7 621.9

ICG ANNUAL REPORT & ACCOUNTS 2015
NOTES TO THE ACCOUNTSFOR THE YEAR ENDED 31 MARCH 2015 CONTINUED
5. FINANCIAL RISK MANAGEMENT CONTINUED
DERIVATIVES
The Group utilises the following derivative instruments for economic hedging purposes:
Group 2015Restated
Group 2014
Contract or underlying
principal amount
£m
Fair values Contract or underlying
principal amount
£m
Fair values
Asset £m
Liability £m
Asset £m
Liability £m
Foreign exchange derivatives
Forward foreign exchange contracts 1,408.9 10.4 (12.7) 1,631.7 12.1 (4.6)
Cross currency swaps 74.6 13.3 (0.7) 96.5 3.1 (4.8)
Interest rate swaps 34.8 3.2 – 33.2 3.8 –
Total 1,518.3 26.9 (13.4) 1,761.4 19.0 (9.4)
Included in derivative financial instruments is accrued interest on swaps of £0.7m (2014: £0.7m).
Company 2015 Company 2014
Contract or underlying
principal amount
£m
Fair values Contract or underlying
principal amount
£m
Fair values
Asset £m
Liability £m
Asset £m
Liability £m
Foreign exchange derivatives
Forward foreign exchange contracts 1,336.7 9.5 (12.7) 1,568.5 12.1 (4.5)
Cross currency swaps 74.6 13.3 (0.7) 85.2 2.7 (4.8)
Interest rate swaps 34.8 3.2 – 33.2 3.8 –
Total 1,446.1 26.0 (13.4) 1,686.9 18.6 (9.3)
CAPITAL MANAGEMENT
The primary objectives of the Group’s capital management are to ensure that the Group complies with externally imposed capital requirements by the Financial Conduct Authority (FCA) and ensure that the Group maximises the return to shareholders through the optimisation of the debt and equity balance. The Group’s strategy has remained unchanged from the year ended 31 March 2014.
The capital structure comprises debts, which includes the borrowings disclosed in note 24, cash and cash equivalents, and capital and reserves of the parent company, comprising called up share capital, reserves and retained earnings as disclosed in the Consolidated Statement of Changes in Equity.
The Group has complied with the imposed minimum capital throughout the year. The full Pillar 3 disclosures are available on the Company’s website www.icgplc.com.
6. PROFIT OF PARENT COMPANY
As permitted by section 408 of the Companies Act 2006, the income statement of the parent Company is not presented as part of these financial statements. The parent Company’s profit for the year amounted to £200.7m (2014: £145.2m).
7. BUSINESS AND GEOGRAPHICAL SEGMENTS
For management purposes, the Group is currently organised into the Fund Management Company (FMC) and the Investment Company (IC). Segment information about these businesses is presented below and is reviewed by the Executive Committee.
The Group reports the profit of the FMC separately from the profits generated by the IC. The FMC is defined as the operating unit and as such incurs the majority of the Group’s costs, including the cost of the investment network, i.e. the Investment Executives and the local offices, as well as the cost of most support functions, primarily information technology, human resources and marketing.
The IC is charged a management fee of 1% of the carrying value of the average investment portfolio by the FMC and this is shown below as fee income. The costs of finance, treasury and portfolio administration teams, and the costs related to being a listed entity, are allocated to the IC. The remuneration of the Managing Directors is allocated equally to the FMC and the IC.

136 / 137
STRATEGIC REPORT
GOVERNANCE REPORT
FINANCIAL STATEMENTS
ANALYSIS OF INCOME AND PROFIT BEFORE TAX
Year ended 31 March 2015
Mezzanine& Equity
£mCredit Funds
£mReal Estate
£m
Total FMC
£mIC
£mTotal
£m
External fee income 62.2 22.9 10.7 95.8 – 95.8
Inter-segmental fee 14.4 3.3 1.0 18.7 (18.7) –
Fund management fee income 76.6 26.2 11.7 114.5 (18.7) 95.8
Other operating income – 4.5 4.5
Gains on investments – 111.6 111.6
Net interest income (0.4) 118.8 118.4
Dividend income 13.2 3.4 16.6
Net fair value loss on derivatives – (7.1) (7.1)
127.3 212.5 339.8
Impairment – (37.6) (37.6)
Staff costs (27.4) (9.3) (36.7)
Incentive scheme costs (19.0) (30.5) (49.5)
Other administrative expenses (28.9) (10.1) (39.0)
Profit before tax 52.0 125.0 177.0
Restated Year ended 31 March 2014
Mezzanine& Equity
£mCredit Funds
£mReal Estate
£m
Total FMC
£mIC
£mTotal
£m
External fee income 53.6 19.0 6.4 79.0 – 79.0
Inter-segmental fee 18.5 2.2 – 20.7 (20.7) –
Fund management fee income 72.1 21.2 6.4 99.7 (20.7) 79.0
Other operating income – 6.9 6.9
Gains on investments – 134.1 134.1
Net interest income (0.4) 149.0 148.6
Dividend income 1.3 19.7 21.0
Net fair value loss on derivatives – (16.4) (16.4)
100.6 272.6 373.2
Impairment – (112.4) (112.4)
Staff costs (23.5) (6.8) (30.3)
Incentive scheme costs (13.6) (22.6) (36.2)
Other administrative expenses (28.4) (7.2) (35.6)
Profit before tax 35.1 123.6 158.7

ICG ANNUAL REPORT & ACCOUNTS 2015
NOTES TO THE ACCOUNTSFOR THE YEAR ENDED 31 MARCH 2015 CONTINUED
7. BUSINESS AND GEOGRAPHICAL SEGMENTS CONTINUED
RECONCILIATION OF BALANCE SHEET POSITION REPORTED TO THE EXECUTIVE COMMITTEE TO THE POSITION REPORTED UNDER IFRS
Included in the table below are statutory adjustments made for the co-investment in funds, the structured entities controlled by the Group, the joint venture investment in Nomura ICG KK and the Employee Benefit Trust (EBT) settlement.
For internal reporting purposes the interest earned on assets where we co-invest in funds (ICG Europe Fund V and ICG North America Private Debt Fund) is presented within interest income whereas under IFRS it is included within the value of the investment. The structured entities controlled by the Group are presented as fair value investments for internal reporting purposes, whereas the statutory financial statements present these entities on a fully consolidated basis. The joint venture investment in Nomura ICG KK is presented internally on a proportional consolidation basis, whereas it is equity accounted under IFRS. The one off impact of the EBT settlement was excluded for internal reporting purposes.
Year ended 31 March 2015
Internally reported
£m
Reclass of interest to gains
£m
Consolidatedstructured
entities£m
Japan joint venture
£m
EBT settlement
£m
Total adjustments
£m
Financial statements
£m
Fund management fee income 95.8 – (6.9) (0.2) – (7.1) 88.7
Other operating income 4.5 – 1.8 – – 1.8 6.3
Gains on investments 111.6 14.5 12.0 (0.2) – 26.3 137.9
Net interest income 118.4 (14.5) 15.2 – – 0.7 119.1
Dividend income 16.6 – (10.2) – – (10.2) 6.4
Net fair value loss on derivatives (7.1) – 9.8 – – 9.8 2.7
339.8 – 21.7 (0.4) – 21.3 361.1
Share of results of joint ventures accounted for using equity method – – – (0.5) – (0.5) (0.5)
Impairment (37.6) – – – – – (37.6)
Staff costs (36.7) – – 0.3 (17.6) (17.3) (54.0)
Incentive scheme costs (49.5) – – – – – (49.5)
Other administrative expenses (39.0) – (2.6) 0.9 (0.3) (2.0) (41.0)
Profit before tax 177.0 – 19.1 0.3 (17.9) 1.5 178.5
RestatedYear ended 31 March 2014
Internally reported
£m
Reclass of interest to gains
£m
Consolidatedstructured
entities£m
Total adjustments
£m
Financial statements
£m
Fund management fee income 79.0 – (2.6) (2.6) 76.4
Other operating income 6.9 – 1.5 1.5 8.4
Gains on investments 134.1 14.4 12.0 26.4 160.5
Net interest income 148.6 (14.4) 7.1 (7.3) 141.3
Dividend income 21.0 – – – 21.0
Net fair value loss on derivatives (16.4) – – – (16.4)
373.2 – 18.0 18.0 391.2
Impairment (112.4) – – – (112.4)
Staff costs (30.3) – – – (30.3)
Incentive scheme costs (36.2) – – – (36.2)
Other administrative expenses (35.6) – (12.3) (12.3) (47.9)
Profit before tax 158.7 – 5.7 5.7 164.4
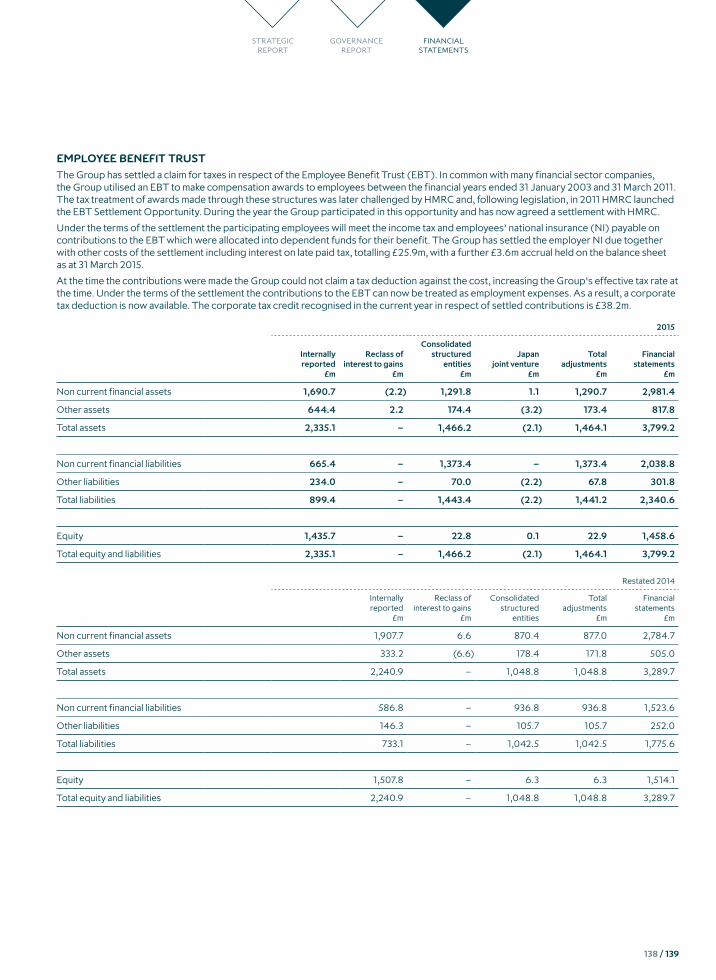
138 / 139
STRATEGIC REPORT
GOVERNANCE REPORT
FINANCIAL STATEMENTS
EMPLOYEE BENEFIT TRUST
The Group has settled a claim for taxes in respect of the Employee Benefit Trust (EBT). In common with many financial sector companies, the Group utilised an EBT to make compensation awards to employees between the financial years ended 31 January 2003 and 31 March 2011. The tax treatment of awards made through these structures was later challenged by HMRC and, following legislation, in 2011 HMRC launched the EBT Settlement Opportunity. During the year the Group participated in this opportunity and has now agreed a settlement with HMRC.
Under the terms of the settlement the participating employees will meet the income tax and employees’ national insurance (NI) payable on contributions to the EBT which were allocated into dependent funds for their benefit. The Group has settled the employer NI due together with other costs of the settlement including interest on late paid tax, totalling £25.9m, with a further £3.6m accrual held on the balance sheet as at 31 March 2015.
At the time the contributions were made the Group could not claim a tax deduction against the cost, increasing the Group’s effective tax rate at the time. Under the terms of the settlement the contributions to the EBT can now be treated as employment expenses. As a result, a corporate tax deduction is now available. The corporate tax credit recognised in the current year in respect of settled contributions is £38.2m.
2015
Internally reported
£m
Reclass of interest to gains
£m
Consolidatedstructured
entities £m
Japan joint venture
£m
Total adjustments
£m
Financial statements
£m
Non current financial assets 1,690.7 (2.2) 1,291.8 1.1 1,290.7 2,981.4
Other assets 644.4 2.2 174.4 (3.2) 173.4 817.8
Total assets 2,335.1 – 1,466.2 (2.1) 1,464.1 3,799.2
Non current financial liabilities 665.4 – 1,373.4 – 1,373.4 2,038.8
Other liabilities 234.0 – 70.0 (2.2) 67.8 301.8
Total liabilities 899.4 – 1,443.4 (2.2) 1,441.2 2,340.6
Equity 1,435.7 – 22.8 0.1 22.9 1,458.6
Total equity and liabilities 2,335.1 – 1,466.2 (2.1) 1,464.1 3,799.2
Restated 2014
Internally reported
£m
Reclass of interest to gains
£m
Consolidated structured
entities
Total adjustments
£m
Financial statements
£m
Non current financial assets 1,907.7 6.6 870.4 877.0 2,784.7
Other assets 333.2 (6.6) 178.4 171.8 505.0
Total assets 2,240.9 – 1,048.8 1,048.8 3,289.7
Non current financial liabilities 586.8 – 936.8 936.8 1,523.6
Other liabilities 146.3 – 105.7 105.7 252.0
Total liabilities 733.1 – 1,042.5 1,042.5 1,775.6
Equity 1,507.8 – 6.3 6.3 1,514.1
Total equity and liabilities 2,240.9 – 1,048.8 1,048.8 3,289.7

ICG ANNUAL REPORT & ACCOUNTS 2015
NOTES TO THE ACCOUNTSFOR THE YEAR ENDED 31 MARCH 2015 CONTINUED
7. BUSINESS AND GEOGRAPHICAL SEGMENTS CONTINUED
ANALYSIS OF NON CURRENT FINANCIAL ASSETS BY GEOGRAPHICAL SEGMENT
2015 £m
Restated 2014
£m
Europe 1,868.8 2,282.9
Asia Pacific 166.4 104.3
North America 946.2 397.5
2,981.4 2,784.7
GROUP REVENUE BY GEOGRAPHICAL SEGMENT
2015 £m
Restated 2014
£m
Europe 387.4 411.2
Asia Pacific 22.0 10.3
North America 16.8 42.0
426.2 463.5
8. FINANCE INCOME AND FINANCE COSTS
GROUP FINANCE INCOME2015
£m
Restated 2014
£m
Interest income recognised under the amortised cost method 184.1 196.7
Dividend income from equity investments 6.4 21.0
Interest on bank deposits 0.1 0.5
Net fair value movements on derivatives 2.7 –
193.3 218.2
Interest income recognised under the amortised cost method includes £1.0m (2014: £10.2m) accrued on impaired loans.
GROUP FINANCE COSTS2015
£m
Restated 2014
£m
Interest expense recognised under the amortised cost method 29.3 30.6
Interest expense recognised under FVTPL method 25.2 10.7
Net fair value movements on derivatives – 16.6
Arrangement and commitment fees 10.6 14.4
65.1 72.3

140 / 141
STRATEGIC REPORT
GOVERNANCE REPORT
FINANCIAL STATEMENTS
9. GAINS AND LOSSES ARISING ON INVESTMENTS
GAINS AND LOSSES ARISING ON AFS FINANCIAL ASSETS RECOGNISED IN OTHER COMPREHENSIVE INCOME
2015 £m
Restated 2014
£m
Realised gains on ordinary shares recycled to profit (18.0) (125.7)
Impairments of AFS financial assets recycled to profit 1.9 –
Net gains recycled to profit (16.1) (125.7)
Gains and losses arising on AFS financial assets
– Fair value movement on equity instruments (4.3) (2.3)
– Fair value movement on other assets 1.5 7.2
Foreign exchange (4.5) (6.8)
Losses arising in the AFS reserve in the year (7.3) (1.9)
GAINS AND LOSSES ARISING ON INVESTMENTS RECOGNISED IN THE INCOME STATEMENT
2015 £m
Restated 2014
£m
Realised gains on warrants 0.1 11.2
Realised gains on assets designated as FVTPL 17.8 20.0
Realised gains of AFS financial assets recycled from AFS reserves 18.0 125.7
Realised gains on other assets 0.3 0.3
36.2 157.2
Unrealised gains and losses on assets designated as FVTPL
– On equity instruments excluding those held within structured entities controlled by the Group 117.9 10.1
– On warrants (1.9) (6.3)
– In structured entities controlled by the Group (1.7) (4.6)
– On other assets (0.9) 4.9
113.4 4.1
Unrealised gains and losses on liabilities designated as FVTPL
– In structured entities controlled by the Group (7.4) 12.5
Realised gains and losses on liabilities designated as FVTPL
– In structured entities controlled by the Group (4.0) –
Fair value movements on FVTPL financial assets 138.2 173.8
Realised losses on amortised cost assets (0.3) (13.3)
Gains on investments 137.9 160.5

ICG ANNUAL REPORT & ACCOUNTS 2015
NOTES TO THE ACCOUNTSFOR THE YEAR ENDED 31 MARCH 2015 CONTINUED
10. IMPAIRMENT OF ASSETS
2015 £m
2014 £m
Impairment on loans and receivables
New and increased 51.1 116.7
Write off 2.4 16.9
Recoveries (15.9) (21.2)
Net impairment on loans and receivables 37.6 112.4
11. ADMINISTRATIVE EXPENSES
Administrative expenses include:2015
£m
Restated 2014
£m
Staff costs 103.5 66.5
Amortisation and depreciation 3.1 3.3
Operating lease expenses 4.4 3.8
Auditor’s remuneration 1.3 1.2
Staff costs include £17.6m of costs associated with the Employee Benefit Trust (EBT) settlement (see note 7).
Auditor remuneration includes fees for audit and non audit services payable to the Group’s and Company’s auditor, Deloitte LLP and are analysed as follows:
2015 £m
Restated 2014
£m
AUDIT FEES
Group audit of the annual accounts 0.5 0.4
The audit of subsidiaries annual accounts 0.4 0.4
Total audit fees 0.9 0.8
Non audit fees in capacity as auditors 0.1 0.1
OTHER NON AUDIT FEES
Taxation compliance services 0.1 0.1
Other taxation advisory services 0.1 0.2
Other non audit services not covered above 0.1 –
Total other non audit fees 0.3 0.3
Total auditor’s remuneration 1.3 1.2
Details of the Company’s policy on the use of auditors for non-audit services, the reasons the auditor was used rather than another supplier and how the auditor’s independence and objectivity was safeguarded are set out in the Corporate Governance report on page 66. No services were provided pursuant to contingent fee arrangements.

142 / 143
STRATEGIC REPORT
GOVERNANCE REPORT
FINANCIAL STATEMENTS
12. EMPLOYEES AND DIRECTORS
2015 £m
2014 £m
Directors’ emoluments 3.1 3.2
Employee costs during the year including Directors:
Wages and salaries 78.1 61.5
Social security costs 23.4 3.3
Pension costs 2.0 1.7
103.5 66.5
The average number of employees (including Directors) was:
2015 2014
Investment Executives 120 102
Infrastructure 103 90
Directors 3 3
226 195
The performance related element included in wages and salaries is £49.5m (2014: £36.2m) which is derived as a result of the annual bonus scheme, Omnibus Scheme and the Balance Sheet Carry Scheme.
Social security costs include £17.6m associated with the Employee Benefit Trust (EBT) settlement (see note 7).
13. TAX EXPENSE
Analysis of tax on ordinary activities2015
£m
Restated 2014
£m
Current tax
Current year 23.0 31.6
Prior year adjustment to current tax – EBT settlement (38.2) –
Prior year adjustment to current tax – other (14.7) (3.5)
(29.9) 28.1
Deferred taxation
Current year 16.5 (5.4)
Prior year adjustment 1.3 (1.2)
17.8 (6.6)
Tax (credit)/charge on profit on ordinary activities (12.1) 21.5

ICG ANNUAL REPORT & ACCOUNTS 2015
NOTES TO THE ACCOUNTSFOR THE YEAR ENDED 31 MARCH 2015 CONTINUED
13. TAX EXPENSE CONTINUED
2015 £m
2014 £m
Profit on ordinary activities before tax 178.5 164.4
Profit before tax multiplied by the rate of corporation tax in the UK of 21% (2014: 23%) 37.5 37.8
Effects of:
Non deductible expenditure 9.9 3.5
Non taxable income (5.0) –
Current year risk provision (credit)/charge – current tax 2.9 (8.6)
Prior year adjustment to risk provision – deferred tax (3.0) –
Prior year adjustment to deferred tax 4.3 (1.2)
Changes in statutory tax rates (1.1) (0.5)
Overseas tax rates (4.7) (6.0)
Prior year adjustment to current tax – EBT settlement (38.2) –
Prior year adjustment to current tax – other (14.7) (3.5)
Current tax (credit)/charge for the year (12.1) 21.5
The current year tax charge is lower than the standard rate of corporation tax of 21%. This is principally due to a prior year adjustment credit of £38.2m relating to the corporate tax refund received on settlement of the EBT enquiry. The tax charge for the prior year was lower than the standard rate of corporation tax of 23%. This was principally due to the reduction in tax risk provisions of £8.6m and a difference of £4.9m between overseas and UK tax rates.
14. DIVIDENDS
2015 2014
Per share pence £m
Per share pence £m
Ordinary dividends paid
Final 14.4 55.5 13.7 52.8
Interim 6.9 25.5 6.6 25.4
21.3 81.0 20.3 78.2
The proposed final ordinary dividend for the year ended 31 March 2015 is 15.1 pence per share (2014: 14.4 pence per share), which will amount to £54.9m (2014: £55.5m). Of the £81.0m (2014: £78.2m) of dividends paid, £0.4m dividends were reinvested under the dividend reinvestment plan that was offered to shareholders (2014: £0.1m).
In addition to the final ordinary dividend, the Directors recommend a special dividend of £300m, which will amount to 82.6p pence per share.
15. EARNINGS PER SHARE
Earnings2015
£m
Restated2014
£m
Earnings for the purposes of basic and diluted earnings per share being net profit attributable to equity holders of the Parent 189.3 142.3
Number of shares 2015 2014
Weighted average number of ordinary shares for the purposes of basic earnings per share 376,175,974 384,828,814
Effect of dilutive potential ordinary shares share options 37,402 135,969
Weighted average number of ordinary shares for the purposes of diluted earnings per share 376,213,376 384,964,783
Earnings per share (EPS) 50.3p 37.0p
Diluted earnings per share 50.3p 37.0p

144 / 145
STRATEGIC REPORT
GOVERNANCE REPORT
FINANCIAL STATEMENTS
16. INTANGIBLE ASSETS
Goodwill
Investment Management
Contract Total
Group2015
£m2014
£m2015
£m2014
£m2015
£m2014
£m
Cost
At 1 April 4.3 4.3 5.1 5.1 9.4 9.4
Additions – – 2.1 – 2.1 –
At 31 March 4.3 4.3 7.2 5.1 11.5 9.4
Amortisation and impairment losses
At 1 April – – 3.7 2.8 3.7 2.8
Charge for the year – – 1.0 0.9 1.0 0.9
At 31 March – – 4.7 3.7 4.7 3.7
Net book value at 31 March 4.3 4.3 2.5 1.4 6.8 5.7
Investment Management
Contract
Company2015
£m2014
£m
Cost
At 1 April – –
Additions 1.6 –
At 31 March 1.6 –
Amortisation and impairment losses
At 1 April – –
Charge for the year 0.2 –
At 31 March 0.2 –
Net book value at 31 March 1.4 –
In December 2010, the Group acquired a 51% equity interest in Longbow Real Estate Capital LLP for a consideration of £4.3m. There were no identifiable assets or liabilities acquired, resulting in goodwill of £4.3m. This is assessed annually for impairment. Also in December 2010, Intermediate Capital Managers Limited, a subsidiary company, paid €5.9m (£5.1m) to acquire an investment management contract from Resource Europe.
In May 2014, Intermediate Capital Managers Limited paid £0.5m to acquire an investment management contract from Credos Capital Management LLP to support its Alternative Credit strategy. This was followed, in December 2014 by Intermediate Capital Group plc paying $2.5m (£1.6m) to acquire an investment management contract from Newglobe Capital Partners LLP to support its PE Secondaries strategy.
Amortisation is charged to the Statement of Comprehensive Income, included in operating expenses, on a straight-line basis over the estimated useful life of the fund management contract, typically three to five years.

ICG ANNUAL REPORT & ACCOUNTS 2015
NOTES TO THE ACCOUNTSFOR THE YEAR ENDED 31 MARCH 2015 CONTINUED
17. PROPERTY, PLANT AND EQUIPMENT
Group Company
2015 £m
2014 £m
2015 £m
2014 £m
Furniture and equipment
Cost
At 1 April 14.7 12.0 12.8 10.6
Additions 3.7 2.7 3.5 2.2
Disposals (0.1) – – –
At 31 March 18.3 14.7 16.3 12.8
Depreciation
At 1 April 11.1 9.1 9.8 7.8
Charge for the year 1.7 2.0 1.6 2.0
Depreciation on disposals (0.1) – – –
At 31 March 12.7 11.1 11.4 9.8
Net book value 5.6 3.6 4.9 3.0
Short leasehold premises
Cost
At 1 April 5.5 5.5 4.2 4.2
Additions 0.1 – 0.1 –
At 31 March 5.6 5.5 4.3 4.2
Depreciation
At 1 April 4.2 3.8 3.5 3.1
Charge for the year 0.4 0.4 0.4 0.4
At 31 March 4.6 4.2 3.9 3.5
Net book value 1.0 1.3 0.4 0.7
Total net book value 6.6 4.9 5.3 3.7
18. NON CONTROLLING INTERESTS
The Group has consolidated the following companies which have non controlling interests:
2015Restated
2014
% Non controlling
interest £m
% Non controlling
interest £m
Longbow Real Estate Capital LLP – – 49% (0.1)
LREC Partners Investments No.2 Ltd 41% 0.3 41% –
US CLO 2014-2 44% – – –
US CLO 2014-3 49% – – –
St Paul's CLO II 66% – 66% –
St Paul's CLO III 51% – 51% –
ICG European Loan Fund 10% 1.3 34% 4.8
ICG High Yield Bond Fund 13% 0.6 – –
At 31 March 2.2 4.7

146 / 147
STRATEGIC REPORT
GOVERNANCE REPORT
FINANCIAL STATEMENTS
2015 £m
Restated 2014
£m
Profit retained for the year 1.3 0.6
Non controlling interests recycled to retained earnings (0.5) –
0.8 0.6
On 1 October 2014, the Group acquired the remaining 49% of Longbow Real Estate Capital LLP, thereby giving it 100% of the equity of the UK real estate debt specialist. Cash consideration of £14.0m was paid on acquisition with a further £23.9m recognised as the fair value of contingent consideration. The contingent consideration arrangement is based on a multiple of adjusted net income as at 31 March 2016, less the £14.0m paid to acquire the 49% equity holding. The fair value of the contingent consideration, being the estimate of what will be paid, at the date of acquisition was based on management projections of the adjusted net income as at 31 March 2016, discounted back to present day.
Any movement in the fair value of the contingent consideration resulting from events after the balance sheet date will be recognised through the income statement. The final amount paid may be greater or lesser than the amount currently provided.
The difference between the estimated consideration of £37.9m and the fair value of the non controlling interest at the date of acquisition of £0.5m, was £37.4m. This amount has been charged to retained earnings.
19. FINANCIAL ASSETS – NON CURRENT
Group Company
2015 £m
Restated 2014
£m2015
£m2014
£m
Loans and receivables held at amortised cost 625.1 1,037.2 404.0 713.6
Investment in subsidiaries – – 612.6 436.5
AFS financial assets held at fair value 158.3 208.0 50.6 51.4
Financial assets designated as FVTPL 1,715.6 1,166.0 313.5 263.0
Associates designated as FVTPL 467.5 355.0 – –
Investments in equity accounted joint ventures 1.1 – – –
Derivative financial instruments held at fair value – warrants 13.8 18.5 8.4 6.0
2,981.4 2,784.7 1,389.1 1,470.5
Other derivative financial instruments held at fair value 15.6 6.2 15.3 5.8
2,997.0 2,790.9 1,404.4 1,476.3
Included within associates designated as FVTPL are £112.0m (2014: £123.0m) and £355.5m (2014: £232.0m) relating to the Group’s 20% investment in ICG Europe Fund V Limited and ICG North America Private Debt Fund.
Included within financial assets designated as FVTPL is £57.4m (2014: £25.9m) related to the Group’s joint venture investments in Via Location and Parkeon and £1,499.1m (2014: £1,049.5m) relating to the structured entities controlled by the Group.
The movement in AFS financial assets during the year is set out below:
Group Company
AFS financial assets2015
£m2014
£m2015
£m2014
£m
Balance at 1 April 208.0 325.4 51.4 43.7
Realised gains recycled to the income statement (18.0) (125.7) (2.1) (10.5)
Unrealised (losses)/gains (3.0) 4.8 6.2 11.4
Purchases 2.0 19.7 2.0 11.3
Realisations (21.5) (18.5) (0.7) (3.9)
Conversion debt to equity – 3.3 – 0.2
Exercise of options – 19.0 – –
Foreign exchange (9.2) (20.0) (6.2) (0.8)
Balance at 31 March 158.3 208.0 50.6 51.4

ICG ANNUAL REPORT & ACCOUNTS 2015
NOTES TO THE ACCOUNTSFOR THE YEAR ENDED 31 MARCH 2015 CONTINUED
20. TRADE AND OTHER RECEIVABLES
Group Company
2015 £m
Restated 2014
£m2015
£m2014
£m
Other receivables 108.5 64.1 28.3 21.7
Amount owed by Group companies – – 469.5 439.0
Prepayments 19.3 20.5 5.9 8.8
127.8 84.6 503.7 469.5
21. FINANCIAL ASSETS – CURRENT
Group Company
2015 £m
2014 £m
2015 £m
2014 £m
Loans and investments held for sale 243.9 115.8 169.4 115.8
Other derivative financial instruments held at fair value 11.3 12.8 10.7 12.8
255.2 128.6 180.1 128.6
22. CALLED UP SHARE CAPITAL AND OWN SHARES RESERVE
Group and Company2015
£m2014
£m
Allotted, called up and fully paid
402,804,840 (2014: 402,242,770) ordinary shares of 20p 80.6 80.4
The own share reserve represents the cost of shares in ICG plc purchased in the market and held by the EBT to hedge future liabilities arising under long term incentive plans. In addition, the own share reserve includes 22,586,197 shares purchased for £97.6m by ICG plc through its £100m share buy back. The movement in the year is as follows:
Group2015
£m2014
£m2015
Number2014
Number
At 1 April 62.4 45.7 17,455,342 15,689,104
Purchased 126.0 35.4 29,402,938 7,831,555
Options/awards exercised (26.4) (18.7) (7,271,288) (6,065,317)
As at 31 March 162.0 62.4 39,586,992 17,455,342
The number of shares held by the Group at the balance sheet date represented 9.8% (2014: 4.3%) of the parent Company’s allotted, called up and fully paid share capital.

148 / 149
STRATEGIC REPORT
GOVERNANCE REPORT
FINANCIAL STATEMENTS
23. PROVISIONS
Group and Company
Onerous lease
£m
At 1 April 2014 3.6
Utilisation of provision (0.5)
Unwinding of discount 0.1
As at 31 March 2015 3.2
The provisions are expected to mature in the following time periods:
Group and Company2015
£m2014
£m
Less than one year 0.6 0.4
One to five years 2.6 2.3
Greater than five years – 0.9
Total greater than one year 2.6 3.2
As at 31 March 3.2 3.6
The Group holds onerous lease provisions of £3.2m (2014: £3.6m) against certain leaseholds in connection with surplus space. The provision for these onerous lease contracts has been made taking into account residual lease commitments, other outgoings and sub-letting arrangements. It is envisaged that the provisions will be utilised on an even basis until 2021.
24. FINANCIAL LIABILITIES
2015 2014
GroupCurrent
£mNon current
£mCurrent
£mNon current
£m
Liabilities held at amortised cost:
– Private placements 15.1 286.5 – 283.9
– Listed notes and bonds – 325.1 – 153.5
– Unsecured bank debt – 19.9 – 19.8
– Secured bank debt 25.8 – – 9.3
– Floating rate secured notes – 33.9 – 120.3
Liabilities held at FVTPL:
– Structured entities controlled by the Group – 1,373.4 – 936.8
40.9 2,038.8 – 1,523.6
The floating rate notes are secured on the debt portfolio of a subsidiary company, Intermediate Finance II plc. The assets of the structured entities controlled by the Group are shown with financial assets (see note 19). The net exposure on the Group’s balance sheet is £125.9m (2014: £112.7m).
2015 2014
CompanyCurrent
£mNon current
£mCurrent
£mNon current
£m
Liabilities held at amortised cost:
– Private placements 15.1 286.5 – 283.9
– Listed notes and bonds – 325.1 – 153.5
– Unsecured bank debt – 19.9 – 19.8
15.1 631.5 – 457.2

ICG ANNUAL REPORT & ACCOUNTS 2015
NOTES TO THE ACCOUNTSFOR THE YEAR ENDED 31 MARCH 2015 CONTINUED
25. TRADE AND OTHER PAYABLES
Group Company
2015 £m
Restated 2014
£m2015
£m2014
£m
Trade payables 3.3 3.6 2.6 1.8
Accruals 198.5 189.3 83.4 70.5
Amounts owed to Group companies – – 196.9 259.0
Social security tax 7.0 1.1 6.8 1.0
208.8 194.0 289.7 332.3
Included within accruals are £71.1m (2014: £107.4m) relating to structured entities controlled by the Group and £23.9m contingent consideration recognised on the acquisition of the remaining 49% interest in Longbow Real Estate Capital.
26. DEFERRED TAX
RestatedGroup
Other derivatives
£m
Warrants and investments
£m
Remuneration deductible
as paid £m
Other temporary
differences £m
Total £m
At 31 March 2013 13.7 52.5 (13.5) (0.3) 52.4
Prior year adjustment 0.1 0.4 (1.4) (0.3) (1.2)
Reclassification from current tax – – – 6.1 6.1
Credit to equity – (30.9) – – (30.9)
(Credit)/charge to income (4.0) (1.7) (3.8) 4.1 (5.4)
At 31 March 2014 9.8 20.3 (18.7) 9.6 21.0
Prior year adjustment – (3.0) 5.7 (0.2) 2.5
Prior year adjustment – rate change (0.5) (0.7) 0.9 (0.9) (1.2)
Credit to equity – (4.9) – – (4.9)
(Credit)/charge to income (1.0) 11.2 0.1 6.2 16.5
At 31 March 2015 8.3 22.9 (12.0) 14.7 33.9
Company
Other derivatives
£m
Warrants and investments
£m
Remuneration deductible
as paid £m
Other temporary
differences £m
Total £m
At 31 March 2013 13.7 3.1 (7.7) (0.8) 8.3
Prior year adjustment 0.1 – (0.2) 0.1 –
Credit to equity – (0.1) – – (0.1)
(Credit)/charge to income (4.0) (2.0) (2.3) 3.3 (5.0)
At 31 March 2014 9.8 1.0 (10.2) 2.6 3.2
Prior year adjustment – (3.0) 2.9 (0.1) (0.2)
Prior year adjustment – rate change (0.5) (0.1) 0.5 – (0.1)
Charge to equity – 0.5 – – 0.5
(Credit)/charge to income (1.0) 8.0 0.3 0.1 7.4
At 31 March 2015 8.3 6.4 (6.5) 2.6 10.8
Deferred tax has been accounted for at the substantively enacted corporation tax rate of 20% (2014: 21%).
As at 31 March 2015 the value of losses unrecognised for deferred tax is nil.

150 / 151
STRATEGIC REPORT
GOVERNANCE REPORT
FINANCIAL STATEMENTS
27. SHARE BASED PAYMENTS
All share based payment transactions are equity settled. The total charge to the income statement for the year was £16.3m (2014: £12.2m) and this was credited to the share based payments reserve in equity.
INTERMEDIATE CAPITAL GROUP PLC 2001 APPROVED AND UNAPPROVED EXECUTIVE SHARE OPTION SCHEME
All options under the Intermediate Capital Group plc 2001 scheme have vested, no new options will be awarded as the scheme is now closed. Analysis of movements in the number and weighted average exercise price of options is set out below:
NumberWeighted average exercise price (£)
2015 2014 2015 2014
Outstanding at 1 April 2,003,945 2,606,539 4.44 4.51
Forfeited (344,156) (418,496) 4.71 5.10
Exercised (498,067) (184,098) 3.97 4.59
Outstanding at 31 March 1,161,722 2,003,945 4.57 4.44
Of which are currently exercisable 843,521 360,389 4.18 2.74
The weighted average remaining contractual life is 1.68 years (2014: 2.00 years).
Exercise price 2015 Number 2014 Number
£2.230 169,291 246,317
£2.947 25,601 25,601
£6.008 181,439 181,439
£4.844 560,158 591,122
£5.048 136,762 136,762
£4.286 – 447,291
£4.101 88,471 88,471
£4.731 – 263,691
£4.729 – 23,251
1,161,722 2,003,945
INTERMEDIATE CAPITAL GROUP PLC OMNIBUS PLAN
Details of all the different types of awards under the Omnibus Plan are provided in the Directors’ Remuneration Report on pages 76 to 97.
Share awards outstanding under the Omnibus Plan were as follows:
NumberWeighted average
fair value (£)
Deferred Share Awards 2015 2014 2015 2014
Outstanding at 1 April 736,279 863,224 3.56 2.74
Granted 830,887 338,300 4.38 4.56
Vested (393,491) (464,245) 3.26 2.76
Forfeited (115,895) (1,000) 3.74 3.34
Outstanding at 31 March 1,057,780 736,279 4.20 3.56
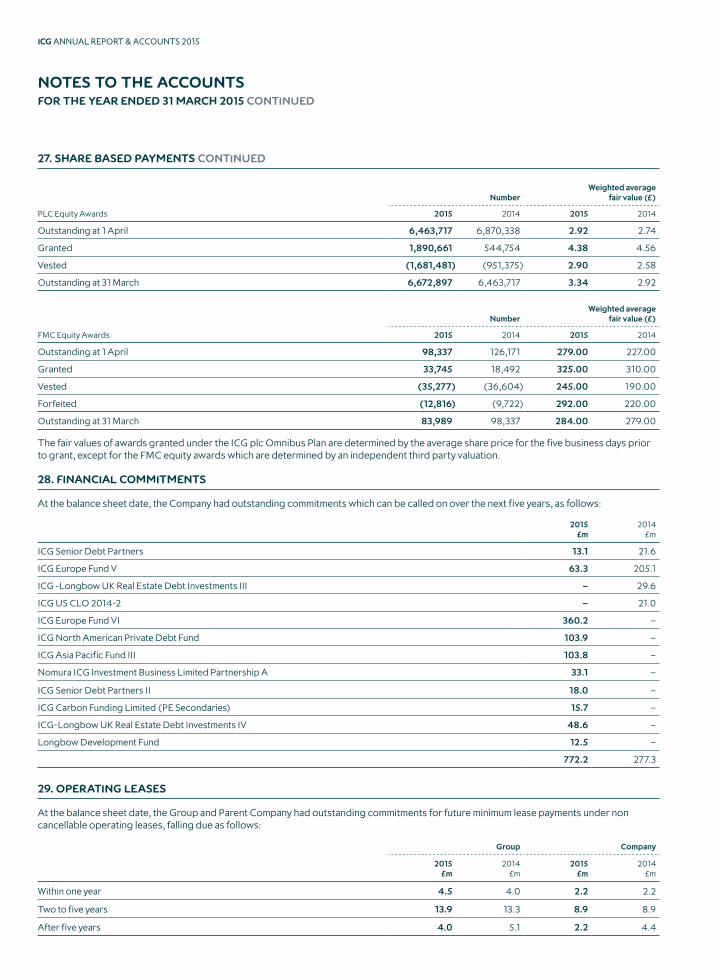
ICG ANNUAL REPORT & ACCOUNTS 2015
NOTES TO THE ACCOUNTSFOR THE YEAR ENDED 31 MARCH 2015 CONTINUED
27. SHARE BASED PAYMENTS CONTINUED
NumberWeighted average
fair value (£)
PLC Equity Awards 2015 2014 2015 2014
Outstanding at 1 April 6,463,717 6,870,338 2.92 2.74
Granted 1,890,661 544,754 4.38 4.56
Vested (1,681,481) (951,375) 2.90 2.58
Outstanding at 31 March 6,672,897 6,463,717 3.34 2.92
NumberWeighted average
fair value (£)
FMC Equity Awards 2015 2014 2015 2014
Outstanding at 1 April 98,337 126,171 279.00 227.00
Granted 33,745 18,492 325.00 310.00
Vested (35,277) (36,604) 245.00 190.00
Forfeited (12,816) (9,722) 292.00 220.00
Outstanding at 31 March 83,989 98,337 284.00 279.00
The fair values of awards granted under the ICG plc Omnibus Plan are determined by the average share price for the five business days prior to grant, except for the FMC equity awards which are determined by an independent third party valuation.
28. FINANCIAL COMMITMENTS
At the balance sheet date, the Company had outstanding commitments which can be called on over the next five years, as follows:
2015 £m
2014 £m
ICG Senior Debt Partners 13.1 21.6
ICG Europe Fund V 63.3 205.1
ICG -Longbow UK Real Estate Debt Investments III – 29.6
ICG US CLO 2014-2 – 21.0
ICG Europe Fund VI 360.2 –
ICG North American Private Debt Fund 103.9 –
ICG Asia Pacific Fund III 103.8 –
Nomura ICG Investment Business Limited Partnership A 33.1 –
ICG Senior Debt Partners II 18.0 –
ICG Carbon Funding Limited (PE Secondaries) 15.7 –
ICG-Longbow UK Real Estate Debt Investments IV 48.6 –
Longbow Development Fund 12.5 –
772.2 277.3
29. OPERATING LEASES
At the balance sheet date, the Group and Parent Company had outstanding commitments for future minimum lease payments under non cancellable operating leases, falling due as follows:
Group Company
2015 £m
2014 £m
2015 £m
2014 £m
Within one year 4.5 4.0 2.2 2.2
Two to five years 13.9 13.3 8.9 8.9
After five years 4.0 5.1 2.2 4.4
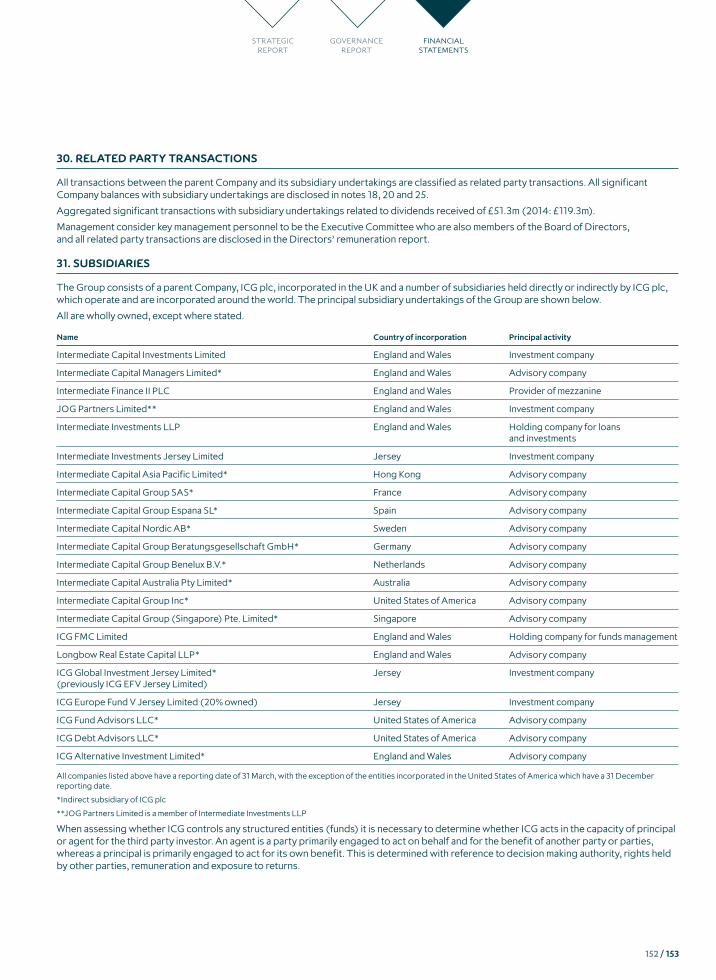
152 / 153
STRATEGIC REPORT
GOVERNANCE REPORT
FINANCIAL STATEMENTS
30. RELATED PARTY TRANSACTIONS
All transactions between the parent Company and its subsidiary undertakings are classified as related party transactions. All significant Company balances with subsidiary undertakings are disclosed in notes 18, 20 and 25.
Aggregated significant transactions with subsidiary undertakings related to dividends received of £51.3m (2014: £119.3m).
Management consider key management personnel to be the Executive Committee who are also members of the Board of Directors, and all related party transactions are disclosed in the Directors’ remuneration report.
31. SUBSIDIARIES
The Group consists of a parent Company, ICG plc, incorporated in the UK and a number of subsidiaries held directly or indirectly by ICG plc, which operate and are incorporated around the world. The principal subsidiary undertakings of the Group are shown below.
All are wholly owned, except where stated.
Name Country of incorporation Principal activity
Intermediate Capital Investments Limited England and Wales Investment company
Intermediate Capital Managers Limited* England and Wales Advisory company
Intermediate Finance II PLC England and Wales Provider of mezzanine
JOG Partners Limited** England and Wales Investment company
Intermediate Investments LLP England and Wales Holding company for loans and investments
Intermediate Investments Jersey Limited Jersey Investment company
Intermediate Capital Asia Pacific Limited* Hong Kong Advisory company
Intermediate Capital Group SAS* France Advisory company
Intermediate Capital Group Espana SL* Spain Advisory company
Intermediate Capital Nordic AB* Sweden Advisory company
Intermediate Capital Group Beratungsgesellschaft GmbH* Germany Advisory company
Intermediate Capital Group Benelux B.V.* Netherlands Advisory company
Intermediate Capital Australia Pty Limited* Australia Advisory company
Intermediate Capital Group Inc* United States of America Advisory company
Intermediate Capital Group (Singapore) Pte. Limited* Singapore Advisory company
ICG FMC Limited England and Wales Holding company for funds management
Longbow Real Estate Capital LLP* England and Wales Advisory company
ICG Global Investment Jersey Limited* (previously ICG EFV Jersey Limited)
Jersey Investment company
ICG Europe Fund V Jersey Limited (20% owned) Jersey Investment company
ICG Fund Advisors LLC* United States of America Advisory company
ICG Debt Advisors LLC* United States of America Advisory company
ICG Alternative Investment Limited* England and Wales Advisory company
All companies listed above have a reporting date of 31 March, with the exception of the entities incorporated in the United States of America which have a 31 December reporting date.
*Indirect subsidiary of ICG plc
**JOG Partners Limited is a member of Intermediate Investments LLP
When assessing whether ICG controls any structured entities (funds) it is necessary to determine whether ICG acts in the capacity of principal or agent for the third party investor. An agent is a party primarily engaged to act on behalf and for the benefit of another party or parties, whereas a principal is primarily engaged to act for its own benefit. This is determined with reference to decision making authority, rights held by other parties, remuneration and exposure to returns.

ICG ANNUAL REPORT & ACCOUNTS 2015
NOTES TO THE ACCOUNTSFOR THE YEAR ENDED 31 MARCH 2015 CONTINUED
31. SUBSIDIARIES CONTINUED
The table below shows details of structured entities that the Group is deemed to control:
Name of subsidiary Country of incorporation
% of ownership interests and voting rights
2015
US CLO 2014-1 United States of America 100.00%
US CLO 2014-2 United States of America 56.00%
US CLO 2014-3 United States of America 51.30%
St Paul's CLO II (i) Ireland 33.90%
St Paul's CLO III (ii) Ireland 49.40%
ICG European Loan Fund Ireland 90.00%
ICG High Yield Bond Fund Ireland 87.00%
ICG Global Total Credit Fund Ireland 100.00%
(i)/(ii) The Capital Requirements Directive requires the originator of any securitisation transaction to hold a minimum 5% of the net economic exposure of the transaction. At issuance ICG held (i) 34.56% of St Paul’s CLO II and (ii) was the largest individual shareholder of St Paul’s CLO III, with nine other non connected shareholders. The kick out rights of third party shareholders are protective in nature as they result from a breach of contract, and are therefore not indicative of an agent relationship. ICG is also the collateral manager and as a result management has concluded that ICG is acting as principal.
There are no significant restrictions on the ability of the group to access or use assets and settle liabilities of its subsidiary holdings.
ICG has not provided contractual or non contractual financial or other support to a consolidated structured entity during the period. It is not the current intention to provide such support, including the intention to assist the structured entity in obtaining financial support.
32. ASSOCIATES AND JOINT VENTURES
ICG’s investment strategy is to invest across a range of funds and investments. In assessing whether ICG controls any individual fund it is necessary to determine whether ICG acts in the capacity of principal or agent for the third party investors. An agent is a party primarily engaged to act on behalf and for the benefit of another party or parties, whereas a principal is primarily engaged to act for its own benefit. This is determined with reference to decision making authority, rights held by other parties, remuneration and exposure to returns. The process for assessing control of portfolio companies is detailed in the accounting policies note.
As such, depending on the fundraising or investment in a company’s capital structure, ICG could end up with significant influence and such entities would be considered either associates or joint ventures.
The nature of some of the activities of ICG plc’s associates and joint ventures are investment related which are seen as complementing the Group’s operations and contributing to achieving the Group’s overall strategy. The remaining associates and joint ventures are portfolio companies not involved in investment activities.
DETAILS OF ASSOCIATES AND JOINT VENTURES
Details of each of the Group’s associates at the end of the reporting period are as follows:
Name of associate Principal activity Country of incorporation
Proportion of ownership interest/voting rights
held by the Group2015
Longbow UK Real Estate Debt Investment II Real Estate Fund England and Wales 20.00%
Gaucho Holdings Limited (i) Restaurant group England and Wales 11.67%
Gerflor Group (ii) Manufacturer of PVC flooring France 19.50%
Interbest Holding BV Roadside advertising masts Netherlands 33.82%
ICG Europe Fund V Jersey Limited (iii) Investment company Jersey 20.00%
ICG Total Credit Fund (iv) Credit Fund Ireland 37.90%
ICG North American Private Debt Fund (v) Mezzanine Fund United States of America 20.00%
All associates are accounted for at fair value in accordance with the Group’s accounting policy as outlined in note 3 to the financial statements.

154 / 155
STRATEGIC REPORT
GOVERNANCE REPORT
FINANCIAL STATEMENTS
Notes
(i) 11.67% represents ICG’s holding in ordinary shares following the restructuring of the Gaucho Group in May 2014. Pre-restructuring ICG held both Senior and Junior Loan notes and A ordinary shares that did not confer any voting rights and therefore did not meet the criteria for an associate. The principal purpose of the restructuring was to incentivise Gaucho management to grow the business. Following the restructuring ICG now holds fewer Senior Loan Notes, A ordinary shares and B1 shares that confer voting rights. ICG has the power to participate in the financial and operating decisions of the Company as it holds two of the six Board seats and may serve an underperformance notice on the Company if at any time financial targets are not met.
(ii) 19.50% represents ICG’s holding in ordinary shares in Gerflor Group. One ICG employee is appointed to the four member supervisory board of Gerflor on behalf of the Group and third party funds and therefore ICG has the power to participate in the financial and operating decisions of the Company.
(iii) Through a co-investment structure ICG has a 20% shareholding in ICG Europe Fund V Jersey Limited. ICG appoints the General Partner (GP) to the fund however the investors have substantive rights to remove the GP without cause by Special Investor Consent, which would only require 8% of investors. The Fund also has an Advisory Council, nominated by the investors, whose function is to ensure that the GP is acting in the interest of investors. The Advisory Council could influence investors to invoke Special Investor Consent and remove the GP, and as such ICG acts in the capacity of agent. However as ICG has a 20% holding and therefore significant influence in this entity it has been considered an associate.
(iv) The fund manager can be removed without cause by only three investors who together hold more than 55% of the issued units. Although this would indicate an agent relationship, as ICG has a 37.9% interest in this entity it has been considered an associate.
(v) Through a co-investment structure ICG has a 20% shareholding in ICG North American Private Debt Fund. ICG appoints the GP to the fund and although the investors’ rights to remove the GP are only protective in nature the Advisory Committee has power in the case of conflicts of interest to ensure that ICG is acting on behalf of investors. The Advisory Committee can also waive the limitations within the Limited Partnership Agreement which could significantly impact the variable returns and, as such, ICG acts in the capacity of agent. However as ICG has a 20% holding and therefore significant influence in this entity it has been considered an associate.
During the year ICG Group received income distributions of £18.6m via the ICG Europe Fund V co-investment structure.
CHANGE IN THE GROUP’S OWNERSHIP INTEREST IN AN ASSOCIATE
Up to the date of its restructuring Gaucho was accounted for as a financial asset at fair value through the profit and loss. Following the restructuring the asset is accounted for as an associate measured at fair value in accordance with the Group’s accounting policy as outlined in note 3 to the financial statements. There has been no impact on the overall financial performance of the Group.
There were no other changes in the Group’s ownership interests in an associate.
Details of each of the Group’s joint ventures at the end of the reporting period are as follows:
Name of Joint Venture Principal activity Country of incorporation
Proportion of ownership interest/voting rights
held by the Group2015
Nomura ICG KK Advisory company Japan 50.00%
Parkeon (vi)Parking and transport ticketing solutions France 52.60%
Via Location (vii) Truck rental company France 58.40%
Viadom Home services France 50.00%
Nomura ICG KK is equity accounted as a joint venture in accordance with IFRS 11. Parkeon, Via Location and Viadom are accounted for at fair value in accordance with the Group’s accounting policy in note 3 to the financial statements. ICG’s policy is to fair value investments in a portfolio company on a consistent basis with all other portfolio assets regardless of their classification in the financial statements. Nomura ICG KK is not a portfolio company and was established to operate the Group’s core business of fund management activities in Japan. Management therefore consider it more appropriate to equity account for this entity in the financial statements.
(vi) Although ICG holds 52.60% of the ordinary shares it does not solely control Parkeon. The management company of the group is jointly controlled by one of the ICG mezzanine funds, which ICG does not control, and therefore ICG is unable to execute any decision without the consent of this entity.
(vii) Although ICG holds 58.40% of the ordinary shares it does not solely control Via Location as control of the company is via the Supervisory Board and this control is jointly held with one of the ICG mezzanine funds, which ICG does not control.
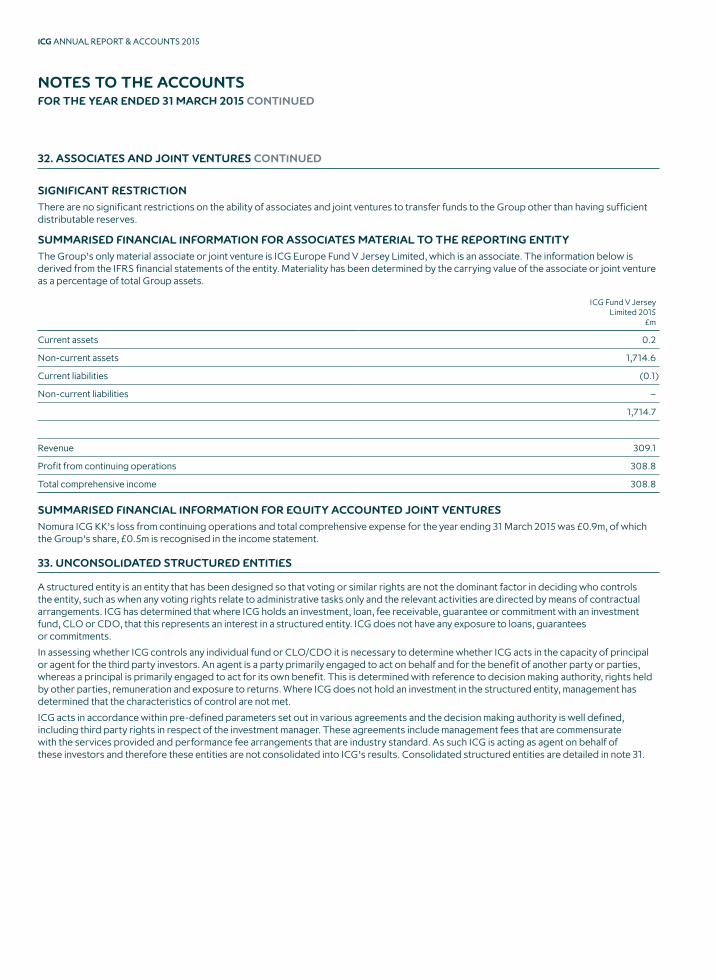
ICG ANNUAL REPORT & ACCOUNTS 2015
NOTES TO THE ACCOUNTSFOR THE YEAR ENDED 31 MARCH 2015 CONTINUED
32. ASSOCIATES AND JOINT VENTURES CONTINUED
SIGNIFICANT RESTRICTION
There are no significant restrictions on the ability of associates and joint ventures to transfer funds to the Group other than having sufficient distributable reserves.
SUMMARISED FINANCIAL INFORMATION FOR ASSOCIATES MATERIAL TO THE REPORTING ENTITY
The Group’s only material associate or joint venture is ICG Europe Fund V Jersey Limited, which is an associate. The information below is derived from the IFRS financial statements of the entity. Materiality has been determined by the carrying value of the associate or joint venture as a percentage of total Group assets.
ICG Fund V Jersey Limited 2015
£m
Current assets 0.2
Non-current assets 1,714.6
Current liabilities (0.1)
Non-current liabilities –
1,714.7
Revenue 309.1
Profit from continuing operations 308.8
Total comprehensive income 308.8
SUMMARISED FINANCIAL INFORMATION FOR EQUITY ACCOUNTED JOINT VENTURES
Nomura ICG KK’s loss from continuing operations and total comprehensive expense for the year ending 31 March 2015 was £0.9m, of which the Group’s share, £0.5m is recognised in the income statement.
33. UNCONSOLIDATED STRUCTURED ENTITIES
A structured entity is an entity that has been designed so that voting or similar rights are not the dominant factor in deciding who controls the entity, such as when any voting rights relate to administrative tasks only and the relevant activities are directed by means of contractual arrangements. ICG has determined that where ICG holds an investment, loan, fee receivable, guarantee or commitment with an investment fund, CLO or CDO, that this represents an interest in a structured entity. ICG does not have any exposure to loans, guarantees or commitments.
In assessing whether ICG controls any individual fund or CLO/CDO it is necessary to determine whether ICG acts in the capacity of principal or agent for the third party investors. An agent is a party primarily engaged to act on behalf and for the benefit of another party or parties, whereas a principal is primarily engaged to act for its own benefit. This is determined with reference to decision making authority, rights held by other parties, remuneration and exposure to returns. Where ICG does not hold an investment in the structured entity, management has determined that the characteristics of control are not met.
ICG acts in accordance within pre-defined parameters set out in various agreements and the decision making authority is well defined, including third party rights in respect of the investment manager. These agreements include management fees that are commensurate with the services provided and performance fee arrangements that are industry standard. As such ICG is acting as agent on behalf of these investors and therefore these entities are not consolidated into ICG’s results. Consolidated structured entities are detailed in note 31.
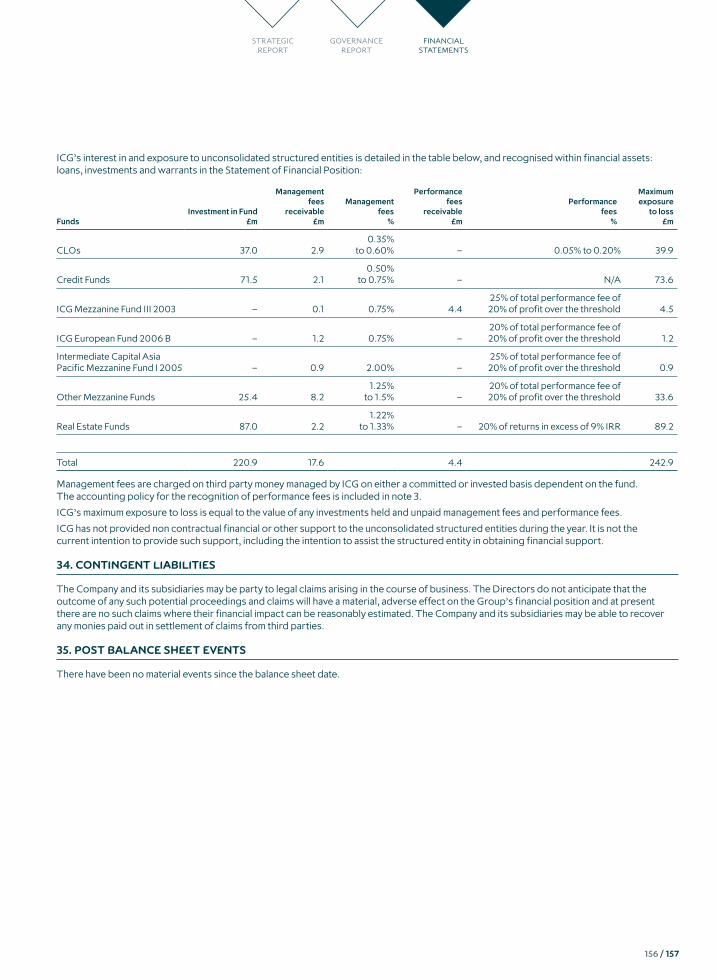
156 / 157
STRATEGIC REPORT
GOVERNANCE REPORT
FINANCIAL STATEMENTS
ICG’s interest in and exposure to unconsolidated structured entities is detailed in the table below, and recognised within financial assets: loans, investments and warrants in the Statement of Financial Position:
FundsInvestment in Fund
£m
Management fees
receivable £m
Management fees
%
Performance fees
receivable £m
Performance fees
%
Maximum exposure
to loss £m
CLOs 37.0 2.90.35%
to 0.60% – 0.05% to 0.20% 39.9
Credit Funds 71.5 2.10.50%
to 0.75% – N/A 73.6
ICG Mezzanine Fund III 2003 – 0.1 0.75% 4.425% of total performance fee of 20% of profit over the threshold 4.5
ICG European Fund 2006 B – 1.2 0.75% –20% of total performance fee of 20% of profit over the threshold 1.2
Intermediate Capital Asia Pacific Mezzanine Fund I 2005 – 0.9 2.00% –
25% of total performance fee of 20% of profit over the threshold 0.9
Other Mezzanine Funds 25.4 8.21.25%
to 1.5% –20% of total performance fee of 20% of profit over the threshold 33.6
Real Estate Funds 87.0 2.21.22%
to 1.33% – 20% of returns in excess of 9% IRR 89.2
Total 220.9 17.6 4.4 242.9
Management fees are charged on third party money managed by ICG on either a committed or invested basis dependent on the fund. The accounting policy for the recognition of performance fees is included in note 3.
ICG’s maximum exposure to loss is equal to the value of any investments held and unpaid management fees and performance fees.
ICG has not provided non contractual financial or other support to the unconsolidated structured entities during the year. It is not the current intention to provide such support, including the intention to assist the structured entity in obtaining financial support.
34. CONTINGENT LIABILITIES
The Company and its subsidiaries may be party to legal claims arising in the course of business. The Directors do not anticipate that the outcome of any such potential proceedings and claims will have a material, adverse effect on the Group’s financial position and at present there are no such claims where their financial impact can be reasonably estimated. The Company and its subsidiaries may be able to recover any monies paid out in settlement of claims from third parties.
35. POST BALANCE SHEET EVENTS
There have been no material events since the balance sheet date.
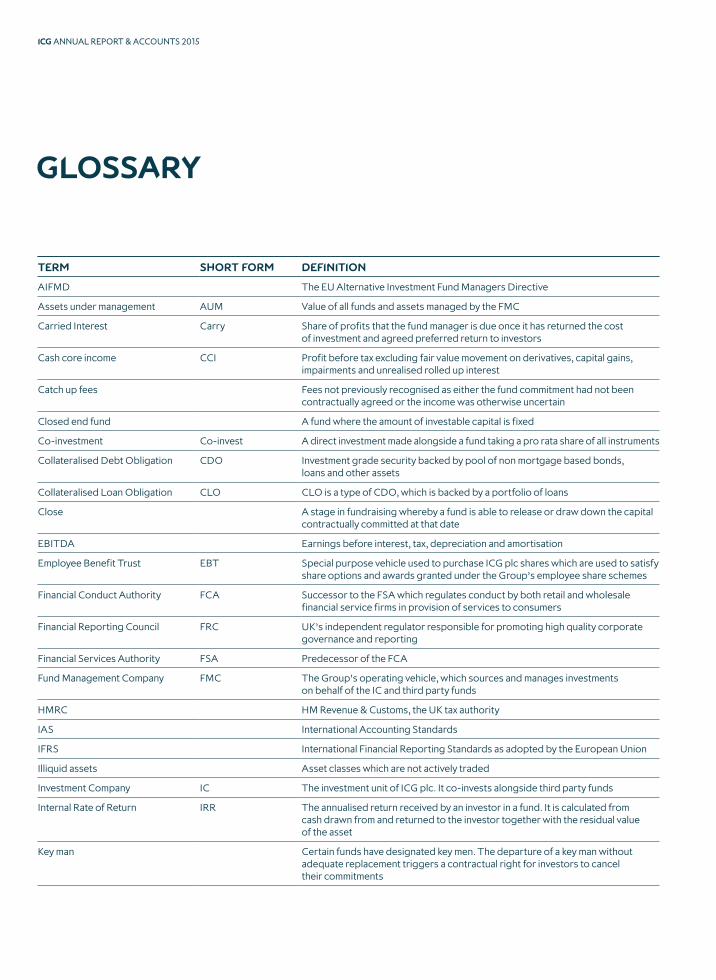
ICG ANNUAL REPORT & ACCOUNTS 2015
GLOSSARY
TERM SHORT FORM DEFINITION
AIFMD The EU Alternative Investment Fund Managers Directive
Assets under management AUM Value of all funds and assets managed by the FMC
Carried Interest Carry Share of profits that the fund manager is due once it has returned the cost of investment and agreed preferred return to investors
Cash core income CCI Profit before tax excluding fair value movement on derivatives, capital gains, impairments and unrealised rolled up interest
Catch up fees Fees not previously recognised as either the fund commitment had not been contractually agreed or the income was otherwise uncertain
Closed end fund A fund where the amount of investable capital is fixed
Co-investment Co-invest A direct investment made alongside a fund taking a pro rata share of all instruments
Collateralised Debt Obligation CDO Investment grade security backed by pool of non mortgage based bonds, loans and other assets
Collateralised Loan Obligation CLO CLO is a type of CDO, which is backed by a portfolio of loans
Close A stage in fundraising whereby a fund is able to release or draw down the capital contractually committed at that date
EBITDA Earnings before interest, tax, depreciation and amortisation
Employee Benefit Trust EBT Special purpose vehicle used to purchase ICG plc shares which are used to satisfy share options and awards granted under the Group’s employee share schemes
Financial Conduct Authority FCA Successor to the FSA which regulates conduct by both retail and wholesale financial service firms in provision of services to consumers
Financial Reporting Council FRC UK’s independent regulator responsible for promoting high quality corporate governance and reporting
Financial Services Authority FSA Predecessor of the FCA
Fund Management Company FMC The Group’s operating vehicle, which sources and manages investments on behalf of the IC and third party funds
HMRC HM Revenue & Customs, the UK tax authority
IAS International Accounting Standards
IFRS International Financial Reporting Standards as adopted by the European Union
Illiquid assets Asset classes which are not actively traded
Investment Company IC The investment unit of ICG plc. It co-invests alongside third party funds
Internal Rate of Return IRR The annualised return received by an investor in a fund. It is calculated from cash drawn from and returned to the investor together with the residual value of the asset
Key man Certain funds have designated key men. The departure of a key man without adequate replacement triggers a contractual right for investors to cancel their commitments

158 / 159
TERM SHORT FORM DEFINITION
Liquid assets Asset classes with an active, established market in which assets may be readily bought and sold
Open ended fund A fund which remains open to new commitments and where an investor’s commitment may be redeemed with appropriate notice
Operating margin Total fee income less operating expenses divided by total fee income
Payment in kind PIK Also known as rolled up interest. PIK is the interest accruing on a loan until maturity or refinancing, without any cash flows until that time
Performance fees Incentive fees paid when fund performance exceeds a fixed return
Realisation The return of invested capital in the form of principal, rolled up interest and/or capital gain
Return on equity ROE Profit after tax divided by average shareholders’ funds for the period
Securitisation A form of financial structuring whereby a pool of assets is used as security (collateral) for the issue of financial instruments
Seed capital Capital invested to establish a fund strategy
Senior debt Senior debt ranks above mezzanine and equity
Turnbull Committee guidance Guidance published by the FRC setting out best practice on internal control for UK listed companies
UK Corporate Governance Code The Code Sets out standards of good practice in relation to board leadership and effectiveness, remuneration, accountability and relations with shareholders
UNPRI UN Principles for Responsible Investing
Whole loans A property loan which represents all debt secured on the property

ICG ANNUAL REPORT & ACCOUNTS 2015
SHAREHOLDER AND COMPANY INFORMATION
TIMETABLE
EVENT DATE
Ex dividend date 11 June 2015
Record date for financial year 2015 final ordinary dividend 12 June 2015
Last date for dividend reinvestment election 7 July 2015
AGM 15 July 2015
Payment of final ordinary dividend 28 July 2015
Half year results announcement for the six months to 30 September 2015 17 November 2015
COMPANY INFORMATION
STOCKBROKERS
JPMorgan Cazenove25 Bank StreetCanary WharfLondonE14 5JP
Jefferies Hoare Govett LimitedVintners Place68 Upper Thames StreetLondon EC4V 3BJ
BANKERS
Lloyds TSB plc 25 Gresham Street London EC2V 7HN
The Royal Bank of Scotland plc 135 Bishopsgate LondonEC2M 3UR
AUDITOR
Deloitte LLPChartered Accountants and Statutory Auditor2 New Street SquareLondonEC4A 3BZ
REGISTRARS
Computershare Investor Services PLC PO Box 92 The Pavilions Bridgwater Road Bristol BS99 7NH
REGISTERED OFFICE
Juxon House100 St Paul’s ChurchyardLondon EC4M 8BU
COMPANY REGISTRATION NUMBER
02234775
WEBSITE
The Company’s website address is www.icgplc.comCopies of the Annual and Interim Reports and other information about the Company are available on this site.

DESIGNED AND PRODUCED BY RADLEY YELDAR
www.ry.com

www.icgplc.comAUTHORISED AND REGULATED BY THE FINANCIAL CONDUCT AUTHORITY