Embed Size (px)
Citation preview

The author(s) shown below used Federal funds provided by the U.S.Department of Justice and prepared the following final report:
Document Title: Innovative Crime Mapping Techniques andSpatial Analysis
Author(s): Victor Goldsmith ; Arthur Langer ; Robert Graff
Document No.: 204432
Date Received: February 2004
Award Number: 97-LB-VX-K013
This report has not been published by the U.S. Department of Justice.To provide better customer service, NCJRS has made this Federally-funded grant final report available electronically in addition totraditional paper copies.
Opinions or points of view expressed are thoseof the author(s) and do not necessarily reflect
the official position or policies of the U.S.Department of Justice.

Grant no 97-LB-VX-KO13 Vendor no 131988192
Innovative Crime Mapping Techniques and Spatial Analysis FY 1997 and FY 1998
Total Award: $499,751
Hunter College Research Foundation of the City University of New York
John Mollenkopf Victor Goldsmith 695 Park Avenue
New York, NY 10021

APPLIED STUDIES E ENVIRONMENT
CITY UMlVEiRSITY OF NEW YORK Professor Victor Goldsmith (Hunter College), Director
Professor Robert Graff (City College), Deputy Director Professor Arthur Langer (Brooklyn College), Deputy Director
Senior Colleges of CUNY: BC . Broaklyn College, CC - City College, GSUC - Graduate School and Univeisity Center,
HC - Hunter College, LC - Herbert H. Lehman College and RC - Queens College.
A SPOT Image (June 25, 1988) is shown merged with an EOSAT IMAGE (August 30, 1990), resulting In a multispectral image with a 10 m resolutlon (after a technique by Ahearn, 1993).1n this classlication,the lower numbers represent more urbanized areas.
This merged image is from a report prepared for the NYC Department of Environmental Protection (Goldsmith et ai., 1993).

An
s o
Example From the City University of New York(CUNY) -
ving the Problems of Overlaying NYPD Crime Data with New York Police Department (NYPD) Partnership:
Social/Deniographic Data
BY Doug Williamson and Victor Goldsmith
Geography Department, Hunter College and Center for Applied Studies of the Environment, City University of New York
John Mollenkopf Center for Urban Research, Graduate School and University Center, CUNY
Steve Quinn and Phillip McGuire New York Police Department (NYPD)
Prepared for The Seminar “The Mappirig mid Analysis of Geographically Referenced Crime Data”
University of Liverpool, GB, September 4th/5th, 1997
Abstract
The CUNY - NYPD partnership has operated successfully for three years, in part, with the assis- tance of funding from the National Institute of Justice, US Department of Justice. Now, as atten- tion moves away from the weekly mapping of incident data within a Geographic Information System (GIS) successfully implemented by NYPD, our partnership has directed attention to new developments in GIS and spatial analyses. In this stage in the development process, it is necessary to overlay the NYPD crime data with other data, such as demographic data, for increased under- standing of crime hotspots. The associated problems of map overlays, and their solutions, are dis- cussed here, both as an example of our cooperation and as an example of the requirements needed for good practices in the mapping and analysis of crime data.
In overlaying maps of data sets, it is important to be cognizant of the coordinate systems and the map projections of each of the maps. In the United States, projections, datums, units, and coordi- nate systems can vary widely. The lack of similarity of these four aspects can result in inaccurate plotting of incident data on street files, in addition to increasing the numerous problems associ- ated with geocoding. It can also result in inaccurate comparisons of two data sets, such as miscal- culations of crime per capita from the combination of mapped incident crime data and mapped demographic data.
Another problem involves the practice of ‘heads-up digitizing’ of new data sets (e.g, addition of boundary files, layers of bars, schools, subway stations, or other facilities of interest). MapInfo, a software package commonly used by police departments in the US, handles new data sets with some difficulty. An example is its’ difficulty in ‘snapping’ one feature to another feature (e.g.,
CUNY/NYPD PARTNERSHIP 8/20/97 page 1

adding precinct sector boundaries to existing street file maps). This can be overcome through the use of ArcInfo, despite the difficulties in exportingJimporting data.
Many of these problems can be overcome through proper attention to basics (e.g., quality control in geocoding), a proper beginning (Le., learning from our colleagues experiences), and by proper documentation of the history of the data sets and the steps undertaken in ‘messaging’ the data prior to its arrival in ones computer. The increasing practice of developing metadata dictionaries (i.e., the ‘pedigree’) of the data sets, if properly followed, should go a long way towards easing these problems.
INTRODUCTION The City University of New York (the third largest university in the United States, and the largest urban university) has been providing assistance through the Center for Applied Studies of the Environment and the Center for Urban Research, to the New York Police Department (NYPD) in Geographic Information S ys tems (GIS) and related areas. This successful cooperation between practitioners and academia includes, among other aspects, the development of a Webb site listing crime related software, law enforcement agencies on the WWW, software users, a bibliography, our joint (CUNY/NYPD) crime mapping and analysis workshop agenda, sample maps, animation of crime data, and links to other list serves. Our web site, including the above, may be found at:
Our cooperation also includes training NYPD personnel in GIS at the CUNY computer facilities, jointly hosting a national workshop on new developments in crime mapping and analysis (see our Webb site) with funding from the National Institute of Justice (NIJ) of the US Department of Jus- tice, providing data, software and use of our extensive computer facilities, and providing assis- tance in problem solving.
http://everes t . hunter.cuny.edu/capse/crime. html.
The analysis of crime data, especially in spatial and temporal terms is a complicated process. Advances in computer hardware and software have helped simplify the job of crime analysts. With the recent development of desktop GIS packages, analysts have been able to ‘automatically’ create maps of incident reports. Prior to our association, NYPD had accomplished this to a remarkable extent. Their use of GIS-derived data within the context of the unique COMPSTAT Process @e., computer statistics) has had a dramatically positive influence in the focussing of manpower and in making the police precinct command structure more responsive to new approaches in fighting crime in NYC. Indeed, crime is down significantly in NYC in six of the seven major felony categories, approximately 50% during the period encompassing these NYPD initiatives.
Yet, new developments in GIS and spatial analyses have also complicated the analysis of crime data in many ways. This is especially true as we undertake the next stage in these analyses, the overlaying of crime data with other data sets, in order to compare the two based on their spatial and temporal relationships. The ability to successfully conduct such analyses still faces many obstacles, not the least of which are data input and verification. Following this stage, an analyst will often have an abundance of rich data and be faced with questions: Now what? How can these data best be used? Where can they be used? How can the results be interpreted? These are all sig- nificant questions, and all have answers. Most software packages accept data in a variety of stan-
c u ” y p D PARTNERSHIP 8/20/97 page 2

dard formats. Since crime data typically are incident data, they have a spatial component. Because of this, the data can be used in a GIS and can be analyzed based on their own attributes; e.g., date or time of occurrence. Or, they can be compared to other data such as demographic information. The results from the analyses should be used carefully. The user must be familiar with the data and with the software being used. This should not be an exercise in ‘data fishing.’ Clear objectives must be established and the methods used to reach the objectives should be strictly adhered to. After all, the goal of crime analysis is to determine what sort of criminal activ- ity is taking place in an area and how can it be remedied.
The New York City Police receive nearly one million calls for service, annually. In order to exam- ine the questions raised here, we will concentrate our discussion on a smaller data subset, for the Bronx, one of the five boroughs of NYC (Figure 1).
BACKGROUND For many police departments, ‘electronic pin-mapping’ , maps of points showing incident loca- tions, may be enough, or at least enough to start with. However, one goal of the New York City Police Department (NYPD) is to perform more in-depth analyses. One aspect of this is to com- pare incident data to some other data set, such as Census information. Census data are demo- graphic data for the United States and are collected every ten years. This information is freely available from the United States Census and can be found at local libraries, libraries that are repositories for information from the federal government, as well as on the World Wide Web. Another data set that can be used are data that was created by the NYPD, namely their precinct and sector maps.
One simple example of this would be to find out the number of incidents per census tract, or police precinct. There are a number of ways to do this. The user could simply print out two maps, one of incidents and one of census tract boundaries, and then compare the two (see Figure 2). Another way would be to simply draw the two layers, incidents and census tracts, on one map (see Figure 3). This idea of overlaying maps as layers is a fundamental concept in GIs. Although both approaches would work, there is a better and more efficient way. Using the map of census tracts, the layer containing one category of incidents, murders for example, could be overlaid using the MapInfo geographic query tool ‘cotnpletely contains’. There are a variety of geographic query tools including ‘are completely within,’ ‘completely contaiizs,’ ‘intersects,’ etc. This overlay results in a count that tells how many incidents occur within each tract’s boundary. That count can then be used to create a choropleth map showing the number of incidents that occur within each tract (see Figure 4). It should be noted that raw numbers are rarely used for choropleth mapping. Typically, ratios such as density (number of incidents per 1000 people) are used (see Figure 5) . It was done here simply for illustrative purposes. The geographic query tools are what separate GIS from database management systems. In contrast to Standard Query Language (SQL), geographic queries use locations or spatial attributes as the criteria for selection. For example, if the user wanted to know how many incidents occurred in the 46th Precinct, they would select the 46th Pre- cinct then use the ‘are completely within’ option on the incidents map. The result would be all the points that are completely within the boundary of the 46th Precinct. (There are 76 police precincts in New York City.)
CUNY/NYPD PARTNERSHIP St20197 page 3

OVERVIEW OF A MAPPING PROBLEM As part of the Geographic Information System (GIS) currently in place at the New York City Police Department, street files known as LION files are used as the source data for geocoding address information from police reports. The LION files are part of a product known as Bytes of the Big Apple, a set of digital data created and distributed by the New York City Planning Depart- ment. Currently, LION files are delivered as AutoCad DXF files or drawings. In their original state, they are drawn on the New York East Stateplane Coordinate System. Typically, this system is based on the North American Datum of 1927 (NAD 27) in units of feet from the origin. It is unclear as to what projection and more importantly, what datum the NYPD is currently employ- ing. (An alternative could be NAD 83, an update of NAD 27.) The only thing known for sure is that their maps are being displayed in geographic coordinates (latitude and longitude) with units set to decimal degrees. Whether the projection of the original LION file had been changed, and to what, is unclear. The Police Department has invested considerable time and resources in ‘improv- ing’ their LION files to improve the hit rate of the geocoding (address-matching) strategy, as well as using the LION files as the base maps for other maps such as precinct and sector maps.
An underlying tenet in the concept of map overlay is that the projections of the two files being overlaid must be the same. Also, their units must be equivalent as well. If they are not, the overlay can not be done ‘correctly’. It is similar to the idea of comparing apples to oranges. Correctly is in quotes because the overlay process can be carried out, but the results will not be precise. MapInfo, the GIS software being used by the NYPD, allows for the use of different projections. In other words, if a map is open in latflong, another map in stateplane can be opened on top. MapInfo does this automatically behind the scenes, without the user even knowing it. This can be problematic, especially if the two files have the same projection, but different datums. They may appear to be the same, but in fact may be offset by a considerable distance, in some NYC cases, up to 100 feet.
One goal of the NYPD is to overlay demographic data from the United States Bureau of the Cen- sus with their street files and geocoded crime data. This is typically done by joining tabular data to geographic (map) files, both of which are distributed by the Census Bureau. The map files can represent any one of a variety of geographic entities. The most common are the census tract and the census block group. Census tracts and block groups are derived from a product of the U.S. Census known as TIGER (Topologically Integrated Geographic Encoding and Referencing S ys- tem). TIGER is a digital line network whose cartographic base is the Census Bureau’s DIME (Dual Independent Map Encoding) files. Typically, these files are delivered in geographic coordi- nates in decimal degrees with a datum of NAD 27.
Another goal of the NYPD is to overlay the 76 precinct maps (and sector maps within each pre- cinct), created from the LION files, with their street files and geocoded crime data. The precinct and sector maps were created manually using the LION files as a base. The process used to create them is known as heads-up digitizing. In this process the user has a file, usually scanned in from a map, open on the computer monitor. He/she then traces over the original map with a mouse and a cursor to create a new one. The process, albeit easy, is not the most accurate or even the best method for creating new maps from another source.
CUNY/NYPD PARTNERSHIP page 4

OVERLAY PROBLEMS The two data sets, the NYPD data (Le., the NYC LION Files) and the US Census data (i.e., the TIGER Files), have different sources. It has been purported that the LION files were derived from the same base as the TIGER files, namely the DIME files from the United States Bureau of the Census. Now, whether or not this is true, is not important, because it is apparent that the NYC Department of City Planning has modified them considerably. One merely has to overlay these two files to see that there are discrepancies. For example, there may be streets on one that do not exist in the other. This is obviously problematic.
Further study, however, results in a more challenging problem, one of projections, units and datums. As long as these three factors are the same for each data set, then there should be no prob- lem. However, it is not just enough to say that they are the same, the files must be in that form. It is also important to know what form the files were in originally, before any of these coordinate system transformations are performed. For example, in MapInfo, even if the user does not know what system the map is in, it can still be opened. The user can even select what system he/she wants the file to be in. However, if they do not save a copy of that new system, the changes are never made. All future work should then utilize the saved copy. In the case of the NYPD, the LION street file, and all geocoded incident data, will not overlay correctly with Census files. This is due in large part to the confusion of projections, units and datums between the datasets. The layers can be opened together, but they will not match up. Typically, boundaries for census tracts will be streets. Therefore, if there is a problem with the projection definition the boundaries of the census tracts will be offset from the NYPD’s street file. This is a problem because incidents will be geocoded to the NYPD’s street file and will not match up with the census files. If a user were then to do a count of incidents per census tract, the results would be suspect at best.
Another problem involves the practice of heads-up digitizing of police precinct and sector bound- ary files. As stated earlier this process is easy, but its results leave a lot to be desired, for one sim- ple reason. A reproduction can never be as good as the original. MapInfo was not developed with the creation of new datasets in mind. Instead, it was developed to be an easy to use mapping and querying software. Because of this, it has severe data (map) editing limitations. One limitation is its inability to snap features to other features. If this were allowed, then any lines that were offset from the original could be snapped back to where they belong. This problem then is similar to the census tract problem. Only now the user would be doing counts based on precincts or sectors. Again, some of the results would be dubious, if not plain wrong. The possibility exists that an adjacent precinct may count incidents that actually belong to the neighboring precinct. Indeed, police precinct commanders on the wrong side of the totals have been quite vocal about this prob- lem.
One final problem with the use of overlays deals with the use of geocoded data. Geocoded data lends an air of accuracy to maps, but there is no guarantee that this is true. There are a variety of reasons for this. First, addresses may have been keyed in incorrectly into the incident database by the data entry person, i.e., 120 E 232 St. is entered as 110 E 232 St. Second, the street file may have incorrect or invalid information, i.e., bad address ranges or outdated street names. Third, the format for addresses in the table may not match the format in the street file, Le., Cross Bay Blvd. vs. Cross Bay B1. This becomes an issue when the incidents are overlaid with another dataset. If they have been geocoded incorrectly, the will not be in the right location. Once more, if a count
CUNY/-NYPD PARTNERSHIP 81’20197 page 5

were done using some area, precincts for example, the outcome would be suspicious, because the incidents may in fact belong in a neighboring precinct.
POSSIBLE SOLUTIONS There are a variety of solutions for the problems explained above, some of which will be dis- cussed here. These solutions are not all inclusive; as any user of GIS can attest, there are many approaches to try.
Solution 1: NYPD Use US TIGER Files Rather than NYC LION Files for Geocoding This is the most obvious solution. If the NYPD developed all its overlays from the same base, there will be no mismatch problems to contend with. There are two main issues to consider though. First, would it be cost effective for the NYPD to abandon the LION files after consider- able time and resources have already been invested in improving them? Second, would a more acceptable hit-rate be achieved using TIGER instead of LION in the geocoding process? It is rec- ommended that before this option be selected, a test be performed on both data sets. A sample file of addresses should be geocoded to both to see which one has a higher hit-rate. If the TIGER files have a poor hit-rate, then LION should be used and the TIGER files should be made to conform (see Solutions 2 and 3).
Solution 2: Force Boundaries to fit NYPD Street File It is known that since LION has been modified, it will never match TIGER. Therefore, TIGER can be modified to match LION. There are two ways to do this, manually (not recommended) and automatically and manually (recommended). The manual approach would involve individually selecting every node on the TIGER file and moving and snapping it to its corresponding LION node. This would take a great deal of time and resources but is doable entirely in MapInfo. The automatic/manual approach utilizes another software, namely ArcInfo. ArcInfo has the ability to automatically snap arcs and nodes from one layer to arc/nodes of another layer (see Figure 6). The user simply has to define a distance in which the snap will be performed. This procedure is not perfect though, and leads to the manual aspect. Some nodes will still have to be moved/snapped manually. However, the benefit is that far less nodes will have to be moved in this way than in the purely manual approach. The drawback here is that another software (ArcInfo), from another vender, must be used, with all the associated problems of data import and export. The same tech- nique could be used in ‘fixing’ the existing precinct and sector maps (see Figure 7).
Solution 3: Recreate Boundaries from NYPD’s Street File The word ‘recreate’ conjures up images of expending vast amounts of time and resources, but in this case, this may not true. The process is fairly straightforward. The boundaries for the census tracts and precincts and sectors are already known. Indeed, precinct boundaries tend to coincide with known streets. The problem is that they do not line up with the base map. A remedy to this would be to simply select every line segment that makes up a boundary and save them to a new map. This would mean that all the segments are exact copies of the originals. This process would indeed take time, but the resulting map would be far more accurate than digitizing. This process can also be used in the creation of other data sets. For example, precinct maps could be derived from an accurate sector map or census tracts could be derived from the census blocks. To do this, the user would simply have to select all the sectors that make up one precinct or all the blocks that
CUNY/NYPD PARTNERSHIP 8/20/97 page 6

make up one tract, then dissolve the shared boundaries. In MapInfo terms, this is called ‘combin- ing regions.’ Then, not only would our sector maps be exact replicas of the street map, but our pre- cinct maps would be as well and the same would be true for the census maps.
Solution 4: Quality Control in Geocoding Unfortunately, there is no magic bullet for the process of geocoding. It is an arduous, time-con- suming, and at times mundane, process. However, it is the single most important process is any address-driven GIS analysis, so a great deal of care must be given to it. In the realm of data quality and quality control, there is no automatic way to check for errors. There is not even a fool-proof manual way to do it. There are some things that may help though. Essentially, there are two meth- ods in geocoding, automatic and interactive. Aiitoincltic essentially means the user selects the field from which addresses will be taken and the software does its best to find corresponding addresses on the street file. Znteractive allows the user to scroll through each address, then pick from a num- ber of choices in the software lists as ‘possible matches’ on the street file. This is more time con- suming, but if the user is familiar with the data in the table, the data in the street file, and the way the software handles address information, it will yield much better results. Therefore interactive will typically yield the best results. Also, if a question comes up during the interactive process, the user can ‘flag’ that record which can be used to indicate that the location may be questionable. Another technique that can be employed is the use of random checks on the data. Here, a random subset of the data would be chosen on a regular basis and the information in the database can be checked with the original incident reports that were used to create the records. This is not to say the original incident reports are error-free, but the data can only be as accurate as its source.
CONCLUSIONS In comparing data sets, it is critical to use the same map projections, datums and coordinate sys- tems. Therefore, if possible, the data sets should have the same base maps. The first step in com- paring the spatial aspects of two data sets should be to identify the differences, if any, in these aspects. Where there are differences, they can be overcome by changing the pertinent parameters through these options in the software, geocoding the data on the same base map as the other data sets, or by importing the data into ArcInfo (or equivalent software) and ‘snapping’ the arcs and nodes of one data set to the arcs/nodes of the other mapped data set.
In addition to being cognizant of the commonality of the base maps, special attention should also be directed to the street files, their accuracy, commonality, and their role in the accuracy of the geocoding process. Quality control in the geocoding process is probably one of the main pro- cesses needed to insure a successful comparison of crime data with other data.
Finally, ‘metadata dictionaries’ should be developed throughout the data acquisition, modifica- tion, and analysis processes. Such data documentaries should be requested when acquiring data from another source. Good practice involves thoroughly informing each other of all steps under- taken, and is a requirement for successful cooperation, such as our CUNY/NYPD partnership.
CUNY/NYPD PARTNERSHIP 8/20/97 page 7

REFERENCES Goldsmith, V., Mollenkopf, J. and McGuire, P, (eds.). Mapping Crime Hotspots: Frontiers of Practice. Book in preparation
LIST OF FIGURES
1. The Bronx, one of the five boroughs of New York City, and Vicinity.
2. Comparing two data sets, Incident Map of Burglaries (left) and Census Tracts (right), for an area in the Bronx.
3. Overlay of Burglaries and Census Tracts for an area in the Bronx.
4. Choropleth Map of Number of Burglaries per Census Tract for the Bronx.
5. Choropleth Map of Number of Burglaries per 1000 people within each Census Tract for the Bronx.
6. Overlay of Original Census Tracts, Census Tracts adjusted using ArcInfo, and Lion File Streets (see discussion of procedure in text).
7. Overlay of Original Police Sectors, Police Sectors adjusted using ArcInfo, and Lion File Streets (see discussion of procedure in text).
CUNY/NWD PARTNERSHIP 812 1/97 page 8

New York City and Vicinity
Center for the Applied Studies of the Environment (August 1997)

Incident Map
Comparison of Two Datasets
Census Tract Map
Locations of Incidents shown as red dots with streets shown as black lines
Census Tract Boundaries (pink lines) and respective numbers with streets shown as black lines
0 3 0 0.3 0.6 Miles
Center for Applied Studies of the Environment (August 199'7)
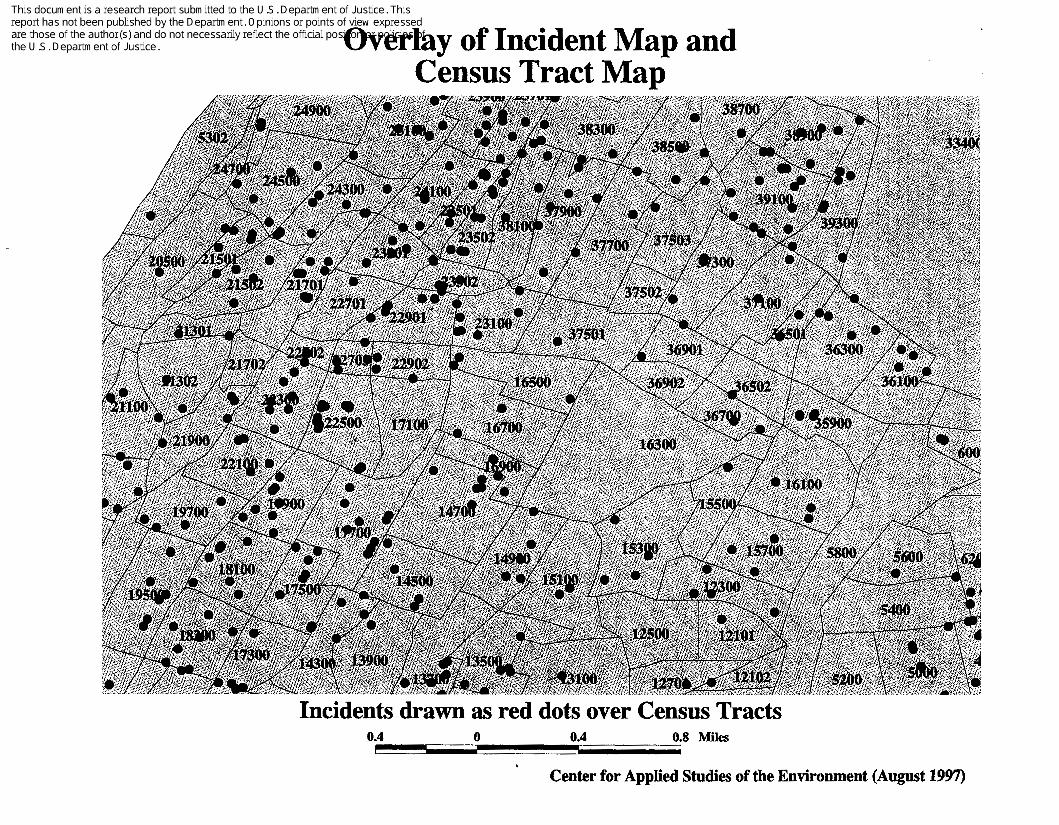
Overlay of Incident Map and Census Tract Map
0.8 Miles 0.4 0 0.4 i
Center for Applied Studies of the Environment (August 19!V)


Number of Burglaries per 1000 people (by Census Tract)
2 0 2 4 Miles
-Q
N
(BurglarieslTotal Population) * 1000
0-0.082 0.083 - 0.459 0.459 - 0.875 0.875 - 1.395 1.395 - 4.274 4.274 - 285.714
Center for Applied Studies of the Environment (August 1997)

Overlay of Census Tract Boundaries and
LION Street Files
I
I Original Census Tract Boundaries LION Streets
r-- 7 __
Adjusted Census Tract Boundaries
Center for Applied Studies of the Environment (August 1997)

Overlay of Police Sector Boundaries and
LION Street Files
/ /
/ / 1 /"J ~ 1 0 ~ s t r W t s r] Original Sector Boundaries I , / Adjusted Sector Boundary
~~
Center for Applied Studies of the Environment (August 19a7)