Embed Size (px)
Citation preview

INNOVATIVE CLEAN COAL TECHNOLOGY (ICCT)
500 MW DEMONSTRATION OF ADVANCEDWALL-FIRED COMBUSTION TECHNIQUES
FOR THE REDUCTION OF NITROGEN OXIDE (NOx)EMISSIONS FROM COAL-FIRED BOILERS
Phase 3A Low NOx Burner TestsTopical Report
DOE Contract NumberDE-FC22-9OPC89651
SCS Contract NumberC-91 -000027
Prepared by:
Woodward-Clyde Consultants / ETEC2020 East First Street Suite 400
Santa Ana, California 92708
Southern Company Services, Inc.800 Shades Creek ParkwayBirmingham, Alabama 35209
Cleared by DOE Patent Council on March 15, l 993

Legal Notice
This report was prepared by Southern Company Services, Inc.pursuant to a cooperative agreement partially funded by the U.S.Department of Energy and neither Southern Company Services, Inc.nor any of its subcontractors nor the U.S. Department of Energy, norany person acting on behalf of either:
(a) Makes any warranty or representation, express or impl iedwith respect to the accuracy, completeness, or usefulnessof the information contained in this report, or processdisclosed in this report may not infringe privately-ownedrights; or
(b) Assumes any liabilities with respect to the use of, or f o rdamages resulting from the use of, any information,apparatus, method or process disclosed in this report.
Reference herein to any specific commercial product, process,or service by trade name, trademark, manufacturer, or otherwise,does not necessarily constitute or imply its endorsement,recommendation, or favoring by the U.S. Department of Energy. Theviews and opinion of authors expressed herein do not necessarilystate or reflect those of the U.S. Department of Energy.
i

Executive Summary
This Phase 3A test report summarizes the testing activities and results for the thirdtesting phase of an Innovative Clean Coal Technology (ICCT) demonstration ofadvanced wall-fired combustion techniques for the reduction of nitrogen oxide (NOx)emissions from coal-fired boilers. The project is being conducted at Georgia PowerCompany's Plant Hammond Unit 4 located near Rome, Georgia. The primary goal of thisproject is the characterization of the low NOx combustion equipment through thecollection and analysis of long-term emissions data.
This demonstration project is divided into the following phases:
Phase 0 - Pre-award activities,Phase 1 - Baseline "as-found" testing,Phase 2 - AOFA installation and testing,Phase 3A - LNB installation and testing,Phase 3B - LNB plus AOFA testing,Phase 4 - Advanced digital controls installation and testing, andPhase 5 - Final reporting.
Described in this report arc the test plans, data measurements, and data analysesperformed during the Phase 3A effort. The present report also contains sufficientbackground material to provide an understanding of the overall program scope, therelationship of Phase 3A to the overall program, the testing methodologies. testingprocedures, and unit configuration.
Results from 66 short-term tests indicate increasing NOx emissions over the load rangeranging from 0.5 lb/MBtu at 300 MW to around 0.65 lb/MBtu at 480 MW. Fly ash loss-on-ignition (LOI) for these loads ranged from 5.4 to 8.6 percent. Long-term test resultsindicated high load (480 MW) NOx emissions of approximately 0.6S lb/MBtu. At the300 MW mid load point, the emissions dropped to 0.47 lb/MBtu which is slightly lowerthan the 0.50 lb/MBtu shown for the short-term data. The annual and 30-day averageachievable NOx emissions were determined to be 0.55 and 0.64 lb/MBtu, respectively,for the load scenario experienced during the Phase 3A long-term test period. Based onthe long-term test results for Phase 3A, at full-load the LNB retrofit resulted in a NOxreduction of 48 percent from baseline, while at 300 MW the reduction wasapproximately 50 percent.
A special series of tests was conducted during Phase 3A to evaluate the effects ofvarious burner equipment settings and mill coal flow biasing on both NOx and LOIemissions. The results of these tests are included in this report.
ii

Table of Contents1. Introduction..................................................................................................................1-1
1.1 Project Description.....................................................................................................1-11.2 Project Organization..................................................................................................1-21.3 Hammond Unit 4 Description...................................................................................1-31.4 Report Organization..................................................................................................1-4
2. Test Program Description........................................................................................2-1
2.1 Technology Background..........................................................................................2-12.1.1 Advance Overfire Air System.............................................................................2-12.1.2 Low NOx Burners............................................................................................... 2-22.1.3 Advanced Low NOx Digital Controls ............................................................ 2-2
2.2 Program Test Elements............................................................................................. 2-42.2.1 Short-Term Characterization............................................................................. 2-42.2.2 Long-Term Characterization ............................................................................ 2-5
2.3 Phase 3A Test Plan.................................................................................................... 2-52.3.1 Short-Term Characterization Testing............................................................... 2-52.3.2 Long-Term Characterization Testing............................................................... 2-62.3.3 Verification Testing............................................................................................. 2-6
3. Test Procedures And Measurements.....................................................................3-1
4. Data Analysis Methodology....................................................................................4-1
4.1 Short-Term Characterization Data Analysis ..........................................................4-14.1.1 Diagnostic Data....................................................................................................4-14.1.2 Performance Data................................................................................................ 4-2
4.2 Long-Term Characterization Data Analysis.......................................................... 4-24.2.1 Data Set Construction........................................................................................ 4-34.2.2 Five-minute Average Emission Data................................................................ 4-34.2.3 Data Analysis Procedures.................................................................................. 4-3
5. Short-Term Test Results...........................................................................................5-1
5.1 Diagnostic Tests .........................................................................................................5-15.1.1 Unit Operating Condition ..................................................................................5-15.1.2 Gaseous Emissions.............................................................................................. 5-2
5.2 Performance Tests..................................................................................................... 5-75.2.1 Unit Operating Data............................................................................................ 5-75.2.2 Gaseous Emissions ............................................................................................5-115.2.3 Solid Emissions ..................................................................................................5-115.2.4 Flue Gas S03 Concentration...........................................................................5-18
iii

5.2.5 Combustion System Tests ...............................................................................5-245.2.6 Coal and Ash Analyses....................................................................................5-305.2.7 Boiler Efficiency...............................................................................................5-31
5.3 Special LOI Tests ....................................................................................................5-32
6. Long-term Data Analysis.........................................................................................6-1
6.1 Unit Operating Characteristics ................................................................................6-16.2 Parametric Test Result.............................................................................................. 6-36.3 Third-day Rolling Averages.................................................................................... 6-76.4 Achievable Emission Characterization.................................................................. 6-76.5 Comparison of Long- and Short-Term NOx Data..............................................6-13
7. Conclusions..................................................................................................................7-1
7.1 Short-Term Characterization Tests ..........................................................................7-17.1.1 Diagnostic Test Conclusions..............................................................................7-17.1.2 Performance Test Conclusions...........................................................................7-1
7.2 Long-Term Characterization Tests ....................................................................... 7-27.3 Comparison of Phase 1 and Phase 3A Emission Data.......................................... 7-37.4 Special EOI Test Conclusions................................................................................. 7-3
Bibliography
iv
List of Figures
Figure 2-1 Hammond Advanced Overfire Air System ............................................... 2-3Figure 2-2 Controlled Flow/Split Flame Burner.......................................................... 2-3Figure 5-1 Short-Term Tests / Oxygen Levels Tested................................................ 5-6Figure 5-2 Short-Term Tests / NOx Emissions ............................................................ 5-6Figure 5-3 Short-Term Tests / NOx Characterization at 480 MW............................ 5-8Figure 54 Short-Term Tests / NOx Characterization at 400 MW............................. 5-8Figure 5-5 Short-Term Tests / NOx Characterization at 300 MW............................ 5-9Figure 5-6 Short-Term Tests / NOx Characterization at 180 MW............................ 5-9Figure 5-7 ESP Inlet Mass Distribution .....................................................................5-14Figure 5-8 ESP Inlet Differential Mass Distribution.................................................5-15Figure 5-9 East Duct In-Situ Ash Resistivity............................................................5-19Figure 5-10 West Duct In-Situ Ash Resistivity ........................................................5-20Figure 5-11 ESP Hopper Ash Resistivity /480 MW ................................................5-21Figure 5-12 ESP Hopper Ash Resistivity / 400 MW and 300 MW.......................5-22Figure 5- 13 Furnace Exit Temperatures and Oxygen at 480 MW .......................5-27Figure 5- 14 Furnace Exit Temperatures and Oxygen at 400 MW........................5-28Figure 5-15 Furnace Exit Temperatures and Oxygen at 300 MW.........................5-29Figure 5- 16 NOx vs. LOI Testing / LOI vs. O2..........................................................5-38Figure 5- 17 NOx vs. LOI Testing / NOx vs. O2 .......................................................5-38Figure 5-18 NOx vs. LOI Testing / LOI vs. Mill Bias...............................................5-39Figure 5-19 NOx vs. LOI Testing / NOx vs. Mill Bias............................................. 5-39Figure 5-20 NOx vs. LOI Testing / LOI vs. Sliding Tip Position............................. 5~0Figure 5-21 NOx vs. LOI Testing / NOx vs. Sliding Tip Position...........................5-40Figure 5-22 NOx vs. LOI Testing / All Sensitivities .................................................5-41Figure 6-1 Hourly Average NOx Emissions................................................................. 6-2Figure 6-2 Hourly Average Load.................................................................................. 6-2Figure 6-3 Daily Average Load and NOx Characteristics......................................... 6-3Figure 6-4 Diurnal Characteristics................................................................................ 6-4Figure 6-5 NOx vs. Load Characteristic...................................................................... 6-6Figure e 6-6 NOx vs. Excess Oxygen at 180 MW..................................................... 6-8Figure 6-7 NOx vs. Excess Oxygen at 290 MW........................................................ 6-9Figure 6-8 NOx vs. Excess Oxygen at 390 MW......................................................6-10Figure 6-9 NOx vs. Excess Oxygen at 480 MW.......................................................6-11Figure 6-10 Thirty-Day Rolling Average ..................................................................6-12Figure 6- 11 Comparison of Long- and Short-Term NOx Emissions .................... 6- 13Figure 6-12 Comparison of Baseline and LNB NOx Emissions.............................6-14Figure 6-13 Baseline to LNB NOx Reduction..........................................................6-15
v

List of Tables
Table 2-1 Diagnostic Test Matrix.................................................................................. 2-5Table 5-1 Summary of Phase 3A Diagnostic Tests...................................................... 5-3Table 5-2 Diagnostic Tests / Emissions and Operating Data..................................... 5-4Table 5-3 Summary of Phase 3A Performance Tests................................................5-10Table 5-4 Performance Tests / Operating and Emissions Data................................5-12Table 5-5 Summary Of Solid Mass Emissions Tests................................................. 5- 13Table 5-6 Chemical Analysis of Hopper Samples.....................................................5-16Table 5-7 In-Situ Ash Resisitivity Results.................................................................5-17Table 5-8 Effect of Low NOx Burners on In-Situ Resistivity ................................5-23Table 5-9 SOx Results .................................................................................................5-23Table 5-10 Summary of Mill Performance Tests........................................................5-25Table 5- 11 Combustion Air Flow Distribution ........................................................5-26Table 5-12 Performance Tests Coal Analyses (Ultimate Analysis as Received)...5-30Table 5-13 Performance Tests CEGRIT Ash Analysis .............................................5-31Table 5-14 ASME PTC 4. I Boiler Efficiency ...........................................................5-32Table 5-15 NOx vs. LOI / Summary of Mill Performance Tests...............................5-36Table 5-16 NOx vs. LOI / Parameters Tested ............................................................5-36Table 5-17 NOx vs. LOI / Test Summary....................................................................5-37Table 6-1 Long-Term Test Statistics / August 7 - December 19, 1991...................... 6-5Table 6-2 Mill Pattern Use Frequency.......................................................................... 6-6Table 6-3 Descriptive Statistics For Daily Average NOx Emissions .....................6-12Table 6-4 Achievable NOx Emission Limit ...............................................................6-12
vi

Table of Abbreviations
AOFA Advanced Overfire AirASME American Society of Mechanical EngineersAMIS All mills in serviceB&W Babcock and WilcoxC carbonCAA(A) Clean Air Act (Amendments)CEM continuous emissions monitorCFSF Controlled Flow/Split FlameCl chlorineCO carbon monoxideDAS data acquisition systemDCS digital control systemDOE United States Department of EnergyECEM extractive continuous emissions monitorEPA Environmental Protection AgencyEPRI Electric Power Research InstituteESP Electrostatic precipitatorETEC Energy Technology ConsultantsF FahrenheitFC fixed carbonFWEC Foster Wheeler Energy CorporationGPC Georgia Power CompanyH hydrogenHHV higher heating valueICCT Innovative Clean Coal TechnologyKPPH Kilo pounds per hourIb(s) pound(s)LNB low NOx burnerLOI loss on ignition(M)BtU (million) British thermal unitMOOS Mill out of serviceMW megawattN nitrogenNOx nitrogen oxidesNSPS New Source Performance StandardsO, O2 oxygenPA Primary airpsig pounds per square inch gaugePTC Performance Test Codes
v i i

Table of Abbreviations (continued)
RSD relative standard deviationS su l fu rSCS Southern Company ServicesSO2 sulfur dioxideSoRI Southern Research InstituteTHC Total hydrocarbonsUARG Utility Air Regulatory GroupVM volatile matter
v i i i

1. Introduction
This document discusses the technical progress of a U. S. Department of Energy (DOE)Innovative Clean Coal Technology (ICCT) project demonstrating advanced wall-firedcombustion techniques for the reduction of nitrogen oxide (NOx) emissions from coal-fired boilers. The project is being conducted at Georgia Power Company's PlantHammond Unit 4 (500 MW) near Rome, Georgia.
The project is being managed by Southern Company Services, Inc. (SCS) on behalf ofthe project co-funders: The Southern Company, the U. S. Department of Energy (DOE),and the Electric Power Research Institute (EPRI). In addition to SCS, The SouthernCompany includes five electric operating companies: Alabama Power, Georgia Power,Gulf Power, Mississippi Power, and Savannah Electric and Power. SCS providesengineering, research, and financial services to The Southern Company.
The Clean Coal Technology Program is a jointly funded effort between government andindustry to move the most promising advanced coal-based technologies from theresearch and development stage to the commercial marketplace. The Clean Coal effortsponsors projects which are different from traditional research and developmentprograms sponsored by the DOE. Traditional projects focus on long range, high risk,high payoff technologies with the DOE providing the majority of the funding. Incontrast, the goal of the Clean Coal Program is to demonstrate commercially feasible,advanced coal-based technologies which have already reached the "proof of concept"stage. As a result, the Clean Coal Projects are jointly funded endeavors between thegovernment and the private sector, conducted as cooperative agreements in which theindustrial participant contributes at least fifty percent of the total project cost.
This report is provided to document the testing performed and results achieved duringPhase 3A -Low NOx Burner. This effort began in July 1991 following completion ofPhase 2 - Advanced Overfire Air testing and installation of the retrofit LNB equipment.The Phase I baseline effort and results were documented in the Southern CompanyServices report titled 500 MW Demonstration of Advanced Wall-Fired CombustionTechniques for the Reduction of Nitrogen Oxides (NOx) Emissions from Coal-FiredBoilers - Phase 1 Baseline Tests. The Phase 2 effort and results are documented in 500MW Demonstration of Advanced Wall-Fired Combustion Techniques for theReduction of Nitrogen Oxides (NOx) Emissions from Coal-Fired Boilers - Phase 2Overfire Air Tests. Those reports contain detailed descriptions of the program, test plans,and testing procedures.
1.1 Project Description
On December 20, 1989, Southern Company Services was awarded a DOE InnovativeClean Coal Technology Round II (ICCT) contract for the project, "500 MWDemonstration of Advanced, Wall-Fired Combustion Techniques for the Reduction ofNitrogen Oxide (NOx) Emissions from Coal-Fired Boilers". The primary objective of thisdemonstration is to determine the long-term effects of commercially available wall-firedlow NOx combustion technologies on NOx emissions and boiler performance. Short-term tests of each technology are also being performed to provide engineeringinformation about emissions and performance trends. A target of achieving fifty
1-1

percent NOx reduction using combustion modification has been established for theproject. Specifically, the objectives of the project are:
1. Demonstrate in a logical stepwise fashion the short-term NOx reduction capabilitiesof the following advanced low NOx combustion technologies:
• Advanced Overfire Air (AOFA)
• Low NOx burners (LNB)
• LNB with AOFA
• Advanced digital control methodologies
2. Determine the dynamic, long-term emissions characteristics of each of thesecombustion NOxreduction methods using sophisticated statistical techniques.
3. Evaluate the progressive cost effectiveness (i.e., dollars per ton NOx removed) of thelow NOx combustion techniques tested.
4. Determine the effects on other combustion parameters (e.g., CO production, carboncarryover, particulate characteristics) of applying the NOx reduction methods listedabove.
To accomplish this evaluations. the project is partitioned into the following test phases:
• Phase I - Baseline
• Phase 2 - Advanced Overfire Air
• Phase 3A - Low NOx Burners
• Phase 3B - Low NOx Burners plus Advanced Overfire Air
• Phase 4 - Advanced Low NOx Digital Control System
Each of the phases of the project involves three distinct testing periods - short-termcharacterization, long-term characterization, and short-term verification. The short-termcharacterization testing establishes the trends of NOx versus various parameters andestablishes the influence of the operating mode on other combustion parameters. Thelong-term characterization testing (50 to 80 continuous days of testing) establishes thedynamic response of the NOx emissions to all of the influencing parametersencountered. The short-term verification testing documents any fundamental changes inNOx emissions characteristics that may have occurred during the long-term test period.
1.2 Project Organization
Southern Company Services is the prime contractor to the funders on this project. SCSdirects in-house and Georgia Power Company personnel to perform various dutiesrelated to site coordination, design engineering, environmental matters and costcoordination, and has overall responsibility for the execution of this project. SCS alsodirects subcontracted efforts of the burner manufacturer, installation contractors and testcoordination contractor, supplying the NOx emissions control systems as describedbelow.
1 -2

Energy Technology Consultants Inc. ETEC has responsibility for the on-site testing andanalysis of the data, serving as the test coordinator and results engineer under SouthernCompany Services direction. ETEC is responsible for overall management of the testefforts, including preparation of test plans and coordination of other test contractors.
Spectrum Systems. Inc. Spectrum provides a full-time, on-site instrument technician whois responsible for operation and maintenance of the data acquisition system (DAS)housed within the instrument control room. For the full duration of the program (short-term characterization, long-term characterization, and short-term verification), Spectrum;maintains and repairs, as necessary, the instrumentation system and monitors thefunction of the data acquisition system on a daily basis.
Southern Research Institute (SoRI) SoRI is responsible for testing related to flue gasparticulate measurements during the performance testing portion of the short-termcharacterization. In addition to the testing activities, SoRI is responsible for ESPmodeling efforts for each of the four phases.
Flame Refractories Inc. (Flame) Flame is responsible for activities related to fuel/air inputparameters and furnace output temperature measurements during the performancetesting portion of the short-term characterization.
W. S. Pitts Consulting. Inc. (WSPC) WSPC is responsible for the statistical analysis ofthe long-term emissions data.
1.3 Hammond Unit 4 Description
Georgia Power Company's Plant Hammond Unit 4 is a Foster Wheeler EnergyCorporation (FWEC) opposed wall-fired boiler, rated at 500 MW gross, with designsteam conditions of 2500 psig and 1000/1000°F superheat/reheat temperatures,respectively. The unit was placed into commercial operation on December 14, 1970.Prior to the LNB retrofit, six FWEC Planetary Roller and Table type mills providedpulverized eastern bituminous coal (12,900 Btu/lb, 33% VM, 53% FC, 1.7% S, 1.4% N)to 24 pre-NSPS, Intervane burners. During the LNB outage, the existing burners werereplaced with FWEC Control Flow/Split Flame burners. The unit was also retrofit withsix Babcock and Wilcox MPS 75 mills during the course of the demonstration. Theburners are arranged in a matrix of 12 burners (4W x 3H) on opposing walls with eachmill supplying coal to 4 burners per elevation. As part of this demonstration project, theunit was retrofit with an advanced overfire air system. The unit is equipped with acoldside ESP and utilizes two regenerative secondary air preheaters and tworegenerative primary air heaters. The unit was designed for pressurized furnaceoperation but was converted to balanced draft operation in 1977.
1.4 Report Organization
The remainder of this report is organized into six sections. Section 2 providesbackground material for the project and describes the program methodology. Section 3provides details on the instrumentation and the data collection methods. The dataanalyses methods for both short-term and long-term data are described in Section 4.0.The results for the short-term characterization portion of the Phase 3A effort arepresented in Section 5. Section 6 provides a
1-3

description of the statistical approach used to analyze the continuous emission monitor(CEM) data. Section 7 provides a summary of conclusions for the analyses of both theshort-term and long-term data. A final report will summarize the testing results for allphases.
1-4

2. Test Program Description
In the past, there have been a number of demonstration programs by various burnermanufacturers for the purpose of evaluating the NOx reduction potential of theirequipment. These demonstrations have provided only minimal amounts of informationthat could be used to extrapolate to the general population of utility boilers. All of thesedemonstrations provided only small amounts of short-term data (generally less than oneday for each data point) in both pre- and post-retrofit configurations. Very few of thesedemonstrations have provided long-term data (on the order of months of continuousdata) in the post-retrofit configuration, and none have provided long-term data in thepre-retrofit configuration. The purpose of this program is to provide detailed short- andlong-term pre- and post-retrofit emission data on a number of low NOx combustiontechnologies applied to a wall-fired utility boiler.
The following paragraphs describe the technologies that are to be investigated duringthe four phases of this program, the general methodology used to obtain data, and thegeneral outline of Phase 3A.
2.1 Technology Background
At the completion of the DOE ICCT II program, the following NOx control technologieswill nave been demonstrated and compared to the baseline configuration:
1. Advanced Overfire Air (AOFA),
2. Low NOx Burner (LNB),
3. Combined LNB and AOFA operation, and
4. Advanced digital control methodologies.
Each of the technologies (or combination of technologies) will eventually be comparedto the baseline configuration to ascertain the NOx reduction effectiveness. SouthernCompany Services contracted with Foster Wheeler Energy Corporation to provide thelow NOx burner and AOFA hardware which have been retrofit to Hammond Unit 4.
The baseline configuration is defined as the "as found" configuration of the unit. The "asfound" configuration is further defined as the configuration under which the unit hasoperated in the recent past prior to the retrofit activities. In the case of Hammond Unit 4,this consisted of operation with some existing burner-related problems. The results ofthis baseline effort will be compared to the results for subsequent phases of the overallprogram. The following paragraphs provide an overview of AOFA and LNB retrofits asthey have been incorporated into Unit 4.
2.1.1 Advance Overfire Air System
The standard offering of overfire air ports incorporates combustion air bypass from themain burner windbox through ports above the burners. This secondary combustion air isobtained from an extension of the burner windbox and is generally integral to the mainburner windbox. The portion of the combustion air diverted away from the burnersdrives the primary combustion stoichiometry toward a fuel rich condition whichfacilitates reduction of NOx. The secondary
2-1

combustion air diverted above the burners to the overfire air ports provides sufficient airto complete combustion before the products reach the convective pass.
Studies by EPRI and boiler manufacturers have shown that the standard overfire air(OFA) offerings do not result in optimum NOx reduction due to inadequate mixing ofthe secondary air with the partially combusted products from the fuel rich burner zone.This inadequate mixing limits the effectiveness of the OFA technique. The advancedoverfire air system (AOFA) provided by FWEC incorporates separate (from thewindbox) injection port and duct configurations that are designed to provide increasedsecondary air penetration. Typical standard offerings provide penetration velocitiesapproximately two times the furnace flow velocity. AOFA systems provide increasedpenetration velocities by supplying secondary air from completely separateaerodynamically designed ducts located above the existing burner windbox. The portsthemselves are also designed to provide increased penetration velocities.
For Phase 2, an advanced overfire air system was retrofit to the unit. This retrofitconsisted of additional of ductwork, dampers, various instrumentation and controls, andAOFA ports above the top row of burners on the front and rear walls of the furnace. Theoverfire air is extracted from the two main secondary air ducts between the air flowventuris and the entrance to the combustion air windbox (east and west sides of theboiler). Figure 2-l depicts the major components of the AOFA system.
2.1.2 Low NOx Burners
For Phases 3A and 3B, FWEC supplied their Controlled Flow/Split Flame (CF/SF) burnerfor retrofit into the existing wall penetrations of the 24 Intervane burners. The CF/SFburner was originally developed for use on the San Juan Unit 1 of the Public ServiceCompany of New Mexico in the mid-1970s. Subsequent to that development,modifications of the burner have been incorporated into new boilers and more recentlyinto older boilers to comply with the Clean Air Act Amendments of l 990. Figure 2-2schematically illustrates the CF/SF burner.
As with all of the manufacturers of new low NOx burners, FWEC's burners utilize theprinciple of separating the fuel and air streams in the primary combustion zone. Uniquedesign features of the CF/SF burner allow low NOx operation with shorter flames thanmay result from other wall-fired burner manufacturers' concepts. These "internally"staged burners accomplish NOx reduction in a manner similar to that accomplished withoverfire air, but much more efficiently. Internally staged burners result in significantlybetter-mixed final products of combustion than do overfire air ports. This low NOxburner concept was evaluated during Phase 3A of the project. Due to the unique designfeatures of the burner, it can be operated with or without the AOFA system describedabove. The combination of the CF/SF burner operation used in conjunction with theAOFA system will be evaluated during Phase 3B of the project.
2.1.3 Advanced Low NOx Digital Controls
This scope addition to the original project is designed to evaluate and demonstrate theeffectiveness of advanced digital control and optimization strategies use in conjunctionwith above NOx abatement technologies. The testing and utilized during the evaluationof this technology will be similar to that used in prior phases. The technology utilizedand results obtained will be described in future reports.
2-2

Figure 2-1 Hammond Advanced Overfire Air System
Figure 2-2 Controlled Flow/Split Flame Burner
2-3

2.2 Program Test Elements
One of the underlying premises for the structure of the testing efforts in all of the phasesof this project is that short-term tests cannot adequately characterize the true emissionsof a utility boiler. As a consequence of this, the focal point of the test efforts during allphases of this project is long-term testing. Short-term testing is used only to establishtrends that may be used to extrapolate the results of this project to other similar boilers.During this program, the short-term test results are not intended to be used to determinethe relative effectiveness of the retrofitted NOx control technologies. This will beaccomplished by performing statistical analyses of the long-term data. A description ofthe purpose and sequence for each of the three types of testing involved in all phases ofthe project follows.
2.2.1 Short-Term Characterization
Initial short-term testing is generally performed to establish the trends of NOx emissionsunder the most commonly used configurations. While NOx is comprised of NO and NO2,only a small fraction of NOx is NO2 (generally <5%). During this program NO wasmeasured since the NO2 represents a small, actual incremental contribution. To accountfor this small contribution significant instrumentation costs would have to be incurred.Aside from NOx measurements, short-term testing is also used to assess the performanceof the boiler in the normal modes of operation. The characterization testing is dividedinto three elements - diagnostic, performance, and verification tests.
Diagnostic testing involves characterizing the gaseous emissions under three to fourload conditions over the range of operating parameters that might normally beencountered on Unit 4 as well as excursions about these normal conditions. The primaryparameters that were used for characterization were excess oxygen, mill pattern, and millbias. Testing at each of the selected conditions is accomplished during a one- to three-hour period with the unit in a fixed configuration while it is off system load dispatch toensure steady boiler operation.
Performance testing is accomplished at specified loads in configurations recommendedby plant engineering and the vendor and which have been tested during the diagnostictesting. Each of these configurations represents one of the normal modes of operationfor each load condition. The 'nominal" burner settings was based upon initial testing byFWEC. Performance data were recorded during ten- to twelve-hour test periods withthe unit off of system load dispatch to provide steady operating conditions.
Over the 70- to 80-day test period, changes in the unit condition and coal can occur.Verification testing is normally conducted at the end of each of the four test phases forthe purpose of quantifying some of the impacts of these potential changes on the long-term emission characterization. Results of this verification testing can assist in explainingpotential anomalies in the long-term data statistical analysis by comparing diagnosticand verification operating conditions and fuels. The verification tests are conducted in asimilar manner to that of the diagnostic testing described above.
Results from each of these tests in Phase 3A (LNB) are used for comparison with resultsfrom similar testing of the various NOx control technologies undertaken in other projectphases.
2-4

2.2.2 Long-Term Characterization
Long-term testing for each phase is conducted under normal system load dispatchcontrol conditions with the burners adjusted to the settings established by FWEC.Generally, no intervention with respect to specifying the other operating configurationsor conditions is imposed by test personnel!. The long-term testing provides emission andoperational results that include most if not all of the possible influencing parameters thatcan affect NOx emissions for a boiler ever the long run. These parameters include coalvariability, mill in-service patterns, mill bias ranges, excess oxygen excursions, andequipment conditions as well as many as-yet undetermined influencing parameters.Results from this long-term testing provide a true representation of the emissions fromthe unit. Data for the parameters of interest are recorded continuously (~-minuteaverages) for periods greater than 51 days.
2.3 Phase 3A Test Plan
The Hammond Unit 4 Phase 3A testing effort was begun on July 9, 1991, and completedon October 28, 1992, and included five months of long-term testing. The testing wasinterrupted periodically for various burner repairs and other boiler maintenance work.The following briefly describes the test sequence during this period.
2.3.1 Short-Term Characterization Testing
The test plan for Phase 3A short-term characterization incorporated four load pointsranging from 180 to 480 MW which duplicated the testing range of Phases 1 and 2.
The Phase 3A diagnostic test matrix for Unit 4 was performed over the period from July9, 1991 to January 15, 1992. This diagnostic test matrix included the basic testconditions shown in Table 2-1. Each of these tests was performed over a duration offrom one to three hours.
Table 2-1 Diagnostic Test Matrix
Load, MW Mill pattern Number of Tests480 All Mills in Service 28400 All Mills in Service 10300 3 MOOS Patterns 19180 2 MOOS Patterns 7
The performance portion of the short-term characterization tests included tests at 300,400 and 480 MW load levels, and was performed from July 16 through July 28, 1991,with some interruption for LOI testing. Based on those brief LOI tests, the subsequentperformance tests were conducted at lower mill primary air/fuel ratios than werepreviously employed.
Subsequent to the completion of the short-term diagnostic and performance testing, ashort program was initiated to investigate the impact of burner and boiler relatedvariables on the LOI and NOx emissions. To ascertain the relationship between specificboiler operating parameters (i.e. excess O2, mill bias and burner settings) under the Phase3A configuration (LNB alone), parametric tests were performed at 450 MW withvariations in the listed operating parameters, while measuring the loss-on-ignition (LOI)and carbon content of the ash entering the ESP. Forty tests were conducted betweenOctober 20 and 28, l 992. For each test condition ash samples were obtained from botheconomizer exit ducts and analyzed on-site for LOI. Each ash sample
2-5

was subsequently analyzed for elemental carbon content. Southern Research Instituteobtained the ash samples and performed the analyses. Each day of testing FlameRefractories set the mills to the desired operating point (coal and primary air flows) anddetermined the particle size distribution within each burner coal pipe.
2.3.2 Long-Term Characterization Testing
Long-term characterization testing began in August 1991 and was completed inDecember 1991. During this period a substantial amount of continuous emission datawas collected. During this period, 94 days of valid long-term data were collected.
2.3.3 Verification Testing
A portion of the diagnostic testing was conducted near the conclusion of the Phase 3Atest effort and served as the verification test. Based upon the verification testing resultsfrom Phases 1 and 2, it was expected that no significant shift in NOx emissionscharacteristics were likely to have occurred during the Phase 3A long-termcharacterization period. This was confirmed by the diagnostic testing.
2-6

3. Test Procedures And Measurements
A wide variety of measurement apparatus and procedures were employed during thetest program described in Section 2. The acquisition of data can be convenientlygrouped into four broad data categories relating to the equipment and procedures used.These are: manual boiler data collection, automated boiler data collection, combustionsystems tests, and solid/sulfur emissions tests. A brief description of each data categoryfollows.
Manual Boiler Data Collection
Data were recorded manually onto data forms based on readings from plant instrumentsand controls. The data were subsequently entered manually into a computer datamanagement program. Coal, bottom ash, and ESP hopper ash (which was takenseparately from inlet and outlet hoppers on both east and west sides of the ESP) sampleswere collected regularly for subsequent laboratory analysis. In addition to the datareadings taken during Phase 1, readings of burner damper settings were recorded duringPhase 3A.
Automated Boiler Data Collection
Two scanning data loggers were installed to record the signals both from pre-existingplant instrumentation and from instruments installed specifically for this test program.The data loggers were monitored by a central computer that maintained permanentrecords of the data and also allowed instantaneous, real-time interface with the dataacquisition equipment. In addition to the measurements provided in Phase 1, signalswere recorded from four OFA flow meters, one in each OFA windbox quadrant duringPhase 3A. This was done to document the low OFA flow rate due to leakage throughthe nominally closed OFA flow control dampers.
Specialized instrumentation was also installed to measure some specific parametersrelated to the combustion and thermal performance of the boiler, as well as selectedgaseous pollutant emissions. These included combustion gas analyzers, pollutantemissions analyzers, an acoustic pyrometer system to measure furnace temperaturecontours across a plane in the upper furnace, fluxdomes to measure heat flux at selectedpoints on the boiler wall, and continuous ash samplers. The combustion gas andemissions analyzers and the acoustic pyrometer system were linked to the centralcomputer for automated data recording.
Combustion System Tests
At several specific operating conditions tests were performed by a team of engineersfrom Flame Refractories, Inc. using specialized apparatus and procedures to measureparameters related to the combustion and thermal performance of the boiler. Themeasurements included the following:
Primary Air/Fuel SupplyPrimary air flow rate to each millPrimary air velocity to each burnerCoal flow rate to each burnerCoal particle size distribution to each burner
3-1

Secondary Air SupplySecondary air flow and temperatures, east/westSecondary air flow and temperatures, front/rear windboxes
Overfire Air SupplyOFA flow to each quadrant of OFA (Front and rear/east and west)
Furnace Combustion GasesGas temperatures near furnace exitGas species near furnace exit
Boiler EfficiencyExit gas temperaturesExit gas excess O2Unburned carbon losses
Solid/Sulfur Emissions Tests
During the performance tests, a team of scientists and technicians from SoRI mademeasurements of particulate and gaseous emissions exiting the boiler, using specializedequipment and procedures. These measurements included:
• Total particulate emissions and particle sizes
• Fly ash resistivity at the ESP inlet
• SO2 and S03 concentrations
The results of the solid/sulfur emissions tests are to be used in calculations to estimatethe effect of NOx controls on the performance of a generic ESP representative of largeutility installations.
Special LOI Tests
Because of the interest in identifying the major parameters that affect the fly ash LOIand the NOx emissions related to burner settings and excess oxygen levels, a special setof LOI tests were performed. The principal objective of this effort was to determinewhether the carbon content of the fly ash could be reduced by simple adjustments tothe boiler operation without substantially increasing NOx emissions or any otheradverse condition. Flame first evaluated the existing primary air and coal flows to eachmill and the resulting effects on coal particle size. From these initial tests Flamerecommended that revised primary air/fuel ratios be used. With these revised ratios,ETEC conducted a series of tests with variations in several boiler operating parameters,one at a time. The parameters varied were:
• Bias of coal flow to selected mills
• Burner inner and outer vane positions and coal nozzle insertion depth
• Overall boiler excess O2
At each of the first two parameter variations (mill bias or burner setting) at least threeexcess O2 levels were tested. At each test condition, SoRI personnel obtained ashsamples using two
3-2

identical EPA Method 17 particulate probes and sample trains. SoRI analyzed eachsample for LOI on-site, within 24 hours. Subsequently, each sample was analyzed forelemental carbon content at the SoRI laboratory in Birmingham, Alabama. For each dayof testing, Flame measured the primary air flow to each mill and the coal flow rate andparticle size distribution within each coal pipe. During a single day's testing, the mill coaland air flow controls were maintained constant. A single coal sample was obtained eachday for composition analysis at the Alabama Power Company fuel laboratory inBirmingham. All testing was done at a nominal load of 450 MW with the AOFA flowcontrol dampers barely cracked open to admit a minimum of cooling air flow to theAOFA ports, as recommended by FWEC. Simultaneously with the particulate andcoal/air measurements, NOx, excess O2. and CO were measured in the economizerexhaust ducts, along with the large array of boiler operating parameters recorded on theDAS and by control room readings.
3-3

4. Data Analysis Methodology
Two distinctly different types of data analyses are utilized to characterize the data:discrete analyses for short-term data, and statistical analysis for long-term data. Theshort-term data are used to establish emission trends, provide information forengineering assessments' and provide data for evaluating guarantees or goalsestablished with the equipment vendors. Long-term data are used to statisticallyestablish the long-term emission trends and regulatory assessments when the unit isoperated in a normal system load dispatch mode.
4.1 Short-Term Characterization Data Analysis
The short-term data collection portion of the project is divided into diagnostic,performance, and verification test efforts. The diagnostic data collection effort is used toestablish the trends of NOx versus load, mill patterns, and excess oxygen. Theperformance data collection effort is used to establish input/output characterizations offuel, air, flue gas emissions, and boiler efficiency. The diagnostic, performance, andverification efforts are performed under well controlled conditions with the unit off ofsystem load dispatch. Each data point is for a single operating condition. Unlike the datacollected in the long-term effort, the data collected during the short-term effort isgenerally not of sufficient quantity to apply sophisticated mathematical analysis. Mostof the analysis of the short-term data is graphical.
4.1.1 Diagnostic Data
Although much more information is obtained, the primary emphasis of the diagnostictesting is to determine the NOx emission characteristics of the unit. The NOx, O2 and COare automatically recorded every five seconds and stored as 5-minute averages in thehistoric files on a computer. The NOx measurements of interest during this element of theshort-term testing are those obtained from the sample flow distribution manifold. Themanifold allows sampling from individual probes or combinations of probes located inthe economizer exit upstream of the primary and secondary air preheaters. Thecomposite emission measurement over the entire economizer exit (average of 28 probes)for the period of a diagnostic test represents a single data point for one configuration.
A single data point is obtained by selecting a probe group and obtaining numerous one-minute averages of the five-second data over the one- to three-hour period of the test.Sampling of one of the groupings is made for a sufficient time to insure that the readingsare steady. The DAS is then prompted to gather data for one minute ( 12 five-secondreadings) and to calculate the statistics for that period (e.g. average and standarddeviation). The average of all of the one-minute average measurements over the testduration constitutes a single data point for NOx for the condition under which the testwas performed.
Early diagnostic test efforts showed that the variability of the NOx emissions wassignificant for seemingly identical conditions, i.e., load, O2. and mill pattern. Since only alimited amount of short-term data were to be collected in the diagnostic effort. the highvariability jeopardized the ability to trend the emissions data adequately. If thediagnostic test effort had included many more data points (requiring significant moretest days), the approach may have provided
4-2

sufficient information to perform experimental design regression analyses. As a result ofthe NOx variability, the test plan reverted to a more or less sequential approach tocollecting emission data, i.e., one load and mill pattern per day with a range of excessoxygen levels measured during steady-state conditions.
During the Phase 3A diagnostic testing, attempts were made to gather three sequentialdata points (either increasing or decreasing excess oxygen level) at each load level (ormill pattern). With three data points on one day with a minimum variation of the otherinfluencing parameters, the general trend of NOx versus load (or mill pattern) could bedetermined. Test points that were not sequential (different loads or mill patterns on thesame day) were used to indicate the potential variability about the trend lines. It isassumed that the trends for these single, non-sequential data points is similar to thatdetermined for sequential data and that families of curves exist. This assumption wastested during Phase 1 and found to be true.
4.1.2 Performance Data
Performance data are used to: (1) to establish baseline evaluation criteria for retrofits, (2)to quantify the boiler characteristics for comparison with other phases of the programand (3) for comparison with the results of the diagnostic trends. The emphasis for theperformance tests was on the analysis of the flows, solids capture, and boiler efficiencyrather than on the NOx trends. As with the diagnostic test data, insufficient data sampleswere available to perform meaningful advanced statistics.
For each performance configuration ( 10- to l 2-hour test day) the following types ofdata were obtained:
1. Two gaseous emission measurements of NOx, O2 and CO, each composed of at leastl 0 one-minute sample distribution manifold composite flue gas measurements,
2. Two ASME PTC 4.1 boiler efficiency determinations and two air preheater leakagedeterminations,
3. A minimum of three repetitions of specific flue gas solids emission parameters (totalparticulate emissions, S03, resistivity, LOI, or particle size), and
4. A minimum of one repetition of inlet fuel and air measurements (primary airdistribution, secondary air distribution, coal particle size, or coal mill pipedistribution), or furnace combustion gas temperature and species.
4.2 Long-Term Characterization Data Analysis
During this portion of the test program, the emission and plant operating data input wasautomatically recorded on the DAS and archived. The emission input was handledautomatically by the CEM. A single emission measurement point in the duct followingthe ESP was monitored 24 hours per day during the entire long-term effort. The emissionsample was brought to the CEM through heated lines to preclude condensation of SO2in the lines. Prior to the start of the Phase 2 long-term test effort, the CEM was certifiedby Spectrum Systems, Inc.
The primary focus of the long-term test effort was to monitor the natural variation of thedata in the normal mode of operation. During the entire long-term effort, no interventionby the SCS test team members (SCS or ETEC) occurred or was for that matter allowed.
4-2

This was to insure that the long-term data would not be biased by this type of input. Forall practice. purposes, the boiler was operating in its normal day-to-day configurationunder control of the load dispatcher. The only added constraint was that the new LNBswould be operated as determined by FWEC personnel.
The thrust of the analysis of the long-term data is its interpretation primarily by statisticalmethods. The specific types of analysis used are related to regulatory issues and theengineering interpretation of long-term results compared to short-term diagnosticsresults. The analyses related to the regulatory issues were associated with thedetermination of the 30-day rolling average and annual average emissions and theestimation of an achievable emission level. The analyses related to the engineeringinterpretations were associated with the determination of the best statistical estimates ofthe operating characteristics, i.e., NOx versus load, mill pattern, etc.
The following two subsections provide information on (1) the processing of the long-term data to produce a valid emission data set and (2) the fundamentals of the data-specific analytic techniques.
4.2.1 Data Set Construction
4.2.2 Five-minute Average Emission Data .
The data collected during the long-term test program consisted of 5-minute averages ofparameters related to boiler operating conditions and emissions. Since the intent of allanalyses of the long-term test periods is to depict normal operating conditions, datacollected during startup, shutdown, and unit trips were excluded from the analyses.
The 5--minute average data are also used to compute hourly averages that are in turnused to compute daily average NOx emissions. The daily average emissions are used toestimate the achievable NOx emission limit.
The loss of 5-minute data due to CEM failure was treated based on an adaptation ofEPA NSPS guidelines for determining how much data is sufficient to compute an hourlyaverage for emissions monitoring purposes. Also, in the case of daily average emissions,EPA NSPS guidelines (at least 18 hours of valid hourly data per day) were used todefine a valid daily average.
4.2.3 Data Analysis Procedures
Five-minute Average Emission Data
The edited 5-minute average data from the long-term tests were used to determine ( I )the NOx versus load relationship and (2) the NOx versus O2 response for various loadlevels.
Hourly Average Emission Data
The purpose of the hourly average emission analyses was to assess the hour-to-hourvariation in NOx, O2. and load for these periods. The within-day data analyses areperformed by sorting the hourly averages by hour of the day and computing theaverage NOx, O2. and load for these periods. The statistical properties for these hourlyperiods and the upper 95 and lower 5 percentile band was determined for each hourlydata subset. These data will be used to compare the effectiveness of each technologyagainst the baseline load scenario.
4-3

Daily Average Emission Data
The daily average emission data are used primarily to establish the trends in NOx O2, andload, and to calculate the 30-day rolling NOx emission levels for the entire long-termperiod. The daily average emissions data were analyzed both graphically andstatistically. The graphical analyses consist of a series of plots to depict the dailyvariations in NOx, O2 and load to establish trends. The purpose of the statistical analyseswas to determine the population mean, variability (standard deviation), distribution form(normal, lognormal), and time series (autocorrelation) properties of the 24-hour averageNOx emissions. The SAS Institute statistical analysis packages UNIVARIATE andAUTOREG were used to perform the statistical analyses.
Achievable Emission Kate
The results of the UNIVARIATE and AUTOREG analyses were used to determine theachievable emission limit on a 30-day rolling average and an annual (block 365 day)basis. The achievable emission limit on a 30-day rolling average basis is defined as thevalue that will be exceeded, on average, no more than one time per ten years. Thiscompliance level is consistent with the level used by EPA in the NSPS Subpart Da andDb rulemakings. The achievable emission limitation for an annual average NOx emissionlimitation was also determined to reflect the requirements of the 1990 amendments to theCAAA. A compliance level of 95 percent was chosen for this case.
The achievable emission limit can be computed analytically using the followingrelationship if the emissions data are normally distributed:
Z = (L - X) / (SAVG)
where: Z = the standard normal deviateL = the emission limitX = the long-term mean, andSAVG = the standard deviation of the 30-day averages. SAVG is computed
using the estimated standard deviation (SDay) and autocorrelation(r) level for daily averages.
For 30-day averages:
Since there are 3,650 thirty-day rolling averages in ten years, one exceedance per ten years isequivalent to a compliance level of (3649/3650), or 0.999726. For a compliance level of one
4-4

violation in ten years, Z is determined to be 3.46 (based upon the cumulative area underthe normal curve). The calculation of the annual average emission limitation is performedin a manner similar to that for the 30-day limitation. For annual averages, a 9S percentcompliance level was arbitrarily chosen. The Z value for 95 percent compliance is 1.645.
4-5

5. Short-Term Test Results
The short-term testing consisted of first performing diagnostic testing to establish thegeneral NOx and operating trends followed by performance testing to establish thecharacteristics of the fuel/air feed systems and the solid and gaseous emissions for themost representative configuration. All tests during both the diagnostic and performanceportions of the short-term test effort were conducted within the normal limits ofoperating parameters for the unit, with the exception of excess oxygen. Excess oxygenwas exercised well above and below the plant specified range to the potential levelsthat might be encountered during transient in the long-term test phase. All major boilercomponents, as well as ancillary equipment, were in the normal "as found" operatingcondition. The fuel burned throughout the Phase 3A short-term program was from thenormal supply source and was handled according to common plant practice. For allPhase 3A testing (LNB without AOFA), the main AOFA guillotine dampers and AOFAporn dampers were left open but the AOFA flow control dampers were nominally"closed", with only sufficient AOFA Bow permitted to provide some cooling for theAOFA ports and dampers to prevent heat damage.
The initial Phase 3A short-term characterization testing was begun on July 9, 1991 andwas completed on January 15, 1992. A total of 52 diagnostic tests were performedduring this period. An additional 40 tests were performed during a special series of LOItests performed from October 20 through 28, 1992. The following paragraphs describethe diagnostic, performance, and LOI testing performed during the Phase 3A effort.
5.1 Diagnostic Tests
The Phase 3A diagnostic effort consisted of characterizing emissions under normaloperating conditions with the LNBs installed and the AOFA flow control dampersnominally closed. Fifty-two tests were performed at nominal loads of 180,300,400, and480 MW. The diagnostic test efforts were interrupted to accomplish the performancetesting due to scheduling conflicts. Diagnostic testing was then completed after theperformance testing and long-term evaluation were completed. The initial diagnostictesting began shortly after FWEC conducted LNB start-up testing was completed. Eachtest condition (load, excess oxygen, and mill configuration) was held steady for a periodof from one to three hours depending upon the type of test performed. During thisperiod, data were collected manually from the control room, automated boileroperational data were recorded on the DAS, and economizer exit and preheater exitspecies and temperatures were recorded utilizing the sample distribution manifold andwere recorded on the DAS. When sufficient time permitted, furnace backpass ash grabsamples were collected from the CEGRIT ash samplers and coal samples were collectedfrom the individual mills.
5.1.1 Unit Operating Condition
During the diagnostic test efforts no unusual operating conditions were encounteredthat placed restrictions on the test effort. Table 5- l presents the "as tested" conditionsduring the diagnostic portion of the testing. Sixteen days of testing were conductedcomprising 52 various excess oxygen, mill pattern, and load conditions. Because historicload profiles indicated much greater operating times at 400 MW and above, mostdiagnostic testing was done in this load range.
5-1

5.1.2 Gaseous Emissions
During both the diagnostic and performance test efforts, flue gas data and boileroperating data were collected on the data acquisition system (DAS). The gas analysissystem (GAS) allowed measurement of NOx, CO, O2 and total hydrocarbons (THC) from48 probe locations within the flue gas stream both upstream and downstream of the airpreheater. Two basic types of tests were performed: (1) overall NOx characterization and(2) economizer exit plane species distribution characterization. The overall NOxcharacterization tests were performed over a period of approximately one hour and wereused to obtain composite average specie concentrations from the individual probes in aduct sampled as a group. In general, the groups were: (1) A-side economizer outlet, (2)B-side economizer outlet, (3) A-side APH outlet and (4) B-side APH outlet compositeconcentrations. The economizer exit plane species distribution characterizations wereperformed over a period of approximately two to three hours. These tests used data fromthe individual probe species concentrations in the A- and B-side economizer exit planesto establish the extent of maldistribution of combustion products emanating from theboiler. These maldistributions, if present, indicate fuel and/or air non-uniformities.
Table 5-2 presents a summary of important emission and operating parameters recordedon the DAS during the diagnostic test effort. These operating parameters provideinformation on the steaming conditions and the fuel supply configuration. The range ofexcess oxygen and resulting NOx emissions for the four nominal load levels testedduring the diagnostic portion of the Phase 3A effort are shown in Figures 5-l and 5-2.The conditions represented in these figures include excess oxygen variation, mill-out-of-service variation, mill biasing, etc. Figure 5-l illustrates that the testing was performedover a range of excess oxygen levels that were both below and above the levelsrecommended for this unit. The solid curve represents the recommended excess oxygenoperating level. During system dispatch control of the unit, excursions to these levels arefrequently experienced during transient load conditions. In order to properly comparethe short-term and long-term characteristics, this O2 excursion testing during the short-term diagnostic effort was required.
Figure 5-2 is a summary of all of the NOx data obtained for all test configurations. Theseconfigurations represented the range of normal configurations that were believed to bethe predominant modes of operation that might be experienced during the normal loaddispatch of the unit during long-term testing. The data scatter is partially due to the factthe different configurations are represented. The shaded area represents the range ofNOx values experienced at excess O2 levels within a ±0.5 percent O2 variation about therecommended O2 level It should be emphasized that analyses performed for datagathered during the long-term testing (Section 6.1 ) where virtually thousands of datapoints were used for the characterization provide a more statistically appropriate NOxband than that presented in Figure 5-2.
5-2

Table 5-1 Summary of Phase 3A Diagnostic TestsTest Date Test conditions Load MOOS Stack Econo Econo CO LOI
NO. O2 O2 Nox E
MW % % ppm ppm %
58-1 7/9/91 HIGH LOAD, AMIS, HIGH O2-LOI TEST 477 NONE 7.1 4.6 508 11 6.9
58-2 7/991 HIGH LOAD, AMIS, NORM OS-LOI TEST 475 NONE 6.5 4.1 480 11 8.1
58-3 7/9/91 HIGH LOAD, AMIS LOW O2-LOI TEST 473 NONE 5.5 2.9 426 67 11.0
59-1 7/10/91 HIGH LOAD, AMIS, HIGH O2-LOI TEST 471 NONE 7.3 5.0 483 12 4.9
59-2 7/10/91 HIGH LOAD, AMIS,NORM O2-LOI TEST 473 NONE 6.4 4.0 441 13 11.0
59-3 7/10/91 HIGH LOAD, AMIS,LOW O2-LOI TEST 475 NONE 5.8 3.1 418 26 12.3
59-4 7/10/91 HIGH LOAD, AMIS,MIN O2-LOI TEST 474 NONE 5.4 2.6 401 127 16.3
59-5 7/10/91 HIGH LOAD, AMIS,LO NORM O2-HVT TEST 474 NONE 6.3 3.7 448 31
60-1 7/11/91 MID LOAD, AMIS, HIGH O2 393 NONE 7.1 4.6 408 11
60-2 7/11/91 MID LOAD, AMIS, NORM O2 398 NONE 6.3 3.9 377 13
60-3 7/11/91 MID LOAD, AMIS, LOW O2 397 NONE 6.0 3.5 360 119
60-4 7/11/91 MAX LOAD, AMIS, NORM O2 GPC HEAT RATE 502 NONE 6.5 4.0 503 4
61-1 7/12/91 MID LOAD, AMIS, REPEAT HIGH O2 392 NONE 7.1 4.7 401 6
61-2 7/12/91 MID LOAD, AMIS, REPEAT NORM 02 392 NONE 6.4 4.1 377 6
61-3 7/12/91 MID LOAD, AMIS, REPEAT LOW O2 390 NONE 5.7 3.2 340 81
61-4 7/12/91 MAX LOAD, AMIS, NORM 02, GPC HEAT RATE 498 NONE 6.4 3.9 480 15
62-1 7/13/91 MID/LOW LOAD, E MOOS, HIGH O2 289 E 9.2 7.1 458 7
62-2 7/13/91 MID/LOW LOAD, E MOOS, MEDIUM O2 291 E 8.1 5.9 424 7
62-3 7/13/91 MID/LOW LOAD, E MOOS, NORM O2 290 E 7.3 4.8 398 9
62-4 7/13/91 MID/LOW LOAD, E MOOS, LOW O2-ABBREV. 289 E - 4.0 375 14
62-5 7/13/91 HIGH LOAD, AMIS, NORM O2 474 NONE 6.9 4.3 471 18
63-1 7/14/91 MID/LOW LOAD, BE MOOS, HIGH O2 302 B&E 8.1 5.8 366 13
63-2 7/14/91 MID/LOW LOAD, BE MOOS, HIGH O2 305 E 8.0 5.7 425 10
63-3 7/14/91 MID/LOW LOAD, BE MOOS, NORM 02 303 E 7.3 4.8 402 26
64-1 7/15/91 HI LOAD, HI/MID O2, AMIS, BALANCED MILLS 467 NONE 7.0 4.6 487 13
64-2 7/15/91 HI LOAD, LOW 02, AMIS BALANCED MILLS 470 NONE 5.9 3.3 426 56
67-1 7/18/91 HI LOAD, AMIS, HI O2-LOI TEST, OPEN INNER REG 472 NONE 6.7 4.3 443 16 12.7
67-2 7/18/91 HI LOAD, AMIS, MID O2-LOI TEST, 471 NONE 6.2 3.6 422 171
67-3 7/18/91 HI LOAD, AMIS, LOW O2-LOI TEST, OPEN OUT REG 470 NONE 6.1 3.5 425 22
67-4 7/18/91 HI LOAD, LOW O2, LOI TEST, UF AIR AT 25% 465 NONE 6.1 3.5 430 16 13.1
68-1 7/19/91 HI LOAD, AMIS-LOI TEST, LOWER PRIM AIR FLOW 460 NONE 6.2 3.5 442 37 8.7
69-1 7/20/91 HI LOAD, AMIS-LOI TEST, MILL FINENESS A-MILL 473 NONE 5.9 3.2 413 19 6.2
69-2 7/20/91 HI LOAD, AMIS-LOI TEST, MILL FINENESS F-MILL 469 NONE 5.9 3.3 448 15
77-1 11/16/91 LOW LOAD, BC-MOOS, HI O2 180 BC 10.8 8.7 413 6
77-2 11/16/91 LOW LOAD, BC-MOOS, HI O2, REPEAT TEST 180 BC 10.6 8.5 428 6
77-3 11/16/91 LOW LOAD, BC-MOOS, MID O2 182 BC 9.9 7.4 416 6
77-4 11/16/91 LOW LOAD, BC-MOOS, LOW O2 185 BC 8.9 6.4 444 5
78-1 11/17/91 LOW LOAD, BE-MOOS, HI O2 181 BE 10.5 8.3 556 5
78-2 11/17/91 LOW LOAD, BE-MOOS, MID O2 183 BE 9.6 7.2 543 5
78-3 11/17/91 LOW LOAD, BE--MOOS, LOW O2 180 BBEE 8.5 5.8 507 5
79-1 11/18/91 MID/LOW LOAD, BE-MOOS, HI O2 305 BE 9.1 7.1 476 9
79-2 11/18/91 MID/LOW LOAD, BE-MOOS, MID O2 305 BE 8.4 6.1 487 9
79-3 11/18/91 MID/LOW LOAD, BE-MOOS, LOW 02 305 BE 7.7 5.3 399 49
80-1 11/18/91 MID/LOW LOAD, EF-MOOS, LOW O2 310 EF 7.3 4.8 333 101
80-2 11/18/91 MID/LOW LOAD, EF-MOOS, MID O2 308 EF 8.5 6.3 405 11
80-3 11/18/91 MID/LOW LOAD, EF-MOOS, MID O2, SLEEVES 50% 310 EF 8.3 6.2 342 14
81-1 1/14/91 MID/LOW LOAD, BE-MOOS, LOW O2 302 BE 7.9 5.0 369 49
81-2 1/14/91 MID/LOW LOAD, BE-MOOS, MID O2 299 BE 9.0 6.5 438 10
81-3 1/14/91 MID/LOW LOAD, BE-MOOS, HI O2 301 BE 9.6 7.0 445 10
82-1 1/15/91 MID LOAD, AMIS, LOW O2 395 NONE 6.8 3.8 395 74
82-2 1/15/91 MID LOAD, AMIS, MID O2 395 NONE 7.4 4.5 427 5
82-3 1/15/91 MID LOAD, AMIS, HI O2 395 NONE 8.1 5.4 464 4
5-3

Table 5-2 Diagnostic Tests / Emissions and Operating DataTest Date Gross O2 Econ. O2 Econ. CEM O2 CEM NOx Opacity Mill A Mill B Mill C Mill D M
Number Load East (Plant) West (Plant) % lb/MBtu % Flow Flow Flow Flow
MW % % klb/hr klb/hr klb/hr klb/hr k
58-1 7/9/91 477 3.8 4.1 4.6 0.69 - 54 64 57 55
58-2 7/991 475 3.4 3.7 4.1 0.65 - 64 67 70 62
58-3 7/9/91 473 2.1 2.7 2.9 0.58 - 53 62 57 54
59-1 7/10/91 471 3.9 4.7 5.0 0.66 - 52 62 57 54
59-2 7/10/91 473 2.9 3.7 4.0 0.60 - 52 62 57 54
59-3 7/10/91 475 2.1 3.1 3.1 0.57 - 52 62 56 54
59-4 7/10/91 474 1.7 2.6 2.6 0.55 - 52 62 57 54
59-5 7/10/91 474 2.4 3.7 3.7 0.61 - 52 62 56 54
60-1 7/11/91 393 3.6 4.6 4.6 0.56 - 45 53 48 47
60-2 7/11/91 398 3.0 3.8 3.9 0.51 - 44 52 47 47
60-3 7/11/91 397 2.7 3.2 3.5 0.49 - 44 52 47 47
60-4 7/11/91 502 3.7 2.6 4.0 0.69 - 58 63 57 57
61-1 7/12/91 392 3.7 2.5 4.7 0.55 - 45 49 44 47
61-2 7/12/91 392 3.1 2.9 4.1 0.51 - 45 48 44 48
61-3 7/12/91 390 2.1 2.1 3.2 0.46 - 45 48 44 47
61-4 7/12/91 498 3.5 2.6 3.9 0.65 - 55 57 53 59
62-1 7/13/91 289 4.8 4.2 7.1 0.62 - 42 43 43 44
62-2 7/13/91 291 4.8 4.2 5.9 0.58 - 42 43 43 44
62-3 7/13/91 290 3.9 3.5 4.8 0.54 - 42 43 43 44
62-4 7/13/91 289 3.9 3.5 4.8 0.54 - 42 43 43 44
62-5 7/13/91 474 3.7 3.1 4.3 0.64 - 54 56 53 57
63-1 7/14/91 302 4.5 5.3 5.8 0.50 - 54 0 55 58
63-2 7/14/91 305 4.2 5.4 5.7 0.58 - 40 47 44 47
63-3 7/14/91 303 3.6 4.7 4.8 0.55 - - - - -
64-1 7/15/91 467 4.1 3.0 4.6 0.66 26.9 57 54 53 55
64-2 7/15/91 470 2.8 2.1 3.3 0.58 18.4 57 53 53 54
67-1 7/18/91 472 3.2 3.0 4.3 0.60 23.5 55 57 56 56
67-2 7/18/91 471 2.6 2.3 3.6 0.57 27.0 57 57 57 56
67-3 7/18/91 470 3.0 2.0 3.5 0.58 24.1 55 57 57 56
67-4 7/18/91 465 3.3 2.3 3.5 0.59 20.2 67 64 65 68
68-1 7/19/91 460 3.7 2.3 3.5 0.60 22.3 56 56 45 55
69-1 7/20/91 473 2.4 2.4 3.2 0.56 22.4 56 56 55 55
69-2 7/20/91 469 3.0 2.3 3.3 0.61 23.9 55 56 56 55
77-1 11/16/91 180 8.6 7.8 8.7 0.56 1.4 34 0 0 37
77-2 11/16/91 180 8.4 7.8 8.5 0.58 NA 33 0 0 36
77-3 11/16/91 182 7.2 7.1 7.4 0.57 1.2 35 0 0 32
77-4 11/16/91 185 5.7 7.2 6.4 0.61 1.0 34 0 0 36
78-1 11/17/91 181 7.7 8.3 8.3 0.76 2.2 35 0 33 39
78-2 11/17/91 183 6.6 7.7 7.2 0.74 1.5 35 0 35 39
78-3 11/17/91 180 5.8 6.1 5.8 0.69 1.7 35 0 35 39
79-1 11/18/91 305 6.4 6.7 7.1 0.65 4.7 59 0 55 57
79-2 11/18/91 305 4.8 6.5 6.1 0.66 3.7 58 0 55 57
79-3 11/18/91 305 4.0 5.2 5.3 0.54 3.7 58 0 55 57
80-1 11/18/91 310 3.3 5.7 4.8 0.45 4.6 59 57 53 57
80-2 11/18/91 308 4.8 6.5 6.3 0.55 6.2 59 57 53 57
80-3 11/18/91 310 4.2 6.5 6.2 0.47 6.0 59 57 53 57
81-1 1/14/91 302 3.4 3.2 5.0 0.50 16.6 57 0 57 58
81-2 1/14/91 299 4.8 4.8 6.5 0.60 22.6 56 0 57 58
81-3 1/14/91 301 5.3 5.1 7.0 0.61 25.5 56 0 57 58
82-1 1/15/91 395 3.2 2.2 3.8 0.54 16.9 45 49 45 50
82-2 1/15/91 395 3.7 3.1 4.5 0.58 21.3 45 49 44 50
82-3 1/15/91 395 4.3 3.9 5.4 0.63 24.8 45 49 45 50
5-4
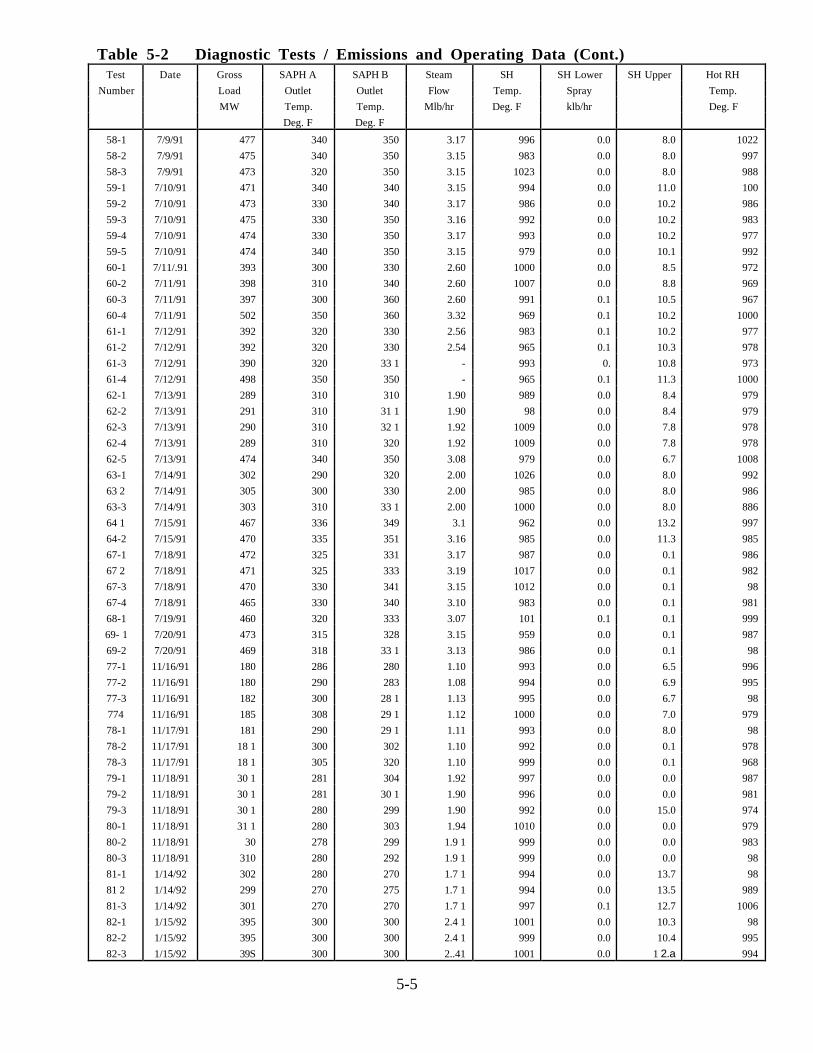
Table 5-2 Diagnostic Tests / Emissions and Operating Data (Cont.)Test Date Gross SAPH A SAPH B Steam SH SH Lower SH Upper Hot RH
Number Load Outlet Outlet Flow Temp. Spray Temp.
MW Temp. Temp. Mlb/hr Deg. F klb/hr Deg. F
Deg. F Deg. F
58-1 7/9/91 477 340 350 3.17 996 0.0 8.0 1022
58-2 7/9/91 475 340 350 3.15 983 0.0 8.0 997
58-3 7/9/91 473 320 350 3.15 1023 0.0 8.0 988
59-1 7/10/91 471 340 340 3.15 994 0.0 11.0 100
59-2 7/10/91 473 330 340 3.17 986 0.0 10.2 986
59-3 7/10/91 475 330 350 3.16 992 0.0 10.2 983
59-4 7/10/91 474 330 350 3.17 993 0.0 10.2 977
59-5 7/10/91 474 340 350 3.15 979 0.0 10.1 992
60-1 7/11/.91 393 300 330 2.60 1000 0.0 8.5 972
60-2 7/11/91 398 310 340 2.60 1007 0.0 8.8 969
60-3 7/11/91 397 300 360 2.60 991 0.1 10.5 967
60-4 7/11/91 502 350 360 3.32 969 0.1 10.2 1000
61-1 7/12/91 392 320 330 2.56 983 0.1 10.2 977
61-2 7/12/91 392 320 330 2.54 965 0.1 10.3 978
61-3 7/12/91 390 320 33 1 - 993 0. 10.8 973
61-4 7/12/91 498 350 350 - 965 0.1 11.3 1000
62-1 7/13/91 289 310 310 1.90 989 0.0 8.4 979
62-2 7/13/91 291 310 31 1 1.90 98 0.0 8.4 979
62-3 7/13/91 290 310 32 1 1.92 1009 0.0 7.8 978
62-4 7/13/91 289 310 320 1.92 1009 0.0 7.8 978
62-5 7/13/91 474 340 350 3.08 979 0.0 6.7 1008
63-1 7/14/91 302 290 320 2.00 1026 0.0 8.0 992
63 2 7/14/91 305 300 330 2.00 985 0.0 8.0 986
63-3 7/14/91 303 310 33 1 2.00 1000 0.0 8.0 886
64 1 7/15/91 467 336 349 3.1 962 0.0 13.2 997
64-2 7/15/91 470 335 351 3.16 985 0.0 11.3 985
67-1 7/18/91 472 325 331 3.17 987 0.0 0.1 986
67 2 7/18/91 471 325 333 3.19 1017 0.0 0.1 982
67-3 7/18/91 470 330 341 3.15 1012 0.0 0.1 98
67-4 7/18/91 465 330 340 3.10 983 0.0 0.1 981
68-1 7/19/91 460 320 333 3.07 101 0.1 0.1 999
69- 1 7/20/91 473 315 328 3.15 959 0.0 0.1 987
69-2 7/20/91 469 318 33 1 3.13 986 0.0 0.1 98
77-1 11/16/91 180 286 280 1.10 993 0.0 6.5 996
77-2 11/16/91 180 290 283 1.08 994 0.0 6.9 995
77-3 11/16/91 182 300 28 1 1.13 995 0.0 6.7 98
774 11/16/91 185 308 29 1 1.12 1000 0.0 7.0 979
78-1 11/17/91 181 290 29 1 1.11 993 0.0 8.0 98
78-2 11/17/91 18 1 300 302 1.10 992 0.0 0.1 978
78-3 11/17/91 18 1 305 320 1.10 999 0.0 0.1 968
79-1 11/18/91 30 1 281 304 1.92 997 0.0 0.0 987
79-2 11/18/91 30 1 281 30 1 1.90 996 0.0 0.0 981
79-3 11/18/91 30 1 280 299 1.90 992 0.0 15.0 974
80-1 11/18/91 31 1 280 303 1.94 1010 0.0 0.0 979
80-2 11/18/91 30 278 299 1.9 1 999 0.0 0.0 983
80-3 11/18/91 310 280 292 1.9 1 999 0.0 0.0 98
81-1 1/14/92 302 280 270 1.7 1 994 0.0 13.7 98
81 2 1/14/92 299 270 275 1.7 1 994 0.0 13.5 989
81-3 1/14/92 301 270 270 1.7 1 997 0.1 12.7 1006
82-1 1/15/92 395 300 300 2.4 1 1001 0.0 10.3 98
82-2 1/15/92 395 300 300 2.4 1 999 0.0 10.4 995
82-3 1/15/92 39S 300 300 2..41 1001 0.0 1 2.a 994
5-5

5-6

Short-term characterization of the NOx emissions generally were made for trendsdetermined on the same day of testing for a particular configuration to eliminate. to someextent, the influence of the uncontrollable parameters. Figures 5-3 through 5-6 show thediagnostic test results for the four nominal loads tested - 480, 400, 300, and 180 MW.
5.2 Performance Tests
Nine performance tests were conducted at nominal gross loads of 480, 400, and 300MW. Testing at each load point required two consecutive days to complete sampling ofall of the parameters included in the performance matrix. At each nominal load the coalfiring rate was kept as constant as possible and the electric load allowed to swingslightly as affected by coal variations, boiler ash deposits, ambient temperature, etc.
Each performance test day covered a period from ten to twelve hours during which timemanual and automated boiler operational data were recorded, fuel and ash samplesacquired, gaseous and solid emissions measurements made, and fly ash resistivitymeasured in-situ.
The initial two performance tests (65 and 66) were performed with the mills set to thenormal primary air/fuel (A/F) ratio as initially recommend by FWEC personnel. Based onprevious LOI results and existing stack opacity readings, the FWEC representative on-site for these tests recommended that some additional diagnostic tests be performed atalternative primary air/fuel ratios and burner air register settings, while taking fly ashsamples for LOI analysis. The performance testing was therefore interrupted for fivedays to plan and perform the desired diagnostic tests (days 67 through 69). Based uponthe results of those tests the performance testing was resumed with reduced primaryair/fuel ratios and minor burner adjustments. Table 5-3 summarizes the conditions ofeach of the nine performance tests.
5.2.1 Unit Operating Data
For each performance test, the desired test conditions were established and allowed tostabilize at least one hour prior to commencement of testing. To the extent possible theactive coal mills were balanced with respect to coal feed rate. Normal primary air/coalratios and mill outlet temperatures were maintained within the capabilities of the existingprimary air system. When the desired operating conditions were established somecontrols were placed in manual mode to minimize fluctuations in fuel and air flows. Thistechnique resulted in extremely stable operation over the test duration with only minoradjustments required to the air flow during the course of the test day.
5 -7

Figure 5-3 Short-Term Tests / NOx Characterization at 480 MW
Figure 5-4 Short-Term Tests / NOx Characterization at 400 MW
5-8

Figure 5-5 Short-Term Tests / NOx Characterization at 300 MW
Figure 5-6 Short-Term Tests / NOx Characterization at 180 MW
5-9

Table 5-3 Summary of Phase 3A Performance Tests
Test Date Test Conditions Load MOOS Stack ECONO ECONO CO Comp Com
No. O2 O2 NOx LOI Carb
MW % % ppm ppm % %7
65-1 7/16/91 Hl LOAD, AMIS 470 NONE 6.4 4.0 458 13 7.6
66-1 7/17/91 Hl LOAD, AMIS 475 NONE 6.3 3.8 452 13
66-2 7117191 Hl LOAD. AMIS 474 NONE 6.5 3.8 460 15
70-1 7/22/91 Hl LOAD. AMIS. REDUCED PRIM. AIR 479 NONE 5.9 3.3 498 19 7.8 7.3
70-2 7/22/91 Hl LOAD. AMIS. REDUCED PRIM. AIR 470 NONE 6.0 3.6 485 32
71-1 7/23/91 Hl LOAD. AMIS, 50% 0UTER REG 473 NONE 6.0 3.5 483 15
71-2 7/23/91 Hl LOAD. AMIS, REDUCED PRIM. AIR 465 NONE 5.9 3.5 496 15
72-1 7124/91 HI LOAD AMIS, REDUCED PRIM. AIR 477 NONE 6.1 3.4 475 17 8.6 8.4
73-1 7/26/91 MID LOAD, AMIS. HI 02 388 NONE 6.5 4.1 400 11 5.4 5.1
73-2 7/26/91 MID LOAD, AMIS. HI 02 389 NONE 6.5 4.1 407 7
74-1 7/27/91 MID LOAD. AMIS, HI 02 403 NONE 6.0 3.8 404 8
74-2 7/27/91 MID L0AD, AMIS, HI 02 405 NONE 5.8 3.6 415 9
75-1 7/28/91 MID/LOW LOAD, E MOOS 299 E 6.6 4.3 347 8 5.8 5.3
76-1 7/28791 MID/LOW LOAD, E MOOS 298 E 6.7 4.5 349 8
5-10

Since a portion of the testing was concerned with measurement of various particulateemission characteristics, it was decided that soot blowing (both furnace and airpreheaters) should be suspended during the particulate sampling periods so that the testmeasurements would include only particulate matter actually generated by the coalcombustion at the time of testing (plus any normal attrition of wall or air preheaterdeposits) and not periodic portions of ash loosened by soot blowing. When necessaryfor proper unit operation, air preheaters were blown between repetitions in the solidsemissions sampling.
Table 5-4 presents a summary of important operating parameters recorded during thistest series. The values shown in this table represent averages over the duration of thetest day.
5.2.2 Gaseous Emissions
During the performance tests, gaseous emissions were measured with the CEMoperating in the manual mode. At various times during the performance tests, flue gaswas sampled from selected probes or probe groups in the primary and secondary airpreheater inlet and outlet ducts. These groupings consisted of composites of theindividual east and west economizer exit ducts and individual measurements from eachprobe in these ducts. Composite grouping was performed to establish the overallemission characteristics while the individual probe measurements were made to establishspatial distributions of emission species.
5.2.3 Solid Emissions
Ash particulate emissions were measured both for total mass emission rate and forcharacteristic properties related to ash collection within an ESP. The specificmeasurements and analyses that were performed included: (1) total mass emissions, (2)particle size, (3) chemical composition, and (4) ash resistivity. These measurements weremade immediately after the air preheater.
Total Mass Emissions Total mass emissions reflect both a fraction of the total coal ashinjected into the furnace ( 100 percent minus the ash which drops into the furnacebottom hopper or the economizer hopper), plus most, if not all, of any unburned carbonleaving the flame zone. Table 5-5 presents the results of the Method 17 tests performedat each test condition. For all tests, the sampling rate was within four percent ofisokinetic. The results shown for each test represent the average of three replicatesamples.
As a measure of the degree of completeness of combustion, the ash collected in thecyclone portion of the Method I 7 train for each test was analyzed by two separatemethods for carbon content and loss-on-ignition (LOI). The LOI is considered torepresent carbon content along with volatile solids (sulfates, chlorides, etc) driven offthe analysis procedure. The principal use of the performance test LOI analyses is as areference for comparison with ash samples acquired during other phases of the program.
5-11

Table 5-4 Performance Tests / Operating and Emissions Data
Test Date Gross Plant Plant CEM CEM CEM Opacity Mill A Mill B Mill C Mill D Mill E M
Number Load O2 O2 O2 NOx NOx % Flow Flow Flow Flow Flow F
MW Econ. Econ. % PPM lb/Mtbu klb/hr klb/hr klb/hr klb/hr klb/hr kl
East West
% %
65-1 7/16/91 470 3.8 3.1 4.0 458 0.62 22.1 54 55 55 55 55
66-1 7/17/91 475 3.6 2.7 3.8 452 0.62 2%.9 S4 55 56 55 55
66-2 7/17/91 474 3.2 2.3 3.8 460 0.63 25.4 53 55 55 '5 55
70-1 7/22/91 479 2.6 2.8 3.3 498 0.68 24.1 56 56 55 56 56
70-2 7/22/91 470 2.3 2.8 3.6 485 0.66 16.7 65 58 67 62 60
71-1 7/23/91 473 3.1 2.5 3.5 483 0.66 33.1 55 55 55 55 55
71-2 7/23/91 465 3.0 2.6 3.5 496 0.68 22.3 54 54 53 54 54
72-1 7/24/91 477 2.7 2.0 3.4 475 0.65 28.8 54 5S 55 55 55
73-1 7/26/91 388 3.8 1.8 4.1 400 0.55 20.0 55 55 55 55 55
73-2 7/26/91 389 4.0 1.7 4.1 407 0.55 17.3 55 55 55 55 55
74~1 7/27/91 403 3.7 2.2 3.8 404 0.55 27.1 47 47 47 47 47
74-2 7/27/91 405 3.7 1.S 3.6 415 0.57 19.2 47 47 47 47 47
75- 1 7/28/91 299 5.0 2.4 4.3 347 0.47 16.7 44 41 43 43 0
76-1 7/28/91 298 5.1 3.8 4.5 349 0.48 15.5 43 41 43 43 0
Test Date Gross SAPHA A SAPH B Steam SH SH Lower SH Upper Hot RH
Number Load Outlet Outlet Flow Temp. Spray Spray Temp
MW Temp. Temp. Mlb/hr Deg. F klb/hr klb/hr Deg. F
Deg. F Deg. F
65-1 7/16/91 470 330 335 3.13 994 0.0 0.1
66-1 7/17/91 475 330 325 3.15 991 0.0 0.1
66-2 7/17/91 474 338 335 3.15 1001 0.0 0.1
70-1 7/22/91 479 320 330 3.20 1019 0.0 0.1
70-2 7/22/91 470 328 338 3.14 986 0.0 0.1
71-1 7/23/91 473 312 320 3.15 997 0.0 0.1
71-2 7/23/91 465 325 340 3.11 991 0.0 0.1
72-1 7/24/91 477 320 335 3.22 987 0.0 0.2
73-1 7/26/91 388 310 320 2.53 1021 0.0 0.1
73-2 7/26/91 389 310 325 2.51 1012 0.0 0.1
74~1 7/27/91 403 310 322 2.60 991 0.0 0.1
74-2 7/27/91 405 319 330 2.60 1008 0.0 0.1
75- 1 7/28/91 299 289 303 1.87 1005 0.0 0.1
76-1 7/28/91 298 291 312 1.87 988 0.0 0.1
5-12

Table 5-5 Summary Of Solid Mass Emissions Tests
Test Load 02 Loading Gas Flow Carbon LOINumber MW %, Dry gr/dscf dscfm % %
65 470 4.0 3.39 338,000 7.0 7.670 479 3.4 3.17 323,000 7.3 7.872 477 3.4 3.26 313,000 8.4 8.673 388 4.1 2.83 155,000 5.1 5.475 299 4 3 2.90 965 000 S.3 5.8
Particle Size The particle size distribution, of ash exiting the secondary air preheaterswas determined using a cascade impactor Six samples were obtained for each testcondition. Figure 5-7 shows the particle size distributions for all test loads as the totalpercentage of cumulative mass. Error bars representing the 90 percent confidence limitsare plotted on this figure. For most of the data, the 90 percent confidence interval issmaller than the plotting
symbols. For large particle sizes the confidence band is exaggerated due to theexponential scale. The confidence interval for these points is still in the one percentrange.
The very close agreement of all of the data indicates both excellent replication of testingunder common conditions and also the relatively minor effect of load on the ash particlesize distribution. The total particulate mass collected per unit gas volume sampled in theparticle size tests was comparatively less than in the Method 17 tests. This is attributedto the inability to sample as close to the bottom of the flue gas duct with the impactorprobe as can be done with the Method 17 probe, resulting in the potential failure tocapture some larger particle sizes which may stratify near the duct bottom.
The derivative of cumulative mass with respect, to particle diameter is presented inFigure 5-8. This type of presentation emphasizes the particle size where mass isconcentrated. This format facilitates comparison of the test data from various phases ofthe program and will highlight any significant changes in particle size distribution andpotential effect on ESP performance due to the low NOx retrofits.
Analysis of the particle size data from an initial "high LOI" test (65) and a subsequent"low LOI" test (72) showed that the adjustment of the air/fuel ratios and burner registershad no effect on the fly ash particle size distribution.
Chemical Composition The ESP hopper samples (east and west composites separately)were analyzed for mineral composition and loss-on-ignition (LOI). Table 5-6 presentsthese data and allows a comparison of LOI between the air heater outlet (Method 17)and the ESP hopper chemical analysis.
5-13

Figure 5-7 ESP Inlet Mass Distribution
5-14

Figure 5-8 ESP Inlet Differential Mass Distribution
5-15

Table 5-6 Chemical Analysis of Hopper Samples
Test 65 Test 72 Test 73 Test 75480 MW 480 MW 400 MW 300 MW
Oxide East West East West East West East West
Li 20 0.04 0.04 0.04 0.04 0.04 0.04 0.05 0.05Na2O 0.44 0.44 0.49 0.44 0.54 0.54 0.44 0.49K20 2.8 2.8 2.5 2.7 2.8 2.8 2.8 2.6MgO 1.0 1.0 1.0 1.0 1.0 1.0 1.0 1.0CaO 1.2 1.2 1.2 1.2 0.9 0.9 0.9 1.1Fe2O, 14.6 14.6 14.2 14.6 15.3 14.3 11.4 12.5Al2O, 26.4 27.1 26.9 27.6 26.4 27.0 27.2 27.3SiO2 51.2 50.6 50.8 49.8 51.6 52.1 54.5 53.1TiO2 1.5 1.5 1.5 1.5 1.4 1.5 1.4 1.5P2O5 0.37 0.40 0.34 0.42 0.28 0.28 0.26 0.34SO3 0.16 0.20 0.18 0.19 0.14 0.13 0.20 0.24LOI 3.9 10.5 6.9 4.1 7.7 4.9 14.9 6.5
Average LOI 7.2 5.5 6.3 10. 7
The carbon / LOI data are useful primarily to establish a comparison between baselineand post retrofit results. The precise relation of carbon / LOI content of ash on ESPperformance is not well understood and no current algorithms can confidently predictthe effect of changes in their values on ESP performance. These data will be usefulwhenever an algorithm to correlate ash carbon content with ESP performance isdeveloped.
Fly Ash Resistivity Measurements of in-situ resistivity were made during each LNB testcondition. For each run, two values of resistivity are reported, one measured by thespark method and one measured by the V-I method. Considering the limitations of thetwo measurement techniques, relatively good agreement was observed. Because of thedifficulty in measuring the voltage drop across the dust layer incrementally with the gasspace voltage drop for low resistivities (<1 x 10¹⁰ ohm-cm), the spark data are considereda more reliable indicator of fly ash resistivity and will be used for analysis. The measuredresistivity values correlate closely with values predicted theoretically from the ashmineral content, SO3 concentration, flue gas temperature, and moisture content.
Table 5-7 provides the results of the in-situ ash resistivity measurements made during thetests. The data measured in-situ generally indicate that the resistivity was sufficientlylow not to detrimentally affect ESP operation.
5-16

Table 5-7 In-Situ Ash Resisitivity Results
Temp Laser Field Resistivity Field ResisDate Duct (oF) (mm) (kV/cm) (ohm-cm) (kV/cm) (ohm
480 MW Test7/16/91 West 281 0.73 12.3 8.4E+09 11.3 5.7Test 65 283 0.24 6.3 1.0E+ 11 35.5 1.8
284 0.11 1.6 1.6E+09 6.6 3.3328 0.41 6.1 5.8E+10 31.0 1.6
7/17/91 East 297 0.32 9.4 1.0E+11 8.6 4.3Test 66 306 0.71 11.7 4.8E+10 8.4 4.2
304 0.86 19.2 6.6E+09 10.6 5.37/22/91 East 289 1.31 15.9 9.5E+09 0.6 2.8Test 70 296 0.91 21.2 2.8E+10 6.1 3.0
296 1.24 15.7 2 2E+10 9.3 4.6297 1.11 17.1 1.5E+10 14.8 7.4
7/23/91 West 285 1.61 13.9 1.0E+10 8.9 4.5Test 71 289 1.21 14.9 1.3E+10 13.2 6.6
291 1.11 16.4 1.5E+10 14.9 7.57/24/91 East 289 2.51 8.3 8.6E+09 4.6 2.3Test 72 295 2.00 8.3 1.5E+10 5.3 2.7
294 1.39 13.0 4. lE+09 5.4 2.7Average of 480 MW Data 2. 7E+10 5.8
400 MW Tests7/26/91 East 279 1.76 11.9 4.0E+09 5.8 2.9ETest 73 279 2.02 8.2 8.7E+09 1.9 9.5
280 2.00 12.0 1.6E+01 5.0 2.57/27/91 West 280 1.57 12.4 2.8E+09 7.1 3.5Test 74 282 1.31 13.7 3.6E+09 7.3 3.7
283 1.31 13.0 7.0E+01 5.1 2.6285 1.24 14.5 3.4E+01 10.5 5.2
Average of 400 MW Data 281 4.4 E+10 3.1300 MW Tests
7/28/91 West 271 1.73 9.5 6.3E+09 5.9 2.9Test 75 272 1.63 10.1 6.1E+09 7.1 3.5
273 1.61 9.8 6.9E+09 1.8 9.1275 1.91 8.6 7.8E+09 4.2 2.1
Average of 300 MW Data 273 6.8E+09 2.4
5-17

Figures 5-9 and 5-10 show the variation of ash resistivity with temperature and SO3concentration based on calculations using the Bickelhaupt computer model andmeasured flue gas and fly ash chemical compositions, for the east and west ducts,respectively.
Laboratory resistivity measurements were also run on the ESP hopper samples obtainedduring the LNB test program. Figure 5-11 shows the results for the 480 MW tests,including the effect of the addition of S03. Figure 5-12 shows the results for the 400 and300 MW tests, respectively. These data do not follow precisely the same trendsobserved in the in-situ resistivities. However, the data do indicate that all samples shouldrespond to SO3 in the flue gas environment and produce resistivity values which wouldnot limit ESP performance. This result agrees with the baseline test data.
The LNB resistivity data are contrasted with the baseline data in Table 5-8. The averagespark resistivity for the full load baseline test was somewhat higher than the average forthe full load LNB test. This is probably due to the higher S03 concentrations in the LNBtests, which would tend to overcome the higher temperatures also experienced in theLNB tests. In the baseline case, the reduced SO3 concentrations may be due to the lossof SO: from condensation in the air preheaters or to increased air infiltration around theair preheater seals.
5.2.4 Flue Gas S03 Concentration
Ash resistivity is strongly attenuated by surface films of sulfuric acid produced by theadsorption of SO3 and water vapor from the flue gas. Thus, ash resistivity can besignificant affected by changes in SO3 and water vapor concentration in the flue gas.The concentrations of SO3 measured at the ESP inlet during the LNB tests are given inTable 5-9. Since resistivity is affected by the actual concentration of SO3 present, thevalues are not normalized to a constant oxygen level. However, since SO3 is formed bythe oxidation of SO3, it is reasonable to expect the SO3 concentration to vary withfluctuations in SO2 and O2 levels. As shown in Table 5-9, variations in S03 concentrationdo not necessarily track the variations in SO2 level, i.e., the SO3-to-SO2 ratio is notconstant. In fact, it varied from a low of 0.395 percent to a high of 0.778 percent. Thiscould be explained by fluctuations in O2 during these tests, or by other factors such asvariations in temperature profiles or factors affecting catalytic conversion of SO2 to SO3.
5-18

Figure 5-9 East Duct In-Situ Ash Resistivity
5-19

Figure 5-10 West Duct In-Situ Ash Resistivity
5-20

Figure 5-11 ESP Hopper Ash Resistivity / 480 MW
5-21

Figure 5-12 ESP Hopper Ash Resistivity / 400 MW and 300 MW
5-22

Table 5-8 Effect of Low NOx Burners on In-Situ Re s
Gas In-Situ Resistivity
Load Test Temperature SO 3 H2O Spark V-IMW Condition O F ppm % Method Method
480 Baseline 284 2.3 6.6 4.0E+10 5.0 E+10LNB 294 6.8 7.8 2.7 E+10 5.8 E+10
400 Baseline 273 2.2 6.4 1.1 E+10 3.5 E+10LNB 281 6.3 7.9 4.4 E+09 3.1 E+10
300 Baseline 268 3.3 6.6 4.4 E+09 3.0 E+10LNB 273 4.8 7.5 6.8 E+09 2.4 E+10
Table 5-9 SO x Results
Gas Concentration (pp SO3- to - SO2Temper atur Rat i o
Date Duct oF SO3 SO2 (%)480MW 7 / 16/9 1 West 303 1 049 0.582 T est 65 304 0. 739
305 0. 757306 0. 778
7 / 17/9 1 East 310 0.6 76Test 66 312 0. 719
311 0. 7197/ 22/9 1 East 307 0.396Test 7 0 310
315 0.5 22318 0.5 41
7/ 23/9 1 West 294 0.5 28Test 71 2 95 0.6 22
295 0.658297 0.6 75
7/ 24/9 1 East 299 0.506Test 72 306 0.583
308 0.603312 0.609
Avg. of 4 80 MW D a 301 0.6 15400MW
7/ 26/9 1 East 288 0.5 15Test 7 3 289 0.608
288 0.653 7 / 27/9 1 West 288 0.508
Test 74 2 89 0.634290 0.680291 0.672
Avg. of 4 00 MW D a 289 0.6 15300 MW
7/ 28/9 1 West 277 0. 419Test 7 5 277 0.5 11
277 0.5 45278 0.554
Avg. of 300 MW D a 0.507

5-23

5.2.5 Combustion System Tests
As in the Phase I baseline testing, combustion performance tests were performed at eachof three load levels to document the specific performance parameters related to the fueland air combustion systems. The results of the Phase 3A testing are summarized below.
Mill Performance The air flow to each mill and the particle size and mass flowdistributions of coal to each burner were measured as described in Section 3. Duplicatetests were performed at two load levels (480 and 400 MW). Table 5-10 summarizes theresults of these tests. From Table 5-10 it can be seen that despite the mills being set toapproximately equal coal flows with the boiler controls, the measured coal flows variedconsiderably from mill to mill.
As discussed above, the initial performance tests (65 and 66) were conducted with highprimary air/fuel (A/F) ratios, which were subsequently reduced for the remaining tests(70 through 76). From Table 5-10 it is seen that the initial full-load A/F ratios averagedaround 2.5 (Test 66), whereas the reduced A/F ratios averaged about 2.2 (Tests 71 and72). The A/F ratios increased somewhat as load was reduced to 300 MW in order tomaintain a sufficiently high coal pipe velocity. As in previous tests, mill D requiredsubstantially higher primary air flows in order to avoid mill loading.
During these mill tests, coal fineness was found to be below 70 percent through 200mesh on all mills except for D mill, with E mill achieving 70 percent only marginally attimes. Mill performance was somewhat improved over baseline. As discussed below itwas found that coal fineness has only a minor effect on NOx emissions but a substantialeffect on fly ash LOI/carbon content.
Secondary Air Supply The secondary combustion air flow was measured at twolocations. Table 5-11 presents the results of the flow measurements. The measurementsmade at the venturi throats in the secondary air supply ducts were very repeatable. Themeasurements taken at this location did not suffer from the inadequacies of the windboxflow locations used in previous phases of the program. Thus, there is a high level ofconfidence in the total air flow measurements based upon both the location andrepeatability.
Furnace Measurements Measurements were made of combustion gas temperatures and0: and CO species at eight locations within the boiler furnace furnace nose andconvective pass entrance. Figure 5-13 shows the distribution of temperature and excessoxygen at the 480 MW nominal load point. Species concentrations of O2 madesimultaneously with the temperature measurements indicate a significant stoichiometrynon-uniformity within the furnace, probably due to nonuniformity of coal and air flowsto the individual burners, however, both the temperature and oxygen maldistributionsare less severe than in either Phase 1 or 2. Generally speaking the excess O2 level rangedfrom 2.5 to 5.0 percent. Figures 5-14 and 5-15 illustrate typical temperature and excessoxygen distributions for 400 and 300 MW load, respectively, and exhibit the sametemperature and oxygen trends as at 480 MW. Again, the temperature and oxygendistributions are more uniform than in either Phase 1 or 2. In general, the furnace gastemperatures are roughly 200 to 400°F lower and the O2 levels 2 to 4 percent higherthan prior phases.
5-24

Table 5-10 Summary of Mill Performance TestsTest Unit Load Mill
No. MW Pu~uneter A B C D E F
65-1 480 Measured Coal Flow Klblhr NA NA 68639 49382 56150 NA
Measured PA Flow. Klb/hr 142560 131991 NA 144275 135406 NA
A/F Ratio NA NA NA 2.92 2.41 NA
Avg. Burner Pipe Velocity, FPM 7925 7502 7934 8137 7895 9072
High Pipe Coal Flow, Klb/hr NA NA 20447 20170 14876 13511
Low Pipe Coal Flow KJb/hr NA NA 13558 8219 12276 11207
Avg. Passing 200 Mesh PCT NA NA 64.83 71.04 67.44 65.05
Avg. Passing 50 Mesh PCT NA NA 99.92 97.44 97.84 99.92
66-1 480 Measured Coal Flow Klb/hr 61389 62273 73664 40523 56648 58082
Measured PA Flow Klb/hr 142885 133733 141961 141025 134999 166921
A/F Ratio 2.33 2.15 1.93 3.48 2.38 2.87
Avg. Burner Pipe Velocity. FPM 7912 7638 8279 8307 7617 9450
High Pipe Coal Flow, Klb/hr 18873 16242 22322 11256 14844 24061
Low Pipe Coal Flow. Klb/hr 13056 14830 12874 8667 13806 9024
Avg. Passing 200 Mesh PCT 60.06 63.68 61.95 74.03 68.34 68.81
Avg. Passing 50 Mesh PCT 96.96 97.82 99.92 97.71 97.66 99.91
70-1 480 Measured Coal Flow Klb/br 55155 61315 64754 42182 60132 63585
Measured PA Flow Klb/hr 121859 115962 124642 133426 113199 141513
A/F Ratio 2.21 1.89 1.92 3.16 1.88 2.23
Avg. Burner Pipe Velocity, FPM 7119 6663 7351 7692 6892 8183
High Pipe Coal Flow, Klb/hr 15784 18089 2142 6 12388 15874 23144
Low Pipe Coal Flow, Klb/hr 11249 13030 13324 8332 13374 12536
Avg. Passing 200 Mesh PCT 64.69 65.79 66.32 73.63 70.97 66.35
Ave. Passing 50 Mesh PCT 98.11 98.4 99.95 98.02 98.33 99.96
71-1 480 Measured Coal Flow,. Klb/hr56236 61700 65901 48140 58666 67843
Measured PA Flow, Klb/hr 130001 125450 132442 134923 120490 144364
A/F Ratio 2.31 2.03 2.01 2.8 2.05 2.13
Avg. Burnar Pipe Velocity, FPM 7248 7172 7616 7718 6998 8184
High Pipe Coal Flow, Klb/hr 16873 16055 19224 19559 16220 22340
Low Pipe Coal Flow, Klb/hr 8358 14847 13474 8105 13511 13688
Avg. Passing 200 Mesh PCT 65.55 65.06 66.01 71.63 69.48 65.55
Avg. Passing 50 Mesh PCT 97.88 98.31 99.96 97.92 98.43 99.94
72-1 480 Measured Coal Flow, Klb/hr 60460 63416 69987 50542 62803 72072
Measured PA Flow. Klb/hr 140120 130193 132365 142962 116950 152660
A/F Ralio 2.32 2.05 1.89 2.83 1.86 2.12
Avg. Burner Pipe Velocity, FPM 7487 7579 7949 8040 7126 8377
High Pipe Coal Flow, Klb/hr 17795 17473 19791 18907 18198 26410
Low Pipe Coal Flow, Klb/hr 12054 13372 14901 8689 13358 13207
Avg. Passing 200 Mesh, PCT 60.82 63.57 63.87 70.45 70.02 64.11
Avg. Passing 50 Mesh, PCT 97.23 98.03 99.94 97.68 98.06 99.95
73- 1 400 Measure Coal Flow, Klb/hr 43903 47351 51869 38225 45376 58443
Measured PA Flow, Klb/hr 139700 125822 127975 142814 122927 141809
A/F Ralio 3.18 2.66 2.47 3.74 2.71 2.43
Avg. Burner Pipe Velocity, FPM 7498 7074 7585 7999 7011 7791
High Pipe Coal Flow, Klb/hr 12570 12850 14487 14526 12277 20911
Low Pipe Coal Flow, Klb/hr 9498 10813 10874 8152 10258 11630
Avg. Passing 200 Mech, PCT 66.81 68.08 67.59 74.29 70.48 66.98
Avg Passing 50 Mesh, PCT 98.68 98.97 99.98 98.88 98.18 99.98
74-1 400 Measured Coal Flow, Klb/hr 49137 50405 64058 37902 49641 56793:
Measured PA Flow, Klb/hr 142212 138009 131537 143376 123634 144847
A/F Ralio 2.89 2.74 2.05 3.78 2.49 2.55
Avg. Burner Pipe Velocity, FPM 7612 7425 7696 7792 6853 8023
High Pipe Coal Flow, Klb/hr 13404 113326 19905 14949 13333 18670
Low Pipe Coal Flow, Klb/hr 10866 11556 12357 6558 11715 10792
Avg Passing 200 Mesh, PCT 65 0 5 65 49 65 44 73.45 68.75 67.67
Avg. Passing 50 Mesh, PCT 98.2 2 98 64 99 96 98 65 97 77 99.98

5-25

Table 5-11 Combustion Air Flow Distribution
Secondary Air Primary Air
Test Load Left Right Mill A Mill B Mill C Mill D Mill E Mill F
No. MW Mlb/hr % Mlb/hr % Mlb/hr % Mlb/hr % Mlb/hr % Mlb/hr % Mlb/hr % Mlb/hr %
66-1 480 1 667 42 1.405 35.7 0.143 3.6 0.134 3.4 0.142 3.6 0.141 3.6 0.135 3.4 0.167 4.2
70-1 480 1 706 41 1.677 40.6 0.122 2.9 0.116 2.8 0.125 3.0 0.133 3.2 0.113 2.7 0.142 3.4
71 1 480 1.707 44 1.394 35.8 0.130 3.3 0.125 3.2 0.132 3.4 0.135 3.5 0.12 0 3.1 0.144 3.7
72-1 480 1.573 42 1.359 36.3 0.140 3.7 0.130 3.5 0.132 3.5 0.143 3.8 0.117 3.1 0.153 4.1
73-1 400 1.341 41 1.122 34.4 0.140 4.3 0.126 3.9 0.128 3.9 0.143 4.4 0.123 3.8 0.142 4.3
74-1 400 1.342 39 1.267 36.9 0.142 4.1 0.138 4.0 0.132 3.8 0.143 4.2 0.124 3.6 0 145 4.2
75 1 300 1.066 39 0.966 35.3 0.135 4.9 0.112 4.1 0.120 4.4 0.138 5.1 0.04 6 1.7 0.150 5.5
76.1 300 1.089 40 0.939 34.5 0.133 4.9 0.110 4.0 0.121 4.4 0.133 4.9 0.047 1.7 0.149 5.5
5-26

Figure 5-13 Furnace Exit Temperatures and Oxygen at 480 MW
5-27

Figure 5-14 Furnace Exit Temperatures and Oxygen at 400 MW
5-28

Figure 5-15 Furnace Exit Temperature and Oxygen at 300 MW
5-29

5.2.6 Coal and Ash Analyses
During each of the nine days of Phase 3A performance testing, samples were obtained ofthe coal entering the active mills, fly ash collected in the ESP (east and west sides), andbottom ash collected in the furnace ash pit
The coal samples were analyzed for proximate and ultimate composition, calorific value,grindability and ash fusion properties. Table 5-12 presents the results of these analyses.These analyses show that the coal properties remained consistent over the duration ofthe testing and are similar to the analyses obtained during the Phase 1 effort.
The results of the CEGRIT furnace ash and the furnace bottom ash analyses are shownin Table 5-13. As in the baseline testing (Phase 1), the CEGRIT LOI values were muchhigher than the bottom ash samples except for the 300 MW tests (75 and 76). Theunusually high LOI content in the "A" hopper is believed to be due to dumping of themill pyrite catch (including some spilled coal) into the bottom hopper during this test.
Table 5-12 Performance Tests Coal Analyses (Ultimate Analysis as Received)
Test Date H 2O C H N Cl S ASH O Total HHV VOL FC
Number % % % % % % % % % Btu/lb % %
65-1 7/17/91 6.85 71.18 4.62 1.34 0.01 1.41 9.67 4.93 100.02 12613 33.1 50.4
65-1 7/17/91 14.90 63.98 4.13 1.24 0.02 1.30 10.25 4.20 100.02 11364 29.5 45.4
65-1 7/17/91 4.55 73.11 4.72 1.45 0.02 1.66 9.95 4.55 100.01 12991 34.3 51.2
66-1 7/17/91 4.91 73 13 4.74 1.42 0.02 1.53 9.39 4.88 100.02 13015 32.8 52.9
66-1 7/17/91 4.62 73 54 4.74 1.38 0.02 1.66 9.31 4.75 100.02 13094 32.8 53.2
66-1 7/17/91 4.68 72.93 4.57 1.44 0.03 1.71 9.37 5.30 100.03 13058 32.6 53.4
66-1 7/17/91 3.59 74.71 4.79 1.47 0.02 1.69 9.28 4.47 100.02 13259 33.2 53.9
70-1 7/17/91 4.15 74.47 4.80 1.42 0.02 1.54 9.30 4.32 100.02 13220 32.8 53.7
70-1 7/22/91 4.94 73.88 4.71 1.40 0.02 1.56 9.11 4.40 100.02 13092 32.7 53.3
70-1 7/22/91 5.54 73.29 4.73 1.44 0.02 1.62 8.97 4.40 100.01 13041 32.8 52.7
71-1 7/23/91 4.76 73.71 4.70 1.36 0.02 1.67 9.28 4.52 100.02 13084 33.1 52.8
71-1 7/23/91 4.51 73.96 4.72 1.37 0.01 1.58 9.46 4.41 100.02 13105 33.5 52.5
71-2 7/23/91 4.53 73 94 4.77 1.42 0.01 1.77 9.07 4.50 100.01 13138 33.7 52.7
72-1 7/24/91 5.23 73.10 4.75 1.35 0.01 1.41 9.12 5.05 100.02 12928 33.7 52.0
72~2 7/24/91 6.25 71.41 4.59 1.28 0.01 1.43 9.76 5.28 100.01 12577 31.7 52.3
72~2 7/24/91 6.00 72.66 4.65 1.37 0.01 1.42 8.87 5.02 100.00 12833 32.6 52.5
72~2 7/24/91 6.36 71.64 4.39 1.35 0.01 1.42 9.48 5.36 100.01 12714 32.0 52.1
73-1 7/26/91 5.41 73.50 4.47 1.44 0.01 1.58 8.89 4.45 100.02 13042 32.7 53.0
73-1 7/26/91 5 79 71.72 4.67 1.37 0.01 1.59 9.72 4.96 99.83 12719 32.4 51.9
73-2 7/26/91 5.94 70.56 4.57 1 38 0.01 1.38 10.59 5.21 99.64 12517 31.9 51.3
74-1 7/27/91 4.93 72.76 4.74 1.45 0.01 1.64 10.03 4.45 100.01 12893 32.9 52.2
74-1 7/27/91 5.19 72.31 4.73 1.40 0.01 1.57 9.93 4.86 100.00 12892 32.6 52.3
74-2 7/27/91 5.96 72.29 4.68 1.36 0.01 1.48 9.7 1 4.49 100.01 12854 32.1 522
75-1 7/28/91 6.38 72.48 4.65 1.36 0.01 1.40 9.0 1 4.70 100.00 12775 31.7 52.9
75-1 7/28/91 6.34 72.36 4.65 1 44 0.01 1.47 9.1 5 4.59 100.01 12771 31.9 52.6
76-1 7/28/91 6.21 72.81 4.65 1.41 0.01 1.41 8.8 1 4.51 100.01 12819 32.0 52.8
76-1 7/28/91 5.74 72.99 4 73 1.43 0.01 1.51 9.1 1 4.44 100.00 12938 32.6 52.5
76-1 7/28/91 4.81 72.29 4 50 1a9 0 01 1.47 9.8 1 5.65 100.01 13035 33.1 52.2
76-1 7/28/91 5.71 72.58 4.96 1 46 0.01 1.41 9.21 4.81 100.28 12824 31.6 53.5
Average 5.61 72 53 4.67 1.39 0.01 1.53 9.4 1 4.74 100.00 12869 32.56 52.29
Std. Dev. 1 91 1.87 0.14 0.05 0.01 0 11 0.43 0.36 0.09 339 0.87 1.50
Variance 3.63 3.50 0.02 0.00 0.00 0.01 0.18 0.13 0.0 1 114794 0.76 2.26
5-30

Table 5-13 Performance Tests CEGRIT Ash Analysis
ExcessLoad Oxygen CEGRIT LOI Bottom Ash L01
Test Date MW % % %
65-1 07/16/91 470 4.0 - 5.7 - -65-1 07/16/91 - - - -65-1 07/16/91 - - 2.1 -65-1 07/16/91 - - - 1.866-1 07/17/91 475 3.8 - - - -66-1 07/17/91 474 3.8 - - 2.0 0.070-1 07/22/91 479 3.3 - 4.6 - -70-1 07/22/91 470 3.6 - - 24.770-1 07/23/91 - - - -71-1 07/23/91 473 3.5 - - - -71-1 07/23/91 - - 1.7 2.371-1 07/23/91 465 3.5 - 4.8 - -71-1 07/23/91 - 4.1 - -72-1 07/24/91 477 3.4 - - 2.1 2.772-1 07/24/91 3.0 5.2 - -72-1 07/24/91 - 6.4 - -72-1 07/24/91 - ,- - -73-1 07/26/91 388 4.1 2.4 4.8 - -73-1 07/26/91 - - 2.0 1.673-2 07/26/91 389 4.1 2.3 5.0 - -73-2 07/26/91 - - - -74-1 07/27/91 403 3.8 - - 3.0 0.571-1 07/27/91 2.4 6.1 - -74-1 07/27/91 - - - -74-2 07/27/91 405 3.6 2.3 5.2 - -75-1 07/28/91 299 4.3 2.8 5.8 - -75-1 07/28/91 - - - -75-1 07/28/91 - - 38.0 1.776-1 07/28/91 298 4.5 2.4 5.0 - -76-1 07/28/91 - - 20.2 2.376-1 . 07/28/91 - - - -
5.2.7 Boiler Efficiency
During selected performance tests at each load point, measurements were recorded forthe flue gas temperatures and gaseous species, both upstream and downstream of the airpreheaters, using the DAS and the CEM, for the purpose of calculating the heat lossefficiency. Over several hours of each test, the in-situ O2 probes upstream anddownstream of the air preheater were sampled continuously in sequence. In addition,the gas temperatures in each duct were measured continuously (every 5 seconds- compiled into 5-minute averages) over the entire test duration. Each efficiency test was.approximately 2 hours in duration. CO measurements were obtained from compositesampling of the CEM at discrete intervals over the test duration.
ASME PTC 4.1 type boiler efficiency calculations were made which included losses fordry flue gas, moisture in flue gas (humidity plus moisture in fuel plus hydrogencombustion product), combustibles in fly ash, combustibles in bottom ash (negligible),and radiation loss (standard
5-31

ASME curves). The purpose of the boiler efficiency calculations is to document thePhase 3A boiler efficiencies at specific operating conditions for comparison to theefficiencies determined in other test phases. Thus, the important parameter is any chancein efficiency attributable to the LNB and AOFA retrofits, rather than the absolute valueof efficiency measured. For this reason, some efficiency loss components not related tocombustion (e.g. blowdown, steam properties, etc.) were not considered. However, theheat loss calculations were done based upon the measured calorific value, moisture andchemical composition of the as-fired fuel samples taken during each test.
The results of the efficiency calculations are presented in Table 5- 14. The efficienciesare determined for "as measured" conditions and for "design" air preheater temperatureconditions (normalized). In keeping with the desire to document efficiency at theoperating conditions recommended by FWEC, only the reduced primary air/fuel ratiotests are included in Table 5-14.
Table 5-14 ASME PTC 4.1 Boiler Efficiency
Measured NormalizedTest Load Efficiency Efficiency
Number Date MW Percent Percent72 7/24/91 479 88.6 88.473 7/26/91 388 88.7 88.775 7/28/91 298 88.8 88.8
5.3 Special LOl Tests
Testing to evaluate the effects of various burner and boiler operating settings on LOIand carbon content of ash particulate emissions from Plant Hammond Unit 4 wasconducted between October 15 and 28, 1942. The testing consisted of two separateefforts. The first was performed by Flame to characterize the coal and primary air flowrates through each mill at a nominal load of 450 MW, as well as the coal and primary airdistributions and particle size range in each individual coal pipe. The second test effortwas conducted jointly by ETEC, SoRI, and Spectrum.
Test Methods The methods used in these LOI evaluation tests were identical to themethods used in the diagnostic and performance test efforts. Flame performed the millcoal and air flow and particle size analyses. SoRI utilized Method 17 procedures toobtain the ash samples for both LOI (performed on-site) and carbon (performed at theSoRI laboratories) analyses. In order to expedite the collection of ash samples, SoRIcollected two separate Method 17 samples simultaneously, traversing the ESP inlet ductin opposite directions, but using the same test ports and probe insertion points. In thismanner, duplicate samples could be obtained in about one hour for a single testcondition. Spectrum operated the gas analysis system and data acquisition system torecord gaseous emissions of oxygen, carbon monoxide, and nitrogen oxide from variouspoints in the boiler exit gas stream, as well as numerous boiler operating parameters.ETEC established the boiler operating conditions for each test, recorded control roomand burner front data and coordinated the efforts of SoRI and Spectrum during the LOItesting.
5-32

Test Results The following paragraphs present a summary of the most importantfindings of the test effort.
Mill Characterization Tests Flame performed tests to evaluate the condition of thecoal and primary air supply systems with regard to coal and air flow distributions andcoal particle size in each coal pipe. In addition, Flame also measured the secondary airflows in each duct (east and west) in an attempt to explain an apparent imbalance inthose flows as indicated by plant instrumentation.
The results of the mill characterization testing are shown in Table 5- 15. Severalimportant conclusions can be drawn from this data. First, it is apparent that the newerB&W MPS mills (A, C, E, F) provide excellent fineness, both at the small sizes (passing200 mesh, all better than 70 percent) and the largest sizes (larger than 50 mesh, all lessthan 0.23 percent). The older FWEC MB mills (B & D) provided less than 70 percentpassing 200 mesh, and approximately 2.0 percent remaining on 50 mesh. Second, thereis a large variation in coal flow measured from pipe to pipe for all mills, varying fromabout +8 percent from the mean coal flow for the B mill, to over +30 percent for the Dmill. Third, the D mill had substantially lower coal flow (and higher A/F ratio) than theother mills. This characteristic is consistent with the results observed during the previousPhase 3A performance test series (test days 66 through 73). For the current mill tests, theD mill feeder coal flow, as indicated by the feeder instrumentation, was approximatelythe same as the other mill feeders. The apparent conclusion is that either: (1) the D millfeeder calibration is not correct, or (2) the measurement of the D mill coal flow in theburner pipes is incorrect due to some abnormal flow condition such as roping orchanneling which prevents the capture of a representative coal sample by the Flametechnique. With the exception of the D mill, the A/F ratios were consistently between2.0 and 2.3.
In addition to the mill testing, Flame also measured the total air flow rates through theeast and west secondary air venturi ducts. Although the existing plant air flowinstrumentation indicated a significant imbalance between the two venturi flowmeasurements (1,555,600 lb/hr - west, and 2,214,000 - east), the Flame measurements,made with type "S" pitot tube traverses across the ducts, indicated that the flows wereequal within 0.5 percent (1,651,008 lb/hr-west / 1,642,427-east). Due to the apparenterror in the east plant instrument reading, the plant instrumentation department hasdisconnected the east input to the plant air flow totalizer and is using the west venturiinput only (doubled) to indicate total air flow for control and monitoring purposes.
LOI Testing The intent of the special LOI investigation was to determine the effects ofvarious burner settings and mill operation on the carbon/LOI content of the fly ashleaving the boiler. In order to assess the effects of each selected parameterindependently, a matrix of test conditions was devised such that a single parameterwould be varied during each test day, and to the extent possible, other parameters heldconstant. The main parameters evaluated were, overall boiler excess O., mill coal flowbias, burner inner, and outer register settings, and coal pipe position (insertion depth). Asummary of the parameters tested are shown in Table 5-16. Specifically excluded as avariable parameter was adjustment to the burner slide dampers, which control the totalair flow to each burner. Since there are innumerable variations that could be made to theslide damper settings, which could affect the furnace combustion balance considerably,it was decided that any adjustment to these dampers should constitute a completelyseparate test series. As established by FWEC, the slide damper positions of the outerburners in each row (the A and D burners) were set at the 7 inch position, and the innerburners (B and C) at the 4 inch position.
5-33

The test series was conducted at a nominal load level of 450 MW, with all mills inservice. This was the same condition that the mill coal/air flow and fineness tests wereperformed as described above.
The "baseline" condition for all tests was with equal coal flow to each mill and all burnermechanisms set to the "nominal" positions established by FWEC. Prior to thecommencement of testing, ETEC obtained a listing of all pertinent burner and AOFAdamper settings which constitute the "nominal" condition. FWEC also advised ETECverbally as to proper procedures to be used in operating the burner mechanisms and themaximum degree of movement from "nominal" that should be made. This advice wasfollowed in all subsequent testing. The principal cautions expressed by FWEC, were notto close the inner or outer swirl registers excessively and especially not to withdraw theburner inner coal pipe tips more than 2 inches from the current "nominal" setting of 4inches insertion. The reason for the latter precaution was to prevent exposure of theburner ignitors to excessive radiant heat. Also, FWEC requested that the AOFA flowcontrol dampers not be closed any more than would permit a minimal air flow of 50klb/hr through each of the four dampers, so as to prevent excessive slagging or heatingof the AOFA ports. Examination of the burners revealed that there were clear markingsof the full-open, full-closed and "nominal" positions for the slide dampers, inner andouter registers and coal pipe positions on most burners. However, several of theindicated markings, especially for the inner registers, did not agree with the writtenlistings supplied by FWEC. ETEC assumed that all of the burner markings were correctand recorded the various burner settings throughout the testing program. Since theinner and outer register position indicators were circumferential dials, with only theclosed, open and "nominal" settings indicated by FWEC, ETEC had to estimate thedegree of travel from the nominal position. This was done as a percentage of the totaltravel indicated between the closed and open indications. In all cases, the movementindicators responded properly to the operator actuation of the mechanism. Therefore, itis believed that the indicated positions recorded on the data sheets during the testingreflect a reasonably accurate account of the burner positions relative to the "nominal"positions marked on the burner housings. On each day of testing, coal samples weretaken in accordance with normal plant procedures, a composite sample being obtainedfrom equal samples from each mill feeder.
A total of 40 tests were conducted between October 20 and 28, 1992. Table 5-17summarizes the results of those tests. Tests are numbered according to the format XX-Y,where XX represents the sequential test day since the program began at PlantHammond, and Y represents the sequential test performed on that day.
Four tests were performed with the coal flow to all mills approximately equal, and withall burner settings at their "nominal" positions as established by FWEC. This was thenthe current "baseline" LNB case The boiler excess O2 was varied from a "nominal" value¢f about 4.0 percent (CEM composite economizer outlet average - the plantinstrumentation indicated approximately 2.7 percent O2). to a minimum of 2.8 percent(high CO readings) and a maximum of 4.6 percent (high opacity and ID fan control).Throughout the testing, the plant average O2 reading was consistently 1.0 to 1.5 percentbelow the CEM composite economizer outlet reading. As shown in Figures 5-16 and 5-17, the excess O2 level has a considerable effect on both ash LOI and NOx emissions Thefigures also include data from subsequent test days which reflect the "baseline"condition of all "nominal" burner settings, balanced coal flows to each mill and "minimal"air flow to the AOFA ports (flow control dampers virtually closed off). The lines
5-34

shown in the figures depict linear, least-squares curve fits to the "baseline" data. Thesecurve fits were used to normalize the subsequent parametric data to mitigate the effectsof minor variations in excess O2 on LOI and NOx emissions when comparing the effectsof the other parameters being tested. Figures S-16 and 5-17 also show the resultsobtained when the AOFA dampers were set to their "nominal" open positions (providingapproximately 600 klb/hr of total AOFA air flow) From Figure 5-16 ;t can be seen thatthe use of “nominal" AOFA produces a minor effect on LOI (slightly above theextended curve fit line). Figure 5-17 illustrates that, while the increased AOFA flow(from approximately 200 klb/hr minimum to 600 klb/hr nominal) does reduce NOx belowthe curve fit line substantially, the increased excess O2 required to maintain CO emissionsat a reasonable level results in little or no actual reduction in total NOx emissionscompared to NOx emissions at the lower excess O2 levels possible with reduced or noAOFA flow.
In all of the subsequent figures of LOI and NOx variation with burner settings, theresults are normalized to a consistent excess O2 level by using the slopes of the linearcurve fits determined in Figures 5-16 and 5-17. Thus, the "normalized" values representwhat the LOI or NOx "would have been" if the excess O2 level had been maintainedabsolutely constant.
On two days, adjustments were made to the inner and outer air register positions. Theinner registers were positioned to approximately 20 and 40 percent of their full travelfrom the "nominal" positions. Most of the "nominal" markings were very close to thezero position, so no further closed adjustments were attempted. The outer registers wereadjusted approximately 20 percent more open and more closed than the "nominal"settings (60 percent open). The results of these tests showed that the inner and outerregisters have only a minimal effect on either LOI or NOx within the range ofadjustments made.
In one test series the coal flow to the mills was biased to provide first higher coal flow tothe upper burner levels (mills C and F;) and lower coal flow to the lower burner levels(mills A and E), with the coal flow to the center burners (mills B and D) in between. Allburner settings were normal. Another test was performed with the coal bias reversed, i.e.lower coal flow to the upper burners and higher to the bottom burners. Two tests werealso conducted with balanced flow to all burners (according to the feeder coal flowindicators). Figures 5-18 and 5-19 show the results of these tests. Clearly, the mill biasaffects the LOI substantially while it only affects the NOx emissions moderately.
In another series of tests, the positions of the inner coal pipe tips were adjusted (allburners equally) from the "nominal" position established by FWEC. The "nominal"position was 4 inches insertion from the "zero", or neutral position. In keeping withFWEC's request, the tips were withdrawn only to the 2 inch insertion position so as toprevent excessive thermal radiation exposure to the ignitors. As shown in Table 5-17,four tests were performed, two at the "nominal" setting and one each at the 2 inch and 3inch positions. All other burner settings were at their “nominal" positions and the coalflow was equal to each mill. Figures 5-20 and 5-21 show that LOI was slightlydecreased and NOx slightly increased as the coal pipes were withdrawn to the 2 inchposition.
A summary of the sensitivities is shown in Figure 5-22. As can be seen, for excess O2.mill bias, inner register, and sliding tip, any adjustments to reduce NOx emissions are atthe expense of increased LOI. In contrast, the slope of the outer register characteristicsuggests that an
5-35

improvement in both NOx emissions and LOI can be achieved by adjustment of thisdamper. However, due to the relatively small impact of the outer register adjustment onboth Nox emission and LOI, it is likely that the positive NOx / LOI slope is primarily anartifact of process noise. It should be stressed that Figure 5-22 is a parametric plot andthat neither NOx or LOI are the independent variables.
Table 5-15 NOx vs. LOI I Summary of Mill Performance Tests
October 15,1992Parameter A B C D E F
MEASURED COAL FLOW, KLB/HR 65.1 65.8 71.6 43 72.1 65.3EASURED PAI1JOW, KLB1HR 132.9 145.6 147.5 155.3 151 136.A/F RATIO 2.04 2.21 2.06 3.61 2.09 2.AVG BURNER PIPE VELOCITY, FPM 5288 7276 5836 7814 5993 532HIGH PIPE COAL FLOW, KLB/HR 20.5 18.9 22.5 14.8 20.3 18.LOW PIPE COAL FLOW, KLB/HR 13.1 15.1 14.4 7.3 15.5 12.AVG PASSING 200 MESH.PCT 77.85 65.14 78.89 69.22 78.25 78.8AVG PASSING 50 MESH,PCT 99.98 98.01 99.95 97.93 99.93 99.8
October 15,1992Parameter A B C D E F
MEASURED COAL FLOW, KLB/HR 57.6 62.8 72.5 38.5 71.5 66.1EASURED PAI1JOW, KLB1HR 127.9 146.1 145.1 152.8 149.1 136.8A/F RATIO 2.22 2.33 2 3.97 2.09 2.07AVG BURNER PIPE VELOCITY, FPM 5093 7326 5735 7680 5913 5323HIGH PIPE COAL FLOW, KLB/HR 15.6 18.1 21.1 14 19.5 19.1LOW PIPE COAL FLOW, KLB/HR 13.3 14.4 15.3 6.5 17 13.7AVG PASSING 200 MESH.PCT 81.36 66.85 77.56 68.25 70.44 74.77AVG PASSING 50 MESH,PCT 99.97 98.28 99.98 97.77 99.88 99.92
Table 5-16 NOx vs. LOI / Parameters Tested
Range Tested
Range TestedParametcr Nominal Value Low HighExcess Air 4% 2.8% 5.0%
Inner Register -I5% Nominal Nominal + 40%Outer Register ~60% -20% of nominal +20% of nominal
Sliding Tip +4 inches +2 inches +4 inchesMill Bias No bias Upper Mills +10% Upper Mills -10%
Lower Mills -10% Lower Mills +10%
5-36

Table 5-17 NOx vs. LOI / Test Summary
Burner Settings Emissions
Test Date Load AOFA IR OR CPP Mill O 2 NOx CO LOI Carbon Descr
MW Setting Bias % lb/MBtu ppm % %
92-1 10/20/92 452 MINIMUM NORM NORM NORM NONE 5.6 0.53 15 NA NA BASE92-2 10/20/92 450 MINIMUM NORM NORM NORM BOTTOM 5.6 0.52 20 NA NA COA92-3 10/20/92 450 MINIMUM NORM NORM NORM TOP 5.5 0.50 18 NA NA COA93-1 10/21/92 448 MINIMUM NORM NORM NORM NONE 4.2 0.49 15 7.9 7.0 MED93-2 10/21/92 447 MINIMUM NORM NORM NORM NONE 4.6 0.59 9 4.5 3.4 HIGH93-3 10/21/92 442 MINIMUM NORM NORM NORM NONE 2.8 0.44 130 10.4 9.5 MIN 093-4 10/22/92 442 MINIMUM NORM NORM NORM NONE 3.5 0.49 24 6.6 6.1 MED94-1 10/22/92 443 MINIMUM NORM NORM NORM NONE 3.2 0.44 24 9.3 8.5 BASE94-2 10/22/92 442 MINIMUM +20% NORM NORM NONE 3.5 0.45 69 9.6 8.4 INNE94-3 10/22/92 441 MINIMUM +40% NORM NORM NONE 3.3 0.45 67 8.5 7.5 INNE94-4 10/22/92 441 MINIMUM +40% NORM NORM NONE 3.4 0.45 61 7.5 6.7 INNE94-5 10/22/92 442 MINIMUM NORM NORM NORM NONE 3.5 0.46 86 7.6 6.9 BASE95-1 10/23/92 443 MINIMUM NORM -30% NORM NONE 4.1 0.53 23 5.4 OUTE95-2 10/23/92 445 MINIMUM NORM NORM NORM NONE 4.0 0.52 80 5.7 4.7 BASE95-3 10/23/92 443 MINIMUM NORM +30% NORM UPPER 3.3 0.46 93 6.9 5.0 OUTE95-4 10/23/92 442 MINIMUM NORM NORM NORM NONE 3.9 0.55 32 4.6 6.2 BASE96-1 10/24/92 445 MINIMUM NORM NORM NORM LOWER 4.4 0.50 31 7.7 COAL96-2 10/24/92 441 MINIMUM NORM NORM NORM NONE 4.1 0.51 79 6.6 BASE96-3 10/24/92 440 MINIMUM NORM NORM NORM LOWER 3.9 0.53 100 6.2 6.8 COAL96-4 10/24/92 441 MINIMUM NORM NORM NORM NONE 4.2 0.53 71 6.2 6.0 BASE96-5 10/24/92 440 NORMAL NORM NORM NORM NONE 5.5 0.53 44 4.8 5.5 BASE97-1 10/25/92 447 MINIMUM NORM NORM NORM NONE 4.0 0.51 158 7.8 4.2 BASE97-2 10/25/92 442 MINIMUM NORM NORM 3 NONE 4.0 0.52 113 7.4 COA97-3 10/25/92 441 MINIMUM NORM NORM 2 NONE 4.1 0.55 35 6.3 COA97-4 10/25/92 445 MINIMUM NORM NORM NORM UPPER 4.2 0.51 205 7.0 7.2 BASE98-1 10/26/92 447 MINIMUM NORM NORM NORM NONE 4.2 0.52 14 6.5 5.7 BASE98-2 10/26/92 441 MINIMUM NORM NORM NORM UPPER 4.4 0.51 25 7.8 6.2 COAL98-3 10/26/92 441 MINIMUM NORM NORM 2 NONE 4.3 0.56 15 5.6 COA98-4 10/26/92 440 MINIMUM NORM -20% NORM NONE 4.8 0.57 15 5.1 OUTE98-5 10/26/92 441 MINIMUM NORM NORM NORM NONE 4.4 0.53 66 6.8 5.7 BASE99-1 10/27/92 442 MINIMUM NORM NORM NORM NONE 4.2 0.51 36 5.4 4.9 BASE99-2 10/27/92 445 MINIMUM NORM -20% 2 NONE 4.3 0.56 18 5.0 4.3 COAL99-3 10/27/92 440 MINIMUM NORM -20% 2 NONE 3.6 0.52 153 6.3 6.1 SAME99-4 10/27/92 445 MINIMUM NORM -20% 2 NONE 5.9 0.74 19 2.1 SAM99-5 10/27/92 445 MINIMUM NORM -20% 2 NONE 4.2 0.57 26 4.0 SAM100-1 10/28/92 446 MINIMUM NORM NORM NORM NONE 4.2 0.51 36 4.2 4.4 BASE100-2 10/28/92 442 MINIMUM NORM NORM NORM NONE 3.7 0.48 99 4.8 5.6 BASE100-3 10/28/92 443 MINIMUM NORM NORM NORM NONE 5.0 0.59 17 2.8 1.6 BASE100-4 10/28/92 442 MINIMUM NORM NORM NORM NONE 3.9 0.51 34 4.2 3.6 BASE100-5 10/28/92 443 NORMAL NORM NORM NORM NONE 5.0 0.52 22 3.5 BASE
5-37

Figure 5-16 Nox vs. LOI Testing/LOI vs. O 2
Figure 5-17 Nox vs. LOI Testing / Nox vs. O 2
5-38

Figure 5-18 Nox vs. LOI Testing / LOI vs. Mill Bias
Figure 5-19 Nox vs. LOI Testing / Nox vs. Mill Bias
5-39

Figure 5-20 Nox vs. LOI Testing / LOI vs. Sliding Tip Position
Figure 5-21 Nox vs. LOI Testing / Nox vs. Sliding Tip Position
5-40

Figure 5-22 Nox vs. LOI Testing / All Sensitivities5-41

6. Long-Term Data Analysis
The long-term testing consisted of continuous measurement of operating parameterswhile the unit was under normal load dispatch. This long-term testing was performedfrom August 7 through December 19, 1991. During this period, a number of unitoutages were experienced that resulted in lost days of data capture. However, Thedata capture was sufficient to fully characterize the unit both from an engineeringperspective as well as a regulatory point of view.
The focus of the analysis of this long-term data was:
• Characterization of the daily load and NOx emissions and the within day statistics,
• Characterization of the NOx emissions as a function of the O2 and mill patterns for allfive minute ECEM data,
• Determination of the thirty-day rolling average NOx emissions based upon valid daysand hours of ECEM data,
• Determination of the achievable NOx emission level based upon valid days of ECEMdata, and
• Comparison of long-term results to short-term results.
The following paragraphs describe the major results of these analyses.
6.1 Unit Operating Characteristics
Figures 6-1 and 6-2 illustrate the NOx emissions and the load for the load historyexperienced during the entire long-term test period. From Figure 6-1, it can be seen thatthe five-minute average NOx emissions varied from approximately 0.35 to 0.9 lb/MBtu.It is difficult to determine a trend using this type of data. The data does howeverillustrate that the unit experienced load changes from the minimum operating load (180MW) to the maximum continuous operating load (500 MW) during the entire long-termtest period. In addition, it is evident from this figure that there were prolonged periods oftime that the unit did not operate over 300 MW. This is a significantly different loadscenario than experienced during prior phases.
Based on the long-term emissions data, the daily averages of load and NOx weredetermined and are shown in Figure 6-3. These daily average data were determinedusing the EPA criteria for valid data explained in Section 4. Only days with at least 18hours of data are presented in this figure. During the first half of the long-term testing,the average daily load was generally in excess of 400 MW. Midway in the long-termtest effort, the load decreased to below 300 MW. This unit has been a base loaded unitin the past which was generally the first unit on and the last unit off of dispatch Duringthe Phase 2 test effort, the unit was reclassified within the system and, while still a baseloaded unit, was operated at lower load than in the past. This situation continued intothe Phase 3A test period. For the Phase 3A long-term test period. the daily averageemissions ranged from approximately 0.4 to 0.7 lb/MBTU.
6 - 1

Figure 6-1 Hourly Average Nox Emissions
Figure 6-2 Hourly Average Load
6 - 2

Figure 6-3 Daily Average Load and Nox Characteristics
One method of characterizing the boiler operating characteristics during the long-termtesting is to examine the within-day variation of load and NOx. This was accomplishedby segregating the data by hour of the day, i.e., 0100, 0200,...2400. For these segregateddata, the mean load and NOx were computed. In addition, the hourly valuesrepresenting the lower 5 percent and upper 95 percent of all values were determined.The results of this analysis are shown in Figure 6-4 which illustrates the daily trend forload and NOx emissions over the entire long-term test period. The figure illustrates thatthe unit was operated as a base loaded unit for most of the day (on average 16 hourswere above 300 MW). This is a considerably lower base load than experienced duringthe previous two program phases. It is evident that the NOx versus load characteristic isvery flat. The exact relationship will be illustrated in the following paragraphs.
6.2 Parametric Test Results
For the parametric analyses, all of the valid five-minute data were used. The 5-minuteand hourly average emission data were analyzed to determine the overall relationshipbetween NOx and load and the effect of boiler O2 on NOx emissions for certainfrequently used mill patterns. Since these data were obtained while the unit was undernormal load dispatch, they represent the long-term NOx characteristics.
6-3

Figure 6-4 Diurnal Characteristics
6-4

The NOx versus load relationship was determined by first segregating the 5-minuteaverage load data into 20 MW wide load ranges. Table 6-1 provides the results for thissegregation of the data for the entire long-term data set. The population for each loadrange, as well as the lower five percentile and upper ninety-five percentile are shown forboth load and NOx emission values. Figure 6-5 illustrates the NOx versus load trend forthese data.
Table 6-1 Long-Term Test Statistics / August 7 - December 19, 1991
Load Load Load Excess O2 Excess O2 Excess O2 NOx NOx NOx
Load Sample Lower 5% Average 5% Upper 5% Lower 5% Average 5% Upper 5%Average Average Upper 5
Category Size 5% 5% 5% % 5% 5% % % 5%
170-190 2174 180 185 189 8.5 9.5 10.4 0.44 0.65 0
190-210 1582 191 199 209 8.5 9.6 10.9 0.40 0.58 0
210-Z30 1157 211 220 229 8.2 9.2 10.1 0.42 0.55 0
230-250 1382 231 241 241 8.0 9.0 9.9 0.38 0.50 0
250-270 2068 251 259 261 7.9 8.5 9.8 0.34 0.48 0
270-290 1954 271 281 291 7.7 8.7 10.0 0.38 0.50 0
290-310 8198 292 300 301 7.4 8.4 9.4 0.38 0.47 0
310-330 820 310 318 329 7.5 8.2 9.0 0.43 0.53 0
330-350 511 331 340 341 7 3 8.0 8.8 0.45 0.55 0
350-370 407 351 361 369 6.9 7 7 8.4 0.42 0.54 0
370-390 604 371 380 389 6.8 7.6 8.5 0.41 0.55 0
390-410 1502 391 396 402 6.8 7.3 8.0 0.45 0.57 0
410~430 283 412 422 429 6.3 7.1 8.1 0.46 0.56 0
430-S50 408 431 441 449 6.3 6.9 7.7 0.55 0.60 0
450-470 231 451 459 469 6.3 6.9 7.7 0.57 0.64 0
470~490 670 472 483 489 6.1 6.6 7.3 0.59 0.65 0
490-510 1486 492 501 50E 5.7 6.4 7.1 0.62 0.70 0
*Measurements at stack
The effect of operating O2 on NOx emissions for certain mill patterns was examined forload ranges that corresponded to some of the loads tested during the short-term testportion of the Phase 2 test effort. These ranges were the 180-190, 290-300, 390-400 and470-480 MW ranges. All of the valid five-minute data for these load ranges were usedto assess the impact of excess oxygen level for the most commonly used mill patterns. Inorder to determine the most frequently used patterns, the frequency distribution of themills-in-service pattern was determined. Table 6-2 presents the frequency distribution forthe two most used mill patterns. It is apparent that there are certain preferred millpatterns for each load range. These patterns are dictated by the operational requirementsof the unit (i.e., slag minimization, steam temperature control, etc.).
Prior to commencing the short-term testing effort, discussions with plant operationsindicated that certain mill patterns were the preferred patterns. These patterns were thenused during the diagnostic and performance testing with the intent of comparing theresults with the same patterns during long-term testing. The mill patterns used during theshort-term test effort were the E-, B&E, B&C and E&F-MOOS at loads below 400 M\~.Referring to Table 6-2 it is evident that these patterns were not the most prevalentduring this long-term test effort. As a consequence
6-5

Figure 6-5 Nox vs. Load Characteristics
Table 6-2 Mill Pattern Use Frequency
Average Average AverageLoad Sample O2 NoxMW MOOS Size Percent lb/MBtu186 B,E 1070 9.6 0.69186 C,F 379 9.2 0.63296 B,E 1180 8.4 0.51296 B,C 834 9.0 0.44396 E 717 7.3 0.61396 F 307 7.1 0.48474 NONE 142 6.6 0.64
*Measurements at stack6-6

of this, some comparisons will not be able to be made between the short- and long-termresults discussed later.
All of the valid five-minute load data was analyzed for the most prevalent long-termMOOS patterns for each of the four load categories in order to establish the NOx versusO2 characteristics. The NOx versus O2 relationships for these patterns were evaluatedusing statistical regression techniques. The graphical analysis consists of two separateprocedures. The data were characterized by first segregating the O2 into cells that wereone O2 percentage point wide, i.e., 2.5-3.5, 3.5-4.5,...10.5-1 1.5 percent. The averageNOx and O2 for each O2 cell were calculated and the best fit regression was thencomputed. For each of the average values the 5th to 95th percentile interval wascomputed. Some of the O2 ranges contained only one value. For this condition, it is notpossible to compute the lower 5th and upper 95th percentiles. Consequently, neither theaverage nor the percentiles for these data were included in the analysis.
The results of the above analyses are shown in Figures 6-6 through 6-9. In everyinstance, regardless of the MOOS patterns, the NOx emissions increased as the O2increased or remained relatively flat except at the 180 MW load level. At this load level,the NOx decreased slightly with increased in O2. The NOx variation for each mill patternwas considerably less than that experienced during the previous two phases of theprogram.
6.3 Thirty-day Rolling Averages
The NSPS Subpart Da and Db standards are based upon compliance on a thirty-dayrolling average. While this unit is not required to comply with these standards, it is ofsome value to evaluate the data for Phase 3A on a thirty-day rolling average basis andlater compare it to the results from previous and subsequent phases of the program.Thirty-day rolling average load, NOx, and O2 were computed using the valid hourly dataas defined by the EPA criteria explained in Section 4. These thirty-day rolling averagesare shown in Figure 6-10.
The thirty-day rolling average results shown in Figure 6-10 are only representative ofthe load scenario that was experienced by the unit during this long-term test period.During other periods when the load might be significantly different, the rolling averageswould be expected to be somewhat different. For this particular period, it can be seenthat the 30-day rolling average load was generally in the 300 MW range over the entiredaily long-term effort. In the final report, thirty-day rolling average values will becomputed for a consistent synthesized load scenario. These synthesized results will beused to illustrate the NOx emissions (and reductions) that would be reported on a unit ifit were required to comply on a thirty-day rolling average basis standard.
6.4 Achievable Emission Characterization
EPA in their rulemaking process establishes an achievable emission level based upondaily average data samples obtained from CEMs. Most of this data is from NSPS SubpartDa units or units that used CEMs to obtain data during demonstration programs. Theachievable NOx emission limit on a 30-day rolling average basis is determined using thedescriptive statistics for 24-hour average NOx emissions As discussed in Section 4, theSAS UNIVARIATE and AUTOREG procedures
6-7

Figure 6-6 Nox vs. Excess Oxygen at 180 MW
6-8

Figure 6-7 Nox vs. Excess Oxygen at 290 MW
6-9

Figure 6-8 Nox vs. Excess Oxygen at 390 MW
6-10

Figure 6-9 NOx vs. Excess Oxygen at 480 MW
are used to determine the descriptive statistics for the 24-hour average NOx emissionsdata. The results of the UNIVARIATE and AUTOREG analyses of the 24-hour averageNOx emissions are presented in Table 6-3. The UNIVARIATE analysis indicated that thedaily emissions were normally distributed. The AUTOREG analysis also indicated thatthe day-to-day fluctuations in NOx emissions followed a simple first orderautoregressive model.
Based upon the EPA criteria, the achievable NOx emission limit should only beexceeded, on average, once per 10 years on a 30-day rolling average basis. Theachievable emission depends on the long-term mean, variability, and autocorrelationlevel are shown in Table 6-3. The achievable emission limit is computed using thesevalues as discussed in Section 4. Table 6-4 provides the achievable emission level, basedon the daily values given in Table 6-3. The achievable NOx emission limits shown in thistable, are computed for two conditions - no autocorrelation (ρ = 0) and the estimatedvalue of 0.73 (which indicates highly time dependent data). The assumption in this tableis that the Hammond unit will be operated in the future under similar load dispatching asthat during the baseline test phase.
6-11

Figure 6-10 Thirty-Day Rolling Average
Table 6-3 Descriptive Statistics For Daily Average NOx Emissions
Number of Daily Values 94Average Emissions (lb/MBtu) 0.53Standard Deviation (lb/MBtu) 0.073Distribution NormalFirst Order Autocorrelation (r) 0.73
Table 6-4 Achievable NOx Emission Limit
Autocorrelation Achievable Emission Limit Achievable Emission Limit(lb/MBtu) 30-Day Annual
ρ = 0 0.58 0.54ρ =073 064 0.55
6-12

As explained above under other load scenarios, the thirty-day rolling averages would bedifferent and therefore the achievable emission level would also be different.
It should be noted that the mean, variability, and autocorrelation levels given in Table 6-3 are only estimates. There is an uncertainty level implicit in the estimates of each ofthese statistical parameters. The uncertainty level in the mean is dependent on thevariability. The estimated variability is, to some extent, dependent on the level ofautocorrelation. Thus, uncertainty levels in the descriptive statistics are linked.
6.5 Comparison of Long- and Short-Term NOx Data
Section 5 presented data for the short-term load characteristics. This data included anumber of mill configurations and a range of excess oxygen levels. Similar data wascollected during the long-term effort and is shown in Figure 6-5. The data in Figure 6-5includes all of the configurations normally experienced during the period from lateAugust through December 1991. Figure 6-1 1 provides a comparison between these twosets of data showing the percentiles (upper 95 percent and lower 5 percent) for thelong-term data. From the comparison it is evident that the data obtained during theshort-term efforts was within the upper 95 and lower 5 percentile range. The agreementbetween short-term and long-term data is much better than prior phases.
Figure 6-11 Comparison of Long- and Short-Term NOx Emissions
6-13

The true measure of the effectiveness of the particular NOx control technique isrepresented by the long-term load characteristics. A useful engineering comparison canbe made by comparing the mean value of the baseline and the retrofit loadcharacteristics. Figure 6-12 illustrates the load characteristics for both configurations. Atthe full load, the LNB retrofit resulted in an approximate 48 percent reduction in NOx.Figure 6-13 shows that the effectiveness was generally between 40 and 53 percent overthe useful load range. In the high load range, the effectiveness was above 45 percent.
Figure 6-12 Comparison of Baseline and LNB NOx Emissions
6 - I 4

Figure 6-13 Baseline to LNB Nox Reduction
6 - 1 5

7. Conclusions
The primary objective of the Phase 3A test effort was to establish LNB retrofit NOxemission characteristics under short-term, well controlled conditions and under long-term, normal system load dispatch conditions. In addition, other important performancedata related to the operation of the boiler in this retrofit configuration were documentedfor comparison to those measured during the Phase I baseline test effort. Protocols fordata collection and instrumentation operation were established during Phase 1. Inaddition to this characterization, special LOI tests were performed to establish the impactof burner adjustment changes on NOx and LOI.
The following paragraphs provide brief discussions of the conclusions that can bedrawn from the short-term and the long-term test results as well as from the special LOItests. Conclusions related to the comparison of the short- and long-term results are alsopresented. A brief discussion related to the comparison between Phase I and Phase 3Adata are included. More thorough comparisons will be presented in the final report afterdetailed analyses have been performed.
7.1 Short-term Characterization Tests
The following paragraphs provide a brief description of the major conclusions for thePhase 3A short-term testing.
7.1.1 Diagnostic Test ConclusionsThe conclusions for the diagnostic portion of the testing are based primarily upontesting performed at 300, 400, and 480 MW. The major conclusions for the diagnostictesting are:
• NOx emissions were considerably less variable than for other previous phases of theprogram. The variation was, however, as much as 0.08 lb/MBtu.
• For one operating condition (mill pattern and load), NOx trends could be determinedif O2 excursions were performed on the same day and in a monotonic fashion. Trendsat the same condition on different days exhibited like patterns which were biased byas much as 10 percent. All of the trends for all loads and mill patterns exhibitedincreasing NOx with increasing O2 and the slopes were essentially the same.
• NOx emissions over the load range from 300 to 480 MW increase fromapproximately 0.50 to 0.65 lb/MBtu.
• Since the 185 MW load point was only tested for two days with two different millpatterns, the trend at this load could not readily be established.
7.1.2 Performance Test Conclusions
The performance tests documented the unit characteristics at nominal loads of 300, 400,and 480 MW. Over the 10 to 12 hour period of the individual performance test days, theunit
operated under extremely stable normal operating conditions. The major- conclusionsfor the performance tests are:
7-1

• The NOx scatter evidenced during the diagnostic tests was also present during thetests for nearly identical operating conditions (mill pattern and load).
• Nox and O2 spatial distributions within the economizer exit ducts indicatedsignificant maldistributions in flue gas temperature and O2 levels.
• Primary air flow ranged from 22 to 32 percent at loads of 480 and 300 MW,respectively.
• Furnace exit gas temperatures were generally below 2300°F in the regions of lowexcess oxygen near the furnace nose. O2 measurements at the furnace nose showedsome regions with extremely low levels (well below one percent) in some regions atthe furnace nose.
• Mill coal particle fineness was near the low end of the acceptable range. The coalfineness was determined to be 67 percent average through a 200 mesh screen at 480MW. However, coal fineness during this phase was improved over baseline. Pipe-to-pipe coal flow were +23 to -41 percent from the mean at the full-load point. Primaryair to coal ratio in the mills was +42 to -15 percent from the mean at the same load.
• ESP inlet ash resistivity was within the expected range for this coal. The resistivityremained unchanged from the baseline configuration.
• Fly ash LOI ranged from 5.4 to 8.6 percent over the load range. The LOImeasurements indicated that LOI increased with the use of LNB over that of theoriginal burners.
• At full load, mass loading and gas flow to the ESP increased by approximately 25and 11 percent, respectively, when compared to baseline.
7.2 Long-Term Characterization Tests
Long-term testing took place from early August 1991 through mid December 1991.During this period the ECEM was operated 24 hours per day except during periods ofrepair and calibration. From time-to-time, the instrumentation experienced operationaldifficulties which resulted in lost data capture. These periods were minimal and did notaffect the quality of the remainder of the data. Sufficient data was collected to performmeaningful statistical analyses for both engineering and regulatory purposes.
The following paragraphs provide the major conclusions that can be drawn from thelong-term test results.
• In the past, the unit typically operated at high load for the majority of it's on-line time.The data taken during Phase 3A illustrated that the unit did not now operate at highloads for the majority of the time. Data show that the unit experienced significantperiods of time where the average daily load was in the 300 MW range (60 percentload).
• Daily average NOx emission levels for the long-term test period ranged fromapproximately 0.4 to 0.7 lb/MBtu.
• The mean load characteristics showed that NOx exhibited a decreasing thenincreasing NOx relationship as load was increased. Low load (180 MW) and highload (480 MW) emissions were approximately equal. Ninety percent of the long-termNOx emission data collected was on the order of ± 0.2 lb/MBtu about the mean.
7-2

• Based upon 30-day rolling averages, the data showed that the average load was near300 MW over the period of long-term testing. The 30-day rolling average NOxremained relatively constant at ranging from approximately 0.50 to 0.56 lb/Btu.
• Statistical analyses indicated that the data were autocorrelated with a correlationcoefficient of p = 0.73. The data are more highly autocorrelated than the datacollected in Phase 1 or Phase 2. The time dependent NOx emission characteristicsresulted in a 30-day rolling average achievable emission limit of 0.64 lb/MBtu.
• Subsequent to Phase I testing, the Clean Air Act Amendments of 1990 passedrequiring annual average emission rate limits. Based on data collected during theLND test phase, the average emission rate is 0.55 lb/MBtu.
7.3 Comparison of Phase 1 and Phase 3A Emission Data
The following briefly summarizes the conclusions that can be made with regard to theeffectiveness of the LNB retrofit:
• NOx emissions decreased by 48 percent from the baseline configuration at 480 MW.The emission reduction increased as the load decreased to the 300 MW load pointwhere the reduction was a maximum at approximately 54 percent. The effectivenessdecreased to approximately 35 percent at the low load point of 180 MW.
• LOI emissions increased over the baseline configuration. At the 480 MW load point,the LOI increased by as much as approximately 60 percent to a level near 8 percent.
• Aside from LOI and NOx, all other solid and gaseous emission characteristicsremained near the levels of those for the baseline configuration.
• Particulate mass loading and gas flow rates to the ESP increased as a result of theLNB retrofit.
7.4 Special LOI Test Conclusions
Based on analysis of the test results, the following conclusions were drawn with regardto the impact of operational and burner variations during the special LOI testing
• Excess oxygen is the principal variable influencing both LOI content in the fly ashand NOx emissions.
• NOx and LO1 in ash are inversely related; i.e. NOx increases and LOI decreases withincreasing O2.
• The "nominal" inner register settings established by FWEC (nearly at the "zero"position), results in the minimum LOI emissions and maximum NOx emissions for theconfigurations tested.
• Variations in outer register settings produced only slight changes in both LOI andNOx; LOI increased as the outer registers were closed from the FWEC "nominal"position. NOx was essentially unaffected by outer register position.
7-3

• Coal pipe position had a significant effect on both LOI and NOx. LOI decreased andNOx increased as the coal pipes were withdrawn from the FWEC "nominal" position.
• Biasing of the coal flow toward the lower burners resulted in a significant decrease inLOI and an increase in NOx emissions.
• LOI is a reliable indicator of carbon content in the fly ash for this coal, beingconsistently about 1.1 times the carbon level.
• There is considerable scatter in both LOI and NOx emissions for tests conductedunder "identical" conditions on different days. Thus, it is important that any trends ofLOI and NOx vs. variations in operating parameters be conducted on a single day.
These results are presented as the first indications of the impacts of the burner operatingvariables on LOI and NOx on the Hammond Unit 4. Additional analyses may beperformed subsequently and included in the final project report.
7-4

Bibliography
1) 500 MW Demonstration Of Advanced Wall-Fired Combustion Techniques For TheReduction Of Nitrogen Oxide (NOx) Emissions From Coal-Fired Boilers - Phase IBaseline Tests Report. Southern Company Services, Inc., Birmingham, AL: 1992.
2) 500 MW Demonstration Of Advanced Wall-Fired Combustion Techniques For TheReduction Of Nitrogen Oxide (NOx Emissions From Coal-Fired Boilers - Phase 2Advanced Overfire Air Tests Report. Southern Company Services, Inc., Birmingham,AL: 1992.
3) 500 MW Demonstration Of Advanced Wall-Fired Combustion Techniques For TheReduction Of Nitrogen Oxide (NOx Emissions From Coal-Fired Boilers - Phase 3BLow NOx Burner Tests& Advanced Overfire Air Report (Draft). Southern CompanyServices, Inc., Birmingham, AL: 1993.
4) 500 MW Demonstration Of Advanced Wall-Fired Combustion Techniques For TheReduction Of Nitrogen Oxide (NOX Emissions From Coal-Fired Boilers - FieldChemical Emissions Monitoring: Overfire Air and Overfire Air/Low NOx BurnerOperation Final Report. Southern Company Services, Inc., Birmingham, AL: 1993.
Bibliography- 1