Embed Size (px)
Citation preview

INNOVATION PROFILES OF SPANISH AUTONOMOUS REGIONS
María Auxiliadora de Vicente Finance Economy and Accounting II Department
Jaime Manera Company Economy Department
Francisco José Blanco Applied Economics Department
Alberto Romero Applied Economics Department
Rey Juan Carlos University Paseo Artilleros s/n. | 28032 Madrid Spain
E-mail: [email protected]
KEYWORDS Innovation quality, Electre Tri, Spanish Autonomous Regions, and Innovation Clustering. ABSTRACT
The aim of the following article is to study the process of innovation convergence amongst the Spanish Autonomous Regions. To this end the research has been based on the data analysis from the INE (Spanish National Institute of Statistics) Innovation surveys from 2005 to 2006. The methodology used will allow us to set up an Autonomous Regions Ranking per year, clustering per groups of innovation quality, so we could analyze the evolution of these rankings to reveal the existence of downward/upward trend changes during the period analyzed in the different Spanish Autonomous Regions. It will be set out having into consideration all the data and variables offered by the INE at Autonomous Region level on the enterprise technological innovation survey, so it will be analyzed among other variables the intensity of innovation, the number of innovative enterprises and the number of innovative SMEs. Those classifications will be obtained throughout the application of a non compensatory multicriteria methodology based on outranking relations: Electre Tri method. INTRODUCTION AND LITERATURE SURVEY
Nowadays Spanish economy belongs to the top ten of the largest worldwide economies, according to the World Bank.
Research, development and innovation are the pillars of growth for the most developed economies. Nevertheless there is a significant gap between the position of Spain in relation to Europe concerning the research, development and innovation, R&D&I. Spain has been characterized historically to be under the European R&D&I averages, being the main burden on its economy. According Eurostat the percentage of investment on R&D divided by the GDP in Spain and the European Union (25 Countries) has been respectively in 1995 (0.81, 1.84), in 2000 (0.94, 1.88) and in 2005 (1.13, 1.85). Having into consideration only the 15-EU, fifteen European Union State Members before 1P
stP May 2004,
this is the position of Spain, with 1,07%, related to the 15-EU technological effort, id est, percentage of investment on R&D divided by the GDP:
R&D are key factors to increase the economic growth, although the major driver of the economy, increasing productivity, is the innovation, what means a new way of doing something, with revolutionary changes not only in products, but also in processes or even in marketing or organization. Innovation is a critical add value linked to performance and growth improvements in efficiency.
Proceedings 23rd European Conference on Modelling andSimulation ©ECMS Javier Otamendi, Andrzej Bargiela,José Luis Montes, Luis Miguel Doncel Pedrera (Editors)ISBN: 978-0-9553018-8-9 / ISBN: 978-0-9553018-9-6 (CD)

Following Staff, Luecke and Katz (2003), innovation is “the successful introduction of a new thing or method . . . the embodiment, combination, or synthesis of knowledge in original, relevant, valued new products, processes, or services.” Some of the most significant studies about the importance, definition, and differences from innovation and R&D has been carried out by Schumpeter (1934), Dosi (1982), Freeman (1973), von Hippel (1988), Cooke (1997: 2006), Amabile et al. (1996), Cabral (1998, 2003), Mckeown (2008), Luecke and Katz (2003), Thomke (2003), Fagerberg et al. (2004), Fagerberg (2004), Davila et al. (2006), Sarkar (2007). Not only researchers, but also international organizations have studied the importance of innovation in the economy growth. According to the OECD (2008) innovation is the “creative work undertaken on a systematic basis in order to increase the stock of knowledge, including knowledge of human, culture and society, and the use of this stock of knowledge to devise new applications”. European Commission Green Book, 1996, defined innovation as “the adequate production, assimilation and exportation of the newness in the economic and social domains…” Beyond definitions it must be studied the innovation quantitatively, in order to understand better the contribution of the innovation inputs to the national economies, and the contribution of the different national regions to the national innovation add value to the economy. In this sense there are internationally three main references that give international standard guidelines in the measurement of the innovation: the Frascati Manual from 1963, the OECD Oslo Manual from 1995, and the OECD Oslo Manual from 2005. Following the previous suggestions innovation has been worldwide studied throughout the Global Innovation Index. The World Business/INSEAD Global Innovation Index (GII) was conceived at INSEAD as a formal model to help illuminate the degree to which individual nations and regions are currently responding to the challenge of innovation. The last edition has been published in 2009 by Soumitra Dutta. At European Union level, although the OECD and Cotec Foundation Reports are good data sources, the Statistics EU Agency Eurostat is the most authorized source that measures the evolution of innovation in the EU following the previous manuals. Another very relevant references are the European Innovation Progress Report 2008 and the European innovation scoreboard 2007, both published by the European Commission Inno Policy Trendchart.
As well as Spain has historically a deficits in R&D&I activities as compared to Europe, the European Union has as well a historical R&D&I deficit as compared to the United States and Japan. The following graph shows the contribution of business sector to R&D&I expenditure (GERD) in the three main regions of the world.
Source: Working paper on innovation policy in Spain based on the data bases Eurostat and OCDE. CSIC (2003). The European Union Tstrategic goal for the next decade "of becoming the most competitive and dynamic knowledge-based economy in the world capable of sustainable economic growth with more and better jobs and greater social cohesion" has been set up by the Lisbon European Council in 2000. Within this global objective, the TLisbon Strategy has set as a goal that their average expenditure on R&D should be 3 % of GNP. At a national level, the Spanish National Institute of Statistic coordinated with the Eurostat, and within the framework of the OECD Oslo Manual and the Frascati Manual, measures the technological Innovation in the Spanish Companies. The aim of the present work is to analyze the innovation convergence amongst the Spanish Autonomous Regions, clustering them in three different innovation groups. This study is especially relevant to evaluate the contribution of each Autonomous Region to the growth of the Spanish economy, as well as to the global European Union innovation goal. It has a key importance not only for the previous reasons, but also because clustering the 17 Autonomous Regions in 2005 and 2006 by innovation quality groups, we could analyze its up/downward evolution. Concerning the previous studies on the Spanish R&D&I framework it is relevant to mention the contribution of Muñoz (1999), who explains that the Spainish autarchy take off was apparently independent of the efforts in R&D&I. How innovation varies from one region to another has been analyzed by Acosta and Coronado (1999) and by Baumert and Heijs (2002). Sanz-Menéndez (1997) studied the different efforts made in Spain on science and technology policies.

Previous efforts introduced the national scientific community into the international research area. Quintanilla et al. (1992), Cami et al. (1993; 1997). These innovations had a strong impact on productivity and economic growth. Espinosa de los Monteros et al., 1998; 1999). The most relevant study about the panoramic of the innovation in Spain through the evolution of regional indicators has been carried out in 2007 by M. Gómez, J.M. Zabala and I. Fernández. In this article it has been studied the evolution of quantitative indicators that are related, directly or indirectly, with the innovation processes and the eminently regional perspective in the presentation of the information. It is underlined that in spite of the last statistic improvements and more sophisticated indicators, in many occasions there is no enough regional information available, which would be needed for the improvement of the necessary innovation study in Spain. The Regional System of Innovation studies, such as the Gómez et al. (2008) study and the model that we present in this article, is considered as an useful tool for the study of the economy performance and innovation. Cooke et al. (1997), Doloreux (2002), Doloreux and Parto (2002; 2005). Besides being an important tool to enlarge the understanding of the processes of companies innovation. Asheim and Coenen (2005), Castellaci et al. (2005). Others interesant researches of innovation at a regional level has been carried out by Braczyk et al. (1996), Howells (1999), Landabaso et al. (1999), Morgan and Nauwelaers (1999) and Koschatsky et al. (2000) They are multiple studies that have approached to the measurement of the innovative capacity of the territories either on national, regional, or local level, such as Furman et al. (2002), Archibugi and Coco (2004), Faber and Hesen (2004), Zabala-Iturriagagoitia et al. (2008). That is why one of the main focuses of attention within the related bibliography is linked with the development of the most suitable innovation analysis systems and indicators, such as the Manual of Oslo (2005), Manual of Frascati (1994), Den Hertog et al. (1995) or Leydesdorff (2001). It has been carried out a very significant study about the regional systems of innovation and the knowledge production function with special emphasis on the Spanish case by M. Buesa et al. (2006). It is analyzed the Spanish R&D system throughout a multivariate data analysis. Most outstanding contribution is the identification and analysis of four factors that have an enormous influence in the regional innovation evolution. These factors are: 1. Regional and productive environment for innovation, 2. Role of Universities, 3.
Role of the civil service, and 4. Role of innovating firms. The organization of the process of innovation in the Spanish companies has been analyzed by J. Galende (2008). He concludes his research explaining that the generation of innovation is mainly based on internal activities, especially those activities of R&D (fundamentally technological development), being nowadays the external acquisition a marginal method. During the Franco dictatorship the technology and the science worsened considerably due to diverse causes, to highlight mainly, the international isolation to which was subjected the country, what was difficult to overcome. During this time the technological progress and scientists met one of his more negative stages. On the other hand the creation of the Superior Council of Scientific Investigations (CSIC) didn't suppose the increase of innovation on the Spanish economy. On democracy it has been set up the Center for the Technological and Industrial Development (CDTI), as it has been published the Law of university reform and the general Law of development of the scientific activity and the technological development, as well as the National Plans for R&D. In 1979 innovation efforts were pointed out in the political agenda of the Socialist Party (PSOE), including in their program the political goal of increasing the “public resources devoted to R&D activities, with the hope to drive also an increase in the research and innovation efforts of the private sector.”, as it has been since 1979 included promotion of innovation in Spain in all the agendas of the democratic governments. After Spanish Constitution of 1978 Spain is composed of 17 Autonomous Regions; Galicia, Navarre, Madrid, La Rioja, Aragon, Catalonia, Valencia, Castile-La Mancha, Extremadura, Castile and León, Asturias, Cantabria, Basque Country, Murcia, Andalusia, Balearic Islands and Canary Islands, plus two autonomous cities; Ceuta and Melilla. As there are relevant heterogeneities and divergences between the regions in Spain, the Spanish National Institute of Statistic assesses (last definitive data published for 2006 inT December 2008T) the innovation index in each Autonomous Region, using the following set of eight variables that we decided to include in our model as it is firstly the most authorized innovation data source in Spain, and secondly because it has published a complete and specific survey that provides information on the structure of the innovation processes of companies:

1. Innovative companies: Innovative companies on the total of companies in the Autonomous Regions in 2005.
2. EIN Companies: Innovative companies or with innovations in course or not successful innovations on the total of companies in the Autonomous Regions in 2005.
3. Product innovative companies: Innovative companies in product during the period 2003-2005 regarding the total amount of innovative companies in that period.
4. Process innovative companies: Innovative companies in processes during the period 2003-2005 regarding the total amount of innovative companies in that period.
5. Product and process innovative companies: Innovative companies in product and processes during the period 2003-2005 regarding the total amount of innovative companies in that period.
6. Innovation expenses in less 250 employees: Expense percentage in innovative activities of the companies of less than 250 employees regarding the total expense in innovation.
7. Innovation expenses in 250 employees or more: Expense percentage in innovative activities of the companies with 250 or more employees regarding the total expense in innovation.
8. Intensity of the innovation: ((Expenses in innovation / figure of business) x 100).
Among all the Spanish Autonomous Regions, there are four of them above the national average: Madrid, Catalonia, Navarre and Basque Country. Gómez et al. (2008). The concentration of R&D&I capabilities in Madrid and Catalonia has been historically the main characteristic of the R&D&I Spanish system. Muñoz et al. (2000). For instance, in 1997 Madrid represented the 33% of the Spanish GERD, Catalonia the 21% and the Basque Country the 9%, whilst eleven less developed regions represented only the 32%. INE (1999). Although Moso and Olazarán (2001) estimated that Catalonia and Basque Country lead the R&D&I in Spain, whilst Madrid is at the average R&D&I level, having into consideration previous studies that make comparison between the Spanish Autonomous Regions, including together R&D&I, we could conclude a priory that there is a huge gap in innovation between Madrid-Catalonia and all the others regions. Nevertheless we consider that this is a very complex topic of study, not only because many different determinants have a considerable influence in the innovation performance, but also because it must be analyzed the innovation separately from the R&D.
METHODOLOGY
We have analyzed data from the INE Innovation surveys of 2005 and 2006 (2007 data are not definitive yet) to obtain classifications of Spanish Regions into three groups: very innovative regions, average level innovative regions and lower level innovative regions. To achieve this goal we have worked with a non compensatory, outranking relations based method: Electre Tri. This Electre Tri method has been applied to the result of a principal component analysis (PCA) carried out over the whole set of variables. More specifically, we have done a principal component analysis over the eight variables taken into account, as a result we have obtain two factors. Then we have used Electre Tri to classify the regions into the three categories described above. Electre Tri is a multicriteria decision aid method and thanks to it we are going to decide where regions have to be classified into predefined categories. Electre TRI deals with the issue relating to classifying each alternative into a pre-defined category. Reference alternatives are used to segment criteria into categories: each category is limited below and above by two reference alternatives and each reference alternative thus serves as a border for the two categories, one upper and the other lower. Electre TRI is therefore a method of assigning action (regions) to pre-defined categories (hypothetical reference regions). The assigning of an action (region) “a” results from the comparing of “a” to the profiles (action – regions- reference) that define the limits of categories. To apply Electre Tri to our data we are considering that factors obtained from PCA are criteria and regions are alternatives. Importance parameters for the criteria will be the percentage of variance explained by each factor. CLUSTERING THE SPANISH AUTONOMOUS REGIONS IN FOUR STEPS
In a first step we have done a principal component analysis over the eight variables taken into account to reduce the dimension of the problem and to obtain what will be the future weights of criteria in Electre Tri. As a result we have obtained two factors.
It exists, so much in the year 2005 as in 2006, two critical dimensions when measuring the innovation: Firstly what we’ll call “innovative companies”. In this factor we find high and positive correlations in the following variables: innovative companies (0,985 in 2005 and 0.980 in 2006), EIN Companies (0.988 in 2005 and 0.992 in 2006), Product innovative companies
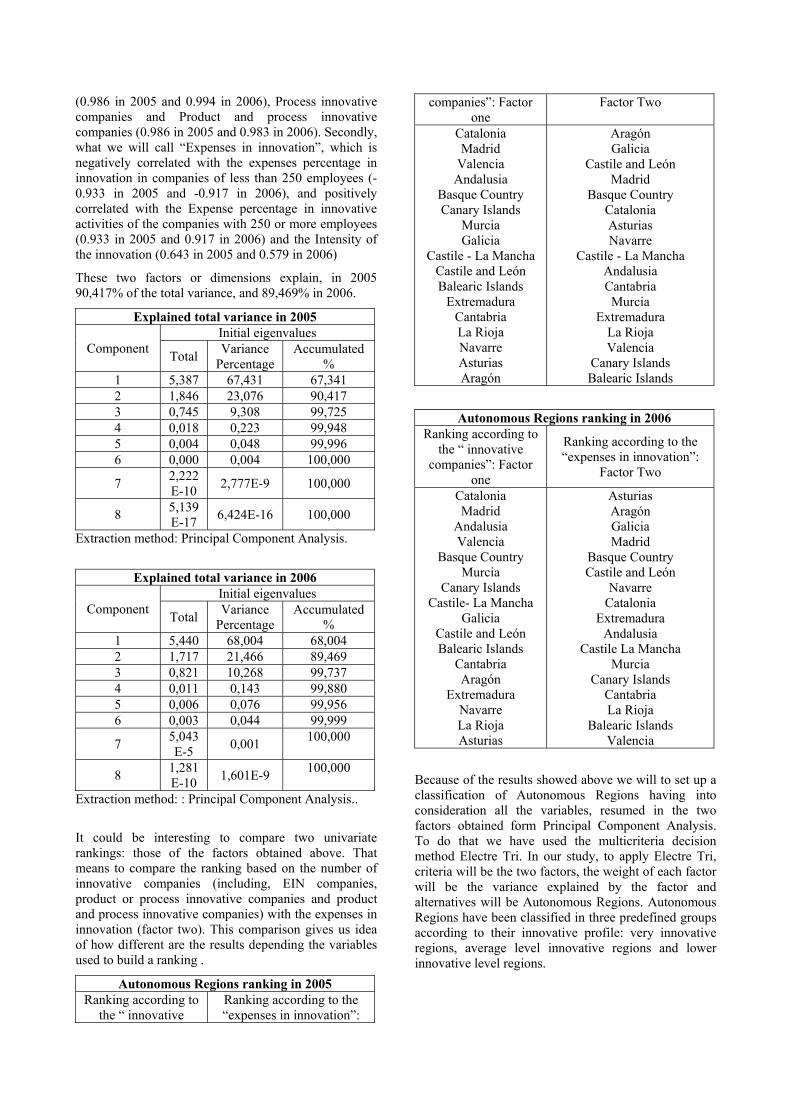
(0.986 in 2005 and 0.994 in 2006), Process innovative companies and Product and process innovative companies (0.986 in 2005 and 0.983 in 2006). Secondly, what we will call “Expenses in innovation”, which is negatively correlated with the expenses percentage in innovation in companies of less than 250 employees (-0.933 in 2005 and -0.917 in 2006), and positively correlated with the Expense percentage in innovative activities of the companies with 250 or more employees (0.933 in 2005 and 0.917 in 2006) and the Intensity of the innovation (0.643 in 2005 and 0.579 in 2006)
These two factors or dimensions explain, in 2005 90,417% of the total variance, and 89,469% in 2006.
Explained total variance in 2005
Component Initial eigenvalues
Total Variance Percentage
Accumulated %
1 5,387 67,431 67,341 2 1,846 23,076 90,417 3 0,745 9,308 99,725 4 0,018 0,223 99,948 5 0,004 0,048 99,996 6 0,000 0,004 100,000
7 2,222E-10 2,777E-9 100,000
8 5,139E-17 6,424E-16 100,000
Extraction method: Principal Component Analysis.
Explained total variance in 2006
Component Initial eigenvalues
Total Variance Percentage
Accumulated %
1 5,440 68,004 68,004 2 1,717 21,466 89,469 3 0,821 10,268 99,737 4 0,011 0,143 99,880 5 0,006 0,076 99,956 6 0,003 0,044 99,999
7 5,043E-5 0,001 100,000
8 1,281E-10 1,601E-9 100,000
Extraction method: : Principal Component Analysis..
It could be interesting to compare two univariate rankings: those of the factors obtained above. That means to compare the ranking based on the number of innovative companies (including, EIN companies, product or process innovative companies and product and process innovative companies) with the expenses in innovation (factor two). This comparison gives us idea of how different are the results depending the variables used to build a ranking .
Autonomous Regions ranking in 2005 Ranking according to
the “ innovative Ranking according to the “expenses in innovation”:
companies”: Factor one
Factor Two
Catalonia Madrid
Valencia Andalusia
Basque Country Canary Islands
Murcia Galicia
Castile - La Mancha Castile and León Balearic Islands
Extremadura Cantabria La Rioja Navarre Asturias Aragón
Aragón Galicia
Castile and León Madrid
Basque Country Catalonia Asturias Navarre
Castile - La Mancha Andalusia Cantabria Murcia
Extremadura La Rioja Valencia
Canary Islands Balearic Islands
Autonomous Regions ranking in 2006 Ranking according to
the “ innovative companies”: Factor
one
Ranking according to the “expenses in innovation”:
Factor Two
Catalonia Madrid
Andalusia Valencia
Basque Country Murcia
Canary Islands Castile- La Mancha
Galicia Castile and León Balearic Islands
Cantabria Aragón
Extremadura Navarre La Rioja Asturias
Asturias Aragón Galicia Madrid
Basque Country Castile and León
Navarre Catalonia
Extremadura Andalusia
Castile La Mancha Murcia
Canary Islands Cantabria La Rioja
Balearic Islands Valencia
Because of the results showed above we will to set up a classification of Autonomous Regions having into consideration all the variables, resumed in the two factors obtained form Principal Component Analysis. To do that we have used the multicriteria decision method Electre Tri. In our study, to apply Electre Tri, criteria will be the two factors, the weight of each factor will be the variance explained by the factor and alternatives will be Autonomous Regions. Autonomous Regions have been classified in three predefined groups according to their innovative profile: very innovative regions, average level innovative regions and lower innovative level regions.

The results of the Electre Tri classifications for 2005 and 2006 are shown below:
Autonomous Regions innovation cluster in 2005 using all variables
Pessimistic Classification
Optimistic Classification
Very innovative
Autonomous Regions
Madrid Basque Country
Andalusia Aragón
Castile and León
Catalonia Valencia Galicia Madrid
Basque Country
Average level innovative
Autonomous Regions
Andalusia Castile and
León Castile and La
Mancha Catalonia Galicia Murcia
Asturias Balearic Islands Canary Islands
Cantabria Castile and la
Mancha Extremadura
Murcia Navarre
Lower innovative
level Autonomous
Regions
Aragón Asturias
Balearic Islands Canary Islands
Cantabria Valencia
Extremadura Navarre
Rioja
Rioja
Autonomous Regions innovation cluster in 2006 using all variables
Pessimistic Classification
Optimistic Classification
Very innovative
Autonomous Regions
Madrid Basque Country
Andalusia Aragón Asturias
Castile and León
Catalonia Valencia Galicia Madrid Murcia
Basque Country
Average level innovative
Autonomous Regions
Andalusia Castille and
León Castile and la
Mancha Catalonia Galicia
Balearic Islands Canary Islands
Castile la Mancha
Extremadura Navarre
Lower Aragón Cantabria
innovative level
Autonomous Regions
Asturias Balearic Islands Canary Islands
Cantabria Valencia
Extremadura Murcia Navarra
Rioja
Rioja
The final cluster of Autonomous Regions shows a pessimistic and optimistic classification in both years 2005 and 2006 within three predefined cluster groups of innovation quality. As it can be observed both classifications don’t match up, which is normal. The usual way to proceed in such cases is to retain the pessimistic classification. Note that Autonomous Regions classified in the same category both in the pessimistic and optimistic classifications are Autonomous Regions with a robust classification (Madrid and Basque Country for example)
So the reader could observe by himself the upward/downward evolution of each Autonomous Region, which reveals the existence of innovation trend changes during the period analyzed in the different Spanish Autonomous Regions. Final cluster agree with the previous studies and shows at the same time very interesting new information about the innovation evolution in the Spanish Autonomous Regions. REFERENCES
Buesa, M., J. Heijs, M. Martínez Pellitero, and T. Baumert. 2006. Regional systems of innovation and the knowledge production function: The spanish case. Technovation 26, (4): 463-72.
Cooke, P., Gómez Uranga, M. y Etxebarria,g. (1997) Regional innovation systems: Institutional and organizational dimensions, Research Policy 26: 475-491.
Cooke, P. y Leydesdorff, L. (2006) Regional Development in the Knowledge-Based Economy: The Construction of Advantage, Journal of Technology Transfer 21: 5-15.
Freeman, C. (1973): A study of success and failure in industrial innovation, Science and Technology in Economic Growth, MacMillan, Londres, 227-245.
Directorate-General, E. INNO-policy TrendChart-policy trends and appraisal report.

Doloreux, D. (2002) What we should know about regional systems of innovation, Technology in Society 24: 243-263.
Galende del Canto, J. 2008. La organización del proceso de innovación en la empresa española. Economía Industrial (368): 169-85.
Gómez Uranga, M., and J. M. Zabala Iturriagagoitia. 2008. Panorámica de la innovación en España a través de la evolución de indicadores regionales. Economía Industrial (368): 125-39.
Hollanders, H. 2007. 2006 European regional innovation scoreboard (2006 RIS). MERIT, Maastricht.
Hollanders, H., and F. Celikel-Esser. 2007. Measuring innovation efficiency. INNO Metrics.
Jiménez-Sáez, F. (2007c) Regional Innovation Systems: How to Assess Performance, Regional Studies 41(5): 661-672.
Lugones, G., F. Peirano, M. Giudicatti, and J. Raffo. 2003. Indicadores de innovación tecnológica. Centro De Estudios Sobre Ciencia, Desarrollo y Educación Superior (REDES), Argentina.
Maystre, L., Pictet, J. y Simos, J. (1994). “Méthodes
Multicritères ELECTRE”. Presses Polytechniques et Universitaires Romandes.
Muñoz E., (1999) “El sistema de investigación en
España. Investigación e Innovación “Arbor, nº 639, pages 391-428.
Muñoz E., M.J. Santesmases and J. Espinosa de los
Monteros (1999) Changing structure, organisation and nature of public research systems. CSIC, Madrid.
OECD (2002), Frascati Manual, Proposed Standard
Practice for Surveys for Research and Experimental Development, 2002, OECD, Paris.
OECD/Eurostat (2005), Oslo Manual, OECD Proposed
Guidelines for Collecting and Interpreting Technological Innovation Data, OECD, Paris.
Quintanilla M.A., A. Bravo, B. Maltrás, J. Molas, M. Vázquez, M. Vega (1992) “El Sistema Español de Ciencia y Tecnología (Proyecto EPOC)”, Arbor, nº 554-555, 233 pages, (febrero-marzo 1992).
Roy, B. y Bouyssou, D. (1993). “Aide Multicritère à la
Décision: Méthodes et Cas”. Economica.
Schumpeter, J. (1934), The Theory of Economic Development, Harvard University Press, Cambridge, Massachusetts.
Staff, H. B. E., R. Luecke, and R. Katz. 2003. Harvard
business essentials: Managing creativity and innovation. Harvard Business School Press.
AUTHOR BIOGRAPHIES
MARÍA AUXILIADORA DE VICENTE studied mathematics and obtained her P.H.D. in Economics at the Complutense University of Madrid. She is full time professor at Rey Juan Carlos University where she has been
doing research on multicriteria decision making and multivariate analysis.. E-mail: [email protected]
JAIME MANERA is a full time professor at Universidad Rey Juan Carlos Carlos of Madrid. His fields of research are International Marketing, Foreign Trade and Multicriteria Decision Making and Technology Transfer. He worked at ICEX, and he has a Ph.D. on
Economics by the Universidad Computense, a M.B.A from the Instituto de Empresa of Madrid, a degree on Foreign Trade, and also he is Geologist. He is author of more than 20 books on marketing, and several scientific papers. E-mail: [email protected]
FRANCISCO JOSÉ BLANCO has a degree in Economics and is PhD in Business and Economics by Universidad Complutense of Madrid. He is teacher (full-time) of Applied Economics at URJC. He has been Deputy Dean at the Faculty of Social and Legal Sciences 2003-2004 and
Deputy vice-Chancellor at Rey Juan Carlos University. 2004- to date. E-mail: [email protected]
ALBERTO ROMERO is Master in Business Administration, Master in International Economic Analysis and Graduated with an award for Excellence in the five years Degree Business Administration and Management at Rey Juan Carlos
University. He worked at the International Telecommunication Union (United Nations) in Geneva and nowadays he is Lecturer at the Applied Economics Department at Rey Juan Carlos University. E-mail: [email protected] Web-page can be found at HThttp://spanisheconomy.weebly.com/ TH