Embed Size (px)
Citation preview

November 2021
Innovation Meets Sustainability:Nasdaq-100 ESG Index™ &
Nasdaq Next Generation 100 ESG Index™

Index Objectives
• Reduce the degree to which the portfolio’s economic value is at risk because of ESG factors, or more technically, aim to significantly improve the portfolio’s ESG score;
• Exclude enterprises that create reputational risks or violate fundamental values;
• Eliminate business exposures that are off-limit for most ESG-conscious investors; and
• Aim to deliver similar performance to the Nasdaq-100® (NDX™)/ Nasdaq Next Generation 100 Index™ (NGX™) (very low tracking error).
2
Index Mechanics
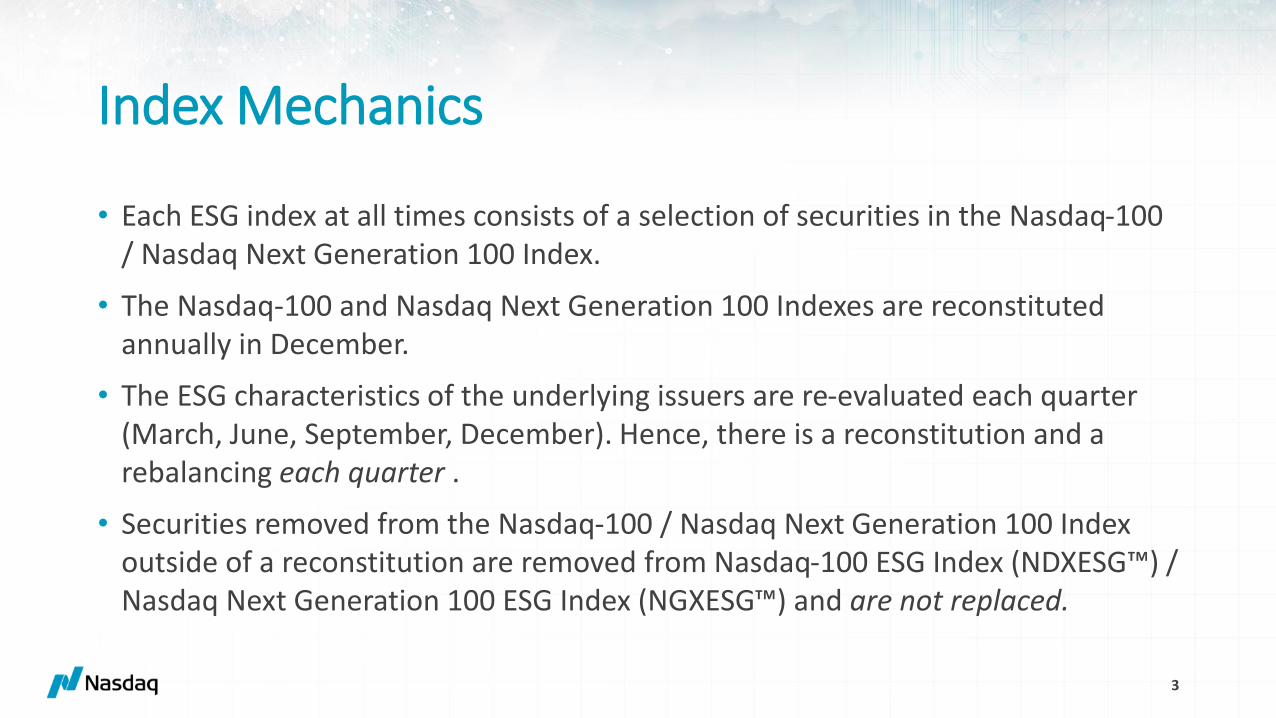
• Each ESG index at all times consists of a selection of securities in the Nasdaq-100 / Nasdaq Next Generation 100 Index.
• The Nasdaq-100 and Nasdaq Next Generation 100 Indexes are reconstituted annually in December.
• The ESG characteristics of the underlying issuers are re-evaluated each quarter (March, June, September, December). Hence, there is a reconstitution and a rebalancing each quarter .
• Securities removed from the Nasdaq-100 / Nasdaq Next Generation 100 Index outside of a reconstitution are removed from Nasdaq-100 ESG Index (NDXESG™) / Nasdaq Next Generation 100 ESG Index (NGXESG™) and are not replaced.
3

Weighting Scheme
• The ESG Indexes are modified market capitalization-weighted index that
considers a company’s ESG Risk Rating Score as an adjustment factor.
• Two factors play into the index weight of an issuer:
▪ The Nasdaq-100 / Nasdaq Next Generation 100 Market Value, and
▪ The ESG Risk Rating Score.
• In general, for each issuer:
▪ Everything else equal, the higher the weight in the Nasdaq-100 and/or the better
ESG risk rating, the higher the weight in the NDXESG Index, and vice versa. Same for
Nasdaq Next Generation 100 and NGXESG.
4
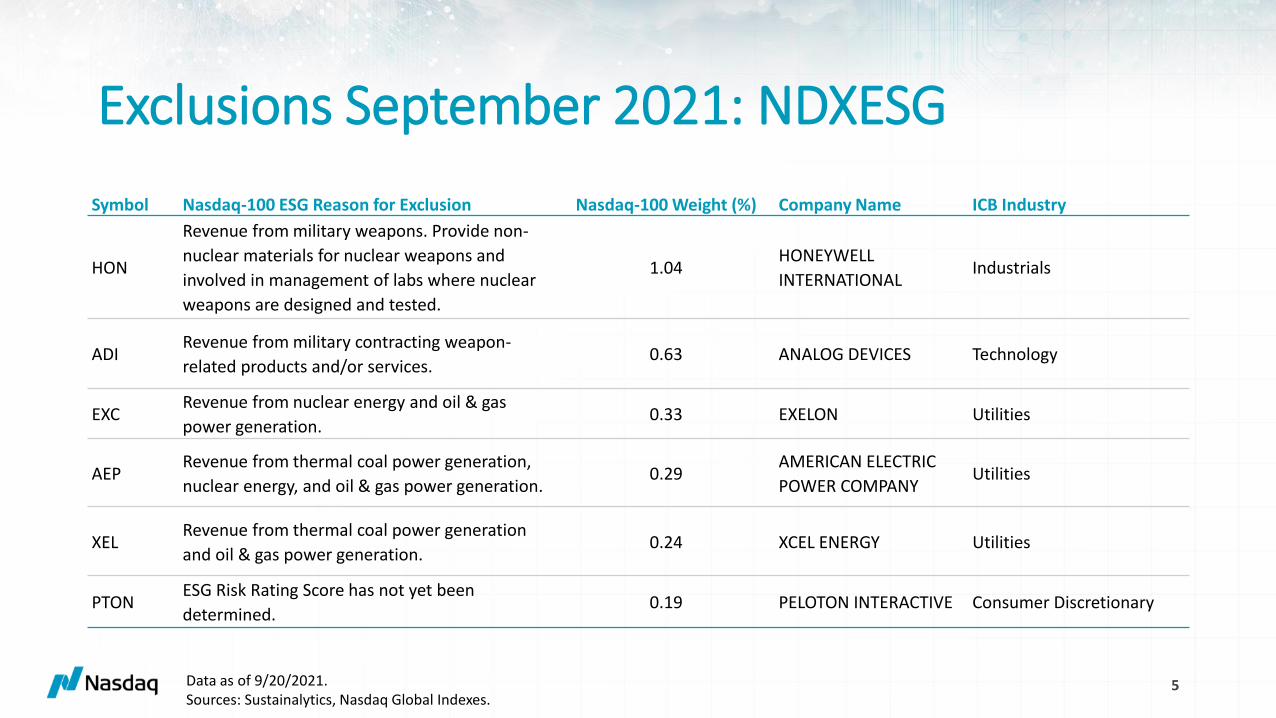
Exclusions September 2021: NDXESG
5Data as of 9/20/2021. Sources: Sustainalytics, Nasdaq Global Indexes.
Symbol Nasdaq-100 ESG Reason for Exclusion Nasdaq-100 Weight (%) Company Name ICB Industry
HON
Revenue from military weapons. Provide non-
nuclear materials for nuclear weapons and
involved in management of labs where nuclear
weapons are designed and tested.
1.04HONEYWELL
INTERNATIONALIndustrials
ADIRevenue from military contracting weapon-
related products and/or services.0.63 ANALOG DEVICES Technology
EXCRevenue from nuclear energy and oil & gas
power generation.0.33 EXELON Utilities
AEPRevenue from thermal coal power generation,
nuclear energy, and oil & gas power generation.0.29
AMERICAN ELECTRIC
POWER COMPANYUtilities
XELRevenue from thermal coal power generation
and oil & gas power generation.0.24 XCEL ENERGY Utilities
PTONESG Risk Rating Score has not yet been
determined.0.19 PELOTON INTERACTIVE Consumer Discretionary
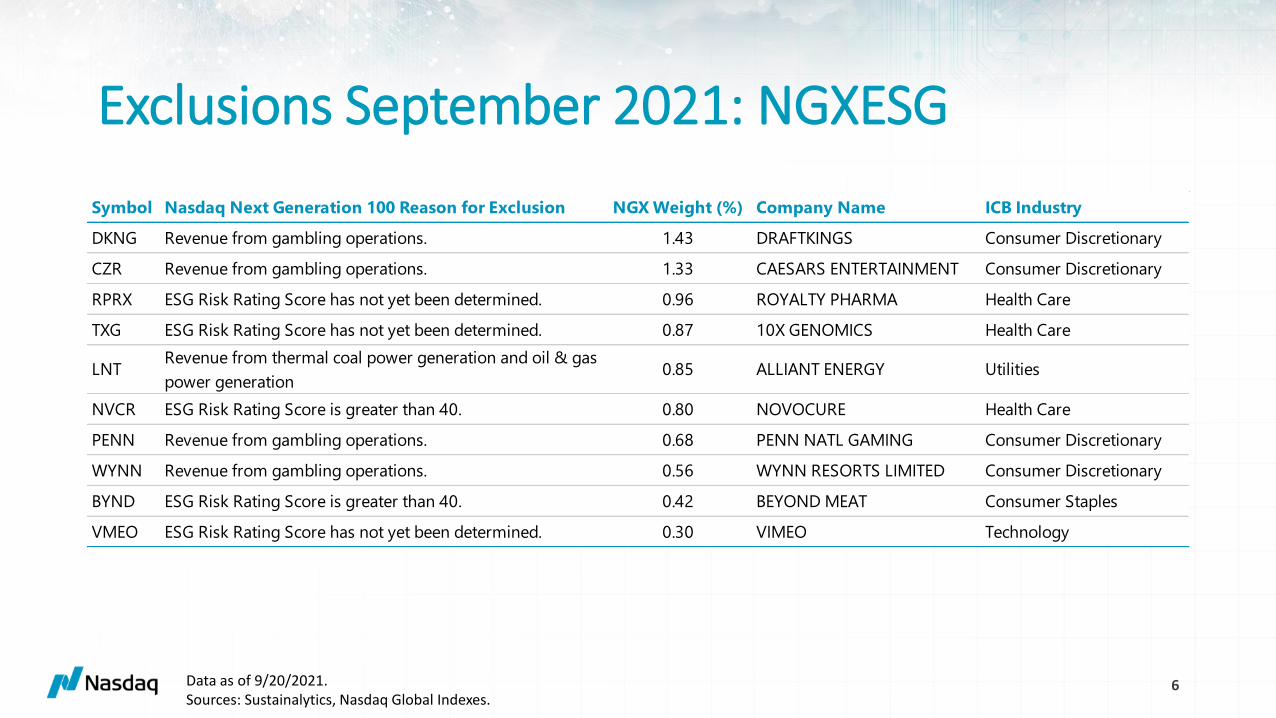
Exclusions September 2021: NGXESG
6Data as of 9/20/2021. Sources: Sustainalytics, Nasdaq Global Indexes.
Symbol Nasdaq Next Generation 100 Reason for Exclusion NGX Weight (%) Company Name ICB Industry
DKNG Revenue from gambling operations. 1.43 DRAFTKINGS Consumer Discretionary
CZR Revenue from gambling operations. 1.33 CAESARS ENTERTAINMENT Consumer Discretionary
RPRX ESG Risk Rating Score has not yet been determined. 0.96 ROYALTY PHARMA Health Care
TXG ESG Risk Rating Score has not yet been determined. 0.87 10X GENOMICS Health Care
LNTRevenue from thermal coal power generation and oil & gas
power generation0.85 ALLIANT ENERGY Utilities
NVCR ESG Risk Rating Score is greater than 40. 0.80 NOVOCURE Health Care
PENN Revenue from gambling operations. 0.68 PENN NATL GAMING Consumer Discretionary
WYNN Revenue from gambling operations. 0.56 WYNN RESORTS LIMITED Consumer Discretionary
BYND ESG Risk Rating Score is greater than 40. 0.42 BEYOND MEAT Consumer Staples
VMEO ESG Risk Rating Score has not yet been determined. 0.30 VIMEO Technology

Top 10 Constituents: NDXESG vs NDX
7Data as of 9/20/2021. Sources: Nasdaq Global Indexes.
14.17
12.94
7.05
5.33
3.74
3.25
2.76
2.452.45 2.17
NDXESG: Top 10 Weight = 56.3%
MICROSOFT
APPLE
ALPHABET
NVIDIA
AMAZON
ADOBE
PAYPAL
CISCO SYSTEMS
NETFLIX
10.89
10.17
7.917.91
4.25
3.92
3.76
2.232.14
1.801.79
NDX: Top 10 Weight = 56.8%
APPLE
MICROSOFT
ALPHABET
AMAZON
TESLA
NVIDIA
PAYPAL
ADOBE
COMCAST
NETFLIX
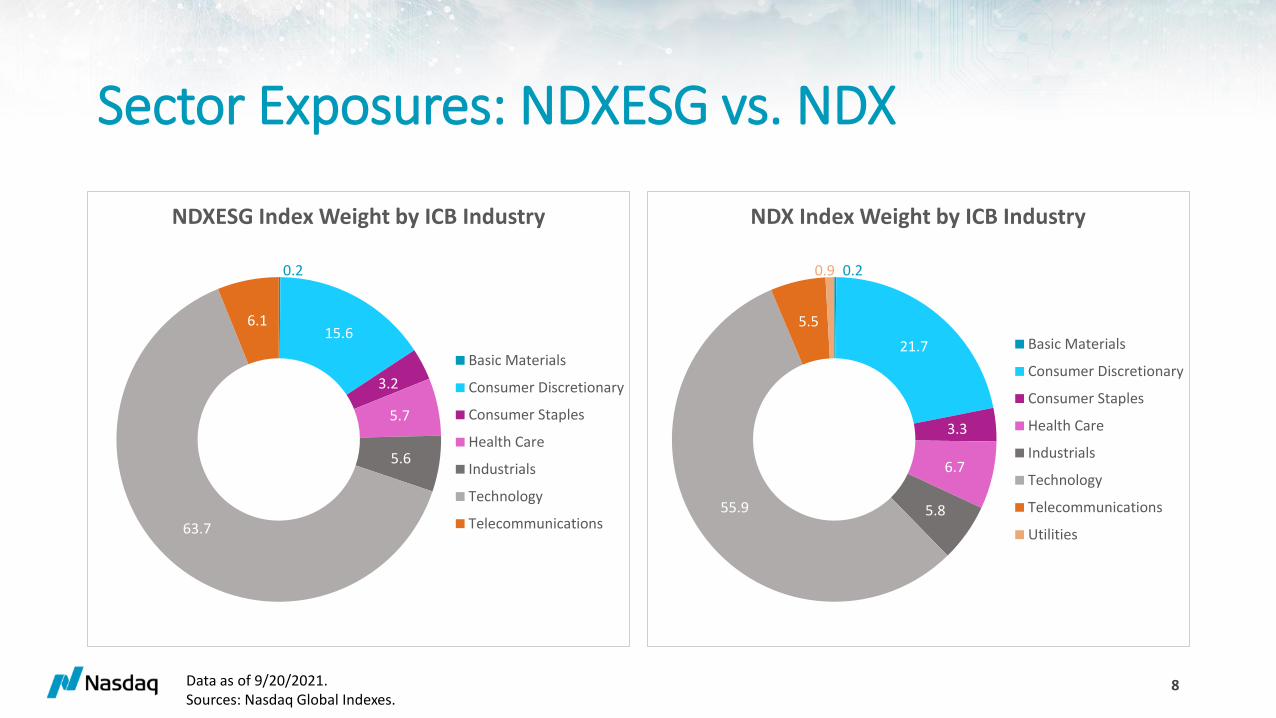
Sector Exposures: NDXESG vs. NDX
8Data as of 9/20/2021. Sources: Nasdaq Global Indexes.
0.2
15.6
3.2
5.7
5.6
63.7
6.1
NDXESG Index Weight by ICB Industry
Basic Materials
Consumer Discretionary
Consumer Staples
Health Care
Industrials
Technology
Telecommunications
0.2
21.7
3.3
6.7
5.8 55.9
5.5
0.9
NDX Index Weight by ICB Industry
Basic Materials
Consumer Discretionary
Consumer Staples
Health Care
Industrials
Technology
Telecommunications
Utilities
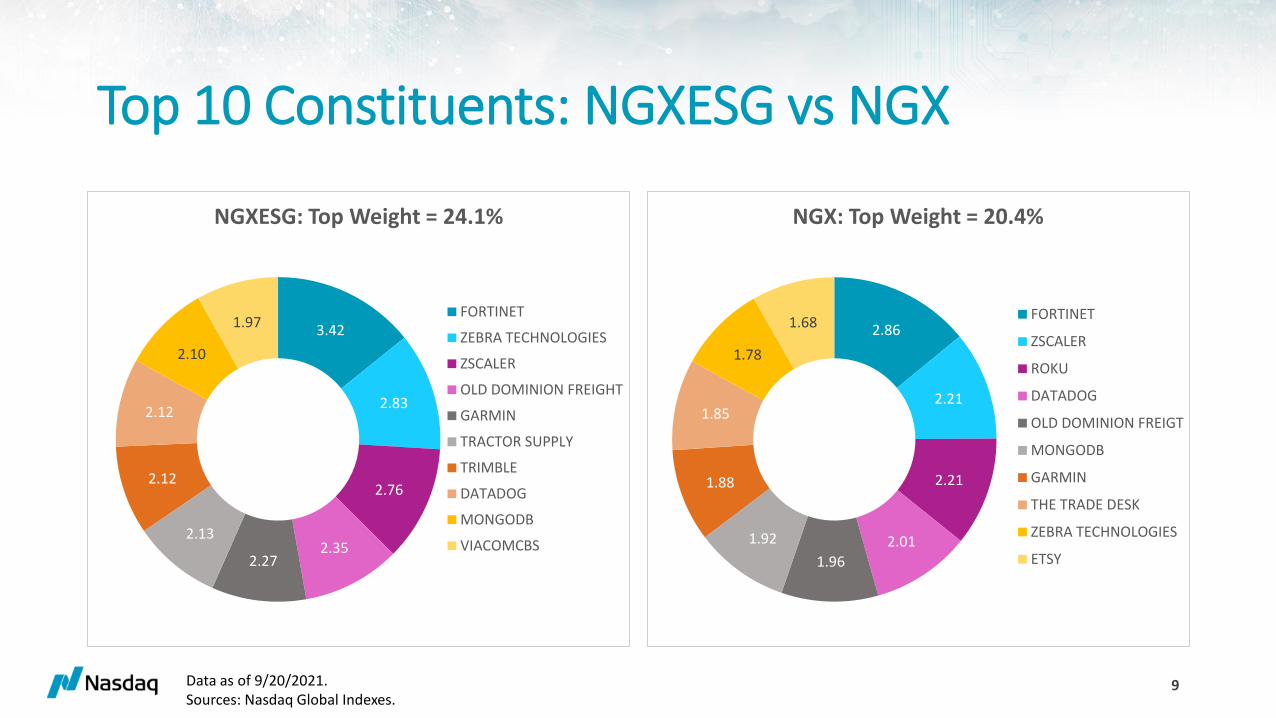
Top 10 Constituents: NGXESG vs NGX
3.42
2.83
2.76
2.352.27
2.13
2.12
2.12
2.10
1.97
NGXESG: Top Weight = 24.1%
FORTINET
ZEBRA TECHNOLOGIES
ZSCALER
OLD DOMINION FREIGHT
GARMIN
TRACTOR SUPPLY
TRIMBLE
DATADOG
MONGODB
VIACOMCBS
9
2.86
2.21
2.21
2.01
1.96
1.92
1.88
1.85
1.78
1.68
NGX: Top Weight = 20.4%
FORTINET
ZSCALER
ROKU
DATADOG
OLD DOMINION FREIGT
MONGODB
GARMIN
THE TRADE DESK
ZEBRA TECHNOLOGIES
ETSY
Data as of 9/20/2021. Sources: Nasdaq Global Indexes.
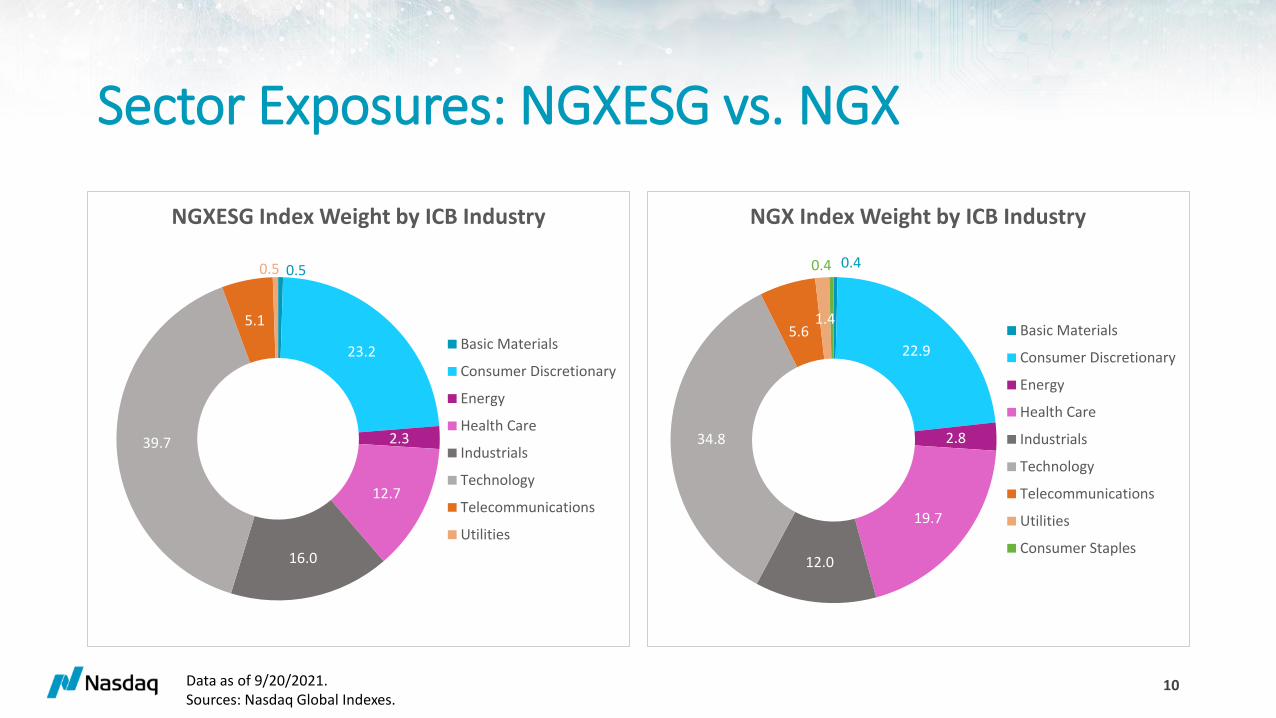
Sector Exposures: NGXESG vs. NGX
10Data as of 9/20/2021. Sources: Nasdaq Global Indexes.
0.5
23.2
2.3
12.7
16.0
39.7
5.1
0.5
NGXESG Index Weight by ICB Industry
Basic Materials
Consumer Discretionary
Energy
Health Care
Industrials
Technology
Telecommunications
Utilities
0.4
22.9
2.8
19.7
12.0
34.8
5.61.4
0.4
NGX Index Weight by ICB Industry
Basic Materials
Consumer Discretionary
Energy
Health Care
Industrials
Technology
Telecommunications
Utilities
Consumer Staples

Nasdaq-100 by Thematic Exposures
11
Source: Nasdaq, Bloomberg, FactSet. Data as of 10/29/2021. Based on overlap with existing Nasdaq Thematic Indexes, except for Digital Health, Healthcare Innovation, 5G, Streaming, and Video Gaming/eSports & Betting where competitor products were analyzed.
5
3
7
15
17
16
14
25
18
7
6
9
6
3
1
6
6
1
Video Gaming/eSports & Betting
FinTech Innovation
Streaming
5G
Internet Economy
Semiconductors
Cloud Computing
AI / Big Data
Robotics
Future Mobility
Cybersecurity
Biotech
Healthcare Innovation
Digital Health
Clean Energy
Smart Grid Infrastructure
Green Economy
Water
# of Constituents per Theme
6.1%
2.5%
30.2%
32.4%
28.4%
14.6%
35.3%
64.0%
44.0%
24.2%
2.6%
4.0%
2.3%
1.0%
6.0%
13.8%
9.3%
0.4%
Video Gaming/eSports & Betting
FinTech Innovation
Streaming
5G
Internet Economy
Semiconductors
Cloud Computing
AI / Big Data
Robotics
Future Mobility
Cybersecurity
Biotech
Healthcare Innovation
Digital Health
Clean Energy
Smart Grid Infrastructure
Green Economy
Water
Index Weight per Theme

Nasdaq-100 ESG by Thematic Exposures
12
Source: Nasdaq, Bloomberg, FactSet. Data as of 10/29/2021. Based on overlap with existing Nasdaq Thematic Indexes, except for Digital Health, Healthcare Innovation, 5G, Streaming, and Video Gaming/eSports & Betting where competitor products were analyzed.
5
3
6
14
17
15
14
25
18
7
6
9
6
3
1
4
6
1
Video Gaming/eSports & Betting
FinTech Innovation
Streaming
5G
Internet Economy
Semiconductors
Cloud Computing
AI / Big Data
Robotics
Future Mobility
Cybersecurity
Biotech
Healthcare Innovation
Digital Health
Clean Energy
Smart Grid Infrastructure
Green Economy
Water
# of Constituents per Theme
8.2%
3.0%
27.9%
32.2%
24.3%
16.6%
37.7%
65.2%
42.5%
20.9%
3.5%
3.6%
1.9%
1.1%
2.7%
11.5%
7.3%
0.4%
Video Gaming/eSports & Betting
FinTech Innovation
Streaming
5G
Internet Economy
Semiconductors
Cloud Computing
AI / Big Data
Robotics
Future Mobility
Cybersecurity
Biotech
Healthcare Innovation
Digital Health
Clean Energy
Smart Grid Infrastructure
Green Economy
Water
Index Weight per Theme
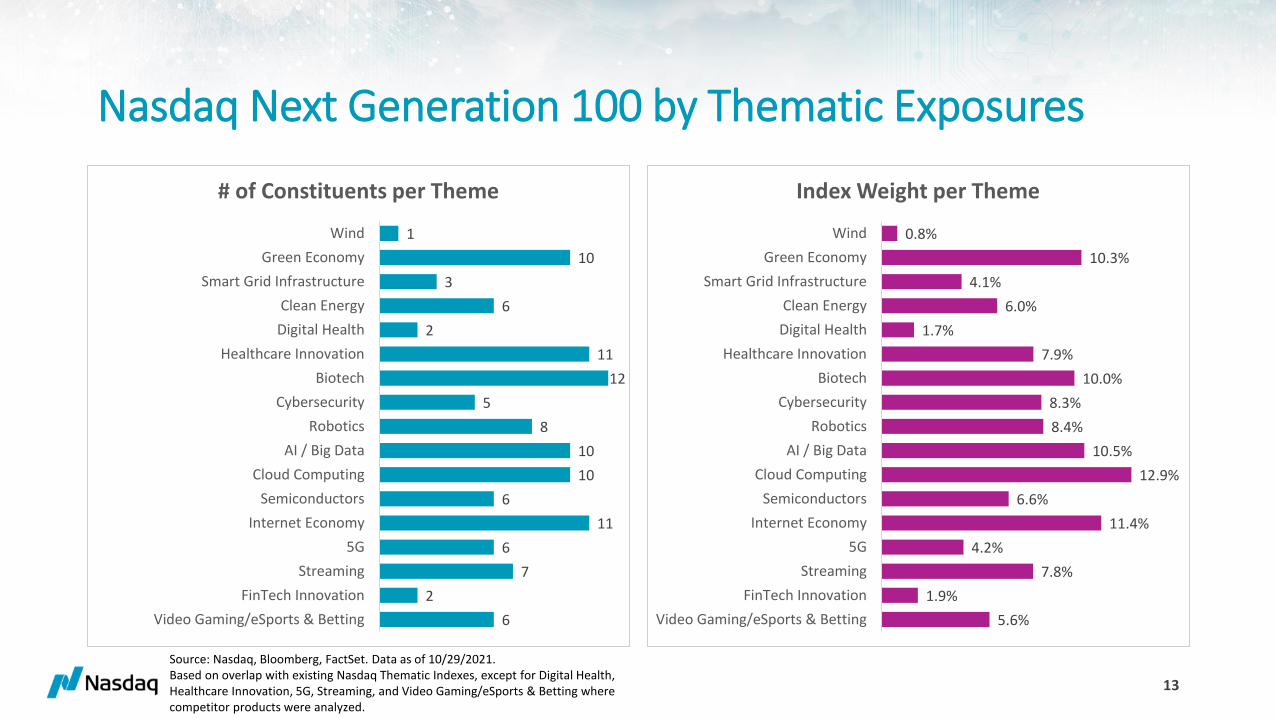
Nasdaq Next Generation 100 by Thematic Exposures
13
Source: Nasdaq, Bloomberg, FactSet. Data as of 10/29/2021. Based on overlap with existing Nasdaq Thematic Indexes, except for Digital Health, Healthcare Innovation, 5G, Streaming, and Video Gaming/eSports & Betting where competitor products were analyzed.
6
2
7
6
11
6
10
10
8
5
12
11
2
6
3
10
1
Video Gaming/eSports & Betting
FinTech Innovation
Streaming
5G
Internet Economy
Semiconductors
Cloud Computing
AI / Big Data
Robotics
Cybersecurity
Biotech
Healthcare Innovation
Digital Health
Clean Energy
Smart Grid Infrastructure
Green Economy
Wind
# of Constituents per Theme
5.6%
1.9%
7.8%
4.2%
11.4%
6.6%
12.9%
10.5%
8.4%
8.3%
10.0%
7.9%
1.7%
6.0%
4.1%
10.3%
0.8%
Video Gaming/eSports & Betting
FinTech Innovation
Streaming
5G
Internet Economy
Semiconductors
Cloud Computing
AI / Big Data
Robotics
Cybersecurity
Biotech
Healthcare Innovation
Digital Health
Clean Energy
Smart Grid Infrastructure
Green Economy
Wind
Index Weight per Theme

Nasdaq Next Generation 100 ESG by Thematic Exposures
14
Source: Nasdaq, Bloomberg, FactSet. Data as of 10/29/2021. Based on overlap with existing Nasdaq Thematic Indexes, except for Digital Health, Healthcare Innovation, 5G, Streaming, and Video Gaming/eSports & Betting where competitor products were analyzed.
3
2
7
6
10
6
10
10
8
5
11
9
2
6
3
10
Video Gaming/eSports & Betting
FinTech Innovation
Streaming
5G
Internet Economy
Semiconductors
Cloud Computing
AI / Big Data
Robotics
Cybersecurity
Biotech
Healthcare Innovation
Digital Health
Clean Energy
Smart Grid Infrastructure
Green Economy
# of Constituents per Theme
2.7%
2.1%
7.3%
4.5%
9.6%
6.5%
15.7%
13.7%
11.4%
10.1%
5.9%
5.0%
2.0%
5.4%
4.0%
11.3%
Video Gaming/eSports & Betting
FinTech Innovation
Streaming
5G
Internet Economy
Semiconductors
Cloud Computing
AI / Big Data
Robotics
Cybersecurity
Biotech
Healthcare Innovation
Digital Health
Clean Energy
Smart Grid Infrastructure
Green Economy
Index Weight per Theme

Top 10 Largest Overweights: NDXESG
Symbol
Nasdaq-100 ESG
Weight (%)
Nasdaq-100 Weight
(%) Difference Weight (%) Company Name ICB Industry
MSFT 14.17 10.17 4.00 MICROSOFT Technology
AAPL 12.94 10.89 2.05 APPLE Technology
NVDA 5.33 3.76 1.57 NVIDIA Technology
ADBE 3.25 2.14 1.11 ADOBE Technology
CSCO 2.45 1.64 0.80 CISCO SYSTEMS Telecommunications
PYPL 2.76 2.23 0.53 PAYPAL HOLDINGS Industrials
AMAT 1.26 0.87 0.39 APPLIED MATERIALS Technology
NFLX 2.17 1.79 0.37 NETFLIX Consumer Discretionary
INTC 1.81 1.51 0.30 INTEL Technology
PEP 1.72 1.46 0.26 PEPSICO Consumer Staples
15Data as of 9/20/2021. Sources: Nasdaq Global Indexes.

Top 10 Largest Underweights: NDXESG
Symbol
Nasdaq-100 ESG
Weight (%)
Nasdaq-100 Weight
(%) Difference Weight (%) Company Name ICB Industry
AMZN 3.74 7.91 (4.18) AMAZON.COM Consumer Discretionary
TSLA 1.93 4.25 (2.32) TESLA Consumer Discretionary
FB 2.45 3.92 (1.48) FACEBOOK Technology
MRNA 0.62 1.19 (0.57) MODERNA INC Health Care
GOOG 3.64 4.09 (0.44) ALPHABET CL C Technology
GOOGL 3.41 3.83 (0.41) ALPHABET CL A Technology
ISRG 0.46 0.85 (0.38) INTUITIVE SURGICAL Health Care
AVGO 1.08 1.43 (0.34) BROADCOM Technology
CHTR 0.71 0.96 (0.25) CHARTER COMMUNICATIONS Telecommunications
KHC 0.09 0.31 (0.22) KRAFT HEINZ Consumer Staples
COST 1.22 1.39 (0.17) COSTCO WHOLESALE Consumer Discretionary
16Data as of 9/20/2021. Sources: Nasdaq Global Indexes.

Top 10 Largest Overweights: NGXESG
Symbol NGXESG Weight (%) NGX Weight (%) Difference Weight (%) Company Name ICB Industry
ZBRA 2.83 1.78 1.05 ZEBRA TECHNOLOGIES Industrials
STX 1.90 1.11 0.79 SEAGATE TECHNOLOGY Technology
TRMB 2.12 1.33 0.79 TRIMBLE Industrials
TSCO 2.13 1.39 0.74 TRACTOR SUPPLY Consumer Discretionary
WDC 1.71 1.05 0.66 WESTERN DIGITAL Technology
POOL 1.72 1.09 0.63 POOL CORPORATION Consumer Discretionary
HAS 1.37 0.79 0.58 HASBRO Consumer Discretionary
LOGI 1.51 0.95 0.57 LOGITECH Technology
FTNT 3.42 2.86 0.56 FORTINET Technology
ZS 2.76 2.21 0.55 ZSCALER Technology
17Data as of 9/20/2021. Sources: Nasdaq Global Indexes.

Top 10 Largest Underweights: NGXESG
Symbol NGXESG Weight (%) NGX Weight (%) Difference Weight (%) Company Name ICB Industry
HZNP 0.20 1.45 (1.25) HORIZON THERAPEUTICS Health Care
YNDX 0.82 1.51 (0.69) YANDEX Technology
ROKU 1.57 2.21 (0.64) ROKU Telecommunications
PODD 0.55 1.18 (0.63) INSULET Health Care
QRVO 0.52 1.14 (0.62) QORVO Technology
ABMD 0.41 0.94 (0.54) ABIOMED Health Care
ALNY 0.80 1.32 (0.53) ALNYLAM PHARMACEUTICALS Health Care
MASI 0.36 0.88 (0.52) MASIMO Health Care
HOLX 0.64 1.15 (0.51) HOLOGIC Health Care
ENPH 0.76 1.27 (0.51) ENPHASE ENERGY Energy
18Data as of 9/20/2021. Sources: Nasdaq Global Indexes.
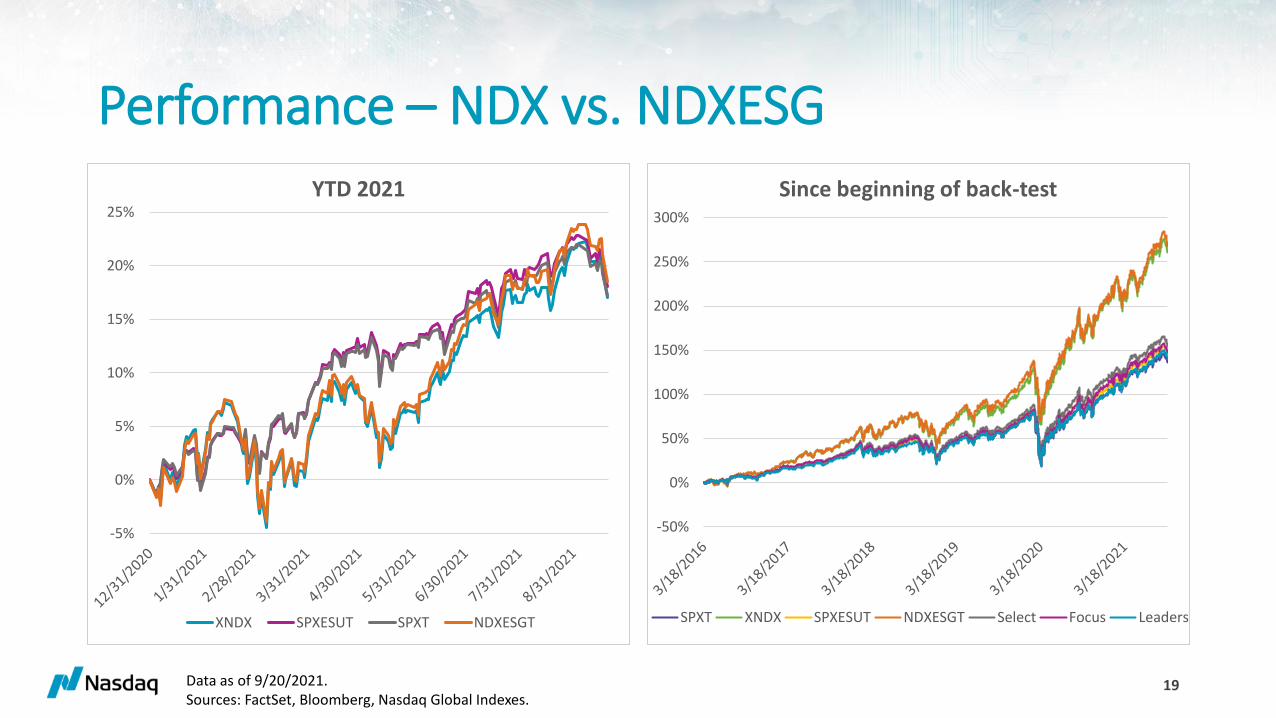
Performance – NDX vs. NDXESG
-5%
0%
5%
10%
15%
20%
25%
YTD 2021
XNDX SPXESUT SPXT NDXESGT
19
-50%
0%
50%
100%
150%
200%
250%
300%
Since beginning of back-test
SPXT XNDX SPXESUT NDXESGT Select Focus Leaders
Data as of 9/20/2021. Sources: FactSet, Bloomberg, Nasdaq Global Indexes.

Performance – NGX vs. NGXESG
20Data as of 9/20/2021. Sources: FactSet, Bloomberg, Nasdaq Global Indexes.
-5%
0%
5%
10%
15%
20%
25%
YTD 2021
NGXT S&P Sustainability S&P NGXESGT S&P ESG
-50%
0%
50%
100%
150%
200%
Since beginning of back-test
NGXT NGXESGT S&P ESG S&P S&P Sustainability

ESG Comparisons – NDX/NDXESG
21Data as of 7/30/2021. Sources: Sustainalytics, FactSet, Bloomberg, Nasdaq Global Indexes.
Index BenchmarkNumber of Securities
% Exclusion from the Benchmark
Weighted Average Sustainalytics ESG Risk Score
Simple Average Sustainalytics ESG Risk Score
MSCI USA Index -- 626 n/a 21.58 22.45
MSCI USA Extended ESG Focus Index MSCI USA Index 351 44% 20.91 21.58
MSCI USA Extended ESG Leaders Index MSCI USA Index 278 56% 19.22 20.94
MSCI USA ESG Universal Select Business Screens Index MSCI USA Index 569 9% 20.10 21.67
Nasdaq-100 Index -- 102 n/a 20.42 20.49
Nasdaq-100 ESG Index Nasdaq-100 Index 96 6% 18.56 20.09
S&P 500 Index -- 507 n/a 21.49 22.25
S&P 500 ESG Index S&P 500 Index 314 38% 20.51 21.11

ESG Comparisons – NGX/NGXESG
22Data as of 7/30/2021. Sources: Sustainalytics, FactSet, Bloomberg, Nasdaq Global Indexes.
Index BenchmarkNumber of Securities
% Exclusion from the Benchmark
Weighted Average Sustainalytics ESG Risk Score
Simple Average Sustainalytics ESG Risk Score
Nasdaq Next Generation 100 Index -- 104 n/a 21.98 22.20
Nasdaq Next Generation ESG 100 Index
Nasdaq Next Generation 100 Index 93 11% 19.24 21.38
S&P MidCap 400 Index -- 401 n/a 24.61 25.26
S&P MidCap 400 Sustainability Screened Index S&P MidCap 400 Index 373 7% 24.09 24.64
S&P MidCap 400 ESG Index S&P MidCap 400 Index 274 32% 24.04 24.64

RESOURCES
23

RESOURCES: Nasdaq-100 ESG Index
• Overview
▪ https://indexes.nasdaqomx.com/Index/Overview/NDXESG
• Methodology
▪ https://indexes.nasdaqomx.com/docs/methodology_NDXESG.pdf
• Research
▪ https://indexes.nasdaqomx.com/docs/NDXESG_Research.pdf
• Fact Sheet
▪ https://indexes.nasdaqomx.com/docs/FS_NDXESGT.pdf
• Carbon Credit Report
▪ NDXESG: https://indexes.nasdaqomx.com/docs/Carbon%20Footprint%20Report%20-%20NDXESG.pdf
▪ NDX: https://indexes.nasdaqomx.com/docs/Carbon%20Footprint%20Report%20–%20NDX.pdf
24
RESOURCES: Nasdaq-100 Next Generation ESG Index
• Overview
▪ https://indexes.nasdaqomx.com/Index/Overview/NGXESG
• Methodology
▪ https://indexes.nasdaqomx.com/docs/methodology_NGXESG.pdf
• Research
▪ https://indexes.nasdaqomx.com/docs/NGXESG_Research.pdf
• Fact Sheet
▪ https://indexes.nasdaqomx.com/docs/FS_NGXESGT.pdf
• Carbon Credit Report
▪ NGXESG: https://indexes.nasdaqomx.com/docs/Carbon%20Footprint%20Report%20-%20NGXESG.pdf
▪ NGX: https://indexes.nasdaqomx.com/docs/Carbon%20Footprint%20Report%20-%20NGX.pdf
25

APPENDIX
26

Exclusions based on ESG risk
• Companies with a “Severe” ESG Risk Rating are automatically
disqualified from inclusion.
▪ A rating of greater than 40 is considered “Severe”; 30-40 is considered “High”;
20-30 is “Medium”; 10-20 is “Low”; and 0-10 is “Negligible”.
• Exclude any company that has not been researched yet.
27

Exclusions based on ESG risk – continued
• Exclude any company that has a controversy score equal to 5:
▪ The controversy rating reflects:o Incidents with negative Environmental, Social and Governance (ESG) implications.
o A company’s level of involvement in and how it manages these issues.
▪ Categorical scores are on a scale of 1 to 5.
28

Exclusions based on international norms
• A company must not violate the United Nations Global Compact:▪ 10 principles around human rights, labor, environment, and anti-corruption.▪ https://www.unglobalcompact.org/what-is-gc/mission/principles
• Securities are excluded from NDXESG/NGXESG that are classified as non-compliant.
▪ Each company in the index is therefore classified as either compliant or on the watch-list with the UN Global Compact framework for following international norms.
29

Exclusions based on business involvements
Business Involvement Considered*:
1. Energy (Arctic oil & gas, nuclear power, oil & gas, oil sands, shale energy, thermal
coal)
2. Health & Life (Alcohol, recreational cannabis, tobacco)
3. Defense & Military (controversial weapons, military contracting, riot control,
small arms)
4. Values-Based (adult entertainment, gambling)
30

Weighting scheme – continued
𝐸𝑆𝐺 𝑅𝑖𝑠𝑘 − 𝐴𝑑𝑗𝑢𝑠𝑡𝑒𝑑 𝑁𝐷𝑋 𝑀𝑎𝑟𝑘𝑒𝑡 𝑉𝑎𝑙𝑢𝑒 =40 − 𝐸𝑆𝐺 𝑅𝑖𝑠𝑘 𝑅𝑎𝑡𝑖𝑛𝑔 𝑆𝑐𝑜𝑟𝑒
40x 𝑁𝐷𝑋 𝑀𝑎𝑟𝑘𝑒𝑡 𝑉𝑎𝑙𝑢𝑒
• Initial security weights are calculated by dividing a security’s ESG Risk-Adjusted
NDX Market Value by the sum of the ESG Risk-Adjusted NDX Market Values of all
Index Securities.
• Afterwards, the same four-stage weight adjustment process as exists for NDX at
its annual reconstitution is applied to produce final weights on a quarterly basis
for NDXESG.
• (All the above applies for NGX and NGXESG, as well.)
31
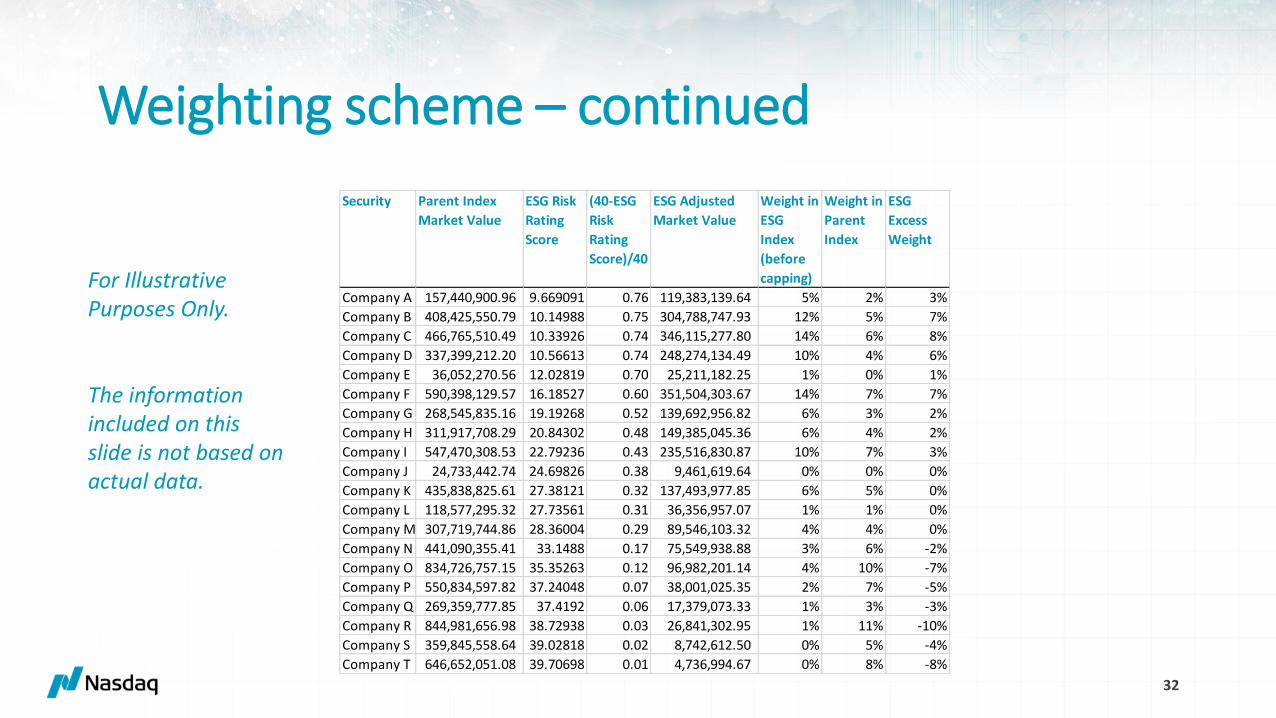
Weighting scheme – continued
32
For Illustrative Purposes Only.
The information included on this slide is not based on actual data.
Security Parent Index
Market Value
ESG Risk
Rating
Score
(40-ESG
Risk
Rating
Score)/40
ESG Adjusted
Market Value
Weight in
ESG
Index
(before
capping)
Weight in
Parent
Index
ESG
Excess
Weight
Company A 157,440,900.96 9.669091 0.76 119,383,139.64 5% 2% 3%
Company B 408,425,550.79 10.14988 0.75 304,788,747.93 12% 5% 7%
Company C 466,765,510.49 10.33926 0.74 346,115,277.80 14% 6% 8%
Company D 337,399,212.20 10.56613 0.74 248,274,134.49 10% 4% 6%
Company E 36,052,270.56 12.02819 0.70 25,211,182.25 1% 0% 1%
Company F 590,398,129.57 16.18527 0.60 351,504,303.67 14% 7% 7%
Company G 268,545,835.16 19.19268 0.52 139,692,956.82 6% 3% 2%
Company H 311,917,708.29 20.84302 0.48 149,385,045.36 6% 4% 2%
Company I 547,470,308.53 22.79236 0.43 235,516,830.87 10% 7% 3%
Company J 24,733,442.74 24.69826 0.38 9,461,619.64 0% 0% 0%
Company K 435,838,825.61 27.38121 0.32 137,493,977.85 6% 5% 0%
Company L 118,577,295.32 27.73561 0.31 36,356,957.07 1% 1% 0%
Company M 307,719,744.86 28.36004 0.29 89,546,103.32 4% 4% 0%
Company N 441,090,355.41 33.1488 0.17 75,549,938.88 3% 6% -2%
Company O 834,726,757.15 35.35263 0.12 96,982,201.14 4% 10% -7%
Company P 550,834,597.82 37.24048 0.07 38,001,025.35 2% 7% -5%
Company Q 269,359,777.85 37.4192 0.06 17,379,073.33 1% 3% -3%
Company R 844,981,656.98 38.72938 0.03 26,841,302.95 1% 11% -10%
Company S 359,845,558.64 39.02818 0.02 8,742,612.50 0% 5% -4%
Company T 646,652,051.08 39.70698 0.01 4,736,994.67 0% 8% -8%

Disclaimer
Nasdaq® is a registered trademark of Nasdaq, Inc. The information contained above is provided for informational and educational purposes only, and nothing contained herein should be construed as investment advice, either on behalf of a particular security or an overall investment strategy. Neither Nasdaq, Inc. nor any of its affiliates makes any recommendation to buy or sell any security or any representation about the financial condition of any company. Statements regarding Nasdaq-listed companies or Nasdaq proprietary indexes are not guarantees of future performance. Actual results may differ materially from those expressed or implied. Past performance is not indicative of future results. Investors should undertake their own due diligence and carefully evaluate companies before investing. ADVICE FROM A SECURITIES PROFESSIONAL IS STRONGLY ADVISED.
© 2021. Nasdaq, Inc. All Rights Reserved.
Copyright © 2021 Sustainalytics. All rights reserved. This report contains information developed by Sustainalytics. Such information and data are proprietary of Sustainalytics and/or its third-party suppliers (Third-Party Data) and are provided for informational purposes only. They do not constitute an endorsement of any product or project, nor an investment advice and are not warranted to be complete, timely, accurate or suitable for a particular purpose. Their use is subject to conditions available at https://www.sustainalytics.com/legal-disclaimers
33