Embed Size (px)
Citation preview

DRAFT FOR DISCUSSION – DO NOT CITE
INNOVATION & HIGHER EDUCATION:
A Comparative Study of Five Asian Societies
Professor Ka Ho Mok
Faculty of Arts and Sciences
The Hong Kong Institute of Education
February, 2010
0
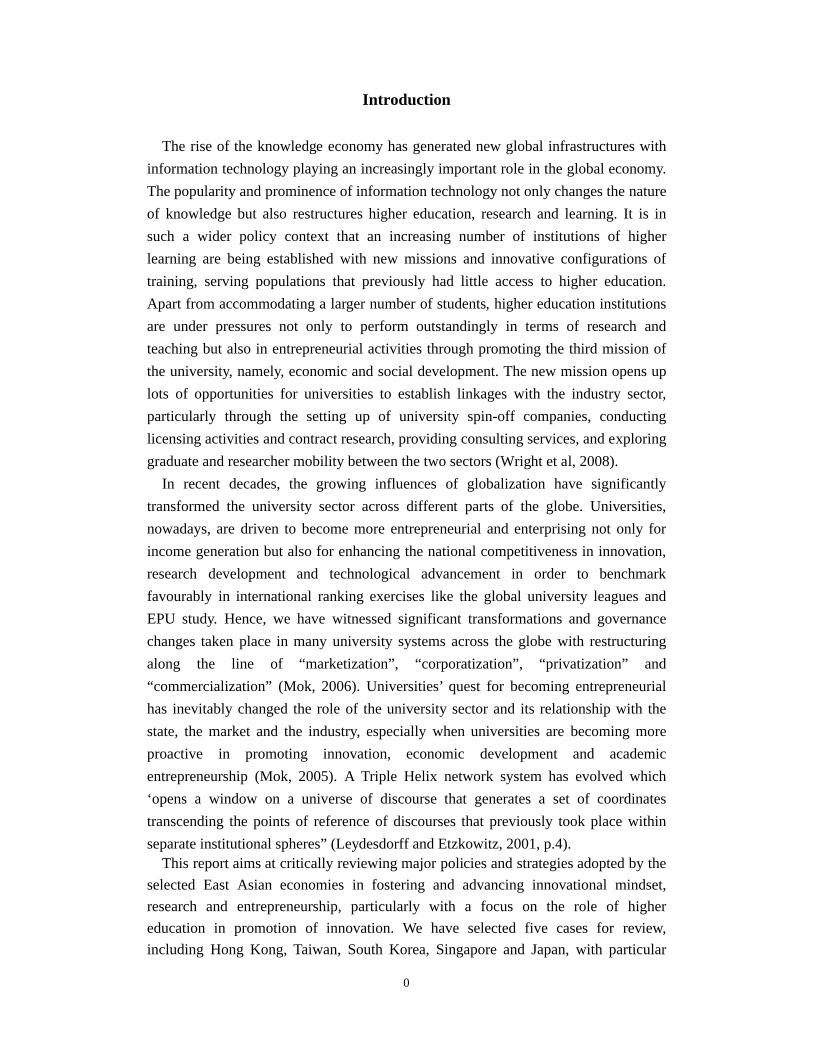
Introduction
The rise of the knowledge economy has generated new global infrastructures with
information technology playing an increasingly important role in the global economy.
The popularity and prominence of information technology not only changes the nature
of knowledge but also restructures higher education, research and learning. It is in
such a wider policy context that an increasing number of institutions of higher
learning are being established with new missions and innovative configurations of
training, serving populations that previously had little access to higher education.
Apart from accommodating a larger number of students, higher education institutions
are under pressures not only to perform outstandingly in terms of research and
teaching but also in entrepreneurial activities through promoting the third mission of
the university, namely, economic and social development. The new mission opens up
lots of opportunities for universities to establish linkages with the industry sector,
particularly through the setting up of university spin-off companies, conducting
licensing activities and contract research, providing consulting services, and exploring
graduate and researcher mobility between the two sectors (Wright et al, 2008).
In recent decades, the growing influences of globalization have significantly
transformed the university sector across different parts of the globe. Universities,
nowadays, are driven to become more entrepreneurial and enterprising not only for
income generation but also for enhancing the national competitiveness in innovation,
research development and technological advancement in order to benchmark
favourably in international ranking exercises like the global university leagues and
EPU study. Hence, we have witnessed significant transformations and governance
changes taken place in many university systems across the globe with restructuring
along the line of “marketization”, “corporatization”, “privatization” and
“commercialization” (Mok, 2006). Universities’ quest for becoming entrepreneurial
has inevitably changed the role of the university sector and its relationship with the
state, the market and the industry, especially when universities are becoming more
proactive in promoting innovation, economic development and academic
entrepreneurship (Mok, 2005). A Triple Helix network system has evolved which
‘opens a window on a universe of discourse that generates a set of coordinates
transcending the points of reference of discourses that previously took place within
separate institutional spheres” (Leydesdorff and Etzkowitz, 2001, p.4).This report aims at critically reviewing major policies and strategies adopted by the
selected East Asian economies in fostering and advancing innovational mindset,
research and entrepreneurship, particularly with a focus on the role of higher
education in promotion of innovation. We have selected five cases for review,
including Hong Kong, Taiwan, South Korea, Singapore and Japan, with particular
0
reference to examine the interactions among the state, the universities/research
institutes, and the industrial/business sector in promoting innovation.
The first part of this report will briefly outline the past and present of the National
Innovation System (NIS) of all the selected cases, followed by a discussion on recent
reform or development of their higher education sectors respectively. As for the
second part of this report, emphasis will be given to the role of higher education in
innovation from a comparative perspective. The discussion would subsequently be
followed by an assessment that attempt to draw lessons from these comparable East
Asian cases which are both similar and dissimilar in many aspects.
Triple Helix Network System in Promoting Entrepreneurship:An Overview of National Innovation Systems in Asia
Attaching far more weight to entrepreneurial efficiency and effectiveness,
contemporary universities are under immense pressures to transform their roles to
adapt to rapid socio-economic and socio-political changes. Besides the repositioning
of the universities’ visions and missions, university staffs also have to adjust their
roles in the university bureaucracy. As Slaughter and Lesile (1997: 9) described that
under the emerging trend of “academic capitalism”, “…faculty and professional staff
extend their human capital stocks increasingly in competitive situations…[that]
university employees are employed simultaneously by the public sector and are
increasingly autonomous from it. They are academics who act as capitalists from
within the public sector; they are state-subsidized entrepreneurs”. These developments
are particularly true when universities have to explore and diversify the sources of
funding since modern governments have encountered reduced financial capacity to
continue financing growing demands for higher education, particularly against the
current global economic crisis context.
It is against the socio-economic context discussed above that the processes of
academic capitalization in general and the pursuit of academic entrepreneurship in
particular has become increasingly popular in shaping the relationship between
government, university, business and industry. Therefore, new
“university-academic-productive sector relations” have emerged (Sutz, 1997).
Notions such as “corporate academic convergence” (Currie and Newson, 1998),
“entrepreneurial universities” (Marginson, 2000), “campus inc.” (White and Hauck,
2000), “capitalization of knowledge”, “Strong executive control” and “corporate
characters” are used to conceptualize current changes in contemporary universities
(Etzkowitz and Leydesdorff, 1997). In the context of reduced financial support from
the state, higher education systems across different parts of the world have attempted
to generate incomes through entrepreneurial activities (see, for example, Marginson

0
and Considine, 2000; Mok, 2003, 2004). It is, therefore, not surprising that “the
language of human capital dominates official policy recommendations dealing with
growing economic and social problems” (Spring, 1998, p.163).
Innovations play an increasingly important role as a driving force for economic
growth and hence many developing countries in East Asia have taken research and
development more seriously, especially when governments in the region have realized
the national competitiveness is no longer dependent upon cheap labour for
manufacturing sector (Brokel and Binder, 2009). Recognizing innovation and
creativity is the lifeblood in the knowledge-based economy, promotion of innovation
and knowledge transfer is becoming increasingly popular among the Asian countries.
It is against this context that universities are encouraged to move beyond the ivory
tower to reach out to the industry, business and community to develop new synergy
for promoting innovation and entrepreneurship (OECD, 2008).
When examining the promotion of entrepreneurship and innovation enhancement in
East Asia, this project draws on Leydesdorff and Etzkowitz’s (2001) Triple Helix
Model of interactive spirals between the government, the university sector, and the
industry and business sector to promote economic and academic entrepreneurship (see
Figure 1).
Figure 1. Three Major Driving Forces for Innovation
Source: Drawn by the author
Overall speaking, comparing the role of the government with the industry and
university in innovation promotion, we have discovered the government has played a
very significant leading role in driving the agenda of innovation promotion in Asia.
Our comparative cases clearly show us the governments in Singapore, South Korea
Taiwan and Japan having been steering the development of research and development
and promotion of innovation, especially during the inception phase, while the role of

0
the industry has then become increasingly important and active against the policy
context of strong government support. Among all the selected case studies, only Hong
Kong is the exception since the government in Hong Kong before and after the
changeover has maintained a governance philosophy of ‘positive non-interventionist’
government. Upholding a free market economy approach, the Hong Kong government
has the least ‘intervention’/ motivation in the promotion of technology and innovation
among the selected Asian economies. The following part reviews the national
innovation systems (NIS) in selected Asian countries.
Hong Kong
Before the Asian financial crisis started in 1997, Hong Kong has successfully relied
upon “four traditional economic pillars”, including financial services, trade &
logistics, tourism, and professional & other producer services. Yet these industries are
facing ever-mounting challenges from regional competitors like Shenzhen, Shanghai
and Singapore in recent years. Hence, there has long been a call for economic
restructuring in the society, searching for new drives to sustain the economic
development. The strive for a knowledge economy has become even more acute after
the 1997 handover and the Asian Financial Crisis in 1997-98, when Hong Kong’s
finance-centered economy was put into doubt.
According to the Global Competitiveness Index, Hong Kong’s ranking remains
quite stable in recent years: 10th in 2006/07, 12th in 2007/08, and 11th in 2008/09. As
for the World Bank’s Knowledge Economy Index, Hong Kong was set on 23rd in 1995
and 26th in 2008. Yet when it comes to actual results, the number of US patents
acquired by Hong Kong for the past five years has increased mildly. However, the
number is still substantially lower than its competitors, e.g. Taiwan. Taking 2008 as
example, Taiwan has been issued 6339 US utility patents and 1423 US design patents
respectively; while Hong Kong could only acquire 311 and 405 respectively,
accounting only 4.9% and 28.5% of that of Taiwan’s (see Table 1).
Table 1. Number of US Patents from Hong Kong
2004 2005 2006 2007 2008
Utility Patent 311 283 308 338 311
Design Patent 329 311 445 418 405
Source: US Patent and Trademark Office.
http://www.uspto.gov/web/offices/ac/ido/oeip/taf/cst_dsn.htm
http://www.uspto.gov/web/offices/ac/ido/oeip/taf/cst_utl.htm
In fact, during the colonial period, the Hong Kong government had put little
emphasis on industrial development than on service/financial industry. As Tsui-Auch
0
(1998) points out, this was due to the fact that its expenditure was restricted by fiscal
conservatism adopted by the British rulers. The core establishment came from
banking and service sectors instead of industrial sector; while businessmen and
bankers were reluctant to engage in long-term industrial investment in face of the
return of Hong Kong’s sovereignty to China. Thus before the 1990s, Hong Kong
government’s role regarding the industrial development was mainly as a provider of
infrastructure (e.g. support of industrial land, trained manpower, transport &
communications, water, electricity, fuels & raw materials, financial & business
services) and a facilitator (e.g. supply of technical information & advice, laboratory &
bureau services that help entrepreneurs to enhance their productivity, quality and
innovation) (Yeh & Ng, 1994: 460). At that time, R&D linkages among manufacturers,
governmental supportive organizations and HEIs were underdeveloped (Leung & Wu,
1994). It was until recent years that the government has started to develop strategies
in supporting industrial innovation.1
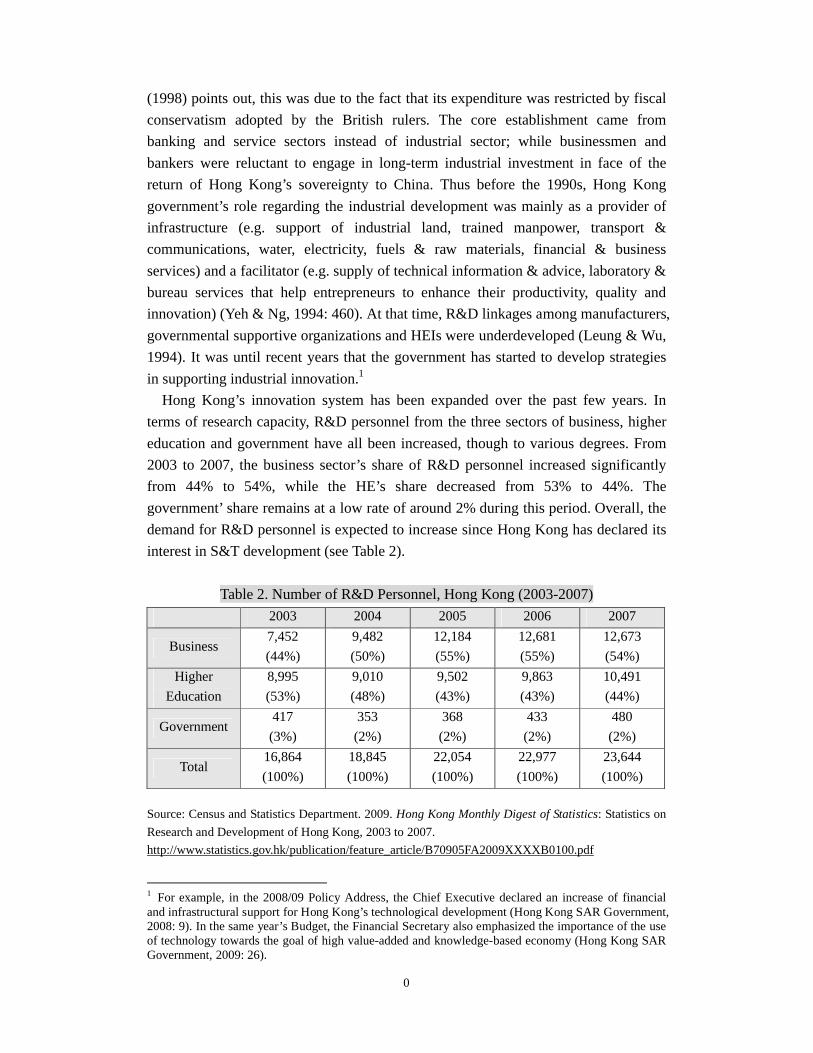
Hong Kong’s innovation system has been expanded over the past few years. In
terms of research capacity, R&D personnel from the three sectors of business, higher
education and government have all been increased, though to various degrees. From
2003 to 2007, the business sector’s share of R&D personnel increased significantly
from 44% to 54%, while the HE’s share decreased from 53% to 44%. The
government’ share remains at a low rate of around 2% during this period. Overall, the
demand for R&D personnel is expected to increase since Hong Kong has declared its
interest in S&T development (see Table 2).
Table 2. Number of R&D Personnel, Hong Kong (2003-2007)
2003 2004 2005 2006 2007
Business7,452
(44%)
9,482
(50%)
12,184
(55%)
12,681
(55%)
12,673
(54%)
Higher
Education
8,995
(53%)
9,010
(48%)
9,502
(43%)
9,863
(43%)
10,491
(44%)
Government417
(3%)
353
(2%)
368
(2%)
433
(2%)
480
(2%)
Total16,864
(100%)
18,845
(100%)
22,054
(100%)
22,977
(100%)
23,644
(100%)
Source: Census and Statistics Department. 2009. Hong Kong Monthly Digest of Statistics: Statistics on
Research and Development of Hong Kong, 2003 to 2007.
http://www.statistics.gov.hk/publication/feature_article/B70905FA2009XXXXB0100.pdf
1 For example, in the 2008/09 Policy Address, the Chief Executive declared an increase of financial and infrastructural support for Hong Kong’s technological development (Hong Kong SAR Government, 2008: 9). In the same year’s Budget, the Financial Secretary also emphasized the importance of the use of technology towards the goal of high value-added and knowledge-based economy (Hong Kong SAR Government, 2009: 26).
0
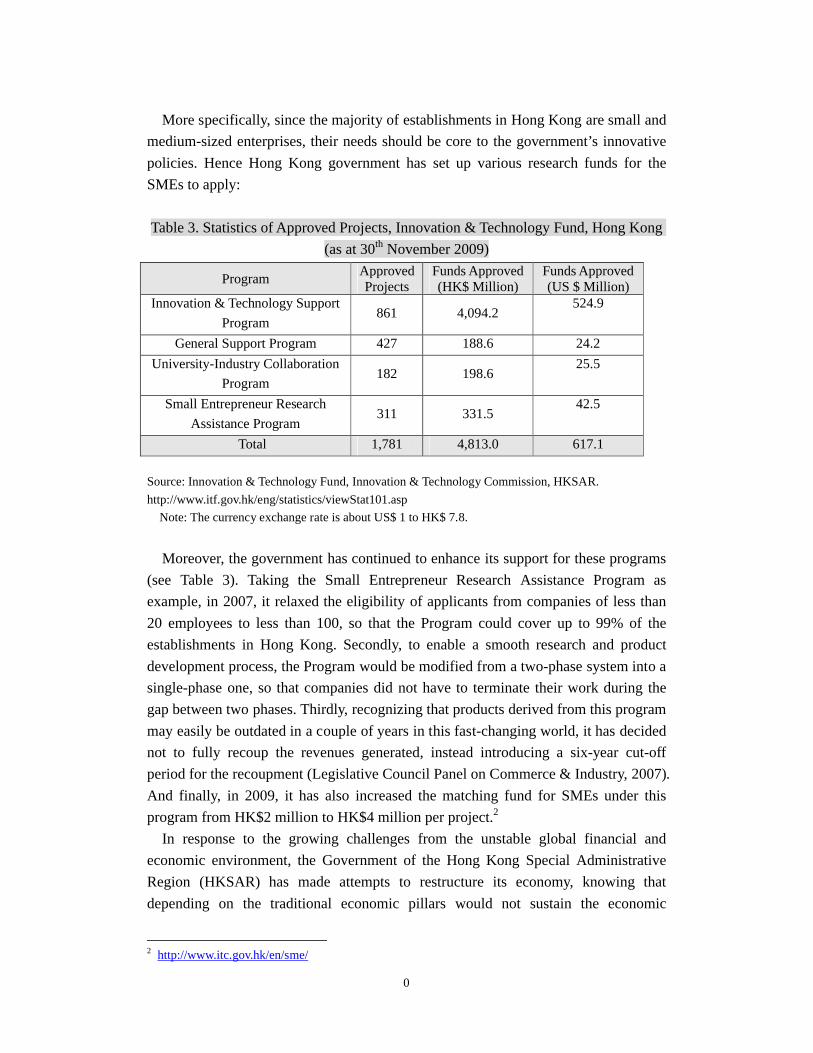
More specifically, since the majority of establishments in Hong Kong are small and
medium-sized enterprises, their needs should be core to the government’s innovative
policies. Hence Hong Kong government has set up various research funds for the
SMEs to apply:
Table 3. Statistics of Approved Projects, Innovation & Technology Fund, Hong Kong
(as at 30th November 2009)
ProgramApproved Projects
Funds Approved (HK$ Million)
Funds Approved(US $ Million)
Innovation & Technology Support
Program861 4,094.2
524.9
General Support Program 427 188.6 24.2
University-Industry Collaboration
Program182 198.6
25.5
Small Entrepreneur Research
Assistance Program311 331.5
42.5
Total 1,781 4,813.0 617.1
Source: Innovation & Technology Fund, Innovation & Technology Commission, HKSAR.
http://www.itf.gov.hk/eng/statistics/viewStat101.asp
Note: The currency exchange rate is about US$ 1 to HK$ 7.8.
Moreover, the government has continued to enhance its support for these programs
(see Table 3). Taking the Small Entrepreneur Research Assistance Program as
example, in 2007, it relaxed the eligibility of applicants from companies of less than
20 employees to less than 100, so that the Program could cover up to 99% of the
establishments in Hong Kong. Secondly, to enable a smooth research and product
development process, the Program would be modified from a two-phase system into a
single-phase one, so that companies did not have to terminate their work during the
gap between two phases. Thirdly, recognizing that products derived from this program
may easily be outdated in a couple of years in this fast-changing world, it has decided
not to fully recoup the revenues generated, instead introducing a six-year cut-off
period for the recoupment (Legislative Council Panel on Commerce & Industry, 2007).
And finally, in 2009, it has also increased the matching fund for SMEs under this
program from HK$2 million to HK$4 million per project.2
In response to the growing challenges from the unstable global financial and
economic environment, the Government of the Hong Kong Special Administrative
Region (HKSAR) has made attempts to restructure its economy, knowing that
depending on the traditional economic pillars would not sustain the economic
2 http://www.itc.gov.hk/en/sme/

0
development of the city-state. Most recently, the Chief Executive of the HKSAR
outlined the plans of the government to develop six new industries - education
services, medical services, testing and certification services, environmental industries,
innovation and technology, and cultural and creative industries. Despite the fact that
the Government of the HKSAR seems to take technology and innovation more serious,
we have not seen a fundamental shift in the policy orientation. The Chief Executive
stated in his policy address that: ‘The Government will allocate about $200 million to
launch an “R&D Cash Rebate Scheme”, under which enterprises conducting applied
R&D projects with the support of the Innovation and Technology Fund or in
partnership with local designated research institutions will enjoy a cash rebate
equivalent to 10% of their investments’ (Policy Address 2010, The Government of the
HKSAR, 2009). In this regard, the government still maintains as a facilitator and
enabler for promotion of innovation and technology, leaving the industry and the
university to decide what to do instead of performing a strong leading role in directing
R & D development in the city-state. Analyzing the Hong Kong case in the light of
the Triple Helix Model, the promotion and development of innovation and technology
in Hong Kong is more market-driven and firm-led.
Taiwan
Comparing to other Asian economies, Taiwan is one of the strongest R&D
promoters in East Asia; it has been internationally renowned for its electronic and
computer goods. Its semiconductor industry was particularly praised as the “Silicon
Valley of the East” (Mathews, 1997). Since the commencement of its industrialization
in the 1960s, Taiwanese government has actively pushed for the development of
industry, based on the presumption that industrial and technological latecomers like
Taiwan urgently entail the state’s solid support to jumpstart and secure the
development process.
In the midst of Asian Financial Crisis in 1997/1998, Taiwan stated explicitly to
develop itself into a “technologically advanced nation”. On April 2 1998, the
Executive Yuan of Taiwan proposed the “Action Plan for Building a Technologically
Advanced Nation” (Executive Yuen, 1998). The Plan stated that S&T development in
Taiwan means to (1) raise the standards of S&T as a whole; (2) promote economic
development; (3) raise the standard of living; and (4) establish an autonomous
national defense capability. Accordingly, the government is very eager to make
Taiwan into an “academic research and knowledge creation hub in Asia-Pacific
region” (National Science Council 2003: 14).
Taiwan’s technological and innovative capacities have long been internationally
recognized ever since its efforts of industrial upgrading in the 1970s-80s. One of the
prominent indicators is that the number of US patents that Taiwan acquired increases

0
steadily each year (see Table 4). Although Taiwan’s ranking in the Global
Competitiveness Index falls on a declining trend from 13th in 2006/07 to 14th in
2007/08 and to 17th in 2008/09, its ranking in the World Bank’s Knowledge Economy
Index has nevertheless jumped from 24th in 1995 to 17th in 2008, which was ahead of
Japan, Hong Kong, Singapore, China and Malaysia. Furthermore, its Innovation Index
was ranked 10th in 2008.
Table 4. Number of US Patents from Taiwan
Year 2004 2005 2006 2007 2008
Utility Patent 5938 5118 6361 6128 6339
Design Patent 1268 870 1553 1355 1423
Source: US Patent and Trademark Office.
http://www.uspto.gov/web/offices/ac/ido/oeip/taf/cst_dsn.htm;
http://www.uspto.gov/web/offices/ac/ido/oeip/taf/cst_utl.htm
As a technology latecomer as compared to the developed western countries,
Taiwanese government ceaselessly plays a great role in jumpstarting and initiating
R&D activities, as well as cultivating enabling environment. This effort started as
early as the 1960s, for example duty free policy for the production and exportation
concerned. A dozen of industrial estates were also built by the government to
accommodate more labors. In addition to these was the low wages of Taiwanese
labors. All these have created a favorable environment for foreign direct investment
(FDI) (Cheng, 2001). Not only that, right from the very outset of industrialization, the
government has dabbled in R&D activities directly; the National Science Council
(NSC) and the Industrial Technology Research Institute (ITRI, the most important
public research institute) are two of the most important responsible bodies. NSC was
established in 1959 as a branch of the Executive Yuan, playing the role of the Ministry
of S&T in Taiwan. 3 Under its supervision, science parks like the Hsinchu
Science-Based Industrial Park, which was established in 1980, has achieved a
world-class status.
In terms of governance, inspired by the US’s Bayh-Dole Act and the UK’s Patent
Law in the 1990s, Taiwanese government enacted the Fundamental Science and
Technology Act in 1999 to lay down broad principles and future directions for S&T
development. The Act stipulates that the government should issue the National S&T
Development Plan and the White Paper on S&T periodically to document the
progress of S&T development in Taiwan.4
3 NSC website: http://web1.nsc.gov.tw/ct.aspx?xItem=9205&CtNode=995&mp=74 As required by the Act, the Taiwanese government has released the National Science and Technology Development Plan (2001-2004) and National Science and Technology Development Plan (2005-2008); both of them are four-year development plans that outline the missions, strategies and specific measure of technological and innovation policies. In order to better monitor and evaluate the execution and

0
Taiwan’s NIS has consequently benefited greatly from all these measures. For
research input, as noted in Table 5, the amount of R&D expenditure and its share of
GDP have risen modestly over the years, indicating Taiwan’s ever-increasing
emphasis on R&D activities. In terms of the distribution of R&D expenditures by type
of research, experimental development research remains the top kind of Taiwan’s
R&D activities, indicating that its strength is on product development (see Table 6). In
recent years, Taiwan’s research capacity has also been strengthened with the increase
of R&D personnel; a majority of them were recruited by business enterprises,
followed by the government and HEIs (see Table 7).
Table 5. R&D Expenditure (US$ Million) by Sector, Taiwan (2003-2007)
TotalExpenditure
Business Enterprise
GovernmentHigher
EducationPrivate
Non-ProfitAs share of GDP (%)
20037,591.9
(100%)
4,769.2
(62.8%)
1,872.8
(24.7%)
902.8
(11.9%)
47.2
(0.6%)
2.31
20048,227.2
(100%)
5,321.7
(64.7%)
1,910.8
(23.2%)
948.4
(11.5%)
46.4
(0.6%)
2.38
20058,780.6
(100%)
5,887.2
(67.0%)
1,848.2
(21.0%)
1,002.9
(11.4%)
42.3
(0.5%)
2.45
20069,594.9
(100%)
6,476.2
(67.5%)
1,905.2
(19.9%)
1,173.9
(12.2%)
39.7
(0.4%)
2.58
200710,355.8
(100%)
7160.2
(69.1%)
1,895.1
(18.3%)
1,262.5
(12.2%)
38.1
(0.4%)
2.62
Source: National Science Council. 2008. Indicators of Science and Technology 2008.
http://www.nsc.gov.tw/tech/pub_data_main.asp
Note: The currency exchange rate is about US$ 1 to NT$ 32.
Table 6. R&D Expenditure (US$ Million) by Type of R&D, Taiwan (2003-2007)
Basic Research Applied ResearchExperimentalDevelopment
2003
890.8
(11.7%)
2,001.9
(26.4%)
4,699.2
(61.9%)
2004 926.0 2,084.2 5,217.1
feedback of programs outlined by the Plan, the government also released the White Paper on Science and Technology (2003-2006) and White Paper on Science and Technology (2007-2010) respectively. Therefore, the White Paper can be conceived as the mid-term progress report of the Plan.

0
(11.3%) (25.3%) (63.4%)
2005
905.0
(10.3%)
2,319.3
(26.4%)
5,556.3
(63.3%)
2006
975.9
(10.2%)
2,539.7
(26.5%)
6,079.3
(63.4%)
2007
1,037.2
(10.0%)
2,660.1
(25.7%)
6,658.6
(64.3%)
Source: National Science Council. 2008. Indicators of Science and Technology 2008.
http://www.nsc.gov.tw/tech/pub_data_main.asp.
Note: The currency exchange rate is about US$ 1 to NT$ 32.
Table 7. Number of R&D Personnel by Sector, Taiwan (2003-2007)
TotalBusiness
EnterpriseGovernment
Higher Education
Private Non-Profit
2003127,628
(100%)
80,525
(63.1%)
24,449
(19.2%)
21,643
(17.0%)
1,011
(0.8%)
2004138,604
(100%)
89,882
(64.8%)
24,674
(17.8%)
23,017
(16.6%)
1,031
(0.7%)
2005149,153
(100%)
96,714
(64.8%)
25,673
(17.2%)
25,752
(17.3%)
1,014
(0.7%)
2006160,303
(100%)
106,262
(65.9%)
25,673
(17.2%)
27,439
(17.0%)
929
(0.6%)
2007175,742
(100%)
118,005
(67.1%)
27,409
(15.6%)
29,351
(16.7%)
977
(0.6%)
Source: National Science Council. 2008. Indicators of Science and Technology 2008.
http://www.nsc.gov.tw/tech/pub_data_main.asp.
Nevertheless, despite the government’s significant role in shaping the rules and
regulations for R&D activities in Taiwan; it is actually the scientific community and
the market that determine its direction (Chen, 1997; Hsu & Chiang, 2001), such that
“Innovation in Taiwan…is a result of domestic individuals and independent firms”
(Mahmood and Singh, 2003: 1052). SMEs are the driving force of innovation in
Taiwan’s economy, and they have constituted nearly 98% of all the Taiwanese
enterprises:

0
Table 8. Number of Enterprises, Taiwan (2003-2006)
Total SMEs (%) Large Enterprises (%)
2003 1,172,633 1,147,200 (97.83%) 25,433 (2.17%)
2004 1,204,343 1,176,986 (97.73%) 27,357 (2.27%)
2005 1,253,694 1,226,095 (97.80%) 27,599 (2.20%)
2006 1,272,508 1,244,099 (97.77%) 28,409 (2.23%)
Source: SMEA, Ministry of Economic Affairs, ROC.
http://www.moeasmea.gov.tw/public/Data/81711253871.pdf.
In view of this, the Small and Medium Enterprise Administration (SMEA) of the
Ministry of Economic Affairs has undertaken a series of programs to assist SMEs in
recent years. Examples are the Small Business Innovation Research Program,
Industrial Technology Development Plan, Innovative Technology Applications and
Services Program, Conventional Industry Technology Development Initiative, and the
Assist Service Sector Technology Development Plan. These programs aim to facilitate
the start-up of SMEs and their technical upgrading, through which university-industry
collaborations are carried out. Unlike the vertically-integrated big corporations in
South Korea that aims at economies of scale, the horizontally-networked SMEs in
Taiwan has more organizational flexibility to adapt to the changing export demands.
Yet because of their small sizes, they have to depend on state and university support
on R&D. (Wang, 2007). A recent statistical study indicates that, SMEs tend to
cooperate with public universities which have more resources than private universities
to help SEMs in the emerging industries like biotechnology and nanotechnology (Hu
and Mathews, 2009).After reviewing the research and development, especially examining the role of
different sectors including the state, industry and the university in promoting
technology and innovation in Taiwan, we have witnessed the driving force for
innovation and technology development originated from a state-led model towards a
more firm-led approach in Taiwan. In most recent years, the role of the firms is
becoming increasingly significant in advancing the technology and innovation in
Taiwan, particularly the closer collaborative relationship between SEMs and
universities through various technology / innovation development initiatives strongly
encouraged by the state with positive responses and active participation of the
industry / firms and universities. The Taiwan case has clearly demonstrated a
continuum of state-industry-university collaborations, with a growing prominence of
the industry / firms in collaborations with the university sector in promoting
technology / innovation.

0
South Korea
South Korea is a fast-catcher in S&T since its inception of industrialization.
Throughout the process, the state has played an aggressive role particularly during the
1970s-80s by setting up government research institutes and science parks. Unlike
Taiwan and Hong Kong where SMEs acquire a core role in the economy, South
Korean economy is dominated by Chaebols (big corporations) with the state’s strong
support. Since the Chaebols have abundant resources to set up their own in-house
research units, their reliance on university-industry linkages are rare. In light of this,
the Korean government has actively pushed for the university-industry collaboration
and has ultimately transformed the role of Korean universities from teaching into
research and entrepreneurial activities.
South Korea is catching up with the technologically-advanced countries by
expanding its innovation system in recent years, and its determination has clearly
revealed in the Plan to Construct a National Innovation System announced in 2004.
According to the Global Competitiveness Index, South Korea’s ranking has
significantly improved from 23rd in 2006/07 to 11th in 2007/08 and to 13th in 2008/09.
However, it was ranked 31st in the World Bank’s Knowledge Economy Index in 2008,
slightly dropped from 28th in 1995. Comparatively, its Innovation Ranking was 23rd.
Regardless of the different results of rankings, the improvement of South Korean
innovation system is best illustrated in its hard outputs, namely the significantly
increased number of US patents acquired (see Table 9).
Table 9. Number of US Patents from South Korea, 2004-2008
2004 2005 2006 2007 2008
Utility Patent 4428 4352 5908 6295 7549
Design Patent 238 233 589 957 1159
Source: US Patent and Trademark Office.
http://www.uspto.gov/web/offices/ac/ido/oeip/taf/cst_dsn.htm;
http://www.uspto.gov/web/offices/ac/ido/oeip/taf/cst_utl.htm
In meeting the goal of constructing an innovation-based economy, the status of the
research capacity of South Korean innovation system seems to suggest a possible
future. As shown in Table 10, the number of its R&D personnel (researchers, research
assistants, and other supporting persons) has increased constantly since the 2000s:
Table 10. Number of R&D personnel, South Korea (2000-2005)
Year Total ResearchersResearchAssistants
Other Supporting Persons
FTE FTE
0
2000 237,232 138,077 159,973 108,370 61,027 16,232
2001 261,802 165,715 178,937 136,337 62,738 20,127
2002 279,806 172,270 189,888 141,917 69,021 20,897
2003 297,060 186,214 198,171 151,254 75,283 23,606
2004 312,314 194,055 209,979 156,220 76,730 25,605
2005 335,428 215,345 234,702 179,812 75,179 25,547
Source: Website of the Ministry of Education, Science and Technology (MEST), South Korea.
http://english.mest.go.kr/main.jsp?idx=0402020101
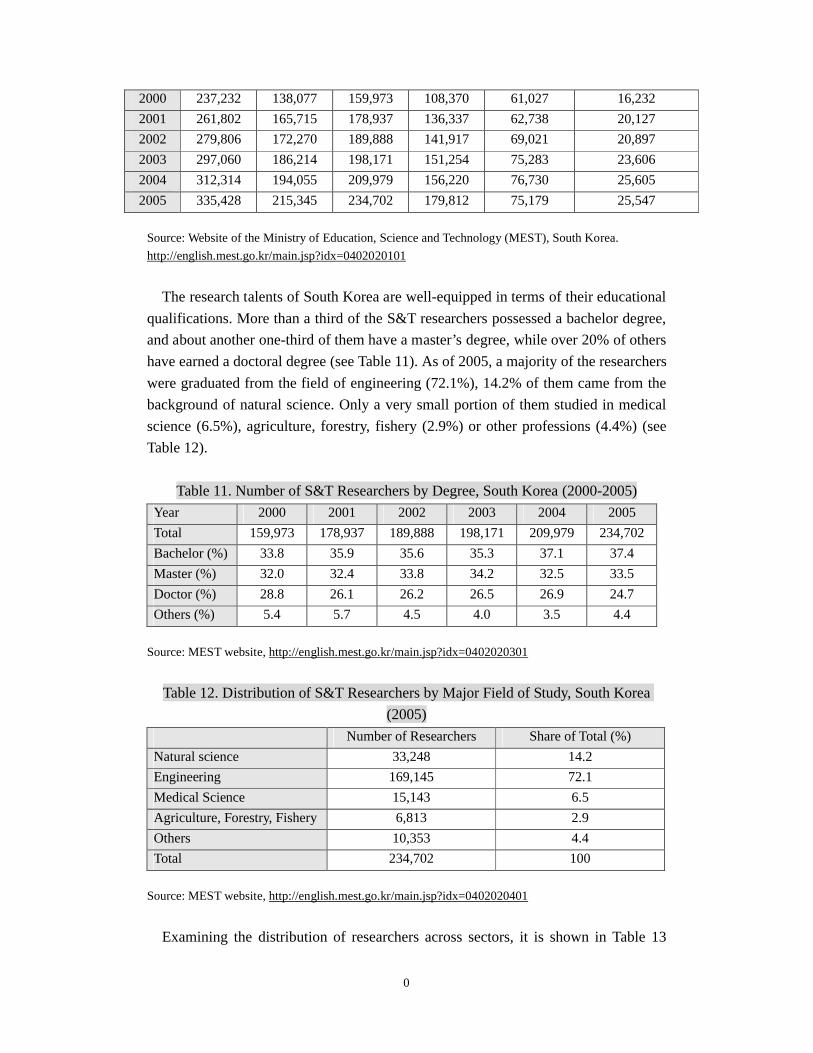
The research talents of South Korea are well-equipped in terms of their educational
qualifications. More than a third of the S&T researchers possessed a bachelor degree,
and about another one-third of them have a master’s degree, while over 20% of others
have earned a doctoral degree (see Table 11). As of 2005, a majority of the researchers
were graduated from the field of engineering (72.1%), 14.2% of them came from the
background of natural science. Only a very small portion of them studied in medical
science (6.5%), agriculture, forestry, fishery (2.9%) or other professions (4.4%) (see
Table 12).
Table 11. Number of S&T Researchers by Degree, South Korea (2000-2005)
Year 2000 2001 2002 2003 2004 2005
Total 159,973 178,937 189,888 198,171 209,979 234,702
Bachelor (%) 33.8 35.9 35.6 35.3 37.1 37.4
Master (%) 32.0 32.4 33.8 34.2 32.5 33.5
Doctor (%) 28.8 26.1 26.2 26.5 26.9 24.7
Others (%) 5.4 5.7 4.5 4.0 3.5 4.4
Source: MEST website, http://english.mest.go.kr/main.jsp?idx=0402020301
Table 12. Distribution of S&T Researchers by Major Field of Study, South Korea
(2005)
Number of Researchers Share of Total (%)
Natural science 33,248 14.2
Engineering 169,145 72.1
Medical Science 15,143 6.5
Agriculture, Forestry, Fishery 6,813 2.9
Others 10,353 4.4
Total 234,702 100
Source: MEST website, http://english.mest.go.kr/main.jsp?idx=0402020401
Examining the distribution of researchers across sectors, it is shown in Table 13

0
that the majority of researchers reside in companies (over 60%), followed by
universities (about 30%) and public research institutes (less than 10%). Among the
companies, large companies have dominated the share of researchers (see Table 14). It
is such a remarkable concentration that by 2005, the top 20 companies in South Korea
in fact possessed 39.7% of researchers in this sector (see Table 15).
Table 13. Number of Researchers by Sector of Performance, South Korea
(2000-2005)
Total Public Research Institutes(%)
Universities(%)
Companies(%)
2000 159,973 8.7 32.3 59.0
2001 178,937 7.8 30.0 62.2
2002 189,888 7.4 30.4 62.2
2003 198,171 7.3 30.1 62.7
2004 209,979 7.5 28.5 64.0
2005 234,702 6.6 27.6 65.7
Source: MEST website, http://english.mest.go.kr/main.jsp?idx=0402020201
Table 14. Number of Researchers by Size of Companies, South Korea (2003-2005)
2003 2004 2005
Large Companies71,698
(57.8%)
79,910
(59.5%)
91,514
(59.3%)
Small and
Medium-Sized
27,390
(22.1%)
28,683
(21.4%)
30,619
(19.8%)
Venture Business24,942
(20.1%)
25,707
(19.1%)
32,193
(20.9%)
Total124,030
(100%)
134,300
(100%)
154,306
(100%)
Source: MEST website, http://english.mest.go.kr/main.jsp?idx=0402040301
Table 15. Concentration Rate of Researchers in Top Companies, South Korea
(2000-2005)
2000 2001 2002 2003 2004 2005
Top 5 29.6 24.7 24.7 27.5 29.9 30.6
Top 10 34.8 28.8 28.3 30.9 33.7 34.8
Top 20 40.2 33.0 33.1 48.4 38.8 39.7
Source: MEST website, http://english.mest.go.kr/main.jsp?idx=0402040201
With the increase in R&D personnel, the amount of total R&D expenditures and
their shares of GDP kept rising since the 2000s accordingly (see Table 16). It points to

0
the fact that R&D has continuously occupied a more important place in the economy.
Private companies, with their huge team of researchers, undoubtedly spend the most
on R&D (over 70%). Likewise, R&D expenditures were highly concentrated in top
companies. As of 2005, the top 20 companies spent about 55.6% of the R&D
expenditures in this regard (see Table 17). Table 18 also indicates that private sector is
the dominant source of R&D funding in South Korea. The ratio of private sector to
government in terms of funding maintains a stable pattern since 2000. As of 2005, the
percentage ratio of private to public was 76 to 24.
Table 16. R&D Expenditure by Sector of Performance, South Korea
(in US$ Million )
TotalPublic Research
InstitutesUniversities Companies
Total Expenditure as Share of GPD
% % % (%)
2000
12,298.81,804.6
14.71,387.1
11.39,107.2
74.0 /
200114,307.7 1,918.5
13.41,489.2
10.410,900.2
76.2 2.59
200215,386.4 2,267.0
14.71,596.0
10.411,523.4
74.9 2.53
200316,934.9 2,332.5
13.81,716.4
10.112,886.1
76.1 2.63
200419,702.8 2,632.9
13.41,954.6
9.915,115.3
76.7 2.85
200521,452.4 2,835.6
13.22,129.9
9.916,486.9
76.9 2.99
Source: MEST website, http://english.mest.go.kr/main.jsp?idx=0402010301.
Note: The currency exchange rates of Korean Won to US dollars fluctuate a lot in recent years. We take
the exchange rate on 20th January 2010 for analysis, which was about US$ 1 to KRW$ 1,126.
As shown in Table 16, universities in South Korea are the least spender on R&D
activities (constituting about 10% of the total R&D expenditures), lagging behind the
government (about 13 to 14%) and companies (over 70%). It is illustrated that
universities do not play a leading role in driving innovation in South Korea because
major firms / industries have played a far more important role in promoting R & D (It
will be discussed more in later sections).
Table 17. Concentration Rate of R&D Expenditure in Top Companies, South Korea (%)
2000 2001 2002 2003 2004 2005
Top 5 34.8 35.6 37.5 37.0 40.4 42.0

0
Top 10 45.9 43.4 43.2 43.7 47.7 48.4
Top 20 55.4 49.8 49.6 51.7 55.0 55.6
Source: MEST website, http://english.mest.go.kr/main.jsp?idx=0402040201
Table 18. Trend of R&D Expenditure by Source of Fund, South Korea
(in Million US dollars)
2000 2001 2002 2003 2004 2005
Total12,298.8 14,307.7 15,386.4 16,934.9 19,702.8 21,452.4
Government & Public3,389.8 3,873.4 4,209.6 4,330.6 4,836.6 5,219.5
Private8,901.8 10,367.1 11,109.1 12,534.3 14,769.9 16,080.6
Foreign7.3 67.2 67.8 70.1 96.3 152.2
Government : Private
(Percentage Ratio)28:72 27:73 27:73 26:74 25:75 24:76
Source: MEST website, http://english.mest.go.kr/main.jsp?idx=0402010201
Note: The currency exchange rates of Korean Won to US dollars fluctuate a lot in recent years. We take
the exchange rate on 20th January 2010 for analysis, which was about US$ 1 to KRW$ 1,126.
In sum, the national innovation system of South Korea has evolved from one that
was public-institutes-centered to private-companies-centered since the 1980s (Lee,
2006), and the trend continues till now. It can also be observed that this private-driven
national innovation system is “bipolarized” in nature, referring to the dual structure of
strong chaebols on the one end and weak SMEs on the other (Lim, 2008). Analyzing
the South Korea case in the light of the Triple Helix Model, the national innovation
system, as similar to Singapore’s, is inclined to state-led approach but at the same
time more firm-led.
Singapore
Since its independence from the British in 1965, Singapore has gone through
multiple stages of industrialization and economic revitalization, which are always
taken into comparison with other “Asian Miracle” economies — Hong Kong, Taiwan,
and South Korea. Many would argue that its economic take-off as latecomer over the
last few decades is likewise attributed to its effective industrial policy making by the
government to attain a desired macro-economic environment for industrial
development (Goh, 2005; Hu and Mathews, 2005).
Under the small-open economic framework, as a market price-taker Singapore
0
government has adopted strong interventions in labour, land, and industrial
development to ensure its transition from a third-world to a first-world country.
During 1960s and 1970s, facing the scarcity of natural resources, Singapore directed
the industrial policies towards employment-creation, using favorable incentives to
attract foreign direct investment and multi-national companies (MNCs) to increase
productive capacity. Gradually, a vibrant manufacturing sector was formed and
dominated the economy. Unlike other “Asian Miracles”, Singapore primarily relied
upon MNCs to produce the knowledge spillovers and technology transfers necessary
to develop its national technological capability rather than indigenous R&D, for
example, the initial intention of the government to establish a Singapore Science Park
was to attract Foreign Direct Investment (FDI) and MNCs. But past experiences show
that such over-reliance on FDI and MNCs had constrained the country’s ability to
resist external economic crisis as global competition intensifies (Goh, 2005). 5
Thereafter, Singapore began the pursuit of sustainable economic growth through
promoting entrepreneurship and raising the quality of indigenous human capital to
international standards (Tan 2003). In 1989, Singapore government created the first
Small and Medium-Sized Enterprise (SME) Master Plan to introduce measures and
assistant schemes for SME development and to improve entrepreneurial infrastructure.
Moreover, entrepreneurial mindset was introduced in civil services through the Public
Service for the 21st Century in 1995; a deliberate exercise aimed at nurturing
entrepreneurial attitude of excellence and fostering an entrepreneurship-friendly
environment in the public service. In 2000, the Enterprise Challenge (a branch under
the Prime Minister’s Office) even set up a S$10 million fund to sponsor innovative
projects which may improve the provision of public service. Hit by the 1997 Asian
financial crisis, the government released the second Master Plan (SME21) in 2001,
calling for urgency to inspire entrepreneurship yet again in Singapore. Meanwhile, it
also actively promoted spending in the private sector through various incentives.
To maintain its attractiveness as a place for business of the future, in recent years
Singapore has gradually switched its developmental focus from a large manufacturing
base for MNCs to a dynamic innovation hub that supports high-tech manufacturing
and R&D, which is best indicated by the steady and continuous increase of R&D
expenditure as a percentage of annual GDP (see Figure 2). Singapore’s S&T
advancement in the last two decades is accomplished through four five-year National
S&T Plan (1991-1995, 1996-2000, 2001-2005, and 2006-2010).
5 Having experienced the Asian financial crisis 1997-98 and the recent global economic crisis, the Singapore government has realized the importance of diversifying its national investment and recognized the problems of relying heavily on FDI and MNCs since they may be unstable during times of economic crisis.

0
Figure 2. Gross Domestic R&D Expenditure as a Percentage of GDP, Singapore
(1997 -2007, GRDE/GDP)
0
0.5
1
1.5
2
2.5
3
1997 1998 1999 2000 2001 2002 2003 2004 2005 2006 2007
Percentage (%)
Source: A*STAR, Singapore National Science and Technology Survey (various years).
Realizing its over-dependence on foreign MNCs for technological upgrades and its
week indigenous technology development after the first economic recession, in the
early 1990s the Singaporean government planned to double R&D investment in the
coming years, targeting primarily long-term strategic research (Koh, 2006). The first
five-year National S&T Plan has invested a total of S$2 billion to develop key
resources in technology, manpower and skills to meet the needs of industry. During
the plan, the National Science and Technology Board (NSTB) was assigned to
develop new research institutes for a number of identified key research areas,
including biotechnology, food and agro-technology, information technology and
telecommunication, microelectronics and semi-conductors.
In the second plan from 1996 to 2000, the government envisioned “an innovative
and enterprising society that embraces science and technology to develop a thriving
knowledge economy and good quality of life”, and therefore shifted its developmental
strategy to domestic capacities in applied and basic scientific researches. In order to
meet the world-class science and technological capacities, it had been set that by the
end of this period, government’s R&D expenditure should reach 2.6 percent and the
research talent pool should be strengthened to achieve the level of 65 research
scientists per 10,000 workers. These targets were achieved two years ahead of time
with S$4 billion of investment funding. A number of new policy initiatives promoting
technology entrepreneurship were also released at the same time in order to firm up
coordination between scientific infrastructure and industrial capacity.6
6 In 1997, an inter-agency team comprising representatives from the NSTB, the Economic Development (EDB), and the Singapore Productivity and Standards Board (SPSB) was formed to make an extensive discussion on strategies for innovation in consultation with various industrial departments. Subsequently, a National Innovation Framework for Action (NIFA) was drafted in the followingyear to identify critical success factors for innovation to flourish, and to recommend the government

0
In the first two S&T National Plans, the government started to realize that it should
work more efficiently with private companies in exploiting technological innovation
by facilitating them to develop their innovation capacities. In this regard, a number of
financial assistances and tax incentive programs were therefore designed to promote
innovation, especially among the SMEs.7 Major financial schemes which aim at
promoting technology commercialization include the Research Incentive Scheme for
Companies, the Research and Development Assistance Scheme, and the Patent
Application Fund.
The third S&T National Plan from 2001 to 2005 marked another phase of R&D in
Singapore as it emphasized the crucial role of research institutions and universities in
undertaking research of several strategic areas with medium-to-long run relevance
(MTI, 2006). Half of the S$7 billion budget was channeled into technology
development and R&D experiments, while 30 percent was used to encourage
corporate labs to set up research centers in Singapore. The remainder has been
pumped into broad-based manpower development, which includes fellowship training
programs and postgraduate scholarships. In addition, the fourth S&T National Plan
from 2006 to 2010 intended to strengthen the support to SMEs, promote technology
transfer and intellectual property management, and to create incentives that could
attract international talents to Singapore.
With the assistance of the government policies, universities started to take up a
more significant role in the recent decade, especially in the establishment of science
parks. In 2000, the government announced a devolvement of S$15 billion to establish
a new science park targeting bio-sciences and information technology as new growth
engines of Singapore’s economy (A*STAR, 2009). This One-North Project was
modeled after Silicon Valley to create a multifaceted high-tech research community.
With a focus on knowledge-intensive activities in critical growth sectors, it would
provide an intellectually stimulating and creative physical environment for
entrepreneurs and researchers to congregate and exchange ideas. Focusing on the full
range of production activities, it includes not only research institutes and business
offices, but residential properties, shopping, public parks and other facilities as well.
Like any other science parks around the world, the new science parks are located
adjacent to several universities: the National University of Singapore, the Institute of
Technical Education, the Singapore Polytechnic, and the National University
Hospital.8 The efforts being put together by the Singapore Government has paid off
accordingly. The eight critical success factors include education & training, government policies, government support, information, infrastructure, technology, market, and human resources.7 For example, it extends the pioneer or post-pioneer status for SMEs who undertake approved R&D activities with a concessionary tax rate; provides more liberalized double deduction for R&D expenses; permits investment allowance for all capital expenditure incurred for approved R&D activities; and allows for a tax-exempted R&D reserve for companies.8 Developed by JTC at a cost of S$500 million, the first phase of Biopolis, a custom-built biomedical R&D hub at One-North, comprises a seven-building complex and five biomedical sciences

0
since the ranking of the city-state in global ranking related to innovation has improved
in the most recent years (see discussion below).
Analyzing the development of innovation and technology development in
Singapore, it is clear that the national innovation system is more government-led
despite the fact that the Singapore government has made attempts to facilitate more
deep collaborations between the industry (especially more with SMEs) and the
university in driving technology and innovation development in the city-state.
Japan
Having been defeated in the Second World War, Japan quickly positioned itself as
an industrial and a manufacturing economy right after the War. Since then, the
government has taken various important steps, laid out countless plans and programs
to strengthen the industrial base, but it was only until the 1980s and 1990s that the
higher education sector began to involve in the industrial world and help it to innovate.
While the overall higher education sector continues to reach out to the industry
through research, it is the national universities that take the leading and dominant role,
alongside with the public and private universities, in advancing university-industry
research collaborations. The Japanese government is deeply engaged in this
transformation of the role of Japanese universities from providing academic teaching
& research to pursuing entrepreneurial activities. This is best indicated by the
government’s decision to merge the Science and Technology Agency with the
Ministry of Education to form the Ministry of Education, Culture, Sports, Science and
Technology in the early 2000s. Yet overall speaking, the majority of Science and
technological R&D activities in Japan are carried out by business enterprises.
During the 1960s when the Japanese government aspired to strengthen the nation’s
industrial base, the Ministry of International Trade and Industry launched the
Large-Scale Industrial Research and Development System, bridging the partnership
between universities and the industrial sector. However, Japanese universities ended
up playing a very small role in it; while private enterprises became the major driving
force of innovation since then. Yet in addition to other programs initiated by the
Science and Technology Agency and the Ministry of Education since the 1980s, the
90s marked a recent watershed of R&D in Japan when the government decided to
promote economic growth through scientific and technological development in face of
sub-research institutes, which are home to 2,000 scientists. A total of four phases will be finished by 2010. Another milestone in One-North development, the Fusionopolis, is a R&D centre for electronics and information technology launched in 2003. Fusionopolis’ research teams will be formed by scientists from multidiscipline, including materials science & engineering, data storage, microelectronics, manufacturing technology, high performance computing, and information &communications. Companies in Fusionopolis could co-locate and engage in R&D collaboration with the Science and Engineering Research Council, making Fusionopolis an icon for public-private joint R&D in the physical sciences and engineering.
0
economic stagnation. The Basic Law for Science and Technology was enacted in
1995, stipulating the government’s responsibility to introduce five-year plans for S&T
advancement (Jiang et al., 2007). R&D activities in universities were also buttressed
by education reforms since the 1990s that enable universities and their personnel to
undertake such activities. The implementation of the Basic Law has successfully
steered the development of research and development in Japan, making the country
more innovative in the last decade (see details in discussion below).
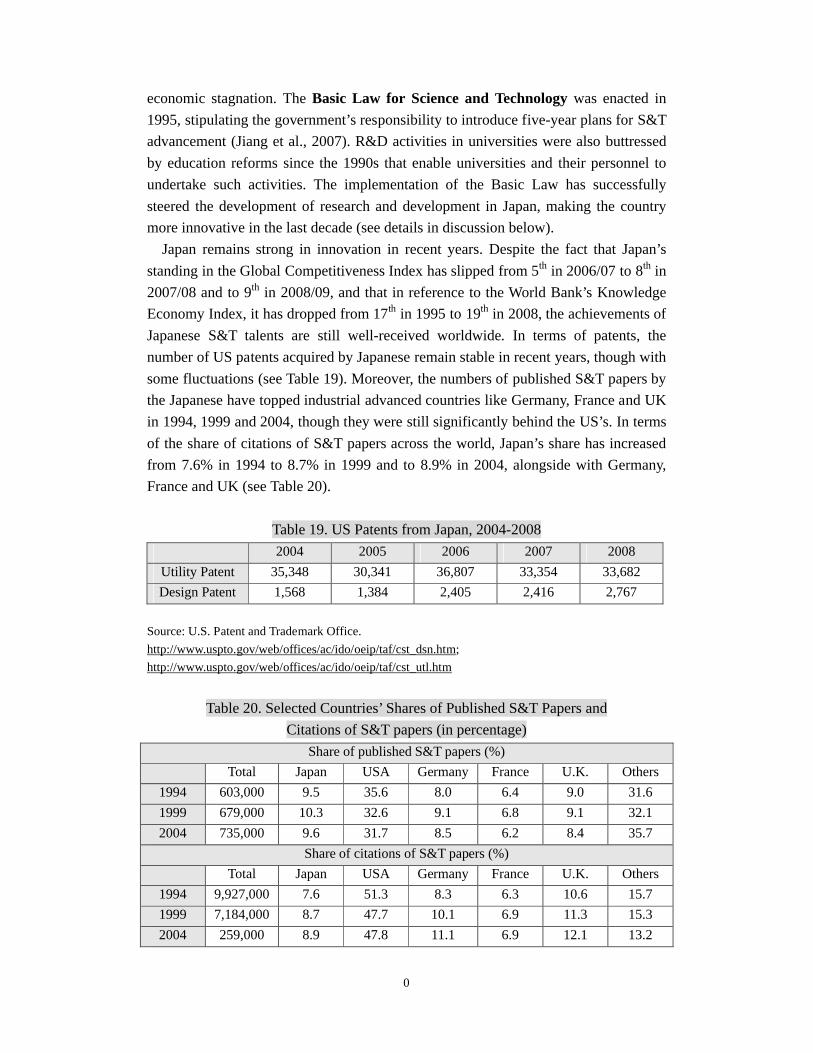
Japan remains strong in innovation in recent years. Despite the fact that Japan’s
standing in the Global Competitiveness Index has slipped from 5th in 2006/07 to 8th in
2007/08 and to 9th in 2008/09, and that in reference to the World Bank’s Knowledge
Economy Index, it has dropped from 17th in 1995 to 19th in 2008, the achievements of
Japanese S&T talents are still well-received worldwide. In terms of patents, the
number of US patents acquired by Japanese remain stable in recent years, though with
some fluctuations (see Table 19). Moreover, the numbers of published S&T papers by
the Japanese have topped industrial advanced countries like Germany, France and UK
in 1994, 1999 and 2004, though they were still significantly behind the US’s. In terms
of the share of citations of S&T papers across the world, Japan’s share has increased
from 7.6% in 1994 to 8.7% in 1999 and to 8.9% in 2004, alongside with Germany,
France and UK (see Table 20).
Table 19. US Patents from Japan, 2004-2008
2004 2005 2006 2007 2008
Utility Patent 35,348 30,341 36,807 33,354 33,682
Design Patent 1,568 1,384 2,405 2,416 2,767
Source: U.S. Patent and Trademark Office.
http://www.uspto.gov/web/offices/ac/ido/oeip/taf/cst_dsn.htm;
http://www.uspto.gov/web/offices/ac/ido/oeip/taf/cst_utl.htm
Table 20. Selected Countries’ Shares of Published S&T Papers and
Citations of S&T papers (in percentage)
Share of published S&T papers (%)
Total Japan USA Germany France U.K. Others
1994 603,000 9.5 35.6 8.0 6.4 9.0 31.6
1999 679,000 10.3 32.6 9.1 6.8 9.1 32.1
2004 735,000 9.6 31.7 8.5 6.2 8.4 35.7
Share of citations of S&T papers (%)
Total Japan USA Germany France U.K. Others
1994 9,927,000 7.6 51.3 8.3 6.3 10.6 15.7
1999 7,184,000 8.7 47.7 10.1 6.9 11.3 15.3
2004 259,000 8.9 47.8 11.1 6.9 12.1 13.2

0
Source: MEXT website, http://www.mext.go.jp/english/statist/06060808/pdf/153.pdf
Similar to South Korea, Japan’s innovation system is business-driven. For research
capacity, an overwhelming majority of the R&D performing institutions reside in
business enterprises (over 80%), significantly outnumbering those in universities &
colleges (over 10%), non-profit institutions and public organizations (see Table 21).
Accordingly, the industrial sector and the universities & colleges compose the
majority of R&D personnel. As of 2005, the former employed about 58.2% of the
R&D personnel, while the latter 34.2% (see Table 22).
Table 21. Number of R&D Performing Institutions, Japan (2000-2004)
TotalBusiness
EnterprisesNon-Profit Institutions
Public Organizations
Universities &Colleges
200027,061
(100%)
22,789
(84.2%)
613
(2.3%)
632
(2.3%)
3,027
(11.2 %)
200122,056
(100%)
17,903
(81.2%)
523
(2.4%)
615
(2.8%)
3,015
(13.7%)
200218,468
(100%)
14,258
(77.2%)
520
(2.8%)
599
(3.2%)
3,091
(16.7%)
200329,663
(100%)
25,440
(85.8%)
507
(1.7%)
596
(2.0%)
3,120
(10.5%)
200428,608
(100%)
24,290
(84.9%)
488
(1.7%)
601
(2.1%)
3,229
(11.3%)
Source: MEXT website, http://www.mext.go.jp/english/statist/06060808/pdf/140.pdf
Table 22. R&D Personnel by Occupation, Japan (as share of total, %)
2000 2001 2002 2003 2004 2005
Total1,022,079
(100%)
1,000,014
(100%)
972,495
(100%)
968,092
(100%)
994,348
(100%)
1,009,937
(100%)
Industry604,544
(59.1%)
581,721
(58.2%)
561,735
(57.8%)
555,772
(57.4%)
580,628
(58.4%)
587,414
(58.2%)
Government59,025
(5.8%)
59,254
(5.9%)
62,768
(6.5%)
63,906
(6.6%)
61,893
(6.2%)
61,769
(6.1%)
Universities & Colleges330,509
(32.3%)
331,049
(33.1%)
330,654
(34.0%)
331,499
(34.1%)
335,983
(33.8%)
345,274
(34.2%)
Private Research
Institutes
28,001
(2.7%)
27,990
(2.8%)
17,338
(1.8%)
16,915
(1.7%)
15,844
(1.6%)
15,480
(1.5%)
Source: MEXT website, http://www.mext.go.jp/english/statist/06060808/pdf/141.pdf
In terms of research input, the total R&D expenditures have increased very
modestly from 2000 to 2004, yet different sectors experienced different trends. While

0
non-profit institutions, public organizations, universities & colleges suffer a decline in
R&D expenditures, the share of business enterprises increased from 66.7% in 2000 to
71.2% in 2004 (see Table 23). It is therefore shown that business enterprises has
continuously been the most important R&D player in Japan, while the role of the
government, comparatively, is much less significant (see Table 24)
Table 23. R&D Expenditure by Sector, Japan (2000-2004)
YearTotal
(million US$)
Business Enterprises (%)
Non-Profit Institutions (%)
Public Organizations (%)
Universities &Colleges (%)
2000178,718.9
66.7 4.3 9.3 19.7
2001181,337.4
69.3 2.2 9.0 19.6
2002182,950.8
69.4 2.0 8.9 19.7
2003184,367.3
70.0 1.9 8.7 19.4
2004185,831.2
71.2 1.8 8.8 19.3
Source: MEXT website, http://www.mext.go.jp/english/statist/06060808/pdf/146.pdf
Note: The currency exchange rates of Japanese Yen to US dollars fluctuate a lot in recent years. We
take the exchange rate on 20th January 2010 for analysis, which was about US$ 1 to 91.145 Yen.
Table 24. Total and Government-Funded R&D Expenditure, and as Share of GDP,
Japan (2000-2004)
Year
Total R&D Expenditures Government-Funded R&D Expenditures
Total(million
US$)
As share of GDP (%)
Total(million US$ )
As share of total R&D expenditure (%)
As share of GDP (%)
2000178,718.9
3.1738,847.6
21.7 0.69
2001181,337.4
3.3038,147.4
21.0 0.69
2002182,950.8
3.3537,881.2
20.7 0.69
2003184,367.3
3.3537,240.5
20.2 0.68
2004185,831.2
3.3537,179.9
20.0 0.67
Source: MEXT website, http://www.mext.go.jp/english/statist/06060808/pdf/145.pdf
Note: R&D expenditures as share of GDP are calculated by the author.

0
In sum, similar to the situation of its higher educational sector, the Japanese
industrial sector is also improving steadily along the years in terms of the stable
amount of R&D institutions, R&D personnel and R&D expenditures. Similar to the
development of South Korea and Taiwan, the advancement in research and
development was steered and started by the state in decades ago but recent drives for
technology and innovation advancement has relied heavily on the industry and the
university.
Promotion of Innovation and Global Competitiveness: An Assessment
Comparing and contrasting the developments of innovation of the above five
selected cases has clearly shown the important role that the government has
performed in the promotion of technology and innovation, especially during the
inception / initiation phase of the development cycle. Among five Asian economies,
Hong Kong is the only exception because the government of Hong Kong has never
played a strong steering role in promotion of innovation and technology until recently
when the government starts to realize the need to catch up with other
technologically-advanced countries, while the rest of cases under review have
suggested the role of the government has been crucial in driving the agenda for
innovation advancement, acting as the initiator and facilitator of such undertaking. In
Taiwan, although the government is very keen on enhancing R&D activities, industry
(especially SMEs) and universities also play an important role in it, thus there is a
closer and more equal co-operation among the three stakeholders in the Triple Helix
Model. Singapore, Japan and South Korea share a similar pattern that their innovation
systems are led by both the state and industry (especially big corporations), yet the
three countries also differ in one important aspect, that is the nature of those
corporations. In Singapore, the government welcomes foreign investments and
companies, sometimes we may even find that the government favours foreign
companies in order to attract them to invest in Singapore. But in Japan and South
Korea, big corporations are mostly local in nature as they regard local industries as
their national strengths, which need to be protected and supported. Therefore, while
Singapore is described as a “technoglobalist” country, Japan and South Korea can be
categorized as “technonationalist” countries (Keller and Samuels, 2002; Kim, 2001).
Figure 3 shows the different approaches that the selected Asian economies have
adopted in promotion of innovation.

0
Figure 3. Typology of Triple-Helix network mechanism in five selected
countries/cities
State Industry University
Hong Kong
Japan
Singapore
South Korea
Taiwan Source: Drawn by the author
Note:
1. “”: Significant contribution; “”: Insignificant yet emerging contribution
2. “” indicates a significant contribution of that stakeholder to the national innovation system,
while the absence of “” does not infer that the stakeholder has no contribution at all; because
each of the three stakeholders must has certain impact on the innovation system, though to
different degrees. Besides, the indication of “” of the same stakeholder of different countries
does not imply that the degrees of contribution of that stakeholder are the same in different
countries.
After comparing and contrasting the different national innovation systems of the
selected Asian societies, we have clearly noted that the role of the government is
important in driving the research and development agenda. With the exception of
Hong Kong where the government has not performed a leadership role in innovation
and technology advancement (perhaps it is to do with the fact that Hong Kong has
never been a sovereign state), all other Asian economies have taken the advancement
of innovation more seriously, especially when they have transformed their economy
from a more manufacturing-based to a more service-based one in the context of
knowledge-based economy. In response to growing pressures and challenges
generated from the globalizing economy, these Asian states have made attempts to
promote innovation in order to move beyond their traditional forms of economic
activities and extend to new economic opportunities very much driven by creativity
and innovation. Hence, we have witnessed more emphasis is placed upon higher
education development by diversifying higher education financing sources,
encouraging universities to reach out and collaborate with the industry and business to
become entrepreneurial universities, and more collaborations have been promoted
between the industry and business and the university in promoting innovation and
technology in recent years. Table 25 recapitulates the R & D expenditures of selected
Asian societies in advancing innovation and technology as already shown separately
above.

0
Table 25. R&D Investments of the selected five Asian societies, 2000-2004
Hong
Kong
Japan South
Korea
Singapore Taiwan Hong
Kong
Japan South
Korea
Singapore Taiwan
Total R&D Expenditures (in US$ million) Total R&D Expenditures as share of GDP (%)
2000 785.7 178,718.9 12,298.8 415.2 6,176.0 0.47 3.17 -- -- 1.97
2001 908.6 181,337.4 14,307.7 398.1 6,405.4 0.55 3.30 2.59 0.36 2.08
2002 967.1 182,950.8 15,386.4 402.4 7,013.4 0.61 3.35 2.53 0.36 2.18
2003 1096.0 184,367.3 16,934.9 472.3 7,591.9 0.69 3.35 2.63 0.41 2.31
2004 1218.6 185,831.2 19,702.8 577.6 5,321.7 0.74 3.35 2.85 0.45 2.38
Note: The official data of Japan is only up to 2004, therefore though other countries have more updated
data, we can only compare the data on or before 2004 across the five societies.
Taking R & D more seriously by Asian states, Table 26 shows the performance of
selected Asian economies in the Global Competitiveness Index, the current rankings
(2009/10) secured by these East Asian economies (in comparison with several OECD
countries as well) ranging widely from 3rd (Singapore) to 29th (Mainland China):
Table 26. Global Competitiveness Index, 2009/10 Ranking
Country/EconomyGCI
2009/10GCI
2008/09Capacity for Innovation
University-Industry Collaboration in R&D
Rank Score Rank Rank RankSwitzerland 1 5.60 2 -- --
United States 2 5.59 1 -- --
Singapore 3 5.55 5 18 4
Sweden 4 5.51 4 -- --
Denmark 5 5.46 3 -- --
Finland 6 5.43 6 -- --
Germany 7 5.37 7 -- --
Japan 8 5.37 9 1 20
Canada 9 5.33 10 -- --
Netherlands 10 5.32 8 -- --
Hong Kong SAR 11 5.22 11 43 27
Taiwan 12 5.20 17 13 12
United Kingdom 13 5.19 12 -- --
Korea, Rep. 19 5.00 13 15 24
Source: Adapted from World Economic Forum, 2009.
Similarly, a comparison made through their rankings in the World Bank’s
Knowledge Economy Index has shown a rather different picture yet a similar trend,
with the exception that Taiwan has topped this Index among the seven selected cases
instead of acquiring merely the fourth in the GCI ranking (see Table 27). However,

0
the KEI ranking clearly shows that even the best three performers among this
group — Taiwan, Singapore and Japan — could only seize the positions of 18th to 20th
in line in the ranking, which is still far behind most of the OECD countries
particularly in the aspects of “economic incentive & institutional regime” (see note 9)
and “education & human resources” (see note 10). Having said that, it is notable that
most of the selected cases are now performing quite well in the aspects of “innovation
system” (see note 11) and “information & communication technology” (see note 12)
if compared their actual scores concerned to those of the OECD countries.
Table 27. Knowledge Economy Index, World Bank (2009)
Country/EconomyKEI 2009 EIIR9 Innovation10 Education11 ICT12
Rank Score Score Score Score ScoreDenmark 1 9.52 9.61 9.49 9.78 9.21
Sweden 2 9.51 9.33 9.76 9.29 9.66
Finland 3 9.37 9.31 9.67 9.77 8.73
Netherlands 4 9.35 9.22 9.45 9.21 9.52
Norway 5 9.31 9.47 9.06 9.60 9.10
Canada 6 9.17 9.45 9.44 9.26 8.54
United Kingdom 7 9.10 9.24 9.24 8.49 9.45
Ireland 8 9.05 9.26 9.08 9.14 8.71
United States 9 9.02 9.04 9.47 8.74 8.83
Switzerland 10 9.01 8.79 9.90 7.68 9.68
Australia 11 8.97 8.66 8.88 9.69 8.67
Germany 12 8.96 9.06 8.94 8.36 9.47
Taiwan 18 8.45 7.42 9.27 7.97 9.13
Singapore 19 8.44 9.68 9.58 5.29 9.22
Japan 20 8.42 7.81 9.22 8.67 8.00
Hong Kong SAR 23 8.32 9.54 9.04 5.37 9.33
Korea, Rep. 29 7.82 6.00 8.60 8.09 8.60
Source: Adapted from the website information of “KEI & KI Indexes”, Knowledge Assessment
Methodology (KAM) 2009, World Bank. http://info.worldbank.org/etools/kam2/KAM_page5.asp
9 The Economic Incentive & Institutional Regime is the simple average of the normalized scores on three key variables: tariff & non-tariff Barriers; regulatory quality; and rule of law (KAM 2009, World Bank).10 The Innovation System is the simple average of the normalized scores on three key variables: total royalty payments & receipts; patent applications granted by the US Patent & Trademark Office; and S&T journal articles (KAM 2009, World Bank).11 Education & Human Resources is the simple average of the normalized scores on three key variables: adult literacy rate; secondary enrollment; tertiary enrollment (KAM 2009, World Bank).12 Information & Communication Technology is the simple average of the normalized scores on three key variables: telephone; computer & internet penetrations (per 1000 people) (KAM 2009, World Bank).

0
A comparison made among these East Asian economies however reveals that
although Mainland China and Taiwan are really catching up their knowledge
economic development in a remarkable pace, according to the Index, most of them in
fact achieved merely an insignificant progress or even a regression between a long
period of 1995 and 2009 (see Table 28), indicating an ever-challenging global
competition that highlights innovation and educational reforms.
Table 28. Knowledge Economy Index, World Bank, (1995 & 2009 Rankings)
Country/Economy KEI 1995 KEI 2009 Change in Rank
Taiwan 25 18 +7
Singapore 21 19 +2
Japan 17 20 -3
Hong Kong SAR 23 23 0
Korea, Rep. 26 29 -3
Source: ibid.
Despite the fact that the five Asian societies under review has shown that these
governments are more aware of the importance of innovation and technology in the
process of development of their societies, they are relatively ‘late comers’ in the
innovation, research and development endeavour when compared to those developed
economies like the OECD countries. There are a few factors accounting for the
relatively lower ranking in terms of these global competitiveness or knowledge
economy index as clearly revealed by the above international league tables. Firstly, all
these Asian economies were colonies of some kind during the war periods of the First
and Second World Wars. Only after the end of the Second World War, these Asian
economies began to start economic development in a relatively peaceful environment
until the late 1960s and early 1970s. Singapore became an independent state in the
1950s but still experienced significant internal and external rivalries, while Hong
Kong was still British colony until 1997. Although Taiwan, Japan and South Korea
have been independent political entities (*Taiwan’s independent status is still
controversial until now) since the end of the Second World War, they encountered
various kinds of warfare between South Korea and North Korea, China mainland and
Taiwan in the late 1950s and early 1960s. Until the 1970s, these Asian economies
began to experience significant economic growth with the rise of industrialization and
manufacturing activities taking shape. In this regard, these Asian economies with the
exception of Japan with a relatively rapid economic development with the assistance
of the USA in the post-US occupation period, the four Asian Tiger economies
developed the so-called East Asian Miracle in the 1980s and 1990s. Before the 1990s,
these Asian still relied upon the secondary rather than tertiary production to drive their
economic growth. Realizing the coming of the knowledge-based economy, these East

0
Asian Tiger economies have begun to expand their higher education and invest in
research & development. Being late-comers in the enterprise for innovation
advancement, it is self-explanatory that they have not ranked well when compare to
the developed economies.
Apart from the different stages of development that these Asian economies have
experienced, the relatively lower international ranking in knowledge economy index
and global competitiveness index is closely related to under development of a
conductive environment for facilitating the collaborations between the state, the
industry and the university until the more recent decades. Our above comparison has
clearly shown that the USA model in innovation advancement has, to a certain extent,
resembled in the cases of Taiwan, South Korea and Japan where the promotion of
innovation is more driven by the Firm-led approach. Being the ex-colony of the
United Kingdom, the tiny city-states of Hong Kong and Singapore have not taken up
the tradition in promotion of innovation and technology until the more recent years
with the growing emphasis being place on this particular front. But we must realize
that the different governance philosophy between Hong Kong and Singapore has
clearly shown the variations and patterns in innovation promotion, with a more
firm-led approach in Hong Kong and government-led regime in Singapore. Hence,
when comparing innovation advancement experiences of these Asian states, we
cannot discard the governance style and the ex-colonial and post-colonial influences.
Realizing their limitations, coupled with the confrontation of growing challenges
for economic restructuring resulted from the globalizing economy, these Asian states
have tried to promote more innovation advancement through facilitating the industry
and university to engage in deep collaborations. This growing trend is particularly
clear when examining the recent higher education reforms taken place in these Asian
societies, particularly when all university systems in these Asian economies have been
under great pressures for reform in the quest for becoming enterprise and
entrepreneurial university. Despite the fact that these Asian economies are ‘late
comers’ in terms of promotion of innovation, especially when compared to their
OECD counterparts, it is worthy noting that their concerted efforts in developing and
expanding higher education in the last few decades have actually laid a very solid
foundation for further enhancement in research and development, as well as
technology and innovation advancement. Some lessons which we could draw after
reviewing the five Asian societies in terms of their strategies in promoting innovation
is closely related to the role of the state in the development of higher education and
research and development, particularly at its inception stage.
Our above comparative study has clearly shown these Asian states performed a
very important role in initiating higher education development and expansion to
provide quality education, which has created potential and qualified personnel for the
advancement of innovation. One point which deserves special attention is that these
0
governments have taken quality assurance very serious, thus the development of
higher education has taken a relatively cautious approach with the public sector
playing a more significant role in research and development before the sector has
become more massified with the rise of private education. By adopting this approach,
these government can monitor the quality of higher education expansion, while the
concentration of state funding on the selected public / state universities again shows
the strategic role of the state in promoting of innovation. Once these Asian
governments have realized their higher education sector is ‘mature’ enough, they have
started involving the industry and commercial sector to collaborate with the university
sector for advancing innovation, research and development. Such a selective and
cautious approach being adopted by these Asian economies could be useful and
relevant to other developing countries.
In short, it is clear that all the five economies concerned have realized the pressing
needs to tap innovative human capital through their HEIs. Reforms on both the NIS
and HE sector are common phenomena to be found among these cases, yet with
different approaches. The natures of the state, market (private enterprises) and HEIs
(usually positioned somewhere in between) may well be the focus of concern for
future research in relation to the changing role of the state-industry
(market)-university in promotion of innovation. Having reviewed the major trends
and developments of the national innovation systems of the selected Asian societies,
the following part focuses on recent reforms taken place in their higher education
systems in promoting the university to engage in deep collaborations with the industry
in innovation advancement.
Recent Reform of Higher Education in Selected Asian Societies
Global and Domestic Forces for Higher Education Reforms
The success of promotion of innovation depends not only upon governments’
policies in enhancing R&D but also relates to the development of higher education. In
order to enhance their global competitiveness, governments in different parts of the
world have started to conduct comprehensive reviews of and implement plans to
restructure their higher education systems (Mok and Welch, 2003). In response to the
growing pressures generated by the globalization forces, modern states have
attempted to reinvent themselves by moving beyond the welfare state to become the
competition state (Gill, 1995; Jordana and Levi-Faur, 2005; Moran, 2002).
Governments across different parts of the globe, facing similar competitive pressures,
have undertaken regulatory reforms such as privatization or corporatization of
state-owned industries or publicly owned organizations like post office and university,
opening up new markets to multiple providers and the introduction of new regulatory

0
regimes under the control of independent regulators (Drahos and Jospeh, 1995;
Levi-Faur, 1998; Scott, 2004). More importantly, the actions and mission of the
competition state do not necessarily result in the retreat of the state from the market
but rather a reassertion of the role of the state under changing social and economic
circumstances (Levi-Faur, 1998: 676).
Over the last two decades or so, in face of the dramatic pace of globalization, all
the governments concerned have pushed for a certain degree of higher educational
reform in order to cater for their industrial transformations as well as to
foster/maintain an S&T-savvy and innovative citizenry. Although the degree and
direction may vary substantially, the spirit of entrepreneurship and innovation has
always been the core pursuance in the selected Asian societies in terms of their higher
education development strategies. In addition to the global forces, a number of key
domestic factors have shaped the basic orientation of education policy in Asia. Among
the selected Asian countries under review, many of them were colonies of either Japan
or Britain. In addition, the strong presence of the USA in the region should have
shaped Asia’s developments from various fronts (Moore, 2005; Sutter, 2005). With
such socio-political and socio-historical backgrounds, obviously the higher education
systems of these Asian countries initially were affected by their colonial history. Even
when these Asian states are no longer colonies, we can easily find that many of their
ideas and practices in education have still deeply rooted in their colonial legacy
(Morris and Sweeting, 1995). No matter how hard they have tried to move beyond the
colonial influence, we can still witness many of these Asian governments continue to
identify and follow the ways that their former colonial states manage education (Mok,
2007; Mok and Lee, 2000). Hence, when examining educational developments of
Asia, we cannot entirely discard the colonial legacy. After gaining independence from
colonial rule (or changing from a colonial state to a Special Administrative Region of
China for the case of Hong Kong), these Asian governments gave education a very
important role in social and economic development (Bray, 1997; Tilak, 2000).
Despite the fact that most of the Asian societies under review are primarily
anti-welfarist in public discourse and public policy, they all conceive education as an
exception (Asher and Newman, 2001). Instead of being treated simply as a necessary
public expenditure item, these Asian governments have put emphasis on developing
education as an investment for providing their economies with a high quality labour. It
is particularly true when these Asian governments have now confronted the
intensified pressures generated from the rise of the knowledge-based economy.
Without abundant natural resources but being small-scale economies when comparing
to other giant developed economies such as the European Union or the United States
of America, these Asian states realize the significance to improve the global
competence of their citizens in order to strengthen their national competitiveness.
Hence, higher education expansion has become a common trend among these Asian

0
countries in recent years.
Another factor shaping educational developments in these societies is
social-psychological, focusing more on the values and attitudes perceived to be
prerequisites for development. Central to the legacy of Confucianism and
Neo-Confucianism is an emphasis on education and cultural enhancement (Morris and
Sweeting, 1995; Rozman, 1992; So and Chiu, 1995). Recent studies regarding
consumption and private tutoring in Asia have repeatedly confirmed how important
Asian parents have attached to education. It has been reported consistently that Asian
parents are willing and also committed to pay for their children’s education. Hence,
private tutoring in Asia has been a growing trend and private school and higher
education have therefore become increasingly popular in Asia (Bray and Bunly, 2005;
Bray and Thomas, 1998). More importantly, education has long been adopted as an
instrument, direct and indirect, of nation building in these Asian societies. Education
has helped to create a sense of belonging and nationhood and so has been important in
political legitimation in these Asian states. It has also contributed to that legitimation
through the economic opportunities it has offered and the contribution it has made to
economic growth (Bray and Lee, 2001; Gopinathan, 2001). In response to both the
domestic and global challenges, the higher education systems of the selected Asian
societies have adopted far more market-driven ideas and strategies to reform their
systems by encouraging universities to become more entrepreneurial.
Hong Kong
In Hong Kong, undergraduate students comprise the largest part of its HE sector.
Their share has increased from 68.6% in 2002/03 to 79.8% in 2008/09. The share of
research postgraduates also increased modestly from 6.1% to 8.6% during the same
period, while that of taught postgraduates decreased significantly from 9.3% to 3.8%
(see Table 29). This increase in the shares of undergraduates and research
postgraduates are vital to the development of manpower and R&D personnel in Hong
Kong.
Table 29. Student Enrolment (Full-Time Equivalent) of UGC-Funded Programs by
Level of Study, 2002/03-2008/09
Level of Study 2002/03 2003/04 2004/05 2005/06 2006/07 2007/08 2008/09
Sub-Degree11,046
(16.0%)
11,405
(16.1%)
10,736
(15.5%)
9,070
(13.4%)
6,925
(10.4%)
5,256
(8.0%)
5,279
(7.8%)
Undergraduate47,201
(68.6%)
48,094
(67.9%)
48,830
(70.4%)
50,009
(73.9%)
51,221
(77.0%)
52,315
(79.2%)
53,992
(79.8%)
First-Year
Undergraduate14,829 14,639 14,719 14,973 15,405 15,427 15,715

0
Taught
Postgraduate
6,371
(9.3%)
6,291
(8.9%)
4,776
(6.9%)
3,428
(5.1%)
2,946
(4.4%)
2,890
(4.4%)
2,596
(3.8%)
Research
Postgraduate
4,207
(6.1%)
4,995
(7.1%)
4,971
(7.2%)
5,208
(7.7%)
5,465
(8.2%)
5,627
(8.5%)
5,792
(8.6%)
Total 68,825 70,784 69,313 67,715 66,558 66,088 67,659
Source: University Grants Committee, HKSAR, 2009.
http://www.ugc.edu.hk/eng/doc/ugc/stat/heilevel.pdf
Hong Kong’s universities are heavily funded by the government. There are a total
of 12 degree-awarding HEIs in Hong Kong: 8 of them are government-funded HEIs;
3 are self-financing institutions; while the remaining one is publicly-funded (see Table
30). In terms of financing, the government has been the dominant stakeholder in Hong
Kong’s HE sector.
Table 30. Different statuses of Higher Educational Institutions, Hong Kong
Type of Status Name of Institution
UGC-Funded
City University of Hong Kong
Hong Kong Baptist University
Lingnan University
The Chinese University of Hong Kong
The Hong Kong Institute of Education
The Polytechnic University
The Hong Kong University of Science and Technology
The University of Hong Kong
Self-Financing
The Open University of Hong Kong
Hong Kong Shue Yan University
Chu Hai College of Higher Education
Publicly-Funded The Hong Kong Academy for Performing Arts
Over the last decade, the government has become eager to develop the city-state
into an education hub, both in terms of academic and research. In 1996, the University
Grants Committee (UGC), the statutory body responsible for advising the government
on higher education, issued a report that encouraged staffs and students of HEIs to
engage in pure research, and to develop closer research collaborations with the
various government agencies, the industrial sector, as well as the sector of social
services. In 2002, the UGC issued an important consultant report entitled Higher
Education in Hong Kong, reiterated the need for HEIs to engage with local industry
and community, meanwhile also encouraged the applied research and
commercialization of research outputs. On the one hand, the proposal aims to enable
university research contributes to the society more directly; on the other hand,
universities can also extend their pools of research money by working closer with the
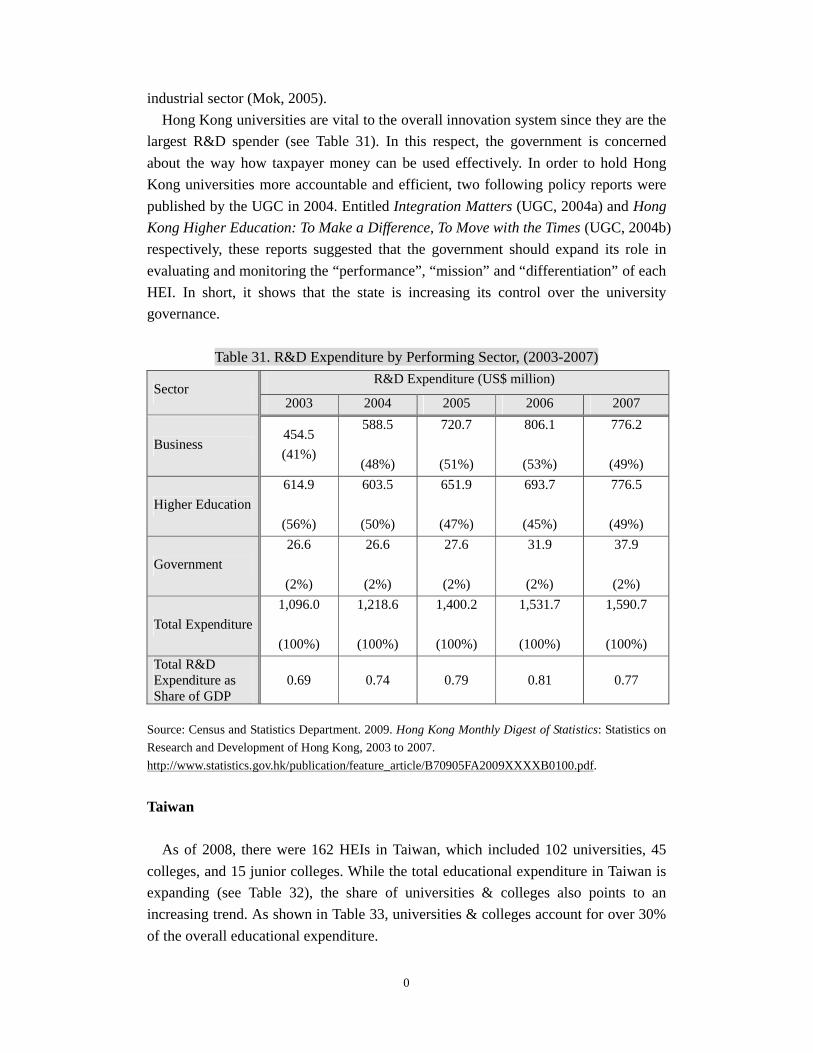
0
industrial sector (Mok, 2005).
Hong Kong universities are vital to the overall innovation system since they are the
largest R&D spender (see Table 31). In this respect, the government is concerned
about the way how taxpayer money can be used effectively. In order to hold Hong
Kong universities more accountable and efficient, two following policy reports were
published by the UGC in 2004. Entitled Integration Matters (UGC, 2004a) and Hong
Kong Higher Education: To Make a Difference, To Move with the Times (UGC, 2004b)
respectively, these reports suggested that the government should expand its role in
evaluating and monitoring the “performance”, “mission” and “differentiation” of each
HEI. In short, it shows that the state is increasing its control over the university
governance.
Table 31. R&D Expenditure by Performing Sector, (2003-2007)
SectorR&D Expenditure (US$ million)
2003 2004 2005 2006 2007
Business454.5
(41%)
588.5
(48%)
720.7
(51%)
806.1
(53%)
776.2
(49%)
Higher Education
614.9
(56%)
603.5
(50%)
651.9
(47%)
693.7
(45%)
776.5
(49%)
Government
26.6
(2%)
26.6
(2%)
27.6
(2%)
31.9
(2%)
37.9
(2%)
Total Expenditure
1,096.0
(100%)
1,218.6
(100%)
1,400.2
(100%)
1,531.7
(100%)
1,590.7
(100%)
Total R&D Expenditure as Share of GDP
0.69 0.74 0.79 0.81 0.77
Source: Census and Statistics Department. 2009. Hong Kong Monthly Digest of Statistics: Statistics on
Research and Development of Hong Kong, 2003 to 2007.
http://www.statistics.gov.hk/publication/feature_article/B70905FA2009XXXXB0100.pdf.
Taiwan
As of 2008, there were 162 HEIs in Taiwan, which included 102 universities, 45
colleges, and 15 junior colleges. While the total educational expenditure in Taiwan is
expanding (see Table 32), the share of universities & colleges also points to an
increasing trend. As shown in Table 33, universities & colleges account for over 30%
of the overall educational expenditure.
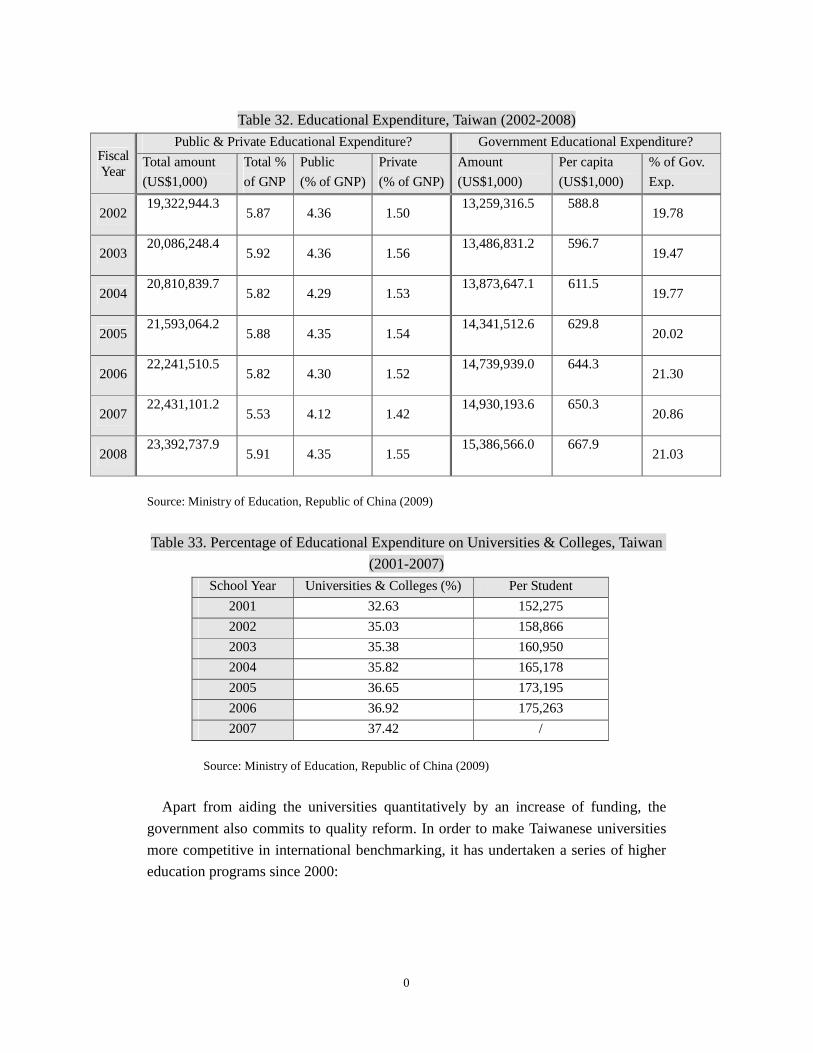
0
Table 32. Educational Expenditure, Taiwan (2002-2008)
Fiscal Year
Public & Private Educational Expenditure? Government Educational Expenditure?
Total amount
(US$1,000)
Total %
of GNP
Public
(% of GNP)
Private
(% of GNP)
Amount
(US$1,000)
Per capita
(US$1,000)
% of Gov.
Exp.
200219,322,944.3
5.87 4.36 1.5013,259,316.5 588.8
19.78
200320,086,248.4
5.92 4.36 1.5613,486,831.2 596.7
19.47
200420,810,839.7
5.82 4.29 1.5313,873,647.1 611.5
19.77
200521,593,064.2
5.88 4.35 1.5414,341,512.6 629.8
20.02
200622,241,510.5
5.82 4.30 1.5214,739,939.0 644.3
21.30
200722,431,101.2
5.53 4.12 1.4214,930,193.6 650.3
20.86
200823,392,737.9
5.91 4.35 1.5515,386,566.0 667.9
21.03
Source: Ministry of Education, Republic of China (2009)
Table 33. Percentage of Educational Expenditure on Universities & Colleges, Taiwan
(2001-2007)
School Year Universities & Colleges (%) Per Student
2001 32.63 152,275
2002 35.03 158,866
2003 35.38 160,950
2004 35.82 165,178
2005 36.65 173,195
2006 36.92 175,263
2007 37.42 /
Source: Ministry of Education, Republic of China (2009)
Apart from aiding the universities quantitatively by an increase of funding, the
government also commits to quality reform. In order to make Taiwanese universities
more competitive in international benchmarking, it has undertaken a series of higher
education programs since 2000:
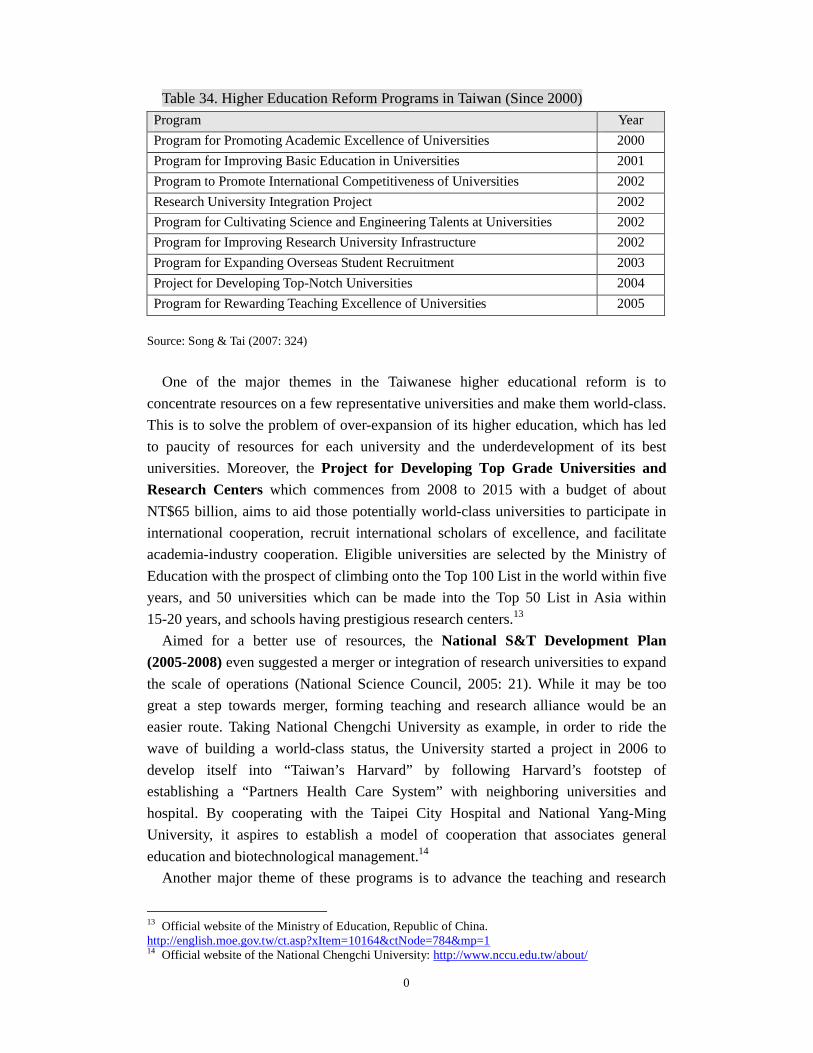
0
Table 34. Higher Education Reform Programs in Taiwan (Since 2000)
Program Year
Program for Promoting Academic Excellence of Universities 2000
Program for Improving Basic Education in Universities 2001
Program to Promote International Competitiveness of Universities 2002
Research University Integration Project 2002
Program for Cultivating Science and Engineering Talents at Universities 2002
Program for Improving Research University Infrastructure 2002
Program for Expanding Overseas Student Recruitment 2003
Project for Developing Top-Notch Universities 2004
Program for Rewarding Teaching Excellence of Universities 2005
Source: Song & Tai (2007: 324)
One of the major themes in the Taiwanese higher educational reform is to
concentrate resources on a few representative universities and make them world-class.
This is to solve the problem of over-expansion of its higher education, which has led
to paucity of resources for each university and the underdevelopment of its best
universities. Moreover, the Project for Developing Top Grade Universities and
Research Centers which commences from 2008 to 2015 with a budget of about
NT$65 billion, aims to aid those potentially world-class universities to participate in
international cooperation, recruit international scholars of excellence, and facilitate
academia-industry cooperation. Eligible universities are selected by the Ministry of
Education with the prospect of climbing onto the Top 100 List in the world within five
years, and 50 universities which can be made into the Top 50 List in Asia within
15-20 years, and schools having prestigious research centers.13
Aimed for a better use of resources, the National S&T Development Plan
(2005-2008) even suggested a merger or integration of research universities to expand
the scale of operations (National Science Council, 2005: 21). While it may be too
great a step towards merger, forming teaching and research alliance would be an
easier route. Taking National Chengchi University as example, in order to ride the
wave of building a world-class status, the University started a project in 2006 to
develop itself into “Taiwan’s Harvard” by following Harvard’s footstep of
establishing a “Partners Health Care System” with neighboring universities and
hospital. By cooperating with the Taipei City Hospital and National Yang-Ming
University, it aspires to establish a model of cooperation that associates general
education and biotechnological management.14
Another major theme of these programs is to advance the teaching and research
13 Official website of the Ministry of Education, Republic of China.http://english.moe.gov.tw/ct.asp?xItem=10164&ctNode=784&mp=114 Official website of the National Chengchi University: http://www.nccu.edu.tw/about/

0
excellence of universities. For example, the Program for Promoting Academic
Excellence of Universities was launched by the MOE together with the National
Science Council in 2000, aimed to encourage large-scale intra- and inter-university
cooperation with a budget of NT$13 billion. A group of prominent local and
international scholars would host the review panel to safeguard the research standard.
Moreover, this screening process would favor proposals that are innovative,
international, and have the potential to meet the needs of national development (Song
& Tai, 2007: 328-329). It is thus shown that at the moment, establishing hallmark
universities and research centers has become the top agenda of higher educational
reform in Taiwan lately.
South Korea
The higher education sector of South Korea develops at a stable pace in recent
years. In terms of resource allocation, Table 35 shows that the shares of Ministry of
Education in the government budget varied between 16.1% and 18.0% from 2001 to
2005. In regard to higher education, Table 36 indicates that there is no significant rise
of universities in recent years. As a whole, the enrolment rate of South Korean HEIs
increases modestly since 2005 (see Table 37).
Table 35. Central Government Budget vs. Ministry of Education Budget, South Korea
(2006)
YearCentral Government Budget
(US$ million)
MOE Budget
(US$ million)Share of MOE Budget (%)
2001110,534.3 17,792.5
16.1
2002121,330.5 19,785.4
16.3
2003126,944.9 21,673.5
17.1
2004130,437.5 23,445.5
18.0
2005142,225.0 24,850.8
17.5
2006147,322.1 25,867.9
17.6
2007153,676.0 27,570.8
17.9
Source: MEST website. http://english.mest.go.kr/main.jsp?idx=0401050201
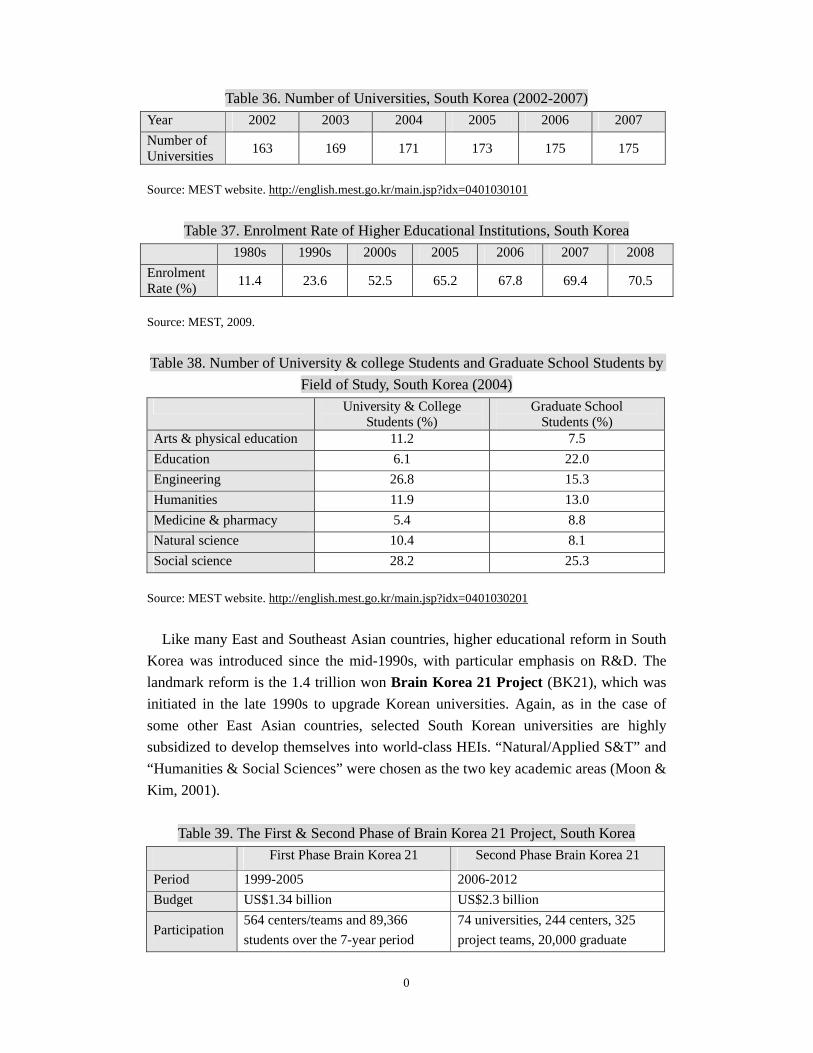
0
Table 36. Number of Universities, South Korea (2002-2007)
Year 2002 2003 2004 2005 2006 2007
Number of Universities
163 169 171 173 175 175
Source: MEST website. http://english.mest.go.kr/main.jsp?idx=0401030101
Table 37. Enrolment Rate of Higher Educational Institutions, South Korea
1980s 1990s 2000s 2005 2006 2007 2008
Enrolment Rate (%)
11.4 23.6 52.5 65.2 67.8 69.4 70.5
Source: MEST, 2009.
Table 38. Number of University & college Students and Graduate School Students by
Field of Study, South Korea (2004)
University & College Students (%)
Graduate SchoolStudents (%)
Arts & physical education 11.2 7.5
Education 6.1 22.0
Engineering 26.8 15.3
Humanities 11.9 13.0
Medicine & pharmacy 5.4 8.8
Natural science 10.4 8.1
Social science 28.2 25.3
Source: MEST website. http://english.mest.go.kr/main.jsp?idx=0401030201
Like many East and Southeast Asian countries, higher educational reform in South
Korea was introduced since the mid-1990s, with particular emphasis on R&D. The
landmark reform is the 1.4 trillion won Brain Korea 21 Project (BK21), which was
initiated in the late 1990s to upgrade Korean universities. Again, as in the case of
some other East Asian countries, selected South Korean universities are highly
subsidized to develop themselves into world-class HEIs. “Natural/Applied S&T” and
“Humanities & Social Sciences” were chosen as the two key academic areas (Moon &
Kim, 2001).
Table 39. The First & Second Phase of Brain Korea 21 Project, South Korea
First Phase Brain Korea 21 Second Phase Brain Korea 21
Period 1999-2005 2006-2012
Budget US$1.34 billion US$2.3 billion
Participation564 centers/teams and 89,366
students over the 7-year period
74 universities, 244 centers, 325
project teams, 20,000 graduate

0
students per year
Support
$400 per month for master’s, $600
for doctoral, $1,250 for post-doc
researchers, $2,500 for contract
professors
$500 per month for master’s, $900
for doctoral, $2,000 for post-doc
researchers, $2,500 for contract
professors
Source: MEST website, 2007.
http://english.mest.go.kr/main.jsp?idx=0301020101&brd_no=52&cp=1&pageSize=10&srchSel=&srch
Val=&brd_mainno=528&mode=v
The major contributions of the project have been the nurturing of research talents,
building up of research institutes and increase in research outputs (Shin, 2009). The
official statistics shows that, under the first phase of this project, 6,602 doctors in
S&T were produced; the numbers of S&T SCI-level papers rose from 3,765 in 1998
to 7,281 in 2005; and the nation’s ranking in SCI-S&T papers improved from 16th in
1998 to 12th in 2005. Moreover, the quality of these papers has also improved as the
Impact Factor per article increased from 1.9 in 1999 to 2.43 in 2005. With these
achievements, the MEST subsequently set more ambitious goals for the second-phase
project: to develop 10 top research-oriented universities in the key fields; to become
one of the top-ten countries in SCI-paper publication; and also to become one of the
top-ten advanced countries in university-industry technology transfer, with the goal of
increasing the transfer rate from 10% in 2004 to 20% in 2012 (MEST, 2007).
Another significant and latest reform was the restructuring of the Ministry of
Education. Similar to Japan, the Korean government has combined the Ministry of
Science & Technology and the Ministry of Education into a new Ministry of
Education, Science & Technology (MEST) in 2008, for it has foreseen the essential
role education can play in S&T development in the future.
Singapore
As a small city-state with little endowment of natural resources, Singapore faces
immense pressure in tackling challenges posed by globalization and knowledge
economy. Since the 1990s, it began to develop its higher education as a globally
tradable export service, with the ambition to forge itself a regional hub of education
which could also contribute to its economic growth. Accordingly, the Ministry of
Education not only created the third national university — Singapore Management
University (SMU) in 2000 with a new and innovative governance & funding styles,
but also corporatized the two existing public universities — the National University of
Singapore (NUS) and the Nanyang Technology University (NTU) as non-for-profit
companies in 2005 to make their governance more autonomous. Incorporation of
public universities makes them more self-conscious and accountable for their

0
operation, thus enhances competition among these three universities not only on
educational quality but also on recruitment of local and international students and
faculties.
Table 40. Overview of the Top-Two Universities in Singapore (Enrollment)
Univ. YearGraduate Student
International Grad. Student
Science(Grad.)
Eng. (Grad.)
AcademicFaculty
Research Faculty
NUS 2006 6,031 3,462 937 1,876 1,820 1,218
2007 6,309 3,696 967 1,925 1,944 1,464
2008 7,020 4,024 1,049 1,947 2,103 1,710
NTU 2006 6072 --- --- --- 1,466 850
2007 6,871 --- --- --- 1,515 998
2008 7,238 --- 284 3,532 1,580 1,057
Source: NUS Annual Report (various years); NTU Annual Report (various years).
Learning from international world-class universities, these universities have
extended their operation by increasing effort on S&T-related research activities, and
have continuously expanded the scale of their postgraduate education (see Table 40).
In addition, the future landscape of higher education in Singapore will become far
more diversified with the contribution from its reputable private universities15 and
polytechnics16 which have also been strengthened recently.
Japan
The Japanese HE sector mainly comprised of national, public and private
universities. It is expanding steadily in recent years with increasing number of
national, public and private universities as well as their student population (see Table
41). A growing trend can also be observed in the annual university student intake and
the corresponding entry rate (see Table 42).
Table 41. Number of Japanese Universities, 1999-2005
Year
Total National Public Private
No. of
Institution
No. of
Student
No. of
Institution
No. of
Student
No. of
Institution
No. of
Student
No. of
Institution
No. of
Student
1999 622 2,701,104 99 621,126 66 101,062 457 1,978,916
2000 649 2,740,023 99 624,082 72 107,198 478 2,008,753
2001 669 2,765,705 99 622,679 74 112,523 496 2,030,503
2002 686 2,786,032 99 621,487 75 116,705 512 2,047,840
15 There are 8 private-comprehensive and/or private-specialized universities in Singapore.16 There are 5 polytechnics which also engage in R&D activities in Singapore.

0
2003 702 2,803,980 100 622,404 76 120,463 526 2,061,113
2004 709 2,809,295 87 624,389 80 122,864 542 2,062,042
2005 726 2,865,051 87 627,850 86 124,910 553 2,112,291
Source: Ministry of Education, Culture, Sports, Science and Technology, Japan, 2006.
Table 42. Annual Intake of Japanese Universities, 1999-2005
Student Enrollment Entry Rate (%)
1999 221,480 29.4
2000 232,501 31.5
2001 241,249 32.7
2002 248,653 33.8
2003 242,514 34.4
2004 242,514 35.2
2005 245,525 36.8
Source: Ministry of Education, Culture, Sports, Science and Technology, Japan, 2006.
More specifically, we can also observe the increasing number of S&T university
students over the last few decades. However, as shown in Table 43, although the total
number of S&T students has increased significantly from 1970 to 2005, the share of
S&T undergraduate, master’s and doctoral students saw no significant rises, and some
of them even indicated a decline. For example, the share of undergraduate engineering
students had dropped from 21.1% in 1970 to 17.3% in 2005, and the share of doctoral
science students from 17.1% to 8.6%.
Table 43. Percentage Distribution of Undergraduate, Master’s and Doctoral Students
by Selected Major Field of Study in Japanese Universities, 1970 & 2005
Undergraduate Master’s Doctoral
1970 2005 1970 2005 1970 2005
Total number of students 1,344,358 2,508,088 27,714 164,550 13,243 74,907
Share of social sciences (%) 41.8 37.7 16.6 12.5 13.0 10.1
Share of engineering (%) 21.1 17.3 37.0 39.9 17.8 18.6
Share of humanities (%) 12.7 16.2 18.6 8.2 14.2 10.2
Share of science (%) 3.1 3.5 10.8 8.5 17.1 8.6
Source: Ministry of Education, Culture, Sports, Science and Technology, Japan, 2006. Japan’s
Education at a Glance 2006
Similarly, the Japanese HE expenditure also maintains at a stable rate in recent
years. As shown in Table 44, the share of HE in the total school education expenditure
and in the GDP observe no significant changes.

0
Table 44. Expenditures on Higher Education (in US$ Million), 1999-2003
YearTotal Expenditure
on School Education
Expenditure on Higher Education
Gross Domestic Product
Share of Higher Education Expenditure (%)
In Total Expenditure on School Education
In GDP
1999285,549.4 87,258.4 5,573,593.7
30.6 1.57
2000281,655.7 85,037.8 5,630,261.7
30.2 1.51
2001283,206.7 85,772.7 5,496,380.5
30.3 1.56
2002284,834.7 88,113.0 5,455,078.2
30.9 1.62
2003279,787.8 87,386.5 5,499,517.3
31.2 1.59
Source: MEXT website, http://www.mext.go.jp/english/statist/06060808/pdf/170.pdf;
http://www.mext.go.jp/english/statist/06060808/pdf/172.pdf
In sum, comparing with other selected cases in East Asia, the Japanese universities
suffer no huge ups and downs in terms of the quantity of expenditure and student
enrollment. Yet in fact, they have gradually adapted their roles and missions as well as
their operating modes qualitatively in response to the rising competition both at home
and from abroad.
Recent Higher Education Reforms: Major Development Trends and Challenges
The Quest for Entrepreneurial University and Changing University Governance
Being unsatisfied with the conventional model along the lines of “state-oriented”
and “highly centralized” approaches in higher education, Asian governments have
recently tried to “incorporate” or introduced “corporatization” and “privatisation”
measures to run their state / national universities, believing that the transformations of
which could make national universities more flexible and responsive to rapid
socio-economic changes (Mok, 2006a; Oba, 2007). Instead of being closely directed
by the Ministry of Education or equivalent government administrative bodies, state
universities in Asia are now required to become more proactive and dynamic in
looking for their own financial resources. Similar to their Australian and British
counterparts, universities in Asia are now under constant pressures to become more
“entrepreneurial” to look for alternative funding sources from the market,
strengthening their partnerships with the industry and the business (Marginson and
Considine, 2000; Mok, 2008; Olsen and Gornitzka, 2006).

0
Adhering more towards the market and corporate principles and practices,
universities in Hong Kong are now run on a market-oriented and business corporation
model. Universities of the city-state have experienced corporatization and
privatisation processes, whereby higher education institutions in Hong Kong have
proactively engaged in fostering entrepreneurship to search for additional revenue
sources from the market (Lee and Gopinathan, 2005; Mok, 2005a). In order to
enhance efficiency of university governance, the University Grant Committee (UGC),
the organization which shapes the directions of higher education development in
Hong Kong, has recently subscribed to the notion of “deep collaboration” among
universities, believing that synergy could be pulled together if universities in the
city-state could better integrate. The UGC even supports university merging or other
forms of restructuring to further establish Hong Kong as a regional centre for
excellence in research and scholarship (Chan and Lo, 2007; Lee, 2005).
Similarly, the Ministry of Education in Taiwan has decided to change the statutory
position of state universities into independent judicial entity by adopting principles
and practices of corporatization. In order to reduce the state burden in higher
education financing, all state universities in Taiwan have to generate additional funds
from non-state sectors such as the market and enterprises. In order to generate
sufficient funds to finance their institutions, various kinds of market driven strategies
have been adopted. More recently, the Taiwan Government has attempted to
restructure its state universities by passing a new University Bill to make state
universities independent legal entities. Influenced by the Japan model, state
universities in Taiwan have to establish new governance structures; while they are
under immense pressures for searching additional financial support from the non-state
channels especially when the Taiwan government has reduced significantly its
funding to them (Lo and Weng, 2005; Mok and Chan, 2008; Tien, 2006).
Japan is not immune from the impact of neo-liberalism, managerialism and
economic rationalism, three major ideologies underlying the tidal wave of public sector
reforms and reinventing government projects across the world. With the intentions to
make its state university system more responsive and flexible in coping with intensified
pressures generated from the growing impacts of globalization, the Japanese
government has incorporated all state universities since 2004. Central to the
transformation of the existing national universities into “National University
Corporations” are three major reform aspects: increased competitiveness in research
and education; enhanced accountability together with introduction of competition; and
strategic and functional management of national universities (Oba, 2007).
Higher education restructuring is popular not only among East Asian states but also
in Southeast Asian societies. Having reflected upon the changing university
governance models and evaluated the recent experiences of Singapore Management
University (SMU), the Ministry of Education in Singapore has decided to change the

0
governance models of the existing state universities, namely, National University of
Singapore and Nanyang Technological University by making them independent legal
entity through the process of “corporatization” (Mok, 2005, 2006a). By
incorporatizing these state universities, the Singapore government hopes that
universities on the island state could become more entrepreneurial. Putting the above
governance / management reforms taking place in the Asian higher education systems
into perspective, it is clear that the recent higher education transformations and
restructuring are part of the wider reinventing state projects or the reengineering of
the public sector exercises launched in Asia.
Growing Privateness in Higher Education
The four East Asian Tigers (Hong Kong, Taiwan, South Korea and Singapore) have
devoted a considerable amount of public money to education. Total public
expenditure on education now ranges between 3.5 and 4.5 percent of GDP. Although
the GDP ratio in the four East Asian Tigers is relatively low when compared with
Western countries, education is one of the most important and high-spending policy
areas (see table 45). Public education is about 20 percent of the total budget in the
four Tigers. The state is still the dominant funder of education in these societies. Table
46 further shows the public expenditure per student in tertiary education as % of GDP
per capita of the selected five Asian societies.
Table 45: A Comparative Perspective of Tertiary Education in East Asia
Gross enrolment
ratio (%)
Public expenditures
per student (% of
GDP per capita )
East Asia & Pacific1 22.5 (2007) /
China 23.0 (2007) /
Hong Kong 33.8 (2007) 47.3 (2007)
Japan 58.1 (2007) 19.6 (2005)
Korea 94.7 (2007) 9.3 (2005)
Malaysia 32.0 (2005) 93.7 (2005)
Singapore / /
Taiwan 83.2 (2008) /Source: Ministry of Education, Taiwan (2009); World Bank (2007a, 2008)
Note:
1. East Asia & Pacific includes: American Samoa, Cambodia, China, Fiji, Indonesia, Kiribati, Korea,
Dem. Rep., Lao PDR, Malaysia, Marshall Islands, Micronesia, Fed. Sts., Mongolia, Myanmar, N.
Mariana Islands, Palau, Papua New Guinea, Philippines, Samoa, Solomon Islands, Thailand,
Timor-Leste, Tonga, Vanuatu, Vietnam.
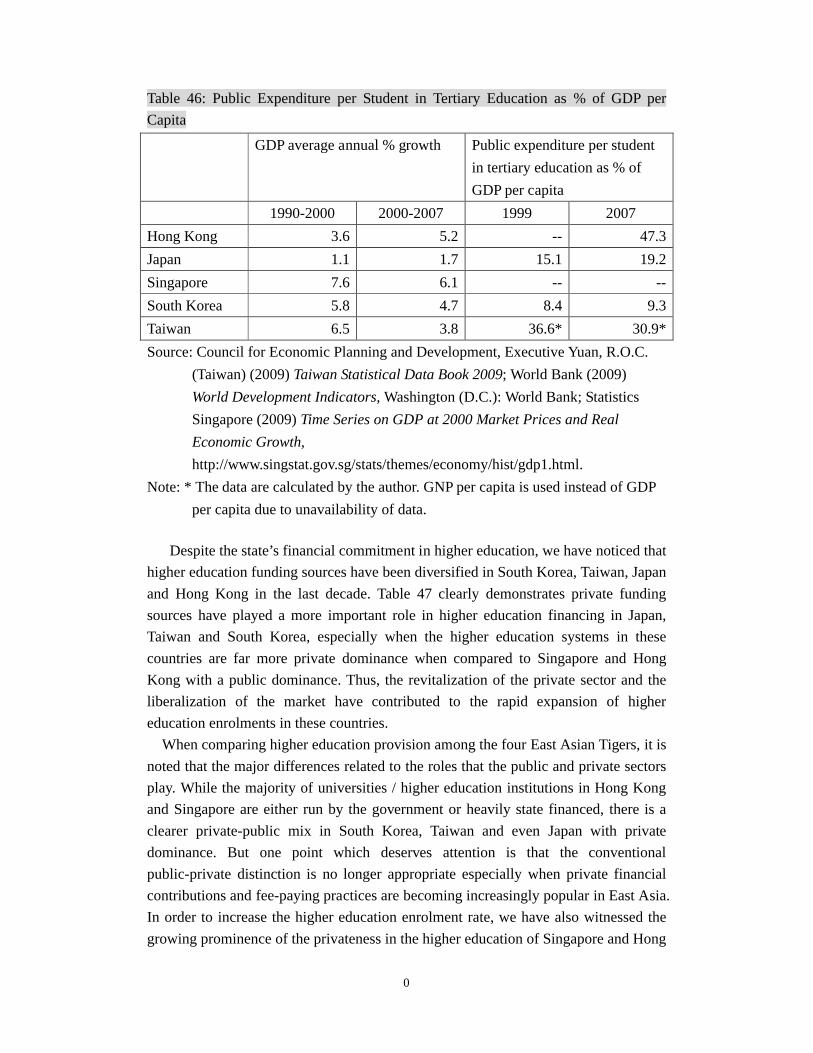
0
Table 46: Public Expenditure per Student in Tertiary Education as % of GDP per
Capita
GDP average annual % growth Public expenditure per student
in tertiary education as % of
GDP per capita
1990-2000 2000-2007 1999 2007
Hong Kong 3.6 5.2 -- 47.3
Japan 1.1 1.7 15.1 19.2
Singapore 7.6 6.1 -- --
South Korea 5.8 4.7 8.4 9.3
Taiwan 6.5 3.8 36.6* 30.9*
Source: Council for Economic Planning and Development, Executive Yuan, R.O.C.
(Taiwan) (2009) Taiwan Statistical Data Book 2009; World Bank (2009)
World Development Indicators, Washington (D.C.): World Bank; Statistics
Singapore (2009) Time Series on GDP at 2000 Market Prices and Real
Economic Growth,
http://www.singstat.gov.sg/stats/themes/economy/hist/gdp1.html.
Note: * The data are calculated by the author. GNP per capita is used instead of GDP
per capita due to unavailability of data.
Despite the state’s financial commitment in higher education, we have noticed that
higher education funding sources have been diversified in South Korea, Taiwan, Japan
and Hong Kong in the last decade. Table 47 clearly demonstrates private funding
sources have played a more important role in higher education financing in Japan,
Taiwan and South Korea, especially when the higher education systems in these
countries are far more private dominance when compared to Singapore and Hong
Kong with a public dominance. Thus, the revitalization of the private sector and the
liberalization of the market have contributed to the rapid expansion of higher
education enrolments in these countries.
When comparing higher education provision among the four East Asian Tigers, it is
noted that the major differences related to the roles that the public and private sectors
play. While the majority of universities / higher education institutions in Hong Kong
and Singapore are either run by the government or heavily state financed, there is a
clearer private-public mix in South Korea, Taiwan and even Japan with private
dominance. But one point which deserves attention is that the conventional
public-private distinction is no longer appropriate especially when private financial
contributions and fee-paying practices are becoming increasingly popular in East Asia.
In order to increase the higher education enrolment rate, we have also witnessed the
growing prominence of the privateness in the higher education of Singapore and Hong
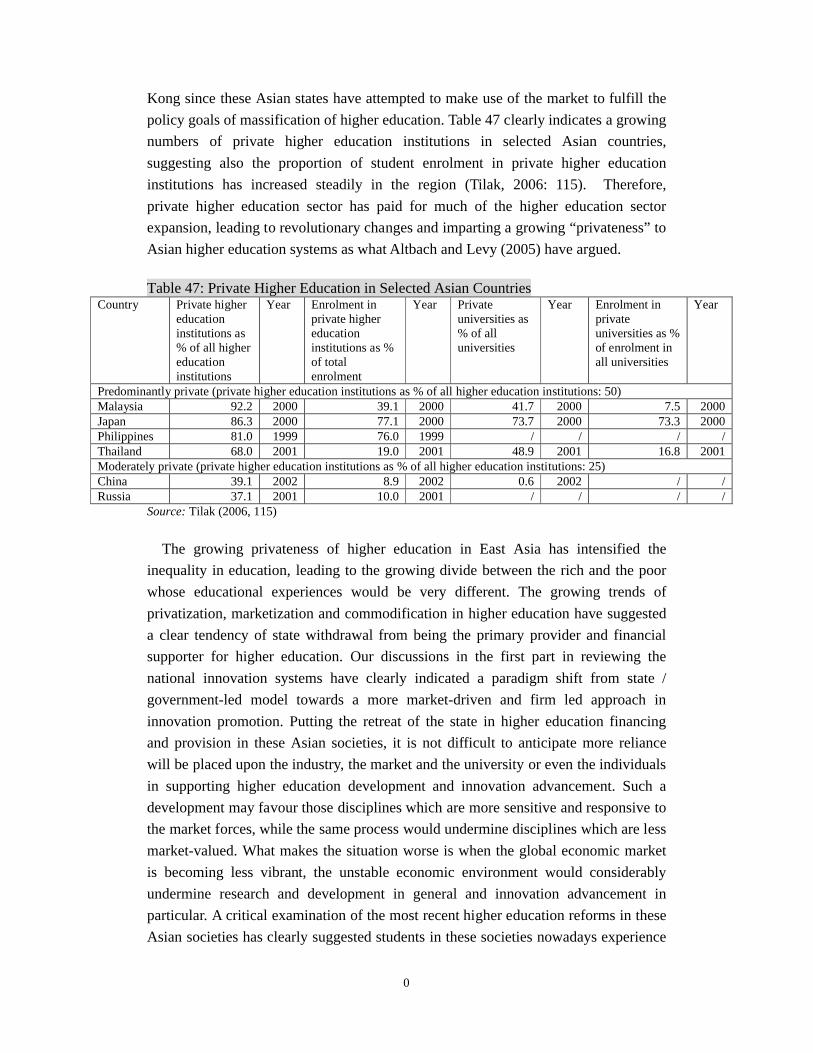
0
Kong since these Asian states have attempted to make use of the market to fulfill the
policy goals of massification of higher education. Table 47 clearly indicates a growing
numbers of private higher education institutions in selected Asian countries,
suggesting also the proportion of student enrolment in private higher education
institutions has increased steadily in the region (Tilak, 2006: 115). Therefore,
private higher education sector has paid for much of the higher education sector
expansion, leading to revolutionary changes and imparting a growing “privateness” to
Asian higher education systems as what Altbach and Levy (2005) have argued.
Table 47: Private Higher Education in Selected Asian CountriesCountry Private higher
education institutions as % of all higher education institutions
Year Enrolment in private higher education institutions as % of total enrolment
Year Private universities as % of all universities
Year Enrolment in private universities as % of enrolment in all universities
Year
Predominantly private (private higher education institutions as % of all higher education institutions: 50)Malaysia 92.2 2000 39.1 2000 41.7 2000 7.5 2000Japan 86.3 2000 77.1 2000 73.7 2000 73.3 2000Philippines 81.0 1999 76.0 1999 / / / /Thailand 68.0 2001 19.0 2001 48.9 2001 16.8 2001Moderately private (private higher education institutions as % of all higher education institutions: 25)China 39.1 2002 8.9 2002 0.6 2002 / /Russia 37.1 2001 10.0 2001 / / / /
Source: Tilak (2006, 115)
The growing privateness of higher education in East Asia has intensified the
inequality in education, leading to the growing divide between the rich and the poor
whose educational experiences would be very different. The growing trends of
privatization, marketization and commodification in higher education have suggested
a clear tendency of state withdrawal from being the primary provider and financial
supporter for higher education. Our discussions in the first part in reviewing the
national innovation systems have clearly indicated a paradigm shift from state /
government-led model towards a more market-driven and firm led approach in
innovation promotion. Putting the retreat of the state in higher education financing
and provision in these Asian societies, it is not difficult to anticipate more reliance
will be placed upon the industry, the market and the university or even the individuals
in supporting higher education development and innovation advancement. Such a
development may favour those disciplines which are more sensitive and responsive to
the market forces, while the same process would undermine disciplines which are less
market-valued. What makes the situation worse is when the global economic market
is becoming less vibrant, the unstable economic environment would considerably
undermine research and development in general and innovation advancement in
particular. A critical examination of the most recent higher education reforms in these
Asian societies has clearly suggested students in these societies nowadays experience

0
more difficulty for social mobility but suffer more from intensified social inequality
and growing uncertainty in career development and economic prospects.
Our above analysis has clearly indicated higher education development in East Asia
has moved towards market-orientation. There are two major reasons accounting for
this trend: first is related to financial reason especially when the Asian governments
realize depending upon the state funding would not be sufficient to finance the
pressing demand for higher education; second is to make use of the market force for
driving the higher education institutions to compete and perform better in increasing
accountability. But after implementing the ‘marketization’ policy, some Asian
governments find the interactions between the higher education institutions and the
industry / business has proved to be productive and conductive for enhancing
innovation, such synergy is hence positively encouraged as evident in Taiwan, South
Korea and Japan.
The Role of Higher Education in Promoting Innovation
As discussed earlier, industry-HEIs relationship is found to be the core of national
innovation system in many developed countries, allowing a two-way exchange
between academic sophistication and market-oriented innovation to create win-win
situation for both partners. In order to develop a better understanding of the role of the
university in innovation promotion, we must contextually analyze the changing role of
the university in innovation advancement against the context of recent higher
education reforms discussed in the above part. It is against the growing popularity of
the privatization, marketization and commodification of higher education that higher
education systems in the selected Asian societies have tried to move beyond their
conventional boundary to engage in collaborating with the industry and business in
promoting innovation. The following part critically reflects upon the changing role of
higher education in promotion of innovation and technology.
Hong Kong
As shown in Table 48, among the university student population of Hong Kong, the
shares of students from engineering & technology and science have been the largest
and third largest cohorts in recent years. As for the postgraduates, which are more
likely to engage in R&D activities after graduation, the government has accordingly
planned to provide 800 additional places for postgraduate research programs (all
fields, not exclusively for S&T-related programs) from 2009/10 to 2011/12, hoping
that it will enhance the R&D manpower in Hong Kong. It is estimated that an
additional HK$300 million will be needed each year (Hong Kong government, 2008:
36).

0
Table 48. Student Enrollment (Full-Time Equivalent) of UGC-Funded Undergraduate
Programs by Field of Study, Hong Kong (2004/05-2008/2009)
Academic Year 2004/05 2005/06 2006/07 2007/08 2008/09
Medicine, Dentistry
& Health
5,685
(8.2%)
5,772
(8.5%)
6,031
(9.1%)
6,165
(9.3%)
6,260
(9.3%)
Sciences11,882
(17.1%)
11,667
(17.2%)
11,395
(17.1%)
11,020
(16.7%)
11,074
(16.4%)
Engineering &
Technology
13,536
(19.5%)
13,471
(19.9%)
13,546
(20.4%)
13,664
(20.7%)
13,976
(20.7%)
Business &
Management
13,812
(19.9%)
13,262
(19.6%)
12,876
(19.3%)
13,078
(19.8%)
13,480
(19.9%)
Social sciences9,415
(13.6%)
9,387
(13.9%)
8,961
(13.5%)
8,853
(13.4%)
9,117
(13.5%)
Arts & Humanities9,692
(14.0%)
9,635
(14.2%)
9,220
(13.9%)
8,623
(13.0%)
8,946
(13.2%)
Education5,291
(7.6%)
4,521
(6.7%)
4,529
(6.8%)
4,685
(7.0%)
4,814
(7.1%)
Total 69,313 67,715 66,558 66,088 67,659
Source: UGC, Hong Kong, 2009. http://www.ugc.edu.hk/eng/doc/ugc/stat/apcfte_series.pdf
In terms of research, which is also closely related to innovation, Table 48 shows
that the total amount of departmental expenditure on research is expanding, and this
phenomenon is coupled with a mild improvement of research in Hong Kong’s HEIs
recently (see Table 49 & 50).
Table 49. Expenditure of UGC-Funded Institutions as a Whole, Hong Kong
(2001/02-2007/08)
Academic Year 2001/02 2002/03 2003/04 2004/05 2005/06 2006/07 2007/08
Gross Domestic Product(US$ Billion)
164.2 160.4 162.3 170.0 183.3 196.2 215.0
Expenditure of UGC-Funded Institutions (HK$ million)
Total Expenditure
2,374.
2
2,374.
4
2,326.
8
2,258.
22,312.3
2,449.
7
2,727.
4
Departmental Expenditure on Research
621.4 615.5 614.9 603.5 651.9 693.7 776.5
Ratio of Expenditure of UGC-Funded Institutions to GDP
Total Expenditure 1.45% 1.48% 1.43% 1.33% 1.26% 1.25% 1.27%
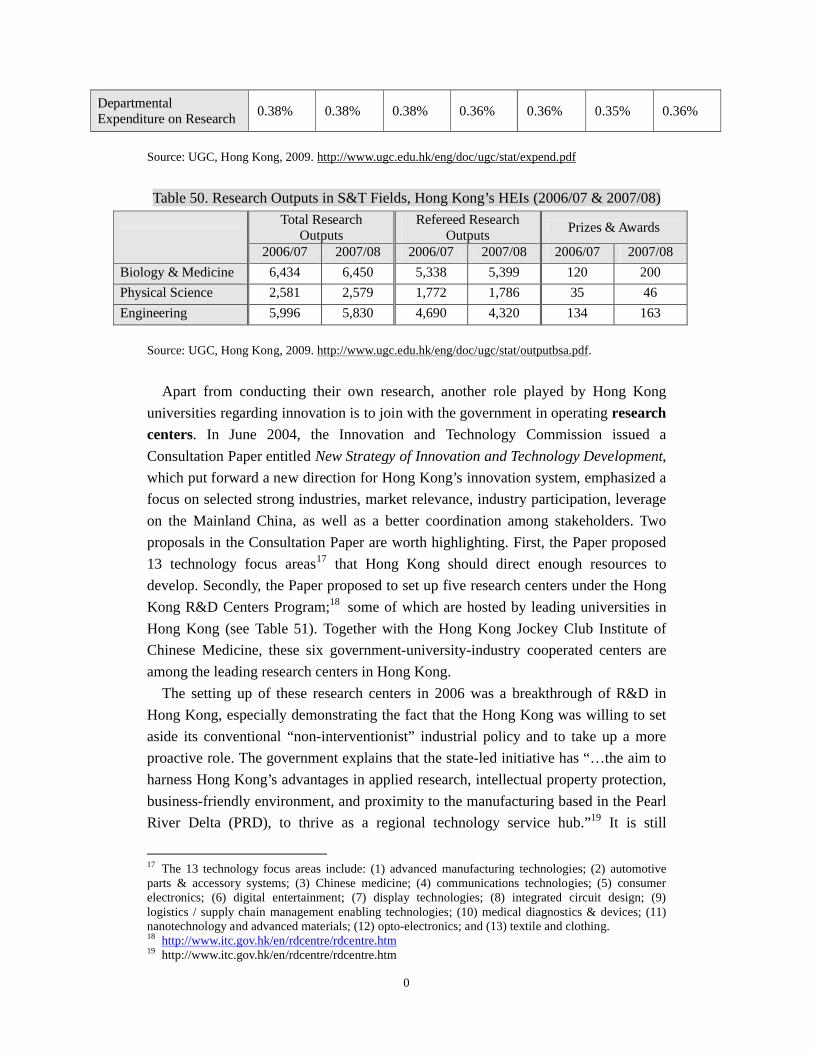
0
Departmental Expenditure on Research
0.38% 0.38% 0.38% 0.36% 0.36% 0.35% 0.36%
Source: UGC, Hong Kong, 2009. http://www.ugc.edu.hk/eng/doc/ugc/stat/expend.pdf
Table 50. Research Outputs in S&T Fields, Hong Kong’s HEIs (2006/07 & 2007/08)
Total ResearchOutputs
Refereed Research Outputs
Prizes & Awards
2006/07 2007/08 2006/07 2007/08 2006/07 2007/08
Biology & Medicine 6,434 6,450 5,338 5,399 120 200
Physical Science 2,581 2,579 1,772 1,786 35 46
Engineering 5,996 5,830 4,690 4,320 134 163
Source: UGC, Hong Kong, 2009. http://www.ugc.edu.hk/eng/doc/ugc/stat/outputbsa.pdf.
Apart from conducting their own research, another role played by Hong Kong
universities regarding innovation is to join with the government in operating research
centers. In June 2004, the Innovation and Technology Commission issued a
Consultation Paper entitled New Strategy of Innovation and Technology Development,
which put forward a new direction for Hong Kong’s innovation system, emphasized a
focus on selected strong industries, market relevance, industry participation, leverage
on the Mainland China, as well as a better coordination among stakeholders. Two
proposals in the Consultation Paper are worth highlighting. First, the Paper proposed
13 technology focus areas17 that Hong Kong should direct enough resources to
develop. Secondly, the Paper proposed to set up five research centers under the Hong
Kong R&D Centers Program;18 some of which are hosted by leading universities in
Hong Kong (see Table 51). Together with the Hong Kong Jockey Club Institute of
Chinese Medicine, these six government-university-industry cooperated centers are
among the leading research centers in Hong Kong.
The setting up of these research centers in 2006 was a breakthrough of R&D in
Hong Kong, especially demonstrating the fact that the Hong Kong was willing to set
aside its conventional “non-interventionist” industrial policy and to take up a more
proactive role. The government explains that the state-led initiative has “…the aim to
harness Hong Kong’s advantages in applied research, intellectual property protection,
business-friendly environment, and proximity to the manufacturing based in the Pearl
River Delta (PRD), to thrive as a regional technology service hub.”19 It is still
17 The 13 technology focus areas include: (1) advanced manufacturing technologies; (2) automotive parts & accessory systems; (3) Chinese medicine; (4) communications technologies; (5) consumer electronics; (6) digital entertainment; (7) display technologies; (8) integrated circuit design; (9) logistics / supply chain management enabling technologies; (10) medical diagnostics & devices; (11) nanotechnology and advanced materials; (12) opto-electronics; and (13) textile and clothing.18 http://www.itc.gov.hk/en/rdcentre/rdcentre.htm19 http://www.itc.gov.hk/en/rdcentre/rdcentre.htm
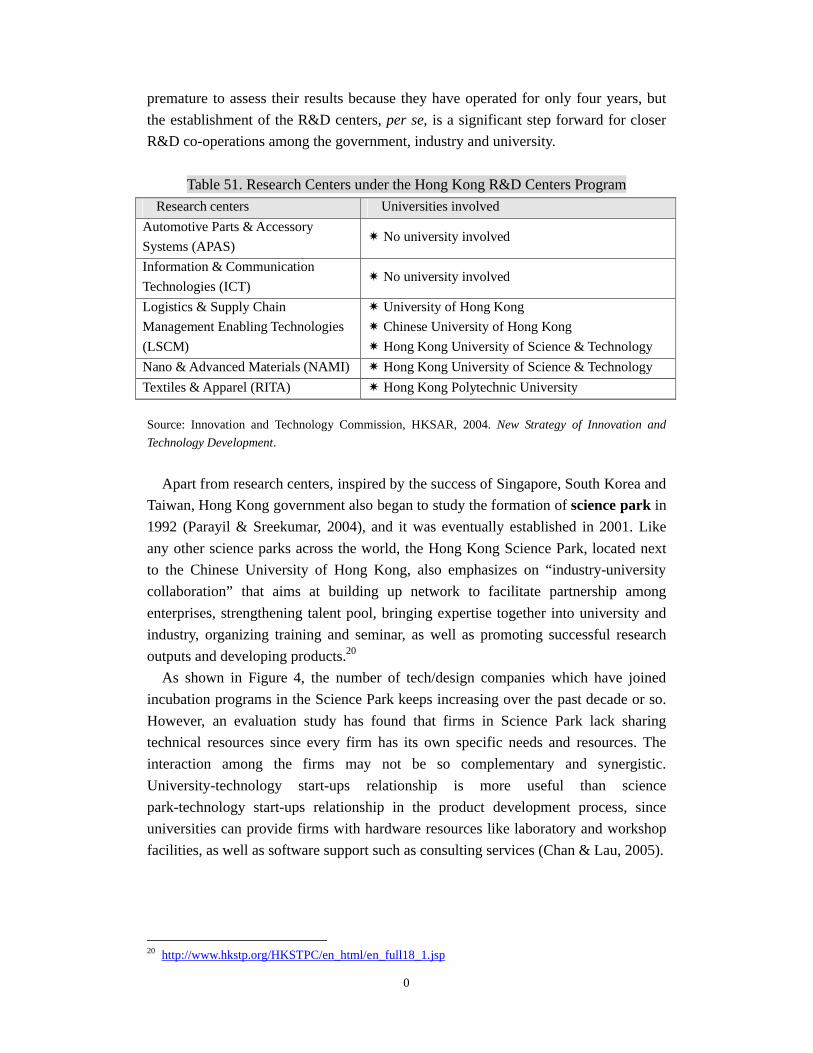
0
premature to assess their results because they have operated for only four years, but
the establishment of the R&D centers, per se, is a significant step forward for closer
R&D co-operations among the government, industry and university.
Table 51. Research Centers under the Hong Kong R&D Centers Program
Research centers Universities involved
Automotive Parts & Accessory
Systems (APAS) No university involved
Information & Communication
Technologies (ICT) No university involved
Logistics & Supply Chain
Management Enabling Technologies
(LSCM)
University of Hong Kong
Chinese University of Hong Kong
Hong Kong University of Science & Technology
Nano & Advanced Materials (NAMI) Hong Kong University of Science & Technology
Textiles & Apparel (RITA) Hong Kong Polytechnic University
Source: Innovation and Technology Commission, HKSAR, 2004. New Strategy of Innovation and
Technology Development.
Apart from research centers, inspired by the success of Singapore, South Korea and
Taiwan, Hong Kong government also began to study the formation of science park in
1992 (Parayil & Sreekumar, 2004), and it was eventually established in 2001. Like
any other science parks across the world, the Hong Kong Science Park, located next
to the Chinese University of Hong Kong, also emphasizes on “industry-university
collaboration” that aims at building up network to facilitate partnership among
enterprises, strengthening talent pool, bringing expertise together into university and
industry, organizing training and seminar, as well as promoting successful research
outputs and developing products.20
As shown in Figure 4, the number of tech/design companies which have joined
incubation programs in the Science Park keeps increasing over the past decade or so.
However, an evaluation study has found that firms in Science Park lack sharing
technical resources since every firm has its own specific needs and resources. The
interaction among the firms may not be so complementary and synergistic.
University-technology start-ups relationship is more useful than science
park-technology start-ups relationship in the product development process, since
universities can provide firms with hardware resources like laboratory and workshop
facilities, as well as software support such as consulting services (Chan & Lau, 2005).
20 http://www.hkstp.org/HKSTPC/en_html/en_full18_1.jsp

0
Figure 4. Number of Tech/Design Companies Joining the Incubation Program in the
Hong Kong Science Park, 1992-2009
Source: Official website of the Hong Kong Science Park.
From the standpoint of universities, except for waiting to be invited or motivated by
the government to engage in R&D activities with the industry, since the 1990s, they
have actively sought ways to explore the potential of university-industry partnership,
mainly through setting up spin-off companies and technology transfer office (Sharif &
Baark, 2008). For instance, the Hong Kong University of Science and Technology has
established its HKUST R&D Corporation both in Shenzhen and Hong Kong; as well
as a Technology Transfer Center in January 2007. Likewise, the Hong Kong
Polytechnic University established its Institute for Enterprise, which consists of
several operating units that help to facilitate R&D commercialization and technology
transfer. 21 Moreover, the International Strategic Technology Alliance and the
Shenzhen Research Institute were formed to foster research collaboration and
technology transfer with international community and the Mainland China
respectively.22 As for the University of Hong Kong (HKU), a company called
Versitech and the Technology Transfer Office has also been set up. In fact, HKU
revisited its vision and mission in 1998, placing more emphasis thereafter on applied
research.23
Finally, another noteworthy development concerned is the role of Hong Kong
21 These units are: Technology and Product Development Group; Management and Executive Development Centre; Partnership Development Office; PolyU Technology & Consultancy Company Limited; PolyU Outpost Centre.22 In face of the expanding bureaucratic structure and increasing importance of these R&D activities, the university has even arranged one of its Vice President to oversee partnership development.23 HKU however stresses that paying more attention to applied research is by no means to sacrifice the quality of research, “the goal is to produce results of ‘relevance’ to the community, through‘excellence’...” (http://www.hku.hk/rss/direction.htm).

0
universities in RIS. Many people in 1990s have already envisioned that Hong Kong’s
innovation system would be increasingly integrated with Mainland China’s in face of
the handover.24 Aiming to develop Hong Kong into an innovation hub, since the
2000s, the government has tried to position Hong Kong as a regional service hub for
the Pearl River Delta (Baark & So, 2006). This vision became reality when Shenzhen
and Hong Kong signed the Shenzhen-Hong Kong Innovation Circle cooperation
agreement in May 2007. The newly-developed Innovation Circle aims to establish
innovation bases, service platforms and initiate major research and development
projects. One of the goals is to set up a Shenzhen-Hong Kong
Industry-University-Research Base for Hong Kong’s Universities.25 In the 2007
Budget, the Financial Secretary pledged to relax restrictions imposed on the
University-Industry Collaboration Program to further its development. Meanwhile,
the Innovation and Technology Fund also put forward a consultation paper, suggesting
that the government relaxed geographical restrictions on the Program and allow the
industry to choose non-local universities as partners, as well as conducting their R&D
activities outside Hong Kong (Innovation and Technology Commission, 2007).
While in general, these proposed relaxation measures were welcomed by trade
associations and professional bodies, local universities expressed a more reserved
support, fearing that such a proposal will move R&D activities out of Hong Kong.26
Nevertheless, in 2008, the government has successfully made a deal on the first
mega-project under the concept of the Innovation Circle. The U.S. firm DuPont has
agreed to establish the Global Thin Film Photovoltaic Business/R&D Center in the
Hong Kong Science Park, while setting up its production line in Shenzhen (Hong
Kong SAR Government, 2008).
Taiwan
The ambition of Taiwan in R&D activities is best indicated by the far-reaching
policies it has put forward, especially in regard to higher education. For example, the
24 According to a consultant report on Hong Kong Science Park conducted in the early 1990s, out of the 560 tech-based firms interviewed in 17 countries, 63 of them (mainly from Mainland China, west coast USA and the strongest European economies) expressed interest in establishing firms in the Park. One of their main reasons is the possibility of exploring the market, manpower and technological potential of China (Yeh & Ng, 1994).25 The Secretary for Commerce & Economic Development of HKSAR, Rita Lau, explained the design of the Circle that: “the action plan comprises 24 cooperation projects under three categories: Innovation Foundation (provision of laboratories or facilities), Service Platform (sharing of technological resources and provision of technological services platform); and Major research and development (R&D) Projects (cooperation in particular technological areas, such as solar battery)” (Hong Kong Information Services Department, 2009).26 For example, the University of Hong Kong suggested that priority should be given to local R&D organizations and institutions. Similarly, the Hong Kong Polytechnic University proposed that the government should set a ceiling on the amount of R&D activities eligible outside Hong Kong, and only allow non-local R&D work if there is no relevant local expertise and capability in Hong Kong (Legislative Council Panel on Commerce and Industry, 2008).

0
National S&T Development Plan (2001-2004) outlines the proposal of
“strengthening the training, recruiting, and utilization of technological manpower” as
one of the S&T development strategies (National Science Council [NSC], 2001). The
mid-term goal of this strategy was to increase the number of research personnel with a
bachelor degree to 80,000, and at least 60% of the overall personnel with an MS or
PhD degree by 2004. The long-term goal towards 2010 is to increase the number of
the former to 100,000, and the proportion for the latter to at least 65% (ibid.).
Intending to strengthen the quality of S&T manpower in universities, the second
National S&T Development Plan (2005-2008) vowed to (1) implement “macro
planning of higher education”; (2) encourage “the development of interdisciplinary
courses, shrinking the gap between university education and industrial S&T
manpower needs”; and (3) strengthen “cooperative work-study programs involving
industry, academia, and research organizations in order to boost S&T manpower
development” (NSC, 2005: 14).
Against this policy backdrop, as shown in Table 52, the total number of S&T
students has increased over the past decade from 593,419 in 2000/01 to 635,709 in
2008/09, though the share of S&T students to the whole student population continues
to decline.
Table 52. Enrollment of S&T students in Taiwanese Tertiary Educational Institutions
Academic
Year
Total Enrollment Enrollment in S&T Fields
Number As Share of Total (%)
2000-2001 1,092,102 573,419 52.51
2001-2002 1,187,225 611,793 51.53
2002-2003 1,240,292 625,468 50.43
2003-2004 1,270,194 632,273 49.78
2004-2005 1,285,867 631,862 49.14
2005-2006 1,296,558 634,255 48.92
2006-2007 1,313,993 638,789 48.61
2007-2008 1,326,029 639,391 48.22
2008-2009 1,337,455 635,709 47.53
Source: Ministry of Education, Republic of China, 2009. Enrollment in Tertiary-by program,
http://english.moe.gov.tw/lp.asp?CtNode=1184&CtUnit=415&BaseDSD=7&mp=1.
In terms of industry-academia collaboration, Chanxie hezuo is indeed a buzzword
in Tawian’s HE sector. As shown in Table 53, the government has continued to pour a
large amount of money to achieve the goal, accounting for over 80% of the total
funding for higher education’s R&D activities in the past few years.
Table 53. Higher Education R&D Expenditure (in US$ Million) by Source of Fund,

0
Taiwan (2003-2007)
Business Enterprise
GovernmentHigher
EducationPrivate
Non-ProfitAbroad
2003156.0
(4.2%)
3,150.4
(85.1%)
353.1
(9.5%)
38.6
(1.0%)
5.8
(0.2%)
2004
200.6
(5.2%)
3,245.6
(83.4%)
393.3
(10.1%)
48.7
(1.3%)
2.6
(0.1%)
2005237.7
(5.8%)
3,427.9
(83.3%)
397.8
(9.7%)
48.6
(1.2%)
2.3
(0.1%)
2006
267.7
(5.6%)
4,079.1
(84.7%)
413.8
(8.6%)
51.9
(1.1%)
3.5
(0.1%)
2007275.1
(5.3%)
4,449.5
(85.9%)
401.7
(7.8%)
50.3
(1.0%)
2.9
(0.1%)
Source: National Science Council, Republic of China, 2008.
Regarding research incentives for R&D personnel in HEIs, the National S&T
Development Plan (2005-2008) suggests revising regulations, so that instructors could
participate in industry-academic cooperation incentive mechanisms (NSC, 2005: 21).
Also, it suggests the expansion of pre-employment courses to train industry-needed
manpower, allowing industry personnel to participate in course planning (ibid.: 22). In
2007, rules were also passed by the Ministry of Education to include the performance
of HEIs’ industry-academia collaboration as one of the criteria for evaluation, as well
as awarding faculty members and students who have performed well in the
collaboration (Ministry of Education, ROC, 2007b).
As for the forms of industry-academia collaboration in Taiwan, the two mainstream
formats are as follows:
(1) Technology Transfer Office. For instance, the National Taiwan University and
National Tsinghua University, selected by the Ministry to be the potentially
world-class universities, have formed the Technology Transfer Bureau and the Office
of Technology Licensing respectively. Another example that worth mentioning is the
case of National Chiao Tung University. As one of the oldest and most renowned
research universities in Taiwan, it continues to supply much of the R&D personnel for
ITRI and the Hsinchu Science Park since the 1970s. In order to build upon its
previous success, the University established the Office of Research and Development
in 1995-96 to orchestrate all related activities, such as the commercialization and

0
licensing of its R&D outputs, as well as building the portfolio of intellectual property
rights of the university (Mathews & Hu, 2007, 1012).
(2) Incubation Center. This is a common form of industry-academia collaboration
in Taiwan since the government finds it hard for SMEs to establish their own research
departments. Seen in this light, support from the government and academic
institutions is significant and pivotal to their growth and competitiveness. In 1997,
SMEA launched the Innovation Incubation Program. As of 2008, there were already
104 incubation centers with more than 3,380 incubated enterprises in Taiwan. Overall,
an amount of NT$51.9 billion have been invested, and 45 incubated companies listed
as OTC (Over-the-Counter) or on the Taiwan Stock Exchange (Ministry of Economic
Affairs, ROC, 2008).
Table 54. Number of Incubation Centers by Type, Taiwan (2008)
No. of Incubation Centers
Universities 84 (80.8%)
Government Agencies 10 (9.6%)
Foundations 9 (8.7%)
Private Enterprises 1 (1.0%)
Total 104 (100%)
Source: SME Administration, Ministry of Economic Affairs, Taiwan, 2008
As shown in Table 54, universities-based incubation centers constitute over 80% of
the total 104 incubation centers, followed by government agencies (9.6%) and
foundations (8.7%). The share of private enterprises is below 1%. The importance of
Taiwanese universities to SMEs’ R&D development is very obvious in this vein. As a
recent statistical study indicates, SMEs in Taiwan are deeply involved in
university-industry linkages, and have transformed their innovation activities from
process innovation to product innovation through these linkages. The study also
shows that SEMs tend to cooperate with the public rather private universities, since
the resourceful former are more capable to help SEMs in the emerging industries like
biotechnology and nanotechnology (Hu & Mathews, 2009).
Table 55. Top Ten Categories of Incubation Center in Taiwan
Category Distribution Category Distribution
IT & Electronics 30.02% Environmental Protection Industry 3.86%
Machinery & Electric Machinery 18.05% Multimedia & Broadcasting 3.63%
Biotechnology 14.52% Medical Industry 3.60%
Raw Material 4.21% Education & Cultural Art 3.26%
Livelihood Industry 3.93% Petrifaction & Chemical 1.90%

0
Source: SME Administration, Ministry of Economic Affairs, ROC, 2008.
The National Tsing Hua University’s Innovation Incubator (THII) is a successful
example that worth noting in this regard. THII implemented a “feedback system”
since 2000, which requires the incubated companies to contribute certain profits back
to THII for the maintenance and expansion of its operation.27 However, due to
insufficient funding from the government, some less resourceful universities have to
form their own alliance of innovation incubators. For example, the Chou Shui River
League of Incubation Centers has been formed by a group of universities along the
River, including the Dayeh University, National Changhua University of Education,
Mingdao University, Chienkuo Technology University, National Yunlin University of
Science & Technology, National Formosa University, Transworld Institute of
Technology, Nan Kai Institute of Technology, and the National Chiayi University. The
league organizes a business alliance conference each year to attract companies (Yang,
2007).
South Korea
In South Korea, most R&D expenditures were used for development research (over
60%), followed by applied (about 20%) and basic research (about or less than 15%)
(see Table 56). Notably, it is not universities which perform basic research the most;
rather this leading role is taken up by companies, particularly large companies (see
Table 57). Andersson & Dahlman (2001) explain that the reason why South Korean
universities do not focus on basic research is the lack of government funding as
compared to governmental research institutes. Therefore, they have to turn to private
enterprises for funding through conducting applied and development research (cited in
Shapiro, 2007: 176).
Table 56. Trend of R&D Expenditure by Research Stage, South Korea,2000-2005 (in
US$ Million)
2000 2001 2002 2003 2004 2005
Total12298.8 14307.7 15,386.4 16,934.9 19,702.8 21,452.4
Basic (%) 12.6 12.6 13.7 14.5 15.3 15.3
Applied (%) 24.3 25.3 21.7 20.8 21.2 20.8
Development (%) 63.1 62.1 64.6 64.7 63.5 63.8
Source: MEST website, http://english.mest.go.kr/main.jsp?idx=0402010601
27 By 2007, “about NT$2 million, contributed products worth NT$15 million and 336,281 stock shares have been received” (Fan, 2007).

0
Table 57. Basic Research Expenditure by Sector, South Korea (in US$ Million)
2004 2005
Total3,019.0 3,292.0
Public Research Institutes 547.2 (18.1%) 607.9 (18.5%)
Universities 654.4 (21.7%) 740.5 (22.5%)
Companies 1,817.5 (60.2%) 1,943.6 (59.0%)
- Large1,579.6 1,778.5
- Small & Medium Sized159.0 93.7
- Venture79.0 71.4
Source: MEST website, http://english.mest.go.kr/main.jsp?idx=0402010601
In this regard, universities usually team up with SMEs for applied and development
research. As mentioned earlier, Chaebols (big corporations) in South Korea have their
own resources to conduct in-house research. Since SMEs lack the research capacity
and expertise, they are the frequent partners in university-industry collaboration.
Kim’s (2001) analysis shows that after the 1997/98 Asian Financial Crisis where
Chaebols started to cut their R&D expenditures, SMEs seized on the opportunity to
jumpstart innovation. The number of venture firms increased exponentially from 100
before the Crisis to more than 7,000 in the mid 2000s (cited in Shapiro, 2007: 176). A
study taken by the Korean Research Foundation in 2007 found that in 2006, 51.6% of
the university-industry research collaborations by the 12 leading universities were
conducted with SMEs with a size of less than 300 employees (Hemmert et al., 2008:
167).
Among the leading universities, different situations have been encountered in
dealing with the university-industry research collaborations. For the Seoul National
University, it consists of 17 government-funded research centers. In 2007, the
university conducted 4,473 research projects. The total amount of research fund was
356,000 million won. The government’s funding constituted about 84.4% of the total
pool of research resources, while that of private sector and college only accounted for
about 12.8% and 2.6% respectively. There are 44 “Brain Korea 21” research groups,
with about 70% of staff participating. With all these resources, the Seoul National
University has improved its research output. For example, the number of SCI paper
publications has increased from 3,062 in 2003 to 3,946 in 2005, and even to 4,219 in
2007.28 As for the Korean Advanced Institute of Science and Technology, in 2007, it
28 SNU website, http://www.useoul.edu/research/res0201.jsp
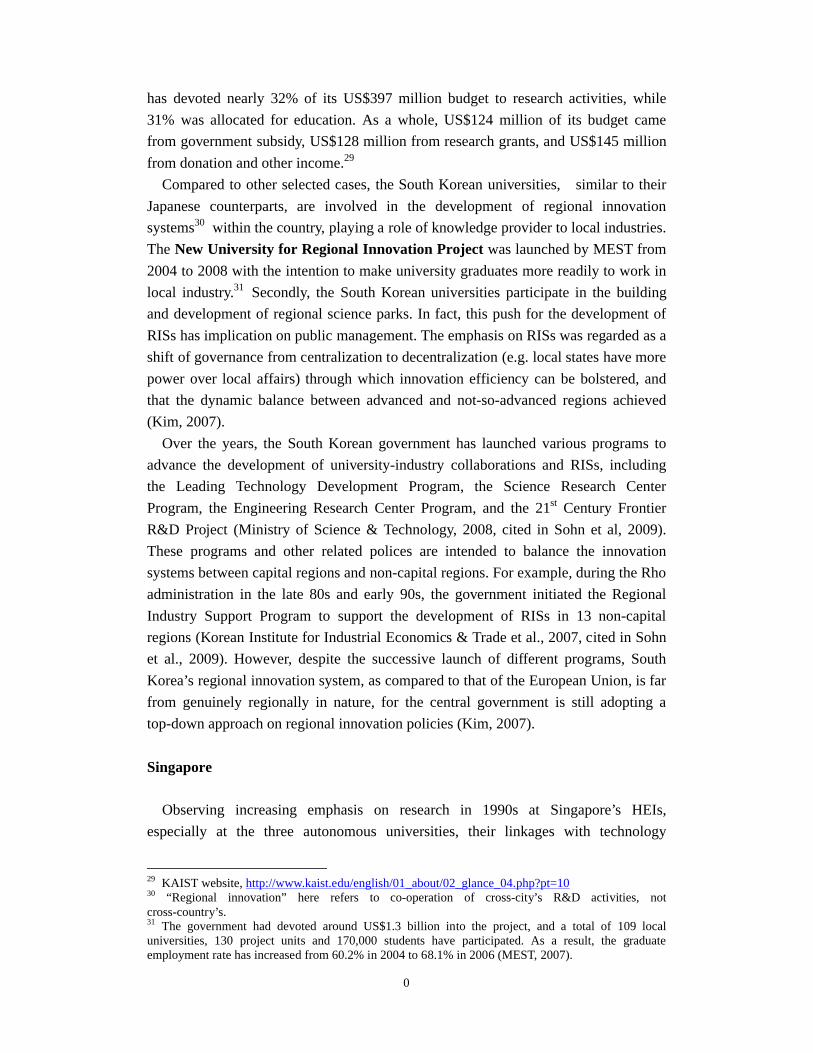
0
has devoted nearly 32% of its US$397 million budget to research activities, while
31% was allocated for education. As a whole, US$124 million of its budget came
from government subsidy, US$128 million from research grants, and US$145 million
from donation and other income.29
Compared to other selected cases, the South Korean universities, similar to their
Japanese counterparts, are involved in the development of regional innovation
systems30 within the country, playing a role of knowledge provider to local industries.
The New University for Regional Innovation Project was launched by MEST from
2004 to 2008 with the intention to make university graduates more readily to work in
local industry.31 Secondly, the South Korean universities participate in the building
and development of regional science parks. In fact, this push for the development of
RISs has implication on public management. The emphasis on RISs was regarded as a
shift of governance from centralization to decentralization (e.g. local states have more
power over local affairs) through which innovation efficiency can be bolstered, and
that the dynamic balance between advanced and not-so-advanced regions achieved
(Kim, 2007).
Over the years, the South Korean government has launched various programs to
advance the development of university-industry collaborations and RISs, including
the Leading Technology Development Program, the Science Research Center
Program, the Engineering Research Center Program, and the 21st Century Frontier
R&D Project (Ministry of Science & Technology, 2008, cited in Sohn et al, 2009).
These programs and other related polices are intended to balance the innovation
systems between capital regions and non-capital regions. For example, during the Rho
administration in the late 80s and early 90s, the government initiated the Regional
Industry Support Program to support the development of RISs in 13 non-capital
regions (Korean Institute for Industrial Economics & Trade et al., 2007, cited in Sohn
et al., 2009). However, despite the successive launch of different programs, South
Korea’s regional innovation system, as compared to that of the European Union, is far
from genuinely regionally in nature, for the central government is still adopting a
top-down approach on regional innovation policies (Kim, 2007).
Singapore
Observing increasing emphasis on research in 1990s at Singapore’s HEIs,
especially at the three autonomous universities, their linkages with technology
29 KAIST website, http://www.kaist.edu/english/01_about/02_glance_04.php?pt=1030 “Regional innovation” here refers to co-operation of cross-city’s R&D activities, not cross-country’s.31 The government had devoted around US$1.3 billion into the project, and a total of 109 local universities, 130 project units and 170,000 students have participated. As a result, the graduate employment rate has increased from 60.2% in 2004 to 68.1% in 2006 (MEST, 2007).
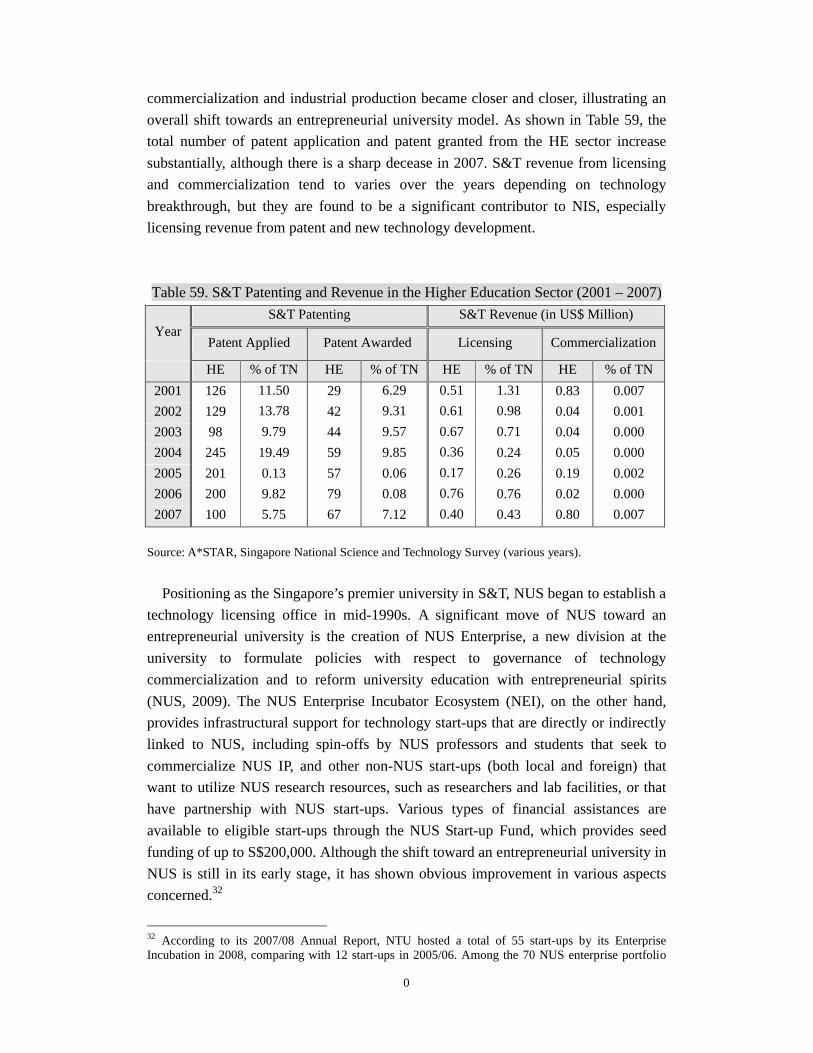
0
commercialization and industrial production became closer and closer, illustrating an
overall shift towards an entrepreneurial university model. As shown in Table 59, the
total number of patent application and patent granted from the HE sector increase
substantially, although there is a sharp decease in 2007. S&T revenue from licensing
and commercialization tend to varies over the years depending on technology
breakthrough, but they are found to be a significant contributor to NIS, especially
licensing revenue from patent and new technology development.
Table 59. S&T Patenting and Revenue in the Higher Education Sector (2001 – 2007)
YearS&T Patenting S&T Revenue (in US$ Million)
Patent Applied Patent Awarded Licensing Commercialization
HE % of TN HE % of TN HE % of TN HE % of TN
2001 126 11.50 29 6.29 0.51 1.31 0.83 0.007
2002 129 13.78 42 9.31 0.61 0.98 0.04 0.001
2003 98 9.79 44 9.57 0.67 0.71 0.04 0.000
2004 245 19.49 59 9.85 0.36 0.24 0.05 0.000
2005 201 0.13 57 0.06 0.17 0.26 0.19 0.002
2006 200 9.82 79 0.08 0.76 0.76 0.02 0.000
2007 100 5.75 67 7.12 0.40 0.43 0.80 0.007
Source: A*STAR, Singapore National Science and Technology Survey (various years).
Positioning as the Singapore’s premier university in S&T, NUS began to establish a
technology licensing office in mid-1990s. A significant move of NUS toward an
entrepreneurial university is the creation of NUS Enterprise, a new division at the
university to formulate policies with respect to governance of technology
commercialization and to reform university education with entrepreneurial spirits
(NUS, 2009). The NUS Enterprise Incubator Ecosystem (NEI), on the other hand,
provides infrastructural support for technology start-ups that are directly or indirectly
linked to NUS, including spin-offs by NUS professors and students that seek to
commercialize NUS IP, and other non-NUS start-ups (both local and foreign) that
want to utilize NUS research resources, such as researchers and lab facilities, or that
have partnership with NUS start-ups. Various types of financial assistances are
available to eligible start-ups through the NUS Start-up Fund, which provides seed
funding of up to S$200,000. Although the shift toward an entrepreneurial university in
NUS is still in its early stage, it has shown obvious improvement in various aspects
concerned.32
32 According to its 2007/08 Annual Report, NTU hosted a total of 55 start-ups by its Enterprise Incubation in 2008, comparing with 12 start-ups in 2005/06. Among the 70 NUS enterprise portfolio

0
The Singapore Management University (SMU) and Nanyang Technology
University (NTU) have also developed similar agencies at campus to promote
technology transfer and foster entrepreneurship. The Institute of Innovation &
Entrepreneurship at SMU was formed to collectively organize university-industrial
affiliated activities through the IP Management Office, Joint R&D Programs, and
affiliation with SMEs and enterprises (SMU, 2009). In addition, there are promotional
and training programs to develop specific interest in innovation and entrepreneurial
activities among SMU stakeholders. At the NTU, an Innovation & Technology
Transfer Office (ITTO) was established in 2000 to manage innovation and
entrepreneurship through facilitating the transfer of leading-edge technologies
developed in the University to companies in the industrial sector (NTU, 2009).
Research collaborations with NTU are undertaken in two forms: joint research
programs or engaging NTU’s research expertise to undertake the research projects. To
ensure its research and technology innovation in line with public interest, ITTO
formulated a set of policies on intellectual property, technology transfer and research
collaboration to govern university intellectual property. Adding to this, ITTO provides
relevant services to help university researchers to evaluate, protect, and
commercialize their technological inventions, in the form of licensing or forming
spin-off companies.33
On the other hand, since the implementation of its National S&T Plans in the early
1990s, the government has shifted the emphasis of R&D research to the private sector,
reflected by the over-proportionate R&D funding to the private sector. As shown in
Table 60 & Figure 5, from 1997-2007, the private sector consistently occupied over
60% of the total national R&D funding, while the HE sector only accounts for
10%-13% of these amounts, and shown a slight decline since 2003:
Table 60. Singapore National R&D Expenditure by Sector (1997-2007)
Year R&D Expenditure by Sector (in US$ Million)
Total National
(TNE)
Government
Sector
Public Research
InstitutesHE Sector Private Sector
S$ % of GDP S$ % of TNE S$ % of TNE S$ % of TNE S$ % of TNE
19971,501
1.5154
10.27211
14.07198
13.21938
62.5
19981,778
1.81214
12.04250
14.09218
12.281,096
61.64
19991,895
1.9218
11.48265
13.97221
11.671,192
62.91
2000 2,147 1.88 302 14.09 272 12.66 241 11.23 1,331 61.99
companies, 30 of them were spun out of the University using NUS intellectual properties.33 The Innovation Center is a sub-division of ITTO to provide space for NTU members to start up affiliated companies.
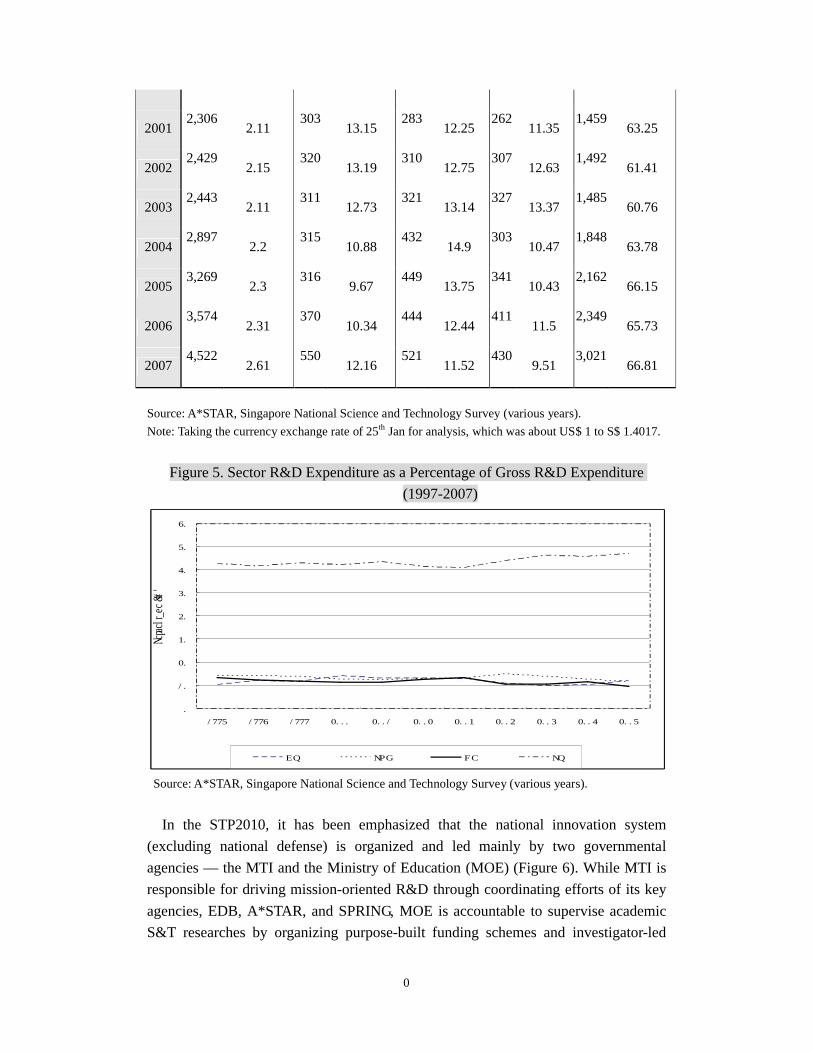
0
20012,306
2.11303
13.15283
12.25262
11.351,459
63.25
20022,429
2.15320
13.19310
12.75307
12.631,492
61.41
20032,443
2.11311
12.73321
13.14327
13.371,485
60.76
20042,897
2.2315
10.88432
14.9303
10.471,848
63.78
20053,269
2.3316
9.67449
13.75341
10.432,162
66.15
20063,574
2.31370
10.34444
12.44411
11.52,349
65.73
20074,522
2.61550
12.16521
11.52430
9.513,021
66.81
Source: A*STAR, Singapore National Science and Technology Survey (various years).
Note: Taking the currency exchange rate of 25th Jan for analysis, which was about US$ 1 to S$ 1.4017.
Figure 5. Sector R&D Expenditure as a Percentage of Gross R&D Expenditure
(1997-2007)
0
10
20
30
40
50
60
70
80
1997 1998 1999 2000 2001 2002 2003 2004 2005 2006 2007
Percentage (%)
GS PRI HE PS
Source: A*STAR, Singapore National Science and Technology Survey (various years).
In the STP2010, it has been emphasized that the national innovation system
(excluding national defense) is organized and led mainly by two governmental
agencies — the MTI and the Ministry of Education (MOE) (Figure 6). While MTI is
responsible for driving mission-oriented R&D through coordinating efforts of its key
agencies, EDB, A*STAR, and SPRING, MOE is accountable to supervise academic
S&T researches by organizing purpose-built funding schemes and investigator-led

0
researches through expanding the function of Academic Research Fund (AcRF) on
top of funding university basic research. These investigator-led researches are
attached with an ensured level of funding from AcRF over a reasonable period in
order to attract world-class researchers to work in Singapore, generating a fertile
environment for seeding new ideas and achieving breakthroughs in innovation. The
universities are expected to continue supporting faculty-led internal or externally
collaborative researches, especially on the selected scientific areas that have medium-
to long-term strategic interests of Singapore.
From 2000 to 2007, Singapore has successfully awarded with 3200 US patents. A
considerable portion of this achievement comes from HEIs and public research
institutes. To further promote research engagement of academic faculty, NRF
launched the National Framework for Innovation and Enterprise to provide
proof-of-concept grants of up to S$250,000 to HEIs (Vedam et al., 2009). Other HEIs
like the polytechnics are assigned to focus on researches with more developmental
nature that could strengthen the nexus between R&D and business through joint
projects with industry and local enterprises. There are also translational R&D grants
designated to support translational research performed by polytechnics to bring
research breakthroughs to the market place. In addition, NRF provides innovation
vouchers to SMEs as incentives for collaboration with HEIs’ R&D. Under the
STP2010, universities with enhanced research capacities would become the lead
partners of public research projects; on the other hand, polytechnics will play a
significant role in strengthening R&D more likely in the private sector and uplifting
technological and manpower capabilities in Singapore.
Figure 6: Singapore National R&D Framework

0
Source: MTI, Singapore Science and Technology 2010 Plan (STP2010).
Japan
The first Japanese white paper on S&T, The State of Our Country’s Industrial
Technology, was issued in 1949 right after the World War II, yet at that time,
university-industry research collaboration was very much limited because universities
were national in nature and therefore professors were civil servants, who could not
receive much private benefits out of the collaboration with the industrial sector. While
Japan has continuously trying to steer university-industry collaborations since then, it
was until the 1990s that this effort became forceful and consistent, concomitant with
the trend of changing university governance.
Like other selected cases in this study, Japan is also aspiring to create top-tier
universities. In 2002, the Center of Excellence (COE) programs were launched,
including specific programs such as the 21st Century COE Program, Global COE
Program and Super COE Program. In 2007, the World Premier International
Research Center Initiative was launched, which has chosen four former imperial
universities, namely the Tohuku, Tokyo, Kyoto and Osaka Universities, as well as the
National Institute for Materials Science, as the key research centers that are worth
nurturing (Kitagawa, 2009: 6-7). These universities are given more resources for

0
research development that help boost Japan’s competitiveness.
To remove barriers and build up platform for university-industry collaborations, a
number of legislations were passed since 1990s. The Technology Licensing Offices
Act was passed in 1998 to authorize the establishment of technology licensing offices
in universities. In 1999, the Law of Special Measures for Industrial Revitalization was
introduced to facilitate the issue of intellectual property rights. In 2000, the Law to
Strengthen Industrial Technology Capability was passed to legalize compensated
consulting of university faculty. The National Public Service Law was also passed in
2000 to allow university research staff to take up management positions in university
start-ups. All these policies were aimed to relaxing the restrictions and providing
incentives for universities and their staffs to participate in research ties with the
industry. Moreover, in 2003, MEXT began to establish Intellectual Property Centers at
universities to facilitate the use of intellectual properties.
Apart from these, another major push factor was the passing of the National
University Corporation Law in 2004 to incorporate national university into a
semi-independent entity, offering universities autonomy in the commercialization of
research outputs and the recruitment of S&T research talents (Yamamoto, 2004). As a
result, “the number of research collaboration between national universities and
industries has risen from 1,139 in 1990 to 4,029 in 2000 and to 6,767 in 2002. Besides,
the number of starts-ups based on university-invented technologies increased from 11
in 1995 to 135 in 2000” (Odagiri, 2006). Also, in 2006, the government decided to
reduce the operating grants of all the National University Corporation by 1% each
year, propelling universities to search for more external resources.
The Japanese government actively seeks ways to promote university-industry
collaboration with the coordination among different governmental departments, e.g.
between MEXT and METI (Ministry of Economy, Trade and Industry).34 Moreover,
intending to explore emerging fields of innovation apart from natural science and
engineering, MEXT set up the “Program for Practical Human Resource Development
by Industry-Academia Cooperation-Service Innovation Human Resource
Development” to promote “service science”, which studies the ways to innovate and
better the service sector (White paper 2008: 81-82). A number of leading universities
have participated in the program (see Table 61).
34 For example, the METI launched the Hiranuma Plan in 2001 to advance university-industry research collaborations with the goal of establishing about a thousand university-based start-ups in the following three years.
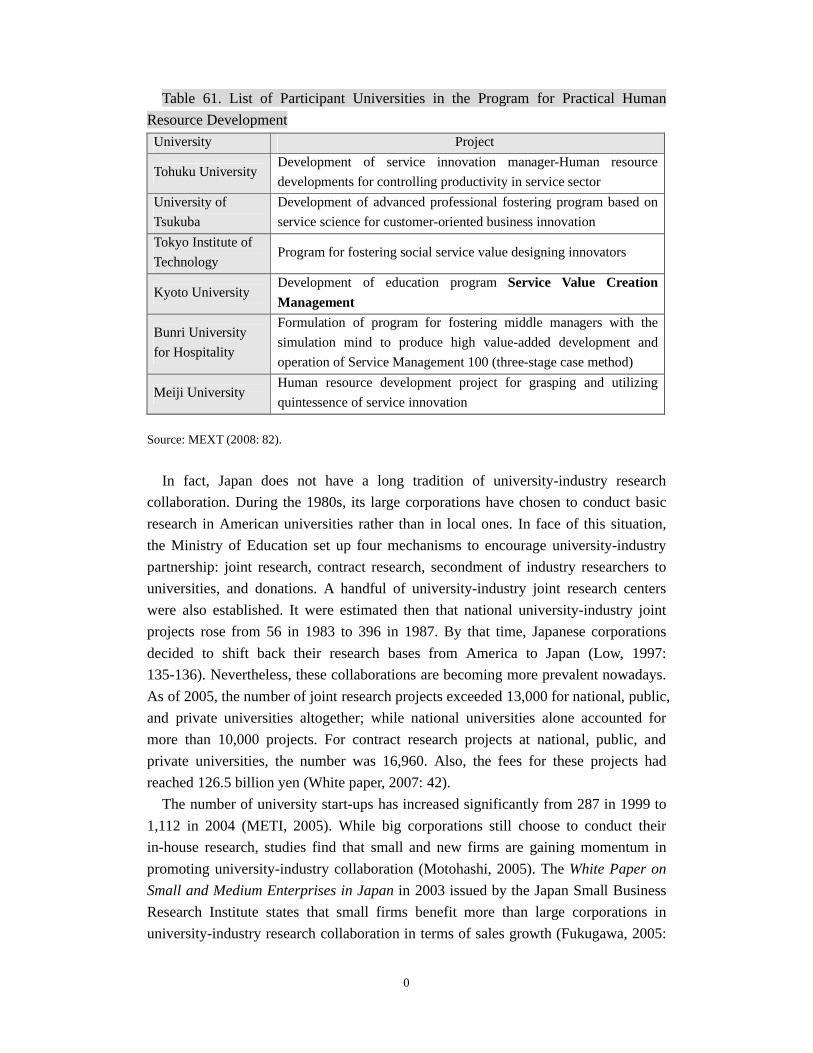
0
Table 61. List of Participant Universities in the Program for Practical Human
Resource Development
University Project
Tohuku UniversityDevelopment of service innovation manager-Human resource
developments for controlling productivity in service sector
University of
Tsukuba
Development of advanced professional fostering program based on
service science for customer-oriented business innovation
Tokyo Institute of
TechnologyProgram for fostering social service value designing innovators
Kyoto UniversityDevelopment of education program Service Value Creation
Management
Bunri University
for Hospitality
Formulation of program for fostering middle managers with the
simulation mind to produce high value-added development and
operation of Service Management 100 (three-stage case method)
Meiji UniversityHuman resource development project for grasping and utilizing
quintessence of service innovation
Source: MEXT (2008: 82).
In fact, Japan does not have a long tradition of university-industry research
collaboration. During the 1980s, its large corporations have chosen to conduct basic
research in American universities rather than in local ones. In face of this situation,
the Ministry of Education set up four mechanisms to encourage university-industry
partnership: joint research, contract research, secondment of industry researchers to
universities, and donations. A handful of university-industry joint research centers
were also established. It were estimated then that national university-industry joint
projects rose from 56 in 1983 to 396 in 1987. By that time, Japanese corporations
decided to shift back their research bases from America to Japan (Low, 1997:
135-136). Nevertheless, these collaborations are becoming more prevalent nowadays.
As of 2005, the number of joint research projects exceeded 13,000 for national, public,
and private universities altogether; while national universities alone accounted for
more than 10,000 projects. For contract research projects at national, public, and
private universities, the number was 16,960. Also, the fees for these projects had
reached 126.5 billion yen (White paper, 2007: 42).
The number of university start-ups has increased significantly from 287 in 1999 to
1,112 in 2004 (METI, 2005). While big corporations still choose to conduct their
in-house research, studies find that small and new firms are gaining momentum in
promoting university-industry collaboration (Motohashi, 2005). The White Paper on
Small and Medium Enterprises in Japan in 2003 issued by the Japan Small Business
Research Institute states that small firms benefit more than large corporations in
university-industry research collaboration in terms of sales growth (Fukugawa, 2005:
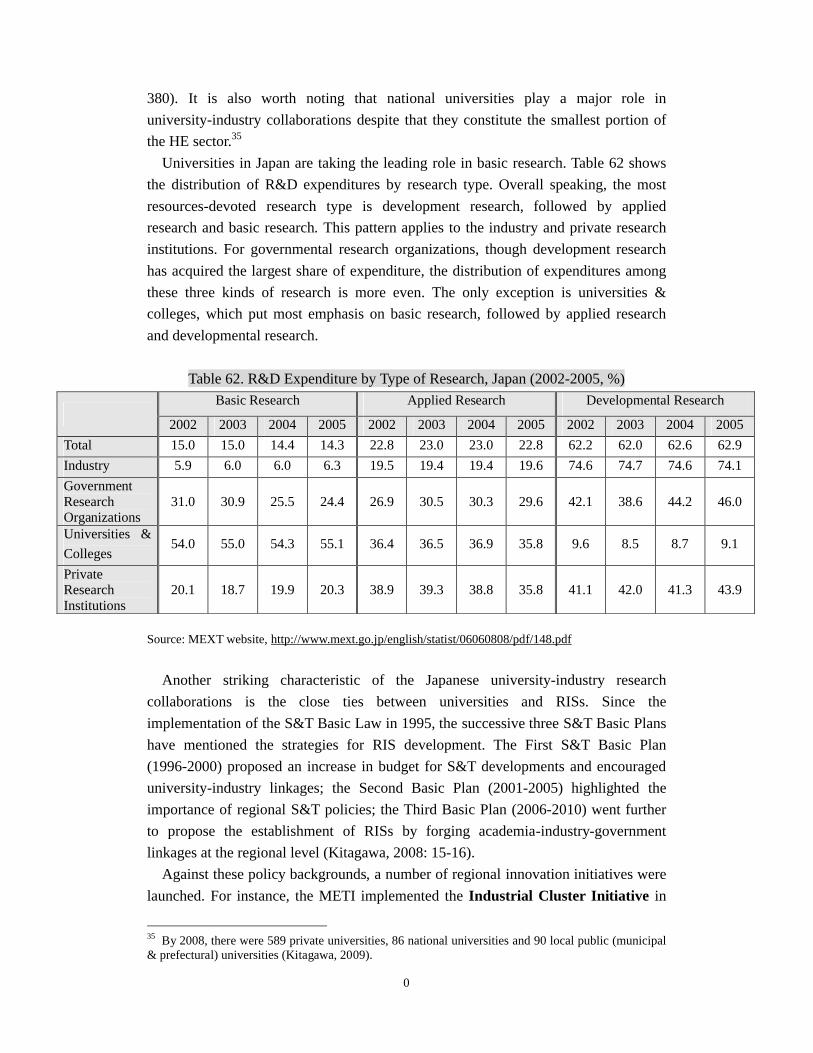
0
380). It is also worth noting that national universities play a major role in
university-industry collaborations despite that they constitute the smallest portion of
the HE sector.35
Universities in Japan are taking the leading role in basic research. Table 62 shows
the distribution of R&D expenditures by research type. Overall speaking, the most
resources-devoted research type is development research, followed by applied
research and basic research. This pattern applies to the industry and private research
institutions. For governmental research organizations, though development research
has acquired the largest share of expenditure, the distribution of expenditures among
these three kinds of research is more even. The only exception is universities &
colleges, which put most emphasis on basic research, followed by applied research
and developmental research.
Table 62. R&D Expenditure by Type of Research, Japan (2002-2005, %)
Basic Research Applied Research Developmental Research
2002 2003 2004 2005 2002 2003 2004 2005 2002 2003 2004 2005
Total 15.0 15.0 14.4 14.3 22.8 23.0 23.0 22.8 62.2 62.0 62.6 62.9
Industry 5.9 6.0 6.0 6.3 19.5 19.4 19.4 19.6 74.6 74.7 74.6 74.1
Government Research Organizations
31.0 30.9 25.5 24.4 26.9 30.5 30.3 29.6 42.1 38.6 44.2 46.0
Universities &
Colleges54.0 55.0 54.3 55.1 36.4 36.5 36.9 35.8 9.6 8.5 8.7 9.1
Private Research Institutions
20.1 18.7 19.9 20.3 38.9 39.3 38.8 35.8 41.1 42.0 41.3 43.9
Source: MEXT website, http://www.mext.go.jp/english/statist/06060808/pdf/148.pdf
Another striking characteristic of the Japanese university-industry research
collaborations is the close ties between universities and RISs. Since the
implementation of the S&T Basic Law in 1995, the successive three S&T Basic Plans
have mentioned the strategies for RIS development. The First S&T Basic Plan
(1996-2000) proposed an increase in budget for S&T developments and encouraged
university-industry linkages; the Second Basic Plan (2001-2005) highlighted the
importance of regional S&T policies; the Third Basic Plan (2006-2010) went further
to propose the establishment of RISs by forging academia-industry-government
linkages at the regional level (Kitagawa, 2008: 15-16).
Against these policy backgrounds, a number of regional innovation initiatives were
launched. For instance, the METI implemented the Industrial Cluster Initiative in
35 By 2008, there were 589 private universities, 86 national universities and 90 local public (municipal & prefectural) universities (Kitagawa, 2009).

0
2001. Based on a business approach, this Initiative “aims at revitalizing regional
economies and promoting industrial accumulation through promoting networks
between industry, university and public research institutes…” (Kitagawa and Woolgar,
2008: 59). Under the Industrial Cluster Initiative, the “Technology Advanced
Metropolitan Area” (TAMA) in the Tokyo Metropolitan Area is a successful example
of using university-industry linkages as an intermediary player in product
development and patent application of SMEs (Kodama, 2008). Similarly, the MEXT
launched the Knowledge Cluster Initiative in 2002. Adopting an “academic
approach”, this Initiative “aims to construct a ‘regional system of technological
innovation’, based on industry–university–government collaboration by forming
networks of Center of Excellence in regions” (Kitagawa & Woolgar, 2008: 59). These
programs reflect not only a growing trend of university–industry collaborations at the
regional level, but also a shift of governance on research from centralization towards
decentralization.
Assessing the Role of Higher Education in Innovation PromotionComparing and contrasting the role of the university in innovation promotion
between the Asian universities with their counterparts in Europe and North America,
we have noted that the university sector in Asia has not played a very important role
(refer to Figure 3). As discussed earlier, the relatively late participation of the
university in Asia in innovation promotion is closely related to the unique
socio-political and socio-economic contexts, especially due to being late comers in
joining the enterprise in developing higher education, research and development, and
promotion of technology and innovation. As we have highlighted in the previous
section, Asian universities are now under far more pressure to move beyond their
comfort zone in questing for becoming entrepreneurial universities. Such a
development has been clearly revealed by the increasing involvement of the
university sector in collaboration with the industry in innovation promotion and
technological advancement. But it would take a while for Asian universities to
establish themselves as enterprise universities to engage in the third mission of
university by playing a more active role in economic and social development.
As for the case of Hong Kong, as Baark & Sharif (2006) rightly point out, the past
mistake of its innovation policy was that it had wrongly envisaged technological
development in a linear process: from upstream scientific research by universities to
downstream commercialization process by enterprises. In this vein, the Hong Kong
government asserted its role simply as infrastructure builder and funding provider,
hoping that once these needs are satisfied, technological development could be
achieved by research institutions and product firms. Nevertheless, since the 1990s,
Hong Kong’s NIS has become “a more interactive and dynamic trilateral
government-industry-academia NIS mode” (ibid: 383). More government’s

0
participation has been devoted throughout the whole process rather than just
jumpstarting the process at the very outset. Recent development of its innovation
system also highlights that in future, Hong Kong may needs to pay more attention to
its regional integration with China.
In Taiwan’s innovation system, the government, universities and the industry are
interacting very closely and dynamically. As Mathews & Hu (2007: 1017-1018)
rightly note that “while university R&D in the advanced countries plays a role of
linking a country’s innovation infrastructure and industrial cluster, the impact of
academic R&D in the latecomer country like Taiwan is shifting from building the
national innovation infrastructure (i.e. training the well-educated manpower or help
targeting on high-tech industrial clusters) in the earlier years to now acting as a
knowledge platform to link innovation infrastructure and industrial clusters (through
technology licensing and incubation centers) beginning in the 2000s”. Overall,
Taiwan has transformed itself from a “fast followership” in the 1970s to an
“innovation-led fast followership”. Yet from all the related activities and efforts, we
can still find the very visible hands of the government.
The bipolar economic structure of the Korean economy — strong large firms on the
one end and weak small firms on the other (Lim, 2008: 149) — is clearly reflected in
its innovation system. Industrial enterprises, especially the Chaebols, are the driving
force of innovation, followed by government-funded research institutes. While
universities are gaining momentum in R&D by partnering with SMEs and are exerting
their impacts in building up regional innovation systems, the university-industry
research collaborations are limited with the lack of government funding for
universities. It is then anticipated that the future development of South Korean NIS
depends on whether the government will increase its support for universities and
SMEs as well as the cooperation between them.
Singapore may well be the most proactive case to present in terms of innovation
system reform. To maintain its attractiveness as a place for business of the future,
Singapore has determinedly switched its developmental focus from a large
manufacturing base for MNCs to a dynamic innovation hub that supports high-tech
manufacturing and R&D. During this process, the HE sector has been turned to
perform a more meaningful role in improving its NIS, particularly through fostering
entrepreneurial mindset among young Singaporeans and increasing technology
transfer to the industrial sector. As a result, Singapore has demonstrated progress in
innovative activities such as patenting, and the revenue from commercializing high
technology increased since the 1990s. As shown in the above Table 62, its
university-industry R&D collaboration has been remarkably ranked as the fourth in
the world recently. By far, the reward from S&T development in Singapore is really
impressive.
And finally, in Japan, there are also plenty of rooms for its HE sector to involve
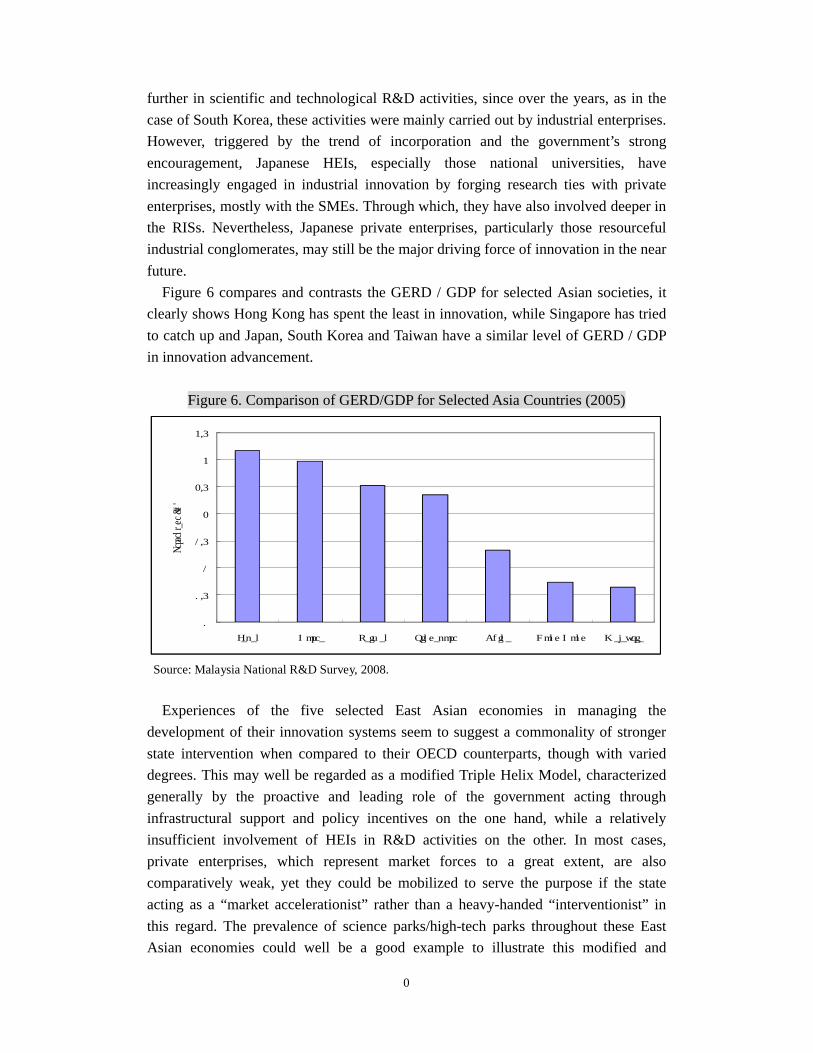
0
further in scientific and technological R&D activities, since over the years, as in the
case of South Korea, these activities were mainly carried out by industrial enterprises.
However, triggered by the trend of incorporation and the government’s strong
encouragement, Japanese HEIs, especially those national universities, have
increasingly engaged in industrial innovation by forging research ties with private
enterprises, mostly with the SMEs. Through which, they have also involved deeper in
the RISs. Nevertheless, Japanese private enterprises, particularly those resourceful
industrial conglomerates, may still be the major driving force of innovation in the near
future.
Figure 6 compares and contrasts the GERD / GDP for selected Asian societies, it
clearly shows Hong Kong has spent the least in innovation, while Singapore has tried
to catch up and Japan, South Korea and Taiwan have a similar level of GERD / GDP
in innovation advancement.
Figure 6. Comparison of GERD/GDP for Selected Asia Countries (2005)
0
0.5
1
1.5
2
2.5
3
3.5
Japan Korea Taiwan Singapore China Hong Kong Malaysia
Percentage (%)
Source: Malaysia National R&D Survey, 2008.
Experiences of the five selected East Asian economies in managing the
development of their innovation systems seem to suggest a commonality of stronger
state intervention when compared to their OECD counterparts, though with varied
degrees. This may well be regarded as a modified Triple Helix Model, characterized
generally by the proactive and leading role of the government acting through
infrastructural support and policy incentives on the one hand, while a relatively
insufficient involvement of HEIs in R&D activities on the other. In most cases,
private enterprises, which represent market forces to a great extent, are also
comparatively weak, yet they could be mobilized to serve the purpose if the state
acting as a “market accelerationist” rather than a heavy-handed “interventionist” in
this regard. The prevalence of science parks/high-tech parks throughout these East
Asian economies could well be a good example to illustrate this modified and

0
featured government-industry-academia collaboration.
Thus paradoxically, a strong ingredient of state intervention seems to be part of the
success formula in developing a NIS which is supposed to foster innovation in a free
environment with least intervention. As hinted in the above Tables 26 and 27, albeit it
is too early to draw any conclusion, the more proactive and effective (in terms of the
state’s muscle), Taiwan and Singapore governments have managed to secure a better
progress in the ranking of the Knowledge Economy Index from 1995 to 2009;
whereas the less aggressive Hong Kong, South Korean and Japanese governments
could barely maintain their previous rankings. The above comparative study has
clearly shown the strengths and weaknesses of the existing NIS, especially after a
critical analysis of the role of the university in innovation promotion. The strengths of
the existing model are related to the positive role of the state in steering innovation
promotion, research and development. The recent ranking among these selected Asian
societies again shows the determination of their governments in promoting innovation.
The success of Singapore and Taiwan in maintaining their global ranking is closely
related to the continual support of the state in promoting university-industry
collaborations, especially these two Asian states have made additional efforts in
investing in firms or universities for promoting innovation and entrepreneurial
approach in research and development.
All the systems under review have indicated that the role of the state is extremely
important for strategic development of the NIS. But equally important, the reduction
of the state role in the context of the growing influence of neo-liberalism and the drive
to make universities more entrepreneurial has considerably weakened the significant
role of the state in driving the agenda for innovation advancement. Although the role
of the firms / industries are becoming more important in directing innovation and
research development, the capacity of firms in sustaining innovation and research
development is rendered problematic especially when the global economic
environment is getting unstable and being difficult for prediction. The fluctuation in
the global market place would certainly affect the financial ability of the industry in
investing in research and development and promotion of innovation. Our above
comparison has clearly shown the innovation promotion in South Korea, Taiwan,
Japan and Hong Kong are more firm-led, with the exception of Singapore having a
more state-led model. The uncertainty in the global economic environment would
certainly affect the way that the industry could perform in innovation advancement.
After examining the role of the university in advancing innovation of the selected
societies, it is clear that the university sector is getting more involved in promoting
innovation and they now become more engaged with the industry in research
development and innovation advancement. Nonetheless, the university in Asia could
play an even more important role in engaging with the industry or the business in
research development and innovation advancement. Despite the fact that the Asian

0
governments have tried to reduce their role in financing the university sector to
engage in collaboration the industry, they should have invested more in universities to
set out a more encouraging environment / productive framework for inducing
universities for moving beyond their ‘comfort zone’ to work with the industry / firms /
NGOs.
Overall speaking, what is revealed in this study is that, despite the different starting
points and different formation processes of NISs of the five selected countries / cities,
they all intend to move toward a more complete and balanced Triple-Helix
mechanism, hoping that each stakeholder can perform to its greatest strength and that
the three stakeholders can be more integrated and connected. Yet the government
remains a very important role in the process, if not dominant. It needs to be an
initiator at the outset and a facilitator and collaborator in-between and the promoter
and regulatory in the end.
Policy Recommendations and Good Practices Identified
Our above comparative analysis of national innovation systems and the
examination of the role of the university in promoting innovation has clearly indicated
that policy challenges and responses may differ significantly among countries /
societies, depending on their histories, size and level of development, their industrial,
scientific and technological specialization, as well as their institutional structure,
which affects domestic patterns of knowledge interactions and innovation
advancement. Traditionally, governments have intervened in the technology arena to
address market failures, such practices are common in the OECD countries especially
when firms under-invest in R & D because of the existence of spillovers that limit
their ability to fully appropriate returns or due to the uncertainty associated with
innovation.
1) Important Role of the Government
Being relatively ‘late-comers’ in developing innovation and R & D related work,
governments in Asia have taken more interventionist role in promoting innovation,
technology and development. But once the infrastructure has been set up with more
involvement of the industrial and business sectors, the role of the government is
beginning to reduce. But we must be aware that the global economic environment is
highly unstable, the governments in Asia should play a more active role to address
systemic failures which may block the functioning of the innovation system, hinder
the flow of knowledge and technology and, subsequently, reduce the overall
efficiency of national R & D efforts. In this connection, governments need to play an
integrating role in managing knowledge on an economy-wide basis by making
technology and innovation policy an integral part of overall economic policy.
0
Identifying good practices from the OECD countries in terms of their policy and
strategy in promoting innovation, Asian governments need to refocus specific
objectives and adapt the instruments of technology and innovation. In addition, they
should also secure framework conditions that are conducive to innovation. Reform
measures must be introduced to reform the existing regulatory frameworks which
would help lessen administrative burdens and institutional rigidities, developing
sound financial and fiscal policies to ease the flow of capital to small firms in engage
them in innovation advancement.
2) Fostering New Partnerships, Networking and Clustering
In response to the rise of diversified sectors / stakeholders in innovation advancement,
there is a strong need to search for new approaches or institutional arrangements to
facilitate the partnerships between the various sectors like the government, university,
industry and business, as well as other forms of organizations in promoting innovation,
technology and development. Since many science and technology policies in the
selected Asian societies are still developing, with insufficient attention given to
fostering interactions and spillovers at national and international levels, the
governments in Asia would need to devote more attention to develop policies /
frameworks which would foster closer partnerships between the various sectors in
promoting innovation. International comparisons show the growing importance of
interactions within networks of firms and knowledge-based organizations in
advancing innovation. The experiences of our OECD counterparts have clearly
suggested the importance to promote networking and clustering because of the
growing trends of more networked business and innovation interactions. These
networks also reflect the increasing interdisciplinarity that is at the core of today’s
technical change. In view of the success story of the OECD countries, Asian societies
should take strategic research and technology development alliances among firms and
universities very seriously since such deep collaborations would further advance
innovation, research and development. In order to promote these strategic alliances,
governments in Asia should remove unnecessary barriers to cooperation and alliances,
as well as formation of networks.
3) Building an Innovation Culture
Despite the fact that more awareness of the importance of innovation and creativity
has been found among the selected Asian societies / countries in recent years, the
education systems still place much emphasis on public examination and academic
results rather than rewarding people with innovation and creativity systematically.
There is a strong need for Asian societies to create favourable framework conditions
for business, research and education to encourage innovation and creativity.
Governments in Asia can extend the scope of technology diffusion programmes to

0
include elements that promote firm-level capabilities for identifying, accessing and
incorporating new knowledge and techniques, while universities would reform their
admissions and rewards systems in encouraging talents of different kinds to be
admitted / rewarded by their performance in advancing innovation.
4) Reforming Education and Promoting Knowledge Transfer
With a strong conviction to promote innovation, governments in Asia must encourage
human as well as institutional linkages through reforming the university curricula by
emphasizing multidisciplinary research, teaching and learning and promoting lifelong
learning. Education reforms should focus on new skill requirements such as working
in teams, maintaining interpersonal relationships, communicating effectively,
networking and adapting to change. Universities also need to promote knowledge
transfer by encouraging their faculty members to move beyond their conventional
missions focused on research and teaching to service, advancing innovation and
technology.
5) New Policy for Leveraging Research and Development
In order to sustain the efforts in promoting innovation, new approaches are needed
which provide private initiative greater scope and more incentives and which are less
dependent on direct government financial support. Since the stagnation of research
spending may have implications for long-term innovative capacity in some economies,
government must respond by preventing under-investment in research and innovation.
Market-led innovative processes should rest on a sound knowledge base, which is
found primarily in the science system, which is the scientific research performed in
academic and public research institutions that are largely supported by the state. In
order to stabilize the ‘infrastructure of research’, governments in Asia need to provide
sufficient funding to sustain research activities conducted by universities and public
research institutions on the one hand. On the other hand, governments in Asia should
also encourage commercialization since innovators and society will also gain from
greater commercialization of research, including through patents, licenses and spin-off
firms. Experiences elsewhere like the USA and other European countries show that
royalties and licensing fees from patents and technology can yield significant income.
An emphasis on commercialization also helps move technology into the marketplace.
Governments in Asia should develop policy frameworks which could foster
commercialization and high-technology start-ups require institutional flexibility and
appropriate intellectual property rights rules and other regulations.
In addition to the policy recommendations outlined above, the present
comparative study has identified a few good practices that other developing countries
may find useful when developing their research and development, and advancing

0
innovation and technology.
1. Investment in Higher Education: all the five selected Asian economies under
review has clearly suggested the significant role of higher education in
nurturing talents for further research and development and the advancement of
innovation. The access to higher education and the assurance of higher
education quality has laid a very solid foundation for the promotion of
innovation in these Asian economies.
2. The Steering Role of the State: the developmental state role that the Asian
states have adopted in driving their economic growth still functions well in the
promotion of research and development and advancement of innovation.
Unlike their US counterparts, these Asian states have made serious attempts to
steer the development of R & D, such a strategic role has proved to be very
effective in shaping the policies and measures in promotion of innovation in
these economies.
3. The Interactions between the Industry and the University: the present
comparative study has clearly indicated an emerging trend of more
interactions between the industry and the business in promoting innovation,
research and development. Despite the fact that the government does perform
a very important role during the inception phase of R & D, the inter university
and industry collaborations would become increasingly important especially
beyond the inception stage. But the government should act as a facilitator or
enabler to drive the university and the industry to engage in deep
collaborations.
4. Preferential Policies and Incentives in Innovation Promotion: the present
comparative study has also discovered the important function that preferential
policies and incentive schemes in promoting innovation, especially when the
industry / business is given tax exemption or special loan schemes in fostering
a culture of research and development. More importantly, these Asian
governments have to regularly review their policies and regulatory
frameworks to ensure their systems / measures are conductive to sustain the
deep collaborations between the industry and the university sector.
Conclusion
This report has reviewed the most recent developments of innovation, research and
development in seven Asian societies through a critical review of the government

0
policies in relation to promotion of innovation. Against a highly competitive world, a
growing number of Asian countries have started promoting innovation by
strengthening the collaborations between the business, industry and university sectors.
This report has indicated that the selected Asian societies under review have engaged
more proactively in the promotion of innovation, research and development in order
to enhance their global competitiveness. This report also critically examines recent
strategies adopted by the selected Asian societies in reforming their higher education
systems in fostering closer links with the industry and business sector in promotion of
innovation. Our comparative study has shown the selected Asian societies have
experienced different stages of development and different models in terms of
promotion of innovation, research and development. But one area common to all
selected Asian countries is that all these societies under review have taken the
promotion of creativity and innovation more serious and the relationship between
higher education institutions, the business and the industrial sectors is becoming
increasingly closer in the promotion of innovation in the globalizing economy
context.
References
Ace, Z. J. & Stough, R.R. 2008. “Introduction to Public Policy in an Entrepreneurial
Society”, in Ace, Z.J. & Stough, R.R. (eds.), Public Policy in an Entrepreneurial
Society: Creating the Conditions for Business Growth. New York: Springer.
Altbach, P. & Levy, D. 2005. Private Higher Education: A Global Revolution. Boston:
Sense Publishers.
Andersson, T. & Dahlman, C.J. 2001. Korea and the Knowledge-Based Economy:
Making the Transition, Washington, D.C.: World Bank Publications.
Apple, K.S. 2008. “Evaluating University Technology Transfer Offices”, in Ace, Z.J.
& Stough, R.R. (eds.), Public Policy in an Entrepreneurial Society: Creating the
Conditions for Business Growth. New York: Springer.
Asher, M. & Newman, D. 2001. “Hong Kong and Singapore: Two Approaches to the
Provision of Pensions in Asia”, Journal of Pensions Management, 7(2): 155-66.
Audretsch, D.B. 2007. The Entrepreneurial Society. Oxford: Oxford University Press.
Baark, Erik & Naubahar Sharif. 2006. “Hong Kong’s Innovation System in Transition:
Challenges of Regional Integration and Promotion of High Technology”, in Lundvall,
0
Bengt-Ake, Patarapong Intarakumnerd & Jan Wang (eds.), Asia’s Innovation Systems
in Transition, pp. 123-147. Northampton, MA: Edward Elgar.
Baark, Erik & Alvin Y. So. 2006. “The Political Economy of Hong Kong’s Quest for
High Technology Innovation”, Journal of Contemporary Asia, 36(1): 102-120.
Bray, M. 1997. “Education and Colonial Transition: The Hong Kong Experience in
Comparative Perspective”, in Bray, M. & Lee, W.O. (eds.), Education and Political
Transition: Implications of Hong Kong’s Change of Sovereignty. Hong Kong:
Comparative Education Research Centre, The University of Hong Kong.
Bray, M. & Bunly, S. 2005. Balancing the Books: Household Financing of Basic
Education in Cambodia. Hong Kong: Comparative Education Research Centre, The
University of Hong Kong and Human Development Unit, East Asia & Pacific Region,
The World Bank.
Bray, M. & Lee, W.O. (eds.). 2001. Education and Political Transition: Implications
of Hong Kong’s Change of Sovereignty (2nd edition). Hong Kong: Comparative
Education Research Centre, The University of Hong Kong.
Bray, M. & Thomas, R. (eds.). 1998. Financing of Education in Indonesia. Manila:
Asian Development Bank and Hong Kong: Comparative Education Research Centre,
The University of Hong Kong.
Chan, D. & Lo, W. 2007. “Running Universities as Enterprises: University
Governance Changes in Hong Kong”, Asia Pacific Journal of Education, 27(3):
305-322.
Cao, C. 2004. “Zhongguancun and China’s High-tech Parks in Transition: ‘Growing
Gains’ or ‘Premature Senility?’”, Asian Survey, 46(5).
Cao, Y., Zhao, L. & Chen, R. 2009. “Institutional Structure and Incentives of
Technology Transfer: Some New Evidence from Chinese Universities”, Journal of
Technology Management, 4(1): 67-84.
Chan, K.F. & Theresa Lau. 2005. “Assessing Technology Incubator Programs in the
Science Park: The Good, the Bad and the Ugly”, Technovation, 25: 1215-1228.
Chang, Pao-Long & Hsin-Yu Shih. 2004. “The Innovation Systems of Taiwan and
China: A Comparative Analysis”, Technovation, 24: 529-539.

0
Chen, K. & Kenney, M. 2007. “Universities/Research Institutes and Regional
Innovation Systems: The Cases of Beijing and Shenzhen”, World Development, 35(6):
1056-1074.
Chen, Shin-Horng. 1997. “Decision-making in Research and Development
Collaboration”, Research Policy, 26(1): 121-135.
Cheng, Tun-Jen. 2001. “Transforming Taiwan’s Economic Structure in the 20th
Century”, The China Quarterly, 165: 19-36.
Drahos, P. & Jospeh, R. 1995. “The Telecommunications and Investment in the Great
Supranational Regulatory Game”, Telecommunications Policy, 188: 619-35.
Edgington, David W. 2008. “The Japanese Innovation System: University-Industry
Linkages, Small Firms and Regional Technology Clusters”, Prometheus, 26(1): 1-19.
Eun, J. H., Lee, K. & Wu, G. 2006. “Explaining the ‘University-run Enterprises’ in
China: A Theoretical Framework for University-Industry Relationship in Developing
Countries and its Application to China”, Research Policy, 35: 1329-1346.
Executive Yuen, Republic of China. 1998. Action Plan for Building a Technologically
Advanced Nation. http://web1.nsc.gov.tw/public/data/4714107571.htm.
Fan, Selina. 2007. “Tsing Hua University’s Innovation Incubator Rated as Excellent”,
Building Industries from Creative Ideas, Small and Medium Enterprise
Administration, Ministry of Economic Affairs, Republic of China, pp.16-19.
Fukugawa, Nobuya. 2005. “Characteristics of Knowledge Interactions between
Universities and Small Firms in Japan”, International Small Business Journal, 23:
379-401.
Fuller, Douglas B. 2005. “The Changing Limits and the Limits of Change: The State,
Private Firms, International Industry and China in the Evolution of Taiwan’s
Electronics Industry”, Journal of Contemporary China, 14(44): 483-506.
Gill, S. 1995. “Globalization, Market Civilization and Disciplinary Neoliberalism”,
Millennium, 24(3): 399-423.
Goh, A.L.S. 2005. “Promoting Innovation in Aid of Industrial Development: the

0
Singaporean Experience”, International Journal of Public Sector Management, 18(3):
216-240.
Gopinathan, S. 2001. “Globalization, the State and Education Policy in Singapore”, in
Bray, M. & Lee, W.O. (eds.), Education and Political Transition: Implications of
Hong Kong’s Change of Sovereignty. Hong Kong: Comparative Education Research
Centre, The University of Hong Kong.
Government of Malaysia [GOM]. 2006. The Ninth Malaysian Plan 2006 - 2010.
Putrajaya: Author.
Hashim, Z., Jamaludin, Z. & Yaacob, M. 2009. “Promoting R&D and
Commercialization Efforts: Implications for Malaysia’s Higher Education Sector”,
Journal of the World Universities Forum, 2(5): 91-99.
Hemmert, Martin, Hiroyuki Okamuro, Ludwig Bstieler & Klaus Ruth. 2008. “An
Inquiry into the Status and Nature of University-Industry Research Collaborations in
Japan and Korea”, Hitotsubashi Journal of Economics, 49: 163-180.
Hong Kong Design Centre & Asia Case Research Centre, the University of Hong
Kong. 2008. From Creative Industries to Creative Economy: The Role of Education,
http://www.hkdesigncentre.org/download/news/The_Role_of_Education_full_report.p
df.
Hong Kong Information Services Department. 2009. Three-year Action Plan on
Shenzhen/Hong Kong Co-operation in Innovation and Technology.
http://www.info.gov.hk/gia/general/200903/31/P200903300269.htm.
Hong Kong SAR Government. 2008. The 2008-09 Budget.
Hong Kong SAR Government. 2008. The 2008-09 Policy Address.
Hong Kong SAR Government. 2009. The 2009-10 Budget.
Hong Kong SAR Government. 2009. The 2009-10 Policy Address.
Hsu, Chiung-Wen & Hueh-Chiao Chiang. 2001. “The Government Strategy for the
Upgrading of Industrial Technology in Taiwan”, Technovation, 21(2): 123-132.
Hu, Mei-Chih & Mathews, John A. 2005. “Innovative Capacity in East Asia”,

0
Research Policy, 34: 1322-1349.
Hu, Mei-Chih & Mathews, John A. 2008. “China’s National Innovative Capacity”,
Research Policy, 37: 1465-1479.
Hu, Mei-Chih & Mathews, John A. 2009. “Estimating the Innovation Effects of
University-industry-government Linkages: The Case of Taiwan”, Journal of
Management & Organization, 15: 138-154.
Innovation and Technology Commission, HKSAR. 2007. A Consultation Paper on the
Proposed Relaxation Measures of University Industry Collaboration Programme
under the Innovation and Technology Fund, October 2007.
Jessop, Bob & Ngai-Lung Sum. 2000. “An Entrepreneurial City in Action: Hong
Kong’s Emerging Strategies in and for (Inter) Urban Competition”, Urban Studies,
37(12): 2287-2313.
Jiang, Juan et al. 2007. “University-Industry Links in the Japanese Context: Between
Policies and Practice”, in Yusuf, Shahid & Kaoru Nabeshima (eds), How Universities
Promote Economic Growth, pp. 139-149. Washington, D.C.: World Bank.
Jordana, J. & Levi-Faur, D. 2005. “Preface: The Making of a New Regulatory Order”,
The Annuals of the American Academy of Political and Social Science, 598 March:
1-6.
Kim, Haknoh. 2007. “Regional Innovation Policy of South Korea, Compared with,
and Learning from, the European Union”, paper to be presented at the European
Union Center of Excellence and Center for East Asian Studies, University of
Wisconsin-Madison, Friday 13th 2007.
Kim, Linsu. 1999. “Building Technological Capability for Industrialization:
Analytical Frameworks and Korea’s Experience”, Industrial and Change, 8(1):
111-136.
Kitagawa, Fumi. 2008. “Policy Reforms, New University-Industry Links and
Implications for Regional Development in Japan”, CIRCLE Electronic Working Paper
Series, Paper No. 2008/08.
Kitagawa, Fumi & Lee Woolgar. 2008. “Regionalization of Innovation Policies and
New University-Industry Links in Japan: Policy Review and New Trends”,
0
Prometheus, 26(1): 55-67.
Kodama, Toshihiro. 2008. “The Role of Intermediation and Absorptive Capacity in
Facilitating University-Industry Linkages: An Empirical Study of TAMA in Japan”,
Research Policy, 36: 1224-1240.
Koh, W.T.H. 2006. “Singapore’s Transition to Innovation-based Economic Growth:
Infrastructure, Institutions and Government’s Role”, R&D Management, 36(2):
143-160.
Kusmi, S. 2006. Enhancing Technology Transfer through University-Industry
Collaboration. Country Paper: Malaysia.
http://www.stepan.org/techtransfer/Malaysia%20CR_Sakib%20K.doc.
Le, L. 2008. “Entrepreneurship and Small Business Policies under the Presidential
Administrations of Presidents Carter, Reagan, Bush and Clinton: 1977 to 2001”, in
Ace, Z.J. & Stough, R.R. (eds.), Public Policy in an Entrepreneurial Society: Creating
the Conditions for Business Growth. New York: Springer.
Lee, H.H. 2005. “Major Issues of University Education Policy in Hong Kong”, Asia
Pacific Education Review, 6(2): 103-112.
Lee, H.H. & Gopinathan, S. 2005. “Reforming University Education in Hong Kong
and Singapore”, in Mok, K.H. & James, R. (eds.), Globalization and Higher
Education in East Asia. Singapore: Marshall Cavendish.
Lee, K.R. 2006. “Performance and Sources of Industrial Innovation in Korea’s
Innovation System”, in Lundvall, Bengt-Åke, Patarapong Intarakumnerd & Jan Vang
(eds), Asia’s Innovation Systems in Transition, Cheltenham, pp. 178-199.
Northampton, MA: Edward Elgar.
Legislative Council Panel on Commerce and Industry, HKSAR. 2007. Improvements
to the Small Entrepreneur Research Assistance Programme and the
University-Industry Collaboration Programme under the Innovation and Technology
Fund, 17 July 2007.
Legislative Council Panel on Commerce and Industry, HKSAR. 2008. Improvements
to the University-Industry Collaborative Programme under the Innovation and
Technology Fund, 15 January 2008.

0
Leung, C.K. & Wu, C.T. 1994. “Innovation Environment, R&D Linkages and
Technology Development in Hong Kong”, Regional Studies, 29(6): 533-546.
Leung, H. 2007. “Two New Lessons from the Asian Miracles”, Journal of Asia
Pacific Economy, 12(1): 1-16.
Levi-Faur, D. 1998. “The Competition State as a Neo-mercantalist State:
Understanding the Restructuring of National and Global Telecommunications”,
Journal of Socio-Economics, 27(6): 655-686.
Lim, Chaisung. 2008. “Towards Knowledge Generation with Bipolarized NSI: Korea”,
in Edquist, C. & Hommen L. (eds.), Small Country Innovation Systems: Globalization,
Change and Policy in Asia and Europe, pp. 113-155. Northampton, MA: Edward
Elgar.
Lin, Erica. 2007. “Net-cage Fish Farming Attracts Foreign Experts to Penghu”,
Building Industries from Creative Ideas, Small and Medium Enterprise
Administration, Ministry of Economic Affairs, Ministry of Economic Affairs,
Republic of China, pp.20-23.
Lo, Y.W. & Weng, F.Y. 2005. “Taiwan’s Responses to Globalization: Decentralization
and Internationalization of Higher Education”, in Mok, K.H. & James, R. (eds.),
Globalization and Higher Education in East Asia. New York & Singapore: Marshall
Cavendish Academic.
Low, Morris. 1997. “Japan: From Technology to Science Policy”, in Etzkowitz, Henry
& Loet Leydesdorff (eds), Universities and the Global Knowledge Economy: A Triple
Helix of University-Industry-Government Relations, pp. 132-140. London;
Washington: Pinter.
Lu, L. 2008. “Creating Knowledge-based Innovation in China: The Strategic
Implications of Triple Helix Model”, Journal of Technology Management, 3(3):
249-263.
Mahmood, I.P. & Jasjit Singh. 2003. ‘Technological Dynamism in Asia”, Research
Policy, 32(6): 1031-1054.
Malairaja, C. & Zawdie, G.. 2008. “Science Parks and University-Industry
Collaboration in Malaysia”, Technology Analysis & Strategic Management, 20(6):
727-739.

0
Marginson, S. & Considine, M. 2000. The Enterprise University: Power, Governance
and Reinvention in Australia. Cambridge: Cambridge University Press.
Martinsons, M.G. 1998. “Hong Kong Government Policy and Information Technology
Innovation: The Invisible Hand, the Helping Hand, and the Hand-Over to China”,
IEEE Transactions on Engineering Management, 45(4): 366-380.
Mathews, J.A. 1997. “A Silicon Valley of the East: Creating Taiwan’s Semiconductor
Industry”, California Management Review, 39(4): 26-54.
Mathews, J.A. 2002. “The Origins and Dynamics of Taiwan R&D Consortia”,
Research Policy, 31(4): 633-651.
Mathews, J.A. & Hu M.C.. 2007. “Enhancing the Role of Universities in Building
National Innovative Capacity in Asia: The Case of Taiwan”, World Development,
35(6): 1005-1020.
Ministry of Economy, Trade and Industry [METI], Japan. 2005. “Study on Venture
Firms from Universities” (News Release):
http://www.meti.go.jp/press/20050609003/1-venture-chousa-set.pdf.
Ministry of Education [MOE], Taiwan. 2007a. “Industry-Academia Partnerships a
Win-Win Strategy”, February 19th 2007.
http://english.moe.gov.tw/ct.asp?xItem=7232&ctNode=504&mp=1.
Ministry of Education [MOE], Taiwan. 2007b. “The Ministry of Education Passed
Rules Governing Industry-academia Collaboration”, February 19th 2007.
http://english.moe.gov.tw/ct.asp?xItem=7232&ctNode=504&mp=1.
Ministry of Education [MOE], Taiwan. 2008a. “Academia-Industry
Cooperation-Training Diverse Human Resources for the Industry”, December 12th
2008. http://english.moe.gov.tw/ct.asp?xItem=10167&ctNode=504&mp=1.
Ministry of Education [MOE], Taiwan. 2008b. “Establishing a Cooperative
Environment or Industry and Academia where Everyone Wins is the Trend of the New
Era”, December 12th 2008.
http://english.moe.gov.tw/ct.asp?xItem=8887&ctNode=504&mp=1.
Ministry of Education [MOE], Taiwan. 2009. 2009 Educational Statistical Indicators.

0
Retrieved August 27, 2009 from
http://english.moe.gov.tw/ct.asp?xItem=10983&ctNode=816&mp=1.
Ministry of Education, Culture, Sports, Science and Technology [MEXT], Japan.
2006. Japan’s Education at a Glance 2006.
http://www.mext.go.jp/english/statist/07070310.htm.
Ministry of Education, Culture, Sports, Science and Technology [MEXT], Japan.
2008. White Paper on Science and Technology 2008.
http://www.mext.go.jp/english/wp/1260270.htm.
Ministry of Education, Science and Technology [MEST], South Korea. 2007.
Summary of BK21 and NURI Projects.
http://english.mest.go.kr/main.jsp?idx=0301020101&brd_no=52&cp=1&pageSize=1
0&srchSel=&srchVal=&brd_mainno=528&mode=v.
Ministry of Education, Science and Technology [MEST], South Korea. 2009. Major
Policies to Enhance the Competitive Strength of Korean Higher Education.
http://english.mest.go.kr/main.jsp?idx=0301020101&brd_no=52&cp=1&pageSize=1
0&srchSel=&srchVal=&brd_mainno=878&mode=v
Ministry of Trade and Industry [MTI], Singapore. 2006. Sustaining Innovation-driven
Growth: Science and Technology Plan 2010. Singapore: Author.
Mok, K.H. 2005. “Pro-competition Policy Tools and State Capacity: Corporatization
of Public Universities in Hong Kong and Singapore”, Policy & Society, 24(3): 1-26.
Mok, K.H. 2005a. “Fostering Entrepreneurship: Changing Role of Government and
Higher Education Governance in Hong Kong”, Research Policy, 34: 537-554.
Mok, K.H. 2006a. “The Search for New Governance: Corporatization and
Privatization Experiences in Singapore and Malaysia”, paper presented at the
International Workshop on University Restructuring in Asia, 16 January 2006,
Research Institute for Higher Education, Hiroshima University.
Mok, K.H. 2007. “The Search for New Governance: Corporatization and Privatization
of Public Universities in Malaysia and Thailand”, Asia Pacific Journal of Education,
27(3): 271-290.
Mok, K.H. 2008. “Varieties of Regulatory Regimes in Asia: The Liberalization of the

0
Higher Education Market and Changing Governance in Hong Kong, Singapore and
Malaysia”, The Pacific Review, 21(2): 147-170.
Mok, K.H. & Chan, Y. 2008. “International-benchmarking with the Best Universities
Policy and Practice in Mainland China and Taiwan”, Higher Education Policy, 21:
469-486.
Mok, K.H. & Lee, H.H. 2000. “Globalization or Re-colonization: Higher Education
Reforms in Hong Kong”, Higher Education Policy, 13(4): 361-77.
Mok, K.H. & Welch, A. (eds.). 2003. Globalization and Educational Restructuring in
the Asia Pacific Region. Basingstoke: Macmillan.
Moon, Mugyeong & Ki-Seok Kim. 2001. “A Case of Korean Higher Education
Reform: The Brain Korea 21 Project”, Asia Pacific Education Review, 2(2): 96-105.
Moore, T.G. 2005. “Chinese Foreign Policy in the Age of Globalization”, in Deng, Y.
& Wang, F.L. (eds.), China Rising: Power and Motivation in Chinese Foreign Policy,
Lanham: Rowman & Littlefield.
Moran, M. 2002. “Review Article: Understanding the Regulatory State”, British
Journal of Political Science, 32: 391-413.
Morris, P. & Sweeting, A. (eds.). 1995. Education and Development in East Asia,
New York: Garland.
Motohashi, Kazuyuki. 2005. “University-Industry Collaborations in Japan: The Role
of New Technology-Based Firms in Transforming the National Innovation System”,
Research Policy, 34: 583-594.
Nanyang Technological University [NTU]. 2008. Nanyang Technological University
Annual Report (various years). Singapore: NTU.
National Chengchi University. 2008. Strengthening Research Support and
Administration Reform (In Chinese). Taipei: Author.
National Science Council, Executive Yuan, Republic of China. 2001. Abstract of
National Science and Technology Development Plan (2001-2004). Taipei: Author.
National Science Council, Executive Yuan, Republic of China. 2003. White Paper on

0
Science and Technology: Visions and Strategies for the Development of Science and
Technology (2003-2006) (Executive Summary). Taipei: Author.
National Science Council, Executive Yuan, Republic of China. 2005. National
Science and Technology Plan (2005 to 2008). Taipei: Author.
National Science Council, Executive Yuan, Republic of China. 2008. Indicators of
Science and Technology 2008. http://www.nsc.gov.tw/tech/pub_data_main.asp.
National Science Council Website. “Mission”:
http://web1.nsc.gov.tw/ct.aspx?xItem=9205&CtNode=995&mp=7.
National Science Council Website. “Promoting Sci-tech Interchange and
Cooperation”: http://web1.nsc.gov.tw/ct.aspx?xItem=9215&ctNode=995&mp=7.
National University of Singapore [NUS]. 2008. National University of Singapore
Annual Report (various years). Singapore: NUS.
Oba, J. 2007. “Incorporation of National Universities in Japan”, Asia Pacific Journal
of Education, 27(3): 291-304.
Odagiri, Hiroyuki. 2006. “Advance of Science-based Industries and the Changing
Innovation System of Japan”, in Lundvall, Bengt-Åke, Patarapong Intarakumnerd &
Jan Vang (eds), Asia’s Innovation Systems in Transition, pp. 200-226. Cheltenham,
UK; Northampton, MA: Edward Elgar.
Oh, Deog-Seong. 2002. “Technology-Based Regional Development Policy: Case
Study of Taedok Science Town, Taejon Metropolitan City, Korea”, Habitat
International, 26: 213-228.
Olsen, J.P. & Gornitzka, A. 2006. “Making Sense of Change in University
Governance”, IAU Horizons, 11.4-12.1: 1-3.
Parayil, Govindan and T.T. Sreekumar. 2004. “Industrial Development and the
Dynamics of Innovation in Hong Kong”, International Journal of Technology
Management, 27(4): 369-392.
Park, Sang-Chul. 2004. “The City of Brain in South Korea: Daedeok Science Town”,
International Journal of Technology Management, 28(3/4/5/6): 602-614.

0
Perbadanan Harta Intelek Malaysia [MyIPO]. 2009. Patent Statistics: Patent and
Utility Innovation Granted from 1986 – 2009. Malaysia: Author.
Rozman, G. 1992. “The Confucian Faces of Capitalism”, in Borthwick, M. (ed.),
Pacific Century: The Emergence of Modern Pacific Asia. Boulder, CO: Westview
Press.
Schaaper, M. (OECD). 2009. Measuring China’s Innovation System: National
Specificities and International Comparisons. STI Working Papers 2009/1, Statistical
Analysis of Science, Technology and Industry.
Schramn, C.J. 2006. The Entrepreneurial Imperative. New York: Collins.
Scott, C. 2004. “Regulation in the Age of Governance: The Rise of the
Post-regulatory State”, in Jordana, J. & Levi-Faur, D. (eds.), The Politics of
Regulation: Institutions and Regulatory Reforms for the Age of Governance.
Cheltenham: Edward Elgar.
Segal, A. 2003. Digital Dragon: High Technology Enterprises in China. Ithaca, New
York: Cornell University Press.
Shapiro, Matthew. 2007. “The Triple Helix Paradigm in Korea: A Test for New Forms
of Capital”, International Journal of Technology Management and Sustainable
Development, 6(3): 171-191.
Sharif, Naubahar. 2006. “An Examination of Recent Developments in Hong Kong’s
Innovation System: 1990 to the Present”, Science and Public Policy, 33(7): 505-518.
Sharif, Naubahar & Erik Baark. 2005. “The Tamest of Tigers? Understanding Hong
Kong’s Innovation System and Innovation Policies”, International Journal of
Technology and Globalization, 1(3-4): 462-479.
Sharif, Naubahar & Erik Baark. 2008. “Mobilizing Technology Transfer from
University to Industry”, Journal of Technology Management in China, 3(1): 47-65.
Small and Medium Enterprise Administration, Ministry of Economic Affairs,
Republic of China. 2008. Incubation Centers in Taiwan. Taipei: Author.
So, A. & Chiu, S. 1995. East Asia and the World Economy. Thousand Oaks, CA:
SAGE.
0
Song, Mei-Mei & Hsiou-Hsia Tai. 2007. “Taiwan’s Responses to Globalization:
Internationalization and Questing for World Glass Universities”, Asia Pacific Journal
of Education, 27(3): 323-340.
Sohn, Dong-Won, Hyungjoo Kim & Jeong Hyop Lee. 2009. “Policy-Driven
University-Industry Linkages and Regional Innovation Networks in Korea”,
Environment and Planning C: Government and Policy, 27: 647-664.
Sung, Tae-Kyung, David V. Gibson & Byung-Su Kang. 2003. “Characteristics of
Technology Transfer in Business Ventures: The Case of Daejeon, Korea”,
Technological Forecasting & Social Change, 70: 449-466.
Sutter, R.G. 2005. China’s Rise in Asia. Lanham: Rowman & Littlefield.
Thursby, J.G. & Thursby, M.C. 2004. “Are Faculty Critical? Their Role in
University-Industry Licensing”, Contemporary Economic Policy, 22(2): 162-178.
Tien, F. 2006. “Incorporation of National University in Taiwan: Challenges for the
Government and the Academics”, paper presented at the International Workshop on
University Restructuring in Asia, 16 January 2006, Research Institute for Higher
Education, Hiroshima University.
Tilak, J. 2000. Education and Development: Lessons from Asian Experience. New
Delhi: National Institute of Educational Planning and Administration.
Tilak, J. 2006. “Private Higher Education: Philanthropy to profits”, Higher Education
in the World 2006: The Financing of Universities, pp. 113-121.
Tsui-Auch, Lai Si. 1998. “Has the Hong Kong Model Worked? Industrial Policy in
Retrospect and Prospect”, Development and Change, Vol.29: 55-79.
University Grants Committee [UGC], HKSAR. 2004a. Hong Kong Higher Education:
Integration Matters. Hong Kong: Author.
University Grants Committee [UGC], HKSAR. 2004b. Hong Kong Higher Education:
To Make a Difference, To Move with the Times. Hong Kong: Author.
Vedam, H., Liu, L., Dong, Y.X. & Brama, Y. 2009. Singapore Nanotechnology Eco
System. Singapore: NanoConsulting Pte.Ltd.

0
Wang, Y. & Lu, L. 2007. “Knowledge Transfer through Effective University-Industry
Interactions: Empirical Experiences from China”, Journal of Technology Management,
2(2): 119-133.
Wong, P., Ho, Y. & Singh, A. 2007. “Towards an ‘Entrepreneurial University’ Model
to Support Knowledge-Based Economic Development: the Case of the National
University of Singapore”, World Development, 35(6): 941-958.
Woolgar, Lee. 2007. “New Institutional Policies for University-Industry Links in
Japan”, Research Policy, 36: 1261-1274.
World Bank. 2007. Malaysia and the Knowledge Economy: Building a World Class
Education System.
http://siteresources.worldbank.org/INTMALAYSIA/Resources/Malaysia-Knowledge-
Economy2007.pdf
World Bank. 2007a. World Development Indicators 2007. Washington, DC: World
Bank.
World Bank. 2008. EdStats. Retrieved August 26, 2009 from
http://www.worldbank.org/education/edstats/index.html
Wu, W.P. 2007a. “State Policies, Enterprise Dynamism, and Innovation System in
Shanghai, China”, Growth and Change, 38(4): 544-566.
Wu, W.P. 2007b. “Cultivating Research Universities and Industrial Linkages in China:
The case of Shanghai”, World Development, 35(6): 1075-1093.
Yamamoto, Kiyoshi. 2004. “Corporation of National Universities in Japan: Revolution for Governance
or Rhetoric for Downsizing?”, Financial Accountability and Management, 20(2): 153-181.
Yang, Cliff. 2007. “Incubation Center in Changhua Works Biotech Wonders”,
Building Industries from Creative Ideas, Small and Medium Enterprise
Administration, Ministry of Economic Affairs, Ministry of Economic Affairs,
Republic of China, pp.24-27.
Yeh, A. G-O & M.K. Ng. 1994. “The Changing Role of the State in High-tech
Industrial Development: The Experience of Hong Kong”, Environment and Planning
C: Government and Policy, Volume 12: 449-472.

0