Embed Size (px)
Citation preview
INNOVATION FOR INCLUSION
New York November, 2015
BOLSA FAMILIA PROGRAM
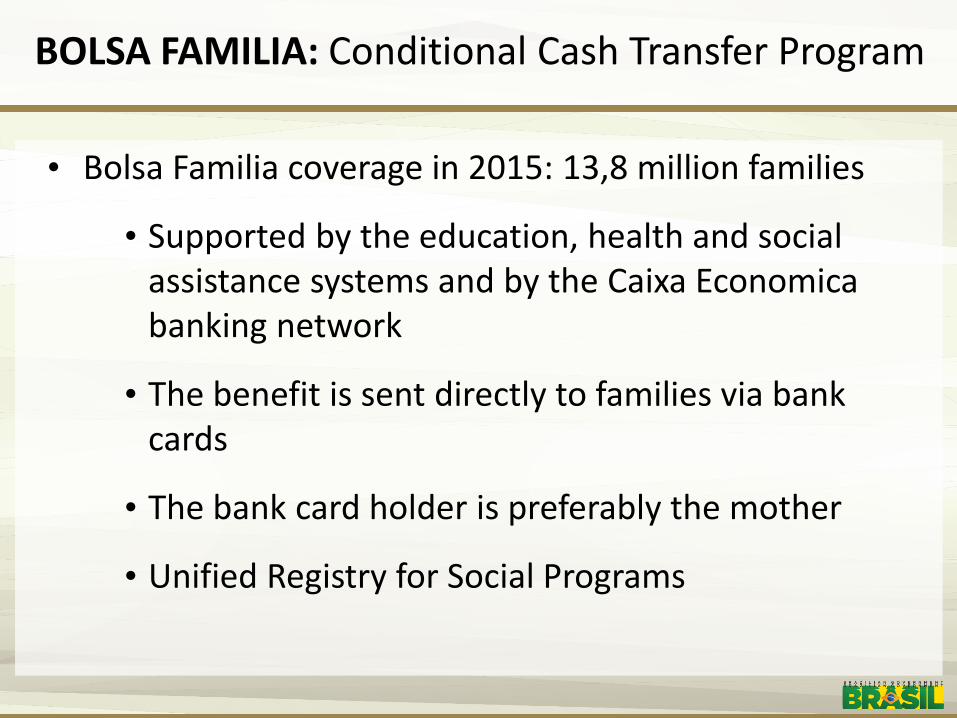
• Bolsa Familia coverage in 2015: 13,8 million families
• Supported by the education, health and social assistance systems and by the Caixa Economica banking network
• The benefit is sent directly to families via bank cards
• The bank card holder is preferably the mother
• Unified Registry for Social Programs
BOLSA FAMILIA: Conditional Cash Transfer Program

50% increase in prenatal healthcare
14% reduction in premature birth rates
99.1% of children vaccinated

Children between 0 and 5 years of age
58% decrease in mortality caused by
malnutrition
46% decrease in mortality due to diarrhea
Family Health Care Program
Bolsa Familia

Stunting prevalence Chronic undernourishment (%)
Longitudinal panel with around 360,000 children
Source: Ministry of Health, elaborated by MDS
17.5
8.5
2008 2012
51%
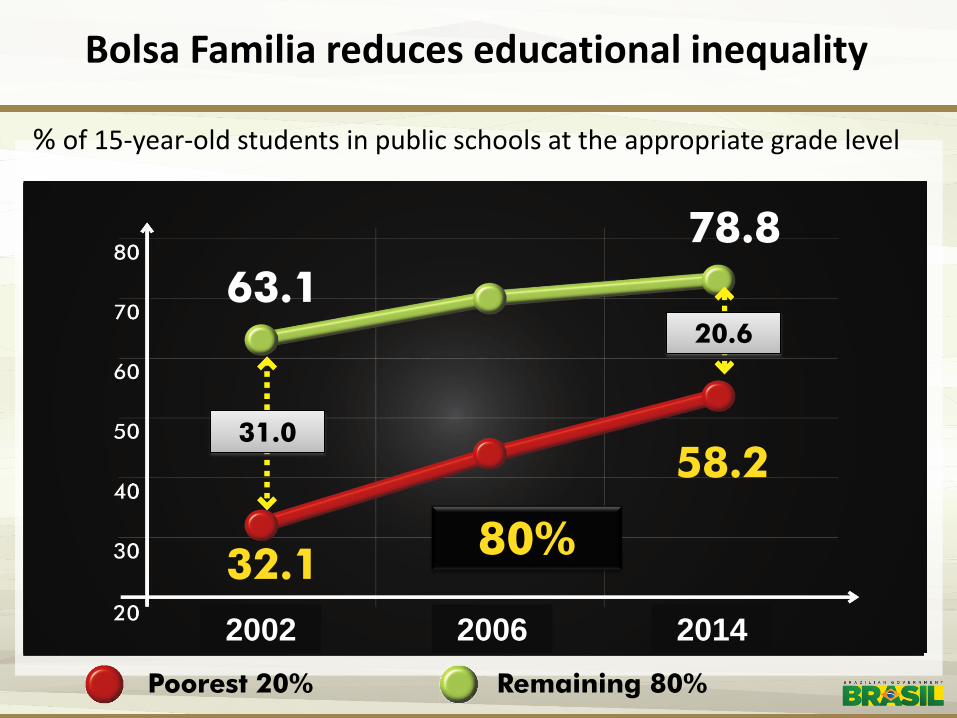
Poorest 20% Remaining 80%
32.1
63.1
58.2
78.8
31.0
20.6
80%
2014 2006 2002
Bolsa Familia reduces educational inequality
% of 15-year-old students in public schools at the appropriate grade level

IMPACT OF BOLSA FAMILIA ON EXTREME POVERTY AND ON THE
ECONOMY

GDP Multiplier Effect = US$ 1.78
US$ 1.00
Bolsa Familia costs Brazil 0.5% of its GDP.

Doorway to more than 30 federal programs
Unified Registry = Poverty Map

Unified Registry - Cutting-Edge Technology
Base of 1,5 terabyte can process up to 120,000 transactions daily
All data is encrypted Security level 4 ( highest)

77.9 % of the Brazilian Population have access to mobile phones (PNAD 2014)
256,000 people downloaded the app since its launching in October 2015
Mobile App

Active Search
Over 1.44 million families have been located and included
The State shall go where
poverty is
The poor shall no
longer seek the State for help
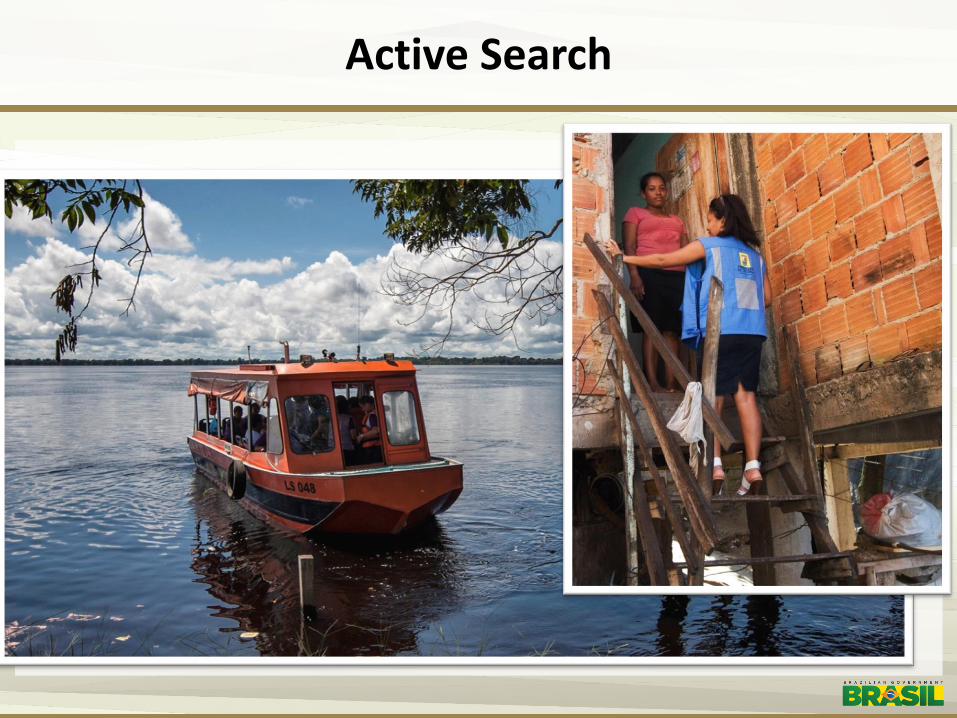
Active Search

Source: MMA, ICMBio, Incra and SPU, december of 2014.
74,000 families of extrativists, settled by the agrarian reform and riverside dwellers have benefitted from the Green Grant to continue to
produce and preserve the environment
Green Grant (Bolsa Verde)
Monitoring of the vegetation coverage carried out anually by satellite images
Biomes with Green Grant beneficiaries
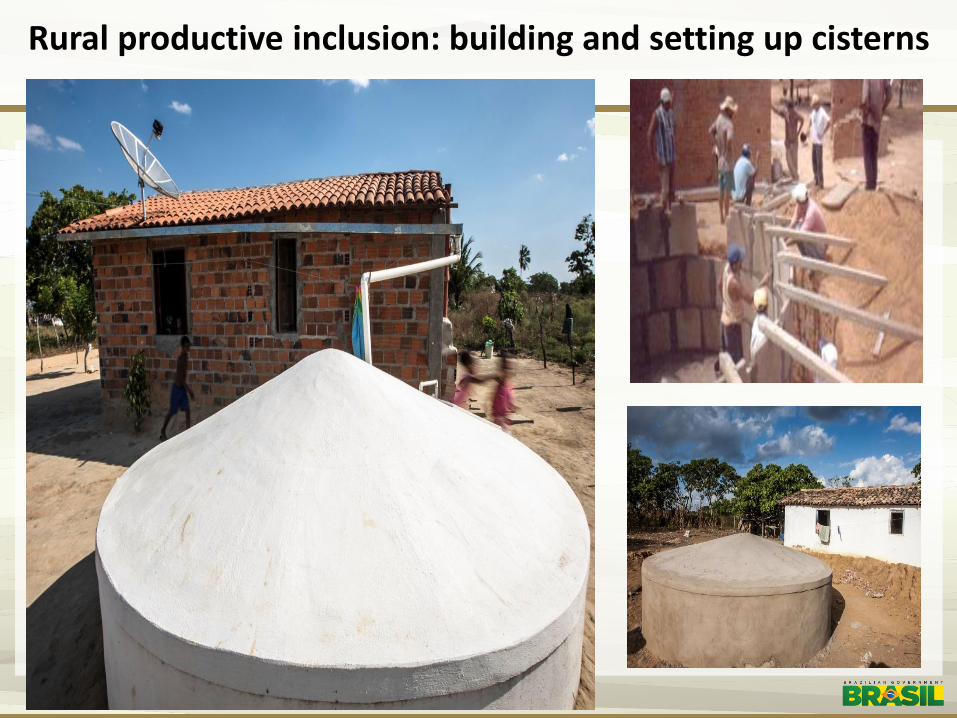
Rural productive inclusion: building and setting up cisterns

Photos: Ana Nascimento
ASCOM/MDS
1,2 million cisterns delivered
150.000 cisterns
for production

Semiarid
region
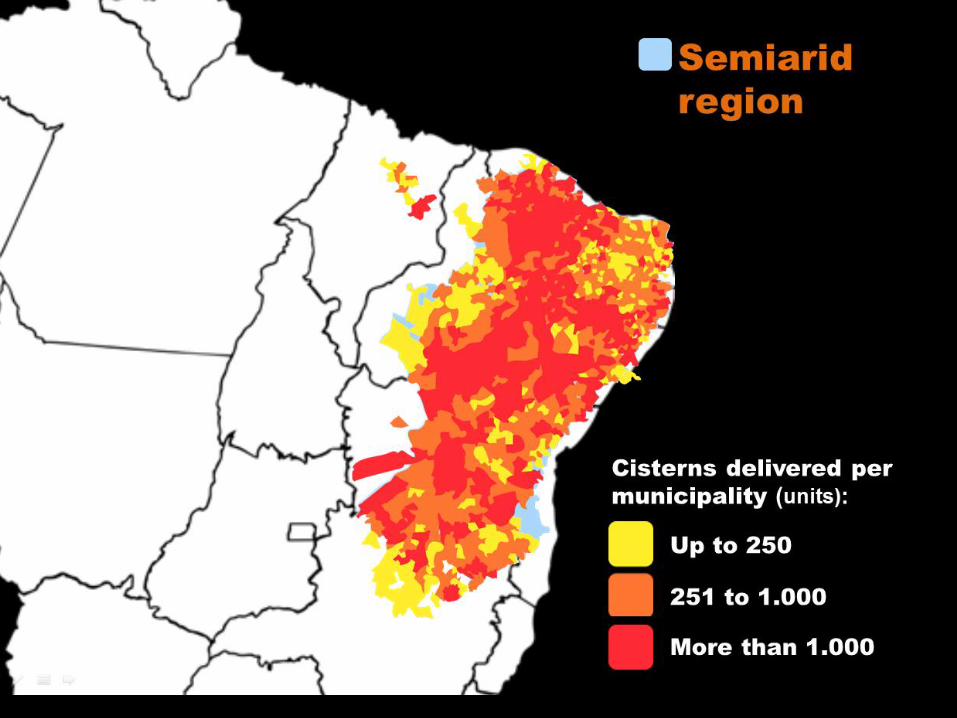


Cistern Delivered
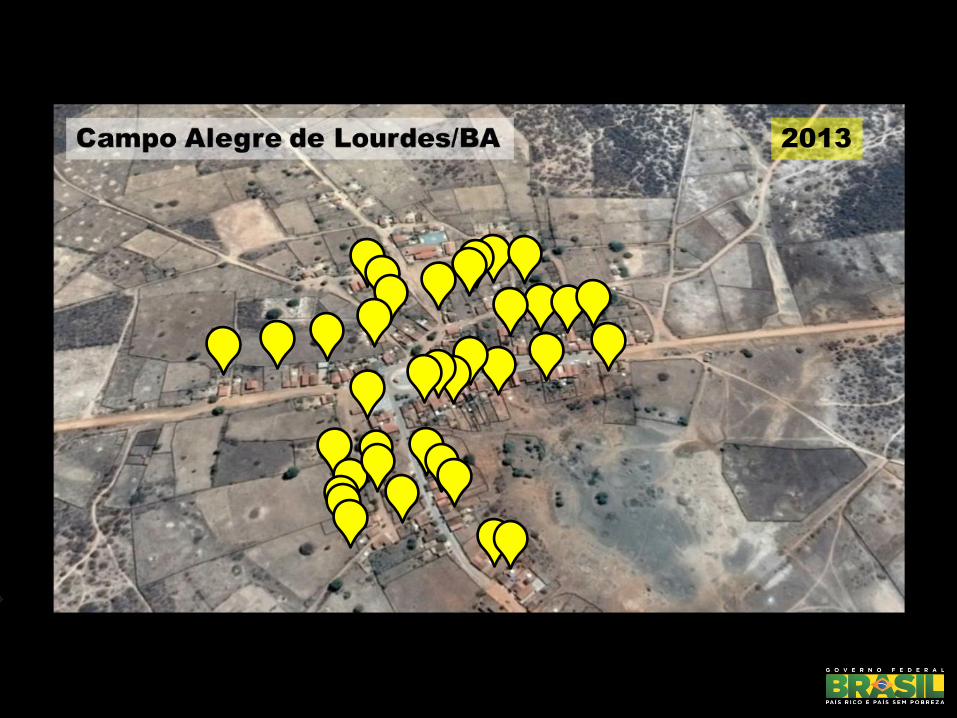
Campo Alegre de Lourdes/BA 2013

Campo Alegre de Lourdes/BA
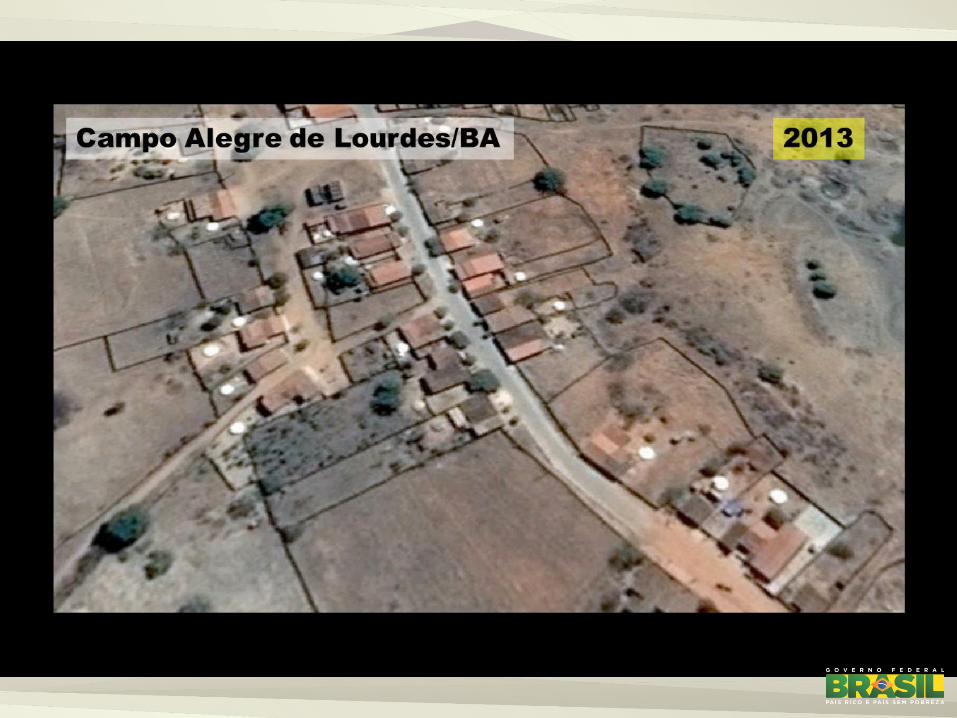
Campo Alegre de Lourdes/BA 2013

Serrinha/BA 2013

Canapi/AL 2012

to fetch water with the children
Eliana
6 hours/day
used to waste
That means
3 months/year
Serrinha/BA
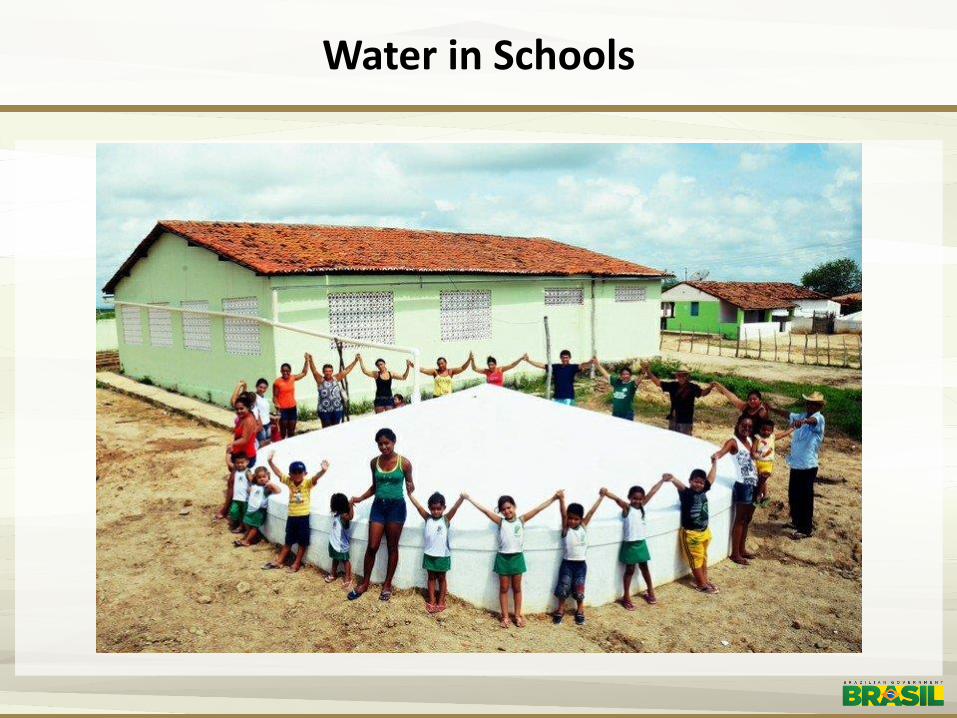
Water in Schools

13,0 12,9
8,2 8,9
8,4 7,7 8,0
8,6 7,9 7,8
6,7 6,1
5,0 4,5
3,9 3,7 3,5 2,7 2,9
2,3
13,5
2,5
14,0 13,9
9,0 9,7
9,2 8,5 8,8
9,4 8,7 8,6
7,5 6,9
5,6 5,3 4,5 4,3 3,9
3,1 3,3 2,7
30,6 30,3
22,5 22,9 22,6
21,5
22,8 23,1 23,0 23,2
21,1
19,9
16,0
14,7
13,0
11,9
10,0
7,8 7,6 6,8
31,1
7,0
31,6 31,3
23,3 23,7 23,4
22,3
23,6 23,9 23,8 24,0
21,9
20,7
16,6
15,5
13,6
12,5
10,4
8,2 8,0 7,2
Percentual da população em situação de extrema pobreza (%)
Percentual da população em situação de pobreza (%)
Percentage of the population in situation of extreme poverty
Percentage of the population in situation of poverty
Extreme Poverty and Poverty Brazil, 1992-2014
Source: IBGE/PNAD – Elaborated by SAGI/MDS

BRAZIL – UNDERNOURISHED POPULATION (%)
Source: FAO, 2014 – elaborated by the Secretariat for Evaluation and Information Management of the Ministry of Social Development and Fight against Hunger (SAGI/MDS).
Third Largest Reduction in the Number of Undernourished People in the World– 2002/14
Reduction of 82%
1.7% -1,0
1,0
3,0
5,0
7,0
9,0
11,0
13,0
15,0
% Population
Triennium
15.0
13.0
11.0
9.0
7.0
5.0
3.0
1.0
-1.0

MULTIDIMENSIONAL POVERTY

6,8
26,5
36,9
53,1
0,0
10,0
20,0
30,0
40,0
50,0
60,0
2002 2004 2009 2014
Household reference persons who completed basic education (%)
Poorest 5%
Total
The number of people who completed basic education grew 290% among the poorest 5%
290%
44%
Source: PNAD/IBGE. Elaborated by MDS
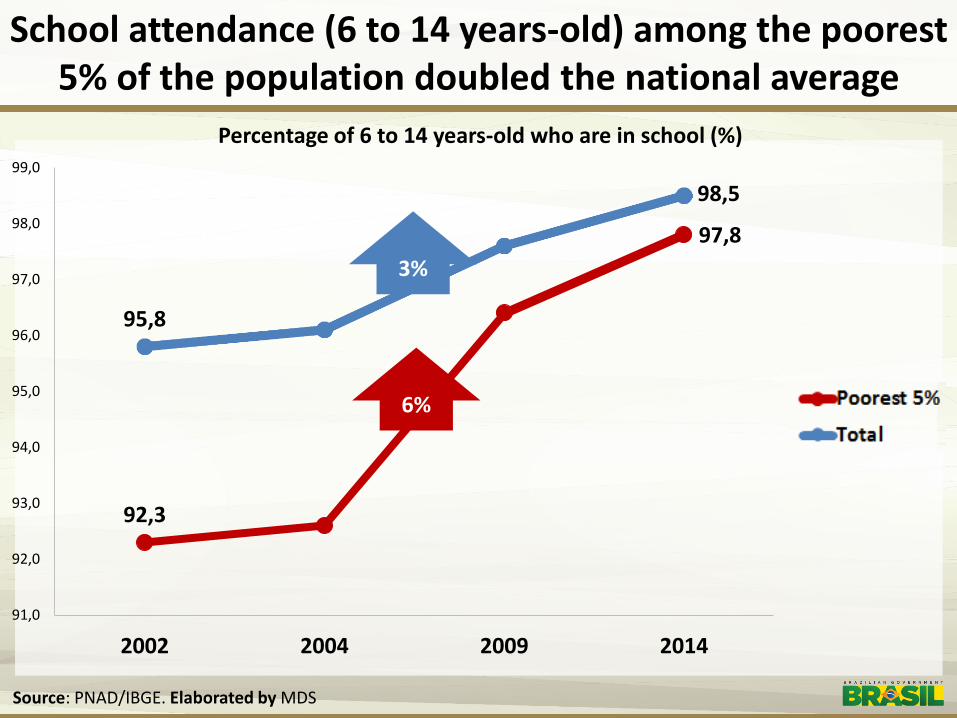
92,3
97,8
95,8
98,5
91,0
92,0
93,0
94,0
95,0
96,0
97,0
98,0
99,0
2002 2004 2009 2014
Percentage of 6 to 14 years-old who are in school (%)
5% mais pobres
Total
School attendance (6 to 14 years-old) among the poorest 5% of the population doubled the national average
6%
3%
Source: PNAD/IBGE. Elaborated by MDS
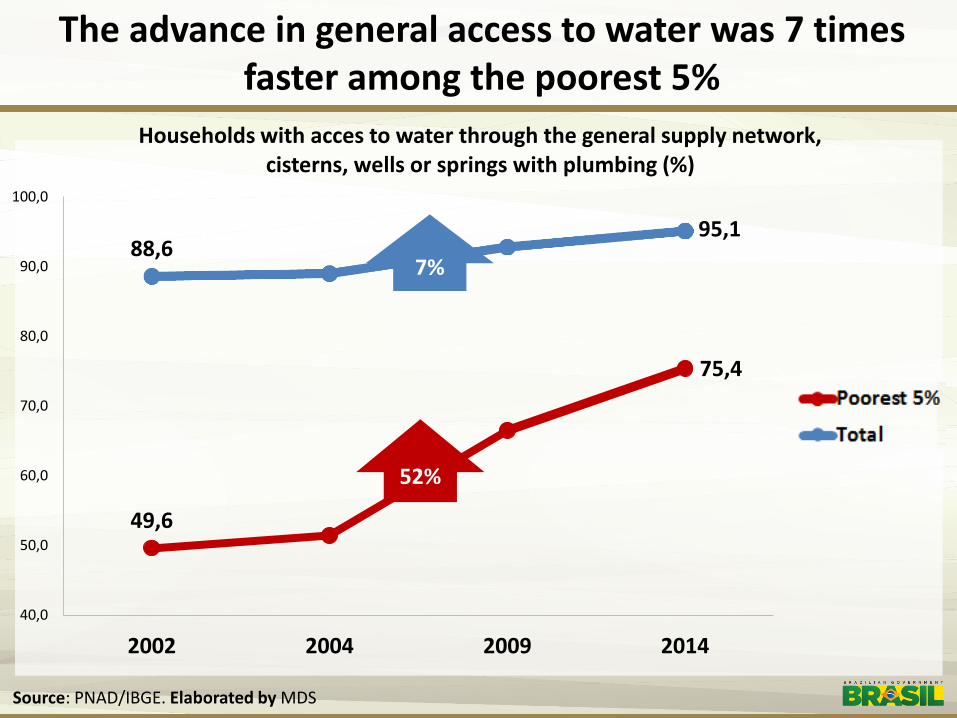
49,6
75,4
88,6 95,1
40,0
50,0
60,0
70,0
80,0
90,0
100,0
2002 2004 2009 2014
Households with acces to water through the general supply network, cisterns, wells or springs with plumbing (%)
5% mais pobres
Total
The advance in general access to water was 7 times faster among the poorest 5%
Source: PNAD/IBGE. Elaborated by MDS
52%
7%
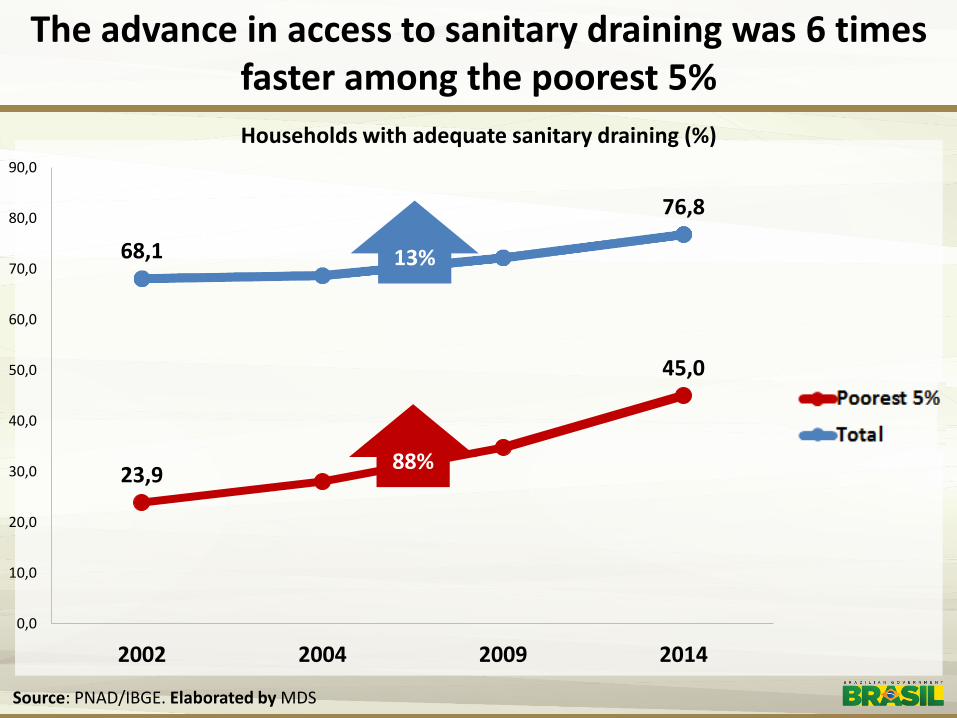
23,9
45,0
68,1
76,8
0,0
10,0
20,0
30,0
40,0
50,0
60,0
70,0
80,0
90,0
2002 2004 2009 2014
Households with adequate sanitary draining (%)
5% mais pobres
Total
The advance in access to sanitary draining was 6 times faster among the poorest 5%
Source: PNAD/IBGE. Elaborated by MDS
88%
13%

81,3
97,8 96,7 99,7
75,0
80,0
85,0
90,0
95,0
100,0
2002 2004 2009 2014
Households with access to electrical power (%)
5% mais pobres
Total
Access to electricity grew 6 times faster among the poorest 5% of the population
Source: PNAD/IBGE. Elaborated by MDS
20%
3.0%

44,1
89,8 87,3
97,9
30,0
40,0
50,0
60,0
70,0
80,0
90,0
100,0
2002 2004 2009 2014
Households with refrigerators of freezers (%)
5% mais pobres
Total
Access to refrigerators also increased much faster among the poorest 5% of the population
Source: PNAD/IBGE. Elaborated by MDS
104%
12%

5,1
79,2
34,6
91,1
0,0
10,0
20,0
30,0
40,0
50,0
60,0
70,0
80,0
90,0
100,0
2002 2004 2009 2014
Household reference persons who own mobile phones (%)
5% mais pobres
Total
Access to mobile phones increased above 1400% among the poorest 5% in this period
Source: PNAD/IBGE. Elaborated by MDS
1453%
163%
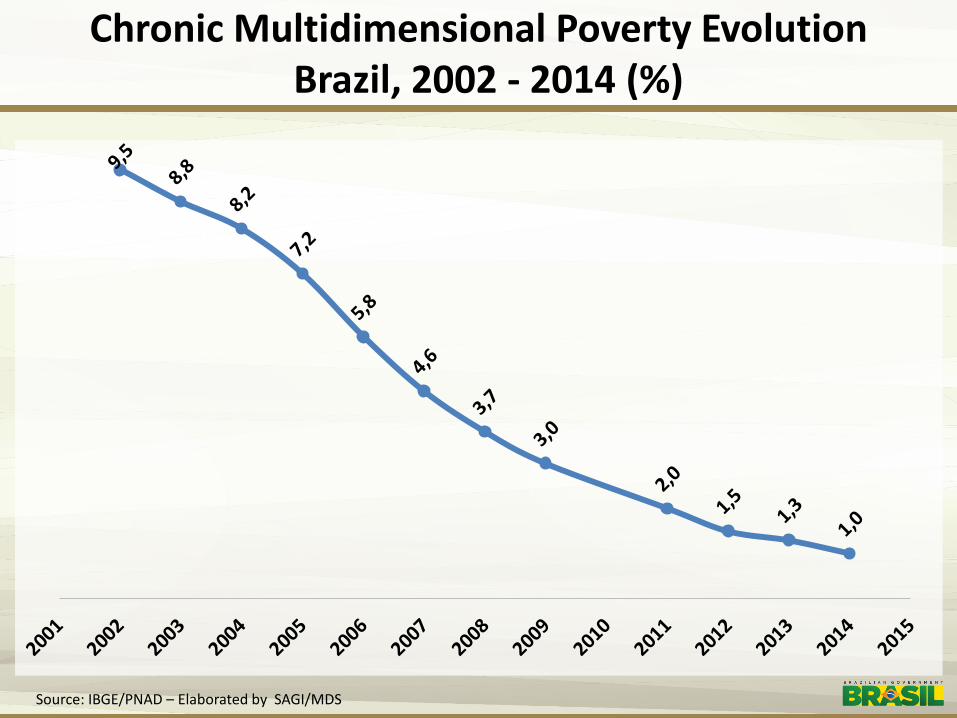
Chronic Multidimensional Poverty Evolution Brazil, 2002 - 2014 (%)
Source: IBGE/PNAD – Elaborated by SAGI/MDS
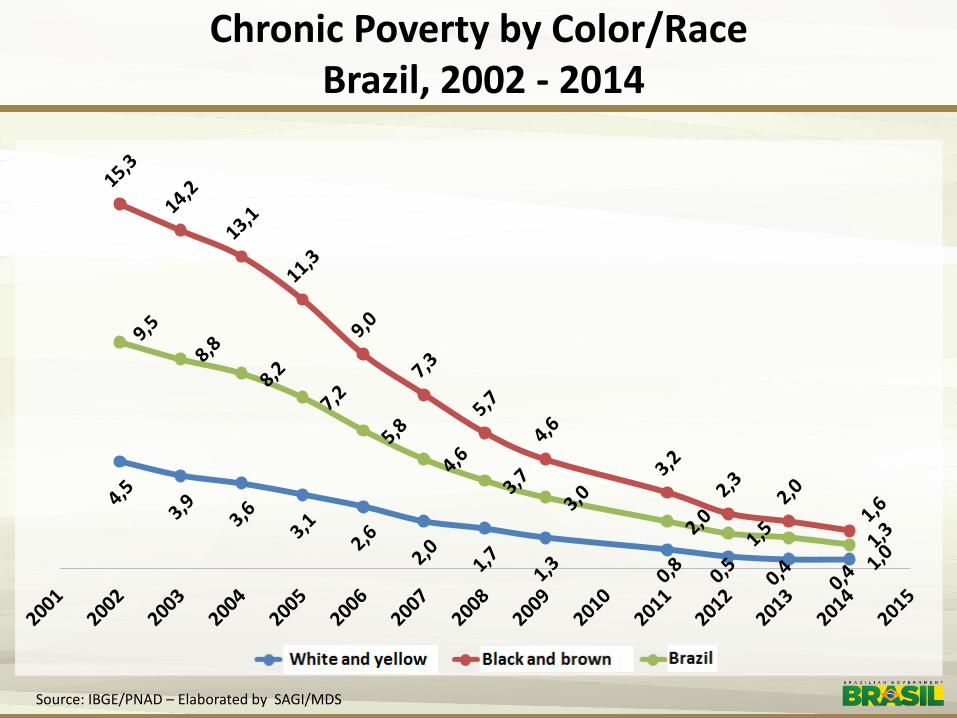
Chronic Poverty by Color/Race Brazil, 2002 - 2014
Branco/Amarelo Preto/Pardo Brasil
Source: IBGE/PNAD – Elaborated by SAGI/MDS

Chronic Poverty by Age Range Brazil, 2002 - 2014
16,9
15,6 15,0
12,3
8,4
7,1
5,4
2,4
0 a 3 anos 4 a 5 anos 6 a 14 anos 15 a 17 anos
18 a 24 anos 25 a 49 anos 50 a 64 anos 65 anos ou mais
Source: IBGE/PNAD – Elaborated by SAGI/MDS

Chronic Poverty by Urban and Rural Classification Brazil, 2002 - 2014 (%)
Urbano Rural
Source: IBGE/PNAD – Elaborated by SAGI/MDS

INNOVATION FOR INCLUSION
New York November, 2015


![Antônio Campello [Português]](https://img.dokumen.tips/doc/110x75/58cfcb341a28ab7c6e8b588d/antonio-campello-portugues.jpg)


![Antônio Campello [Inglês]](https://img.dokumen.tips/doc/110x75/58f2b1991a28ab2d4c8b45bd/antonio-campello-ingles.jpg)


![Comparativo Praça Cely Campello[2]](https://img.dokumen.tips/doc/110x75/55b28afebb61eb82178b4573/comparativo-praca-cely-campello2.jpg)
