Embed Size (px)
Citation preview

Innovation and
Sustainability:
An industry perspective
Karl Mahler
Head of Investor Relations
Fair Impact into Responsible
Investment Corporate Access
Zurich, 5 July 2013

This presentation contains certain forward-looking statements. These forward-looking
statements may be identified by words such as ‘believes’, ‘expects’, ‘anticipates’, ‘projects’,
‘intends’, ‘should’, ‘seeks’, ‘estimates’, ‘future’ or similar expressions or by discussion of,
among other things, strategy, goals, plans or intentions. Various factors may cause actual
results to differ materially in the future from those reflected in forward-looking statements
contained in this presentation, among others:
1 pricing and product initiatives of competitors;
2 legislative and regulatory developments and economic conditions;
3 delay or inability in obtaining regulatory approvals or bringing products to market;
4 fluctuations in currency exchange rates and general financial market conditions;
5 uncertainties in the discovery, development or marketing of new products or new uses of existing products, including without limitation negative results of clinical trials or research projects, unexpected side-effects of pipeline or marketed products;
6 increased government pricing pressures;
7 interruptions in production;
8 loss of or inability to obtain adequate protection for intellectual property rights;
9 litigation;
10 loss of key executives or other employees; and
11 adverse publicity and news coverage.
Any statements regarding earnings per share growth is not a profit forecast and should not be interpreted
to mean that Roche’s earnings or earnings per share for this year or any subsequent period will
necessarily match or exceed the historical published earnings or earnings per share of Roche.
For marketed products discussed in this presentation, please see full prescribing information on our
website – www.roche.com
All mentioned trademarks are legally protected2

Challenges and our strategy
Innovation + Sustainability
Access to healthcare
Growth platforms
Summary
Future of Healthcare
& social systems, Drug
Prices, Differential PricingStraining budgets(reimbursement)
Industry challenges
Sustainable pricing, R&D productivity and
Biosimilars - key business issues
4
Patient safetyClinical trial disclosure,
Adverse events
BiosimilarsWhen will they arrive
and how much will
they take
R&D productivityRising R&D costs
Weak pipelines
Neglected diseases
(opportunities)
Corporate governanceBoard performance,
remuneration
Policy ChangesTransparency lobbying,
Political influence Marketing Practices Payments to HCPs,
Fines
EmployeesRetention/Attraction of talent,
diversity, human rights
Healthcare
Industry

5
Roche strategy: Focused on medically
differentiated therapies
Generics
Differentiation
MedTech
OTC
Pre
miu
m f
or
inn
ova
tio
n
DiaPharma
Focus
Regulators: Optimised benefit / risk ratio
Payors: Optimised benefit / cost ratio

Personalised Healthcare - benefit for all stake
holders, including the industry
Today Future
Reduced Patient pool
Higher probability of success
Pricing power
Lower development
costs
Increased market share
Time to market
Benefit from patient stratification
6

R&D productivity differs substantially among
players
7
4 x$ 710 m Peak Sales(per $1 bn R&D)
Average annual
NME peak sales (2001-10)1
US$ bn
Average annual R&D investment (1997-2006)1
US$ bn
Roche
1 Peak sales and R&D calculated pro forma to account for major M&ASource: EvaluatePharma; BCG analysis; Roche analysis
$ 165 m Peak Sales(per $1 bn R&D)

Roche: R&D well balanced from a risk & disease
point of view
8Source: Bernstein Equity Research, Tufts University and Roche analysis
Industry average probability of success – Phase 0 to Registration
Oncology
Virology
CNS
0% 5% 10% 15% 20% 25% 30%
InflammationMetabolism
2012 Roche budget

R&D spend: Balance between short and long term
9
Research/
Discovery
Phase 0 Phase 1 Phase 2 Phase 3 Filing Phase 4
R&D spend by phase
~50% ~50%
Invest for the
near term
Invest for
the future
Note: Based on 2012 budget
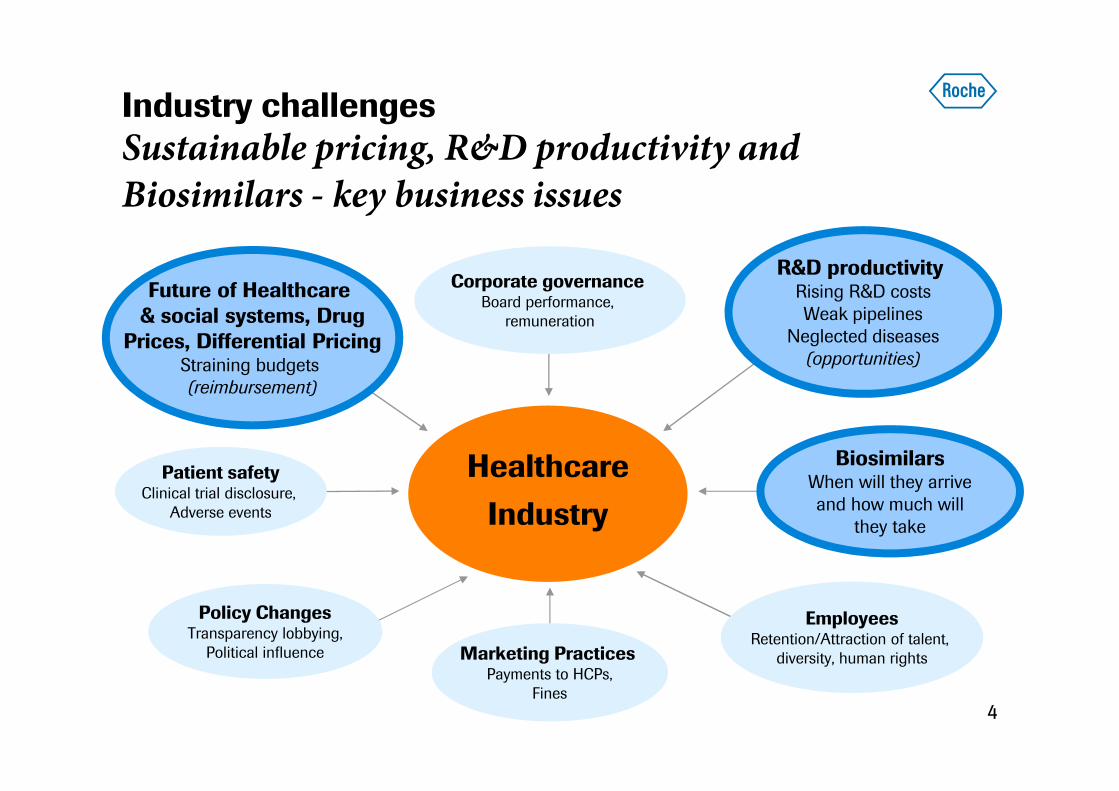
Implications of R&D productivity challenge
Segregation will continue as only true innovation
will be rewarded
10
Willingness to pay for added value
Me
dic
al
dif
fere
nti
ati
on
highlow
No / limited
differentiation
High
differentiation
True
innovators
Generics
‘Me-too’
players ??
low
hig
h

Challenges and our strategy
Innovation + Sustainability
Access to healthcare
Growth platforms
Summary

Innovation + Sustainability
Managing the business to create long-term value
Environmental Responsibility• Environmental management
Responsible
Practices• Corporate Governance
• Customer relationship management
Social Responsibility• Donations and philanthropy
• Community involvement
Employee Responsibility• Responsible and
attractive employer
Core Business• R&D (innovation capacities)
• Product quality & Patient safety
• Access (reimbursement, value)
12

13
Innovation + Sustainability = Remuneration
Integrated into 5-yr Corporate Goals
StatusGoal End 2014
Business Results
Diagnostics•
Pharma•
Group
StatusGoal End 2014
Great Place to Work
Sustainability
External ratings /
Indexes
Employees• GEOS
• % female leaders
StatusGoal End 2014
Personalized
Healthcare
Late stage assets /
Transitions
Helping patients through excellent science

Group risk map: continuous review
BUT: what you don’t know, you don’t know
14
Very High Risk High Risk
Medium Risk
Low Risk
Material risks
Material Risk Impact
1
2
3
4
5
... Very High
...Very High
Time/Compliance
...Very High
Time/Reputation
... Medium High
... Medium High
...Medium High
Reputation
Pro
ba
bilit
y %
Impact
V. Low Low Med. Low Med. High High V. High
6
4
25
6
1
3

Challenges and our strategy
Innovation + Sustainability
Access to healthcare
Growth platforms
Summary
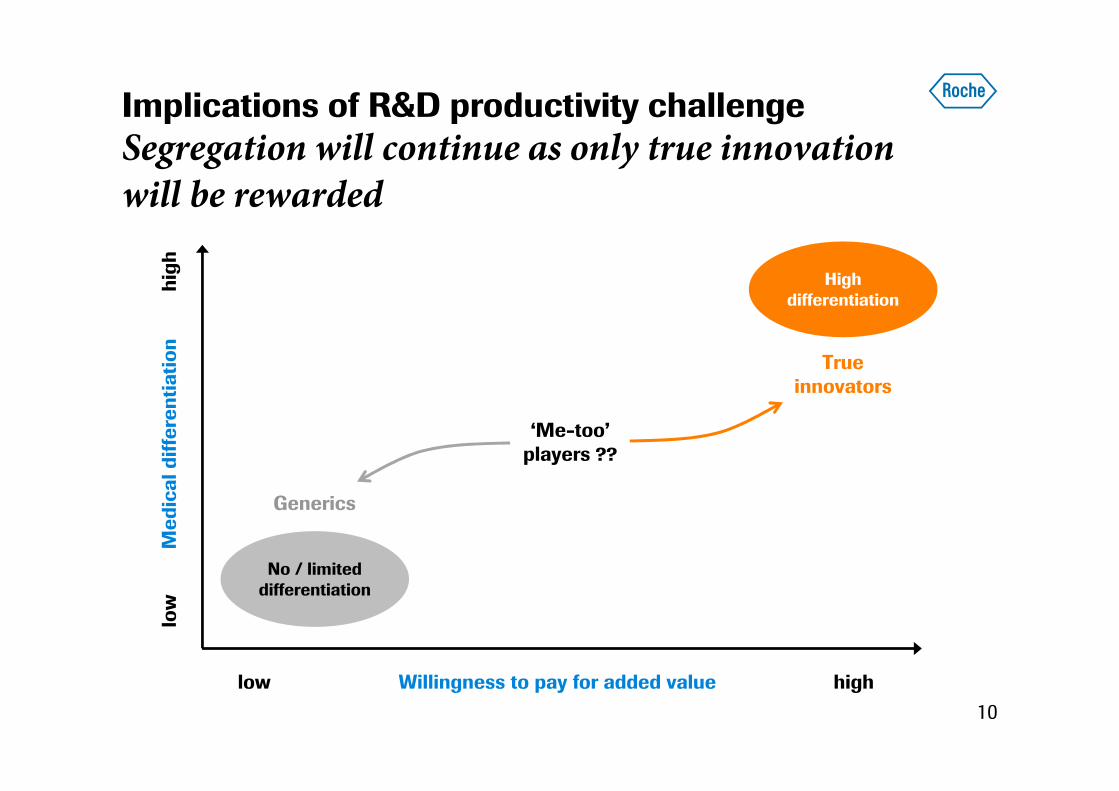
Access to healthcare is a global challenge
Requires new solutions to help increase access to
quality healthcare
16
RegulatorsHigher hurdles for approval• Efficacy (clinical endpoints)
• Safety (‘zero’ tolerance)
PayorsClear evidence of value• Funding capacity (innovation)
• Real world effectiveness (‘health outcomes’)
PatientsIncreasing role in their health• Technology (social media, patient forums)
• Behavioural change (prevention, adherence)
Healthcare professionalsHealth management complexity• Personalised healthcare (diagnostics)
• Combination therapies (treatment algorithms)

Roche strategy: Tailor made access options for
high value products
17
Established Markets Emerging Markets
Universal access and coverage
-> Negotiate prices for new medicines
Limited patient access
-> Enable access to public funding
Value based pricing Differential pricing

Helping improve healthcare coverage
Toolkit of options to address affordability
Details
1. Public Reimbursement: Statutory Health Insurance, Sick Funds, Primary Care Trust, Ministry of Health, Military institutions, etc ..2. Private Insurance: Voluntary health insurance, Employer insurance 3. Private Payment: Out-of-Pocket , Co-Payments
18
Options
Public
Reimburse1
Public
Reimburse1
Private
Insurance2
Private
Insurance2
Private
Payment3
Private
Payment3
Patient Assistance• Financial assistance co-pay
• Free product
• Treatment cost capping
Patient
Assistance
Programmes
Commercial
Arrangements• Price/volume
• Treatment cost capping
• Risk sharing
Commercial Arrangements
Private Insurance• Collaborate local insurance
companies to develop policies
Private
Insurance
Local packaging• Contract manufacturing
Differential offerings • Volume discount etc.
• Emerging/developing markets
Local
packaging
Differential
offerings
Differential
offerings /
pricing

Europe: Capping programs for Avastin treatment
Colorectal, breast and ovarian cancer
19
Potential pay back by Roche Costs covered by payers
Addresses challenges with dosages across indications, weight
and duration of treatment
Germany
Italy
Exceed 10 g limitPay back
Treatment with Avastin
Year 1
Exceed 11 g limitPay back
Treatment with Avastin
6 weeks
50% cost sharing
Over 40% insured
patients covered
by capping
program
~30,000 patients
tracked since
2009

China: Patient assistance program for Herceptin
Improving awareness, testing, treatment & access
20
Challenges:
• Limited access to Herceptin in public sector
• Low affordability in out-of-pocket market
Roche’s approach:
• Address affordability: Patient assistance
program (PAP) with the Cancer Foundation
of China (CFC)
• Patient pays for first 6 treatment cycles,
Roche provides next 8 cycles through CFCSince PAP (Aug 2011) the number of
women receiving Herceptin doubled
Results:
Before program <15% of
women received Herceptin
Patients on Herceptin
'0
2'000
4'000
6'000
8'000
10'000
2011 2012
With PAPWithout PAP
Challenges and our strategy
Innovation + Sustainability
Access to healthcare
Growth platforms
Summary

Roche oncology
A portfolio of distinctive drugs
22
(CHF mn)
Note: Sales at 2011 FX rates
'0.00
5'000.00
10'000.00
15'000.00
20'000.00
25'000.00
1998 1999 2000 2001 2002 2003 2004 2005 2006 2007 2008 2009 2010 2011 2012
CER - @ A12 CHF*
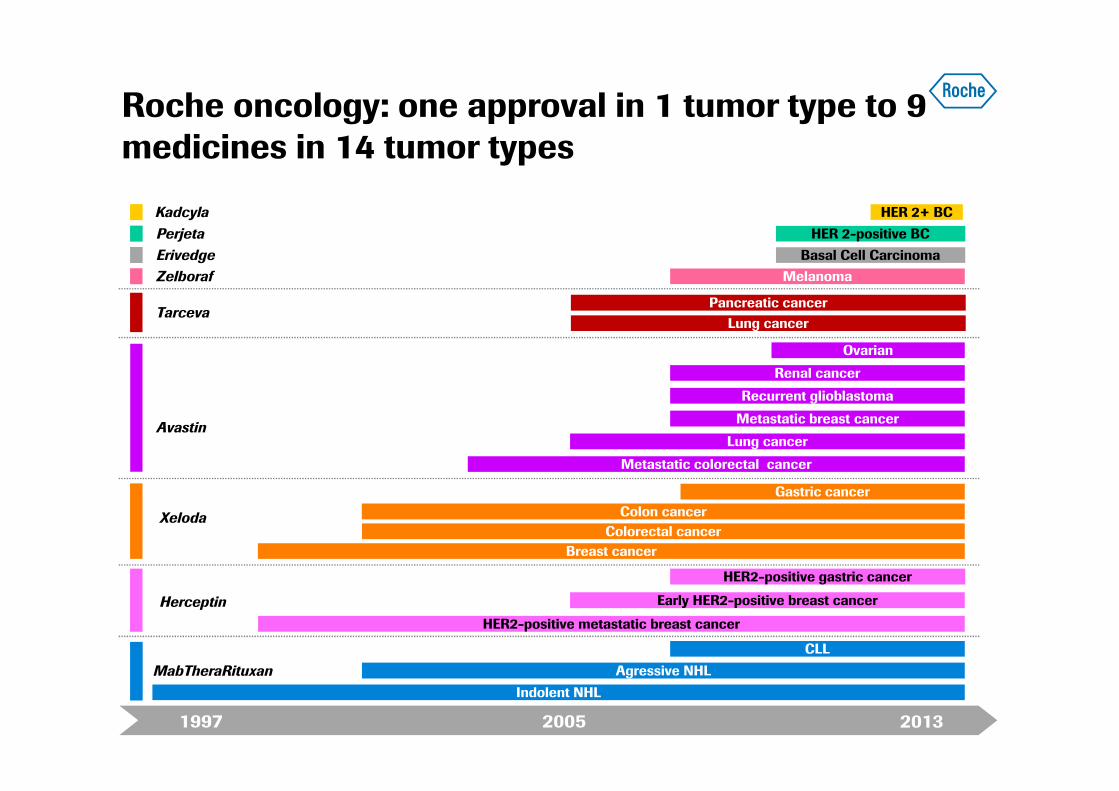
Roche oncology: one approval in 1 tumor type to 9
medicines in 14 tumor types
MabTheraRituxan
Herceptin
Xeloda
Avastin
Tarceva
1997 20132005
Kadcyla HER 2+ BC
Indolent NHL
Metastatic colorectal cancer
HER2-positive metastatic breast cancer
Breast cancer
Agressive NHL
Colorectal cancer
CLL
Perjeta HER 2-positive BC
Lung cancer
Erivedge Basal Cell Carcinoma
Lung cancer
Recurrent glioblastoma
Renal cancer
Ovarian
Early HER2-positive breast cancer
Zelboraf Melanoma
HER2-positive gastric cancer
Pancreatic cancer
Metastatic breast cancer
Colon cancer
Gastric cancer

Emerging markets remain strong
24All growth YoY at CER=Constant Exchange Rates
,0
,200
,400
,600
,800
1,000
1,200
Q1 2012 Q2 2012 Q3 2012 Q4 2012 Q1 2013
India
Russia
S. Korea
Turkey
Mexico
Brazil
China
Q1 ‘13
+11%
+20%
+5%
+7%
+18%
+9%0%
-27%
1H ‘12
+13%
2H ‘12
+15%
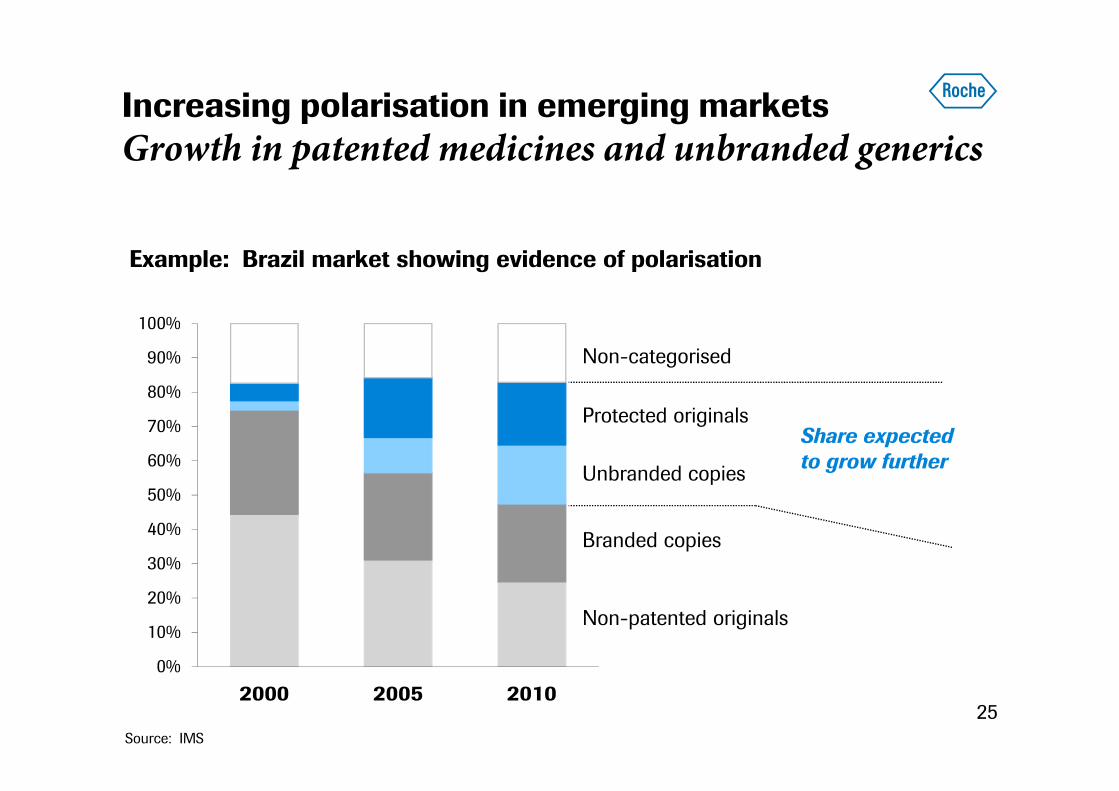
Increasing polarisation in emerging markets
Growth in patented medicines and unbranded generics
25
Example: Brazil market showing evidence of polarisation
Share expectedto grow further
Source: IMS
0%
10%
20%
30%
40%
50%
60%
70%
80%
90%
100%
2000 2005 2010
Non-categorised
Protected originals
Unbranded copies
Branded copies
Non-patented originals

Challenges and our strategy
Innovation + Sustainability
Access to healthcare
Growth platforms
Summary

dual PI3 kinase/mTOR
solid tumours
Q1 2013: Pipeline milestones
27
EGFR ADCC MAb (GA201)
solid tumours
Oncology
Neuroscience
Metabolism
Ophthalmology
PI3 kinase
solid tumours
Anti-EGFL7
solid tumours
Anti-PCSK9
metabolic diseases
crenezumab
Alzheimer's
mGluR5 antagonist
treatment-resistant depression
Anti-factor D
geographic atrophy
mGluR2 antagonist
treatment-resistant depression
Anti-PD-L1*
solid tumours
etrolizumab
ulcerative colitis
Immunology
inclacumab (P selectin)*
ACS/CVD
onartuzumab (MetMAb)
NSCLC
ocrelizumab
MS
MEKi
melanoma
obinutuzumab (GA101) *
CLL
Kadcyla
HER2+ BC
bitopertin
schizophrenia
aleglitazar
metabolic diseases
lebrikizumab
asthma
Ph III NMEs Late stage enabling data expected in 2013
gantenerumab1
Alzheimer’s
HCV combo
HepC
Virology
1Phase II/III label enabling
2013 R&D to remain stable*Data presentation planned/presented

Summary: Focus on sustainable strategy through innovation and growth
1
2Strong growth in US and Emerging Markets;
innovative access models
3 Leading product pipeline providing value for the future
Strategic focus on innovation and driving Personalised
Healthcare
28

Doing now what patients need next

Q1’ 13: US and Emerging markets driving sales
growth
30
1%
2%
13%
11%
4%
10%
Europe
Japan
US
EEMEA
Latin
America
Asia
1%
-2%
-4%
7%
10%
EMEA
Japan
North
America
Latin
America
Asia-
Pacific
Pharma Diagnostics
All growth rates at CER=Constant Exchange Rates; EEMEA=Eastern Europe, Middle East, Africa;
EMEA=Europe, Middle East and Africa