Embed Size (px)
Citation preview
Summaryand
Introduction
he United States has long been considereda leader in technological innovation.Many of the most significant innovationsof the past several decades, including inte-
grated circuits, digital computers, nylon, bioengi-neered medicines, and xerography, trace theirorigins to U.S. companies and inventors. Theseachievements reflect the efficacy of the U.S. na-tional system of innovation, with its strong sci-ence base, its entrepreneurial spirit, a financialsystem that supports a large venture capital marketunparalleled elsewhere in the world, and sophisti-cated consumers who demand new products andprocesses and whose tastes signal future changesin world demand.1 Together, these factors createthe capabilities U.S. innovators need to success-fully develop new products, processes, and ser-vices.
Over the last two decades, U.S. firms havefaced increasing competition in developing andcommercializing new inventions (see box 1-1 for
a definition of terms). Other industrialized nationshave developed robust research and development(R&D) systems that rival those of the UnitedStates in their ability to generate new scientificand technological discoveries and drive innova-tion. Many other nations with limited R&D capa-bilities have become proficient at adoptingtechnologies developed elsewhere and incorpo-rating them into new or improved products, proc-esses, and services. As a result, U.S. firms cannotrely on scientific leadership alone to maintaintheir competitive advantage in the marketplace.Despite the large number of Nobel Prizes won byU.S. scientists and the large number of patentsawarded to American inventors, foreign firmshave been able to outperform U.S. firms in somemarkets and have entirely overtaken some indus-tries by aggressively developing and commercial-izing new technologies, many of which wereinvented in U.S. laboratories by U.S. scientists.2
1 For a discussion of the factors that determine a nation’s competitive advantage, see Michael E. Porter, The Competitive Advantage of Na-
tions (New York, NY: The Free Press, 1990), pp. 69-175.
2 Several reports note growing competition in the commercialization of emerging technologies. See Competitiveness Policy Council, ACompetitiveness Strategy for America, Reports of the Subcouncils (Washington, DC: Competitiveness Policy Council, March 1993); Councilon Competitiveness, Picking Up the Pace: The Commercial Challenge to American Innovation (Washington, DC: Council on Competitiveness,1988); Report of the President’s Commission on Industrial Competitiveness, Global Competition: The New Reality (Washington, DC: U.S.Government Printing Office, January 1985).
2 Innovation and Commercialization of Emerging Technology
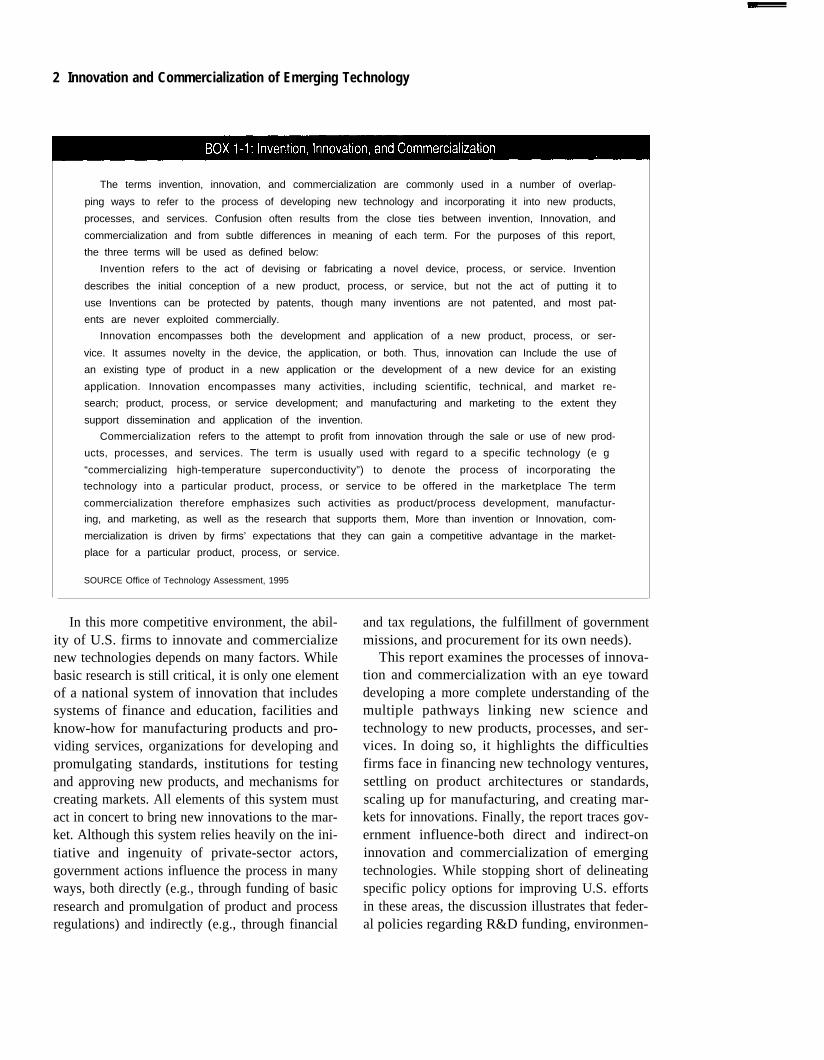
The terms invention, innovation, and commercialization are commonly used in a number of overlap-
ping ways to refer to the process of developing new technology and incorporating it into new products,
processes, and services. Confusion often results from the close ties between invention, Innovation, and
commercialization and from subtle differences in meaning of each term. For the purposes of this report,
the three terms will be used as defined below:
Invention refers to the act of devising or fabricating a novel device, process, or service. Invention
describes the initial conception of a new product, process, or service, but not the act of putting it to
use Inventions can be protected by patents, though many inventions are not patented, and most pat-
ents are never exploited commercially.
Innovation encompasses both the development and application of a new product, process, or ser-
vice. It assumes novelty in the device, the application, or both. Thus, innovation can Include the use of
an existing type of product in a new application or the development of a new device for an existing
application. Innovation encompasses many activities, including scientific, technical, and market re-
search; product, process, or service development; and manufacturing and marketing to the extent they
support dissemination and application of the invention.
Commercialization refers to the attempt to profit from innovation through the sale or use of new prod-
ucts, processes, and services. The term is usually used with regard to a specific technology (e g
“commercializing high-temperature superconductivity”) to denote the process of incorporating the
technology into a particular product, process, or service to be offered in the marketplace The term
commercialization therefore emphasizes such activities as product/process development, manufactur-
ing, and marketing, as well as the research that supports them, More than invention or Innovation, com-
mercialization is driven by firms’ expectations that they can gain a competitive advantage in the market-
place for a particular product, process, or service.
SOURCE Office of Technology Assessment, 1995
In this more competitive environment, the abil-ity of U.S. firms to innovate and commercializenew technologies depends on many factors. Whilebasic research is still critical, it is only one elementof a national system of innovation that includessystems of finance and education, facilities andknow-how for manufacturing products and pro-viding services, organizations for developing andpromulgating standards, institutions for testingand approving new products, and mechanisms forcreating markets. All elements of this system mustact in concert to bring new innovations to the mar-ket. Although this system relies heavily on the ini-tiative and ingenuity of private-sector actors,government actions influence the process in manyways, both directly (e.g., through funding of basicresearch and promulgation of product and processregulations) and indirectly (e.g., through financial
and tax regulations, the fulfillment of governmentmissions, and procurement for its own needs).
This report examines the processes of innova-tion and commercialization with an eye towarddeveloping a more complete understanding of themultiple pathways linking new science andtechnology to new products, processes, and ser-vices. In doing so, it highlights the difficultiesfirms face in financing new technology ventures,settling on product architectures or standards,scaling up for manufacturing, and creating mar-kets for innovations. Finally, the report traces gov-ernment influence-both direct and indirect-oninnovation and commercialization of emergingtechnologies. While stopping short of delineatingspecific policy options for improving U.S. effortsin these areas, the discussion illustrates that feder-al policies regarding R&D funding, environmen-
Chapter 1 Summary and Introduction | 3
tal and other regulations, intellectual property,taxation, and procurement have a significant cu-mulative effect on the success of U.S. firms in theglobal marketplace. They help create the environ-ment in which firms attempt to commercializenew technologies and form an integral part of theinnovation systems that develop in different in-dustries.
PRINCIPAL FINDINGS
❚ Linkages Between Science,Technology, and Innovation
� The linear model of innovation—which impliesthat innovation proceeds sequentially from newscientific discoveries to new products, proc-esses, and services—is limited in its descriptiveand predictive powers. Innovation can assumemany forms, including incremental improve-ments to existing products, applications of ex-isting technology to new markets, and uses ofnew technology to serve an existing market.Though typically less revolutionary, these oth-er forms of innovation are equallyimportant to the U.S. economy and nationalwell-being in terms of the performance im-provements and cost reductions they produce.
� Science plays a critical role in innovation, butis not necessarily the driver of new products,processes, and services. New ideas for innova-tion can stem from many sources, includingnew manufacturing capabilities and recogni-tion of new market needs, as well as scientificand technological discoveries. Innovation andcommercialization require considerable feed-back between science, engineering, product de-velopment, manufacturing, and marketing.
� The nature of innovation changes over time asproduct lines and industries mature. Whereasthe early stages of an industry are characterizedby radical innovations that create wholly newproducts, processes, or services and are oftenbased on new science or technology, laterstages are characterized by incremental innova-tion, which builds upon existing products,processes, and services and derives more from
advances in manufacturing capability, productdesign, and component technologies.
� Successful commercialization is not simply amatter of developing technology first or gettingto market first. While being first can bestow ad-vantages on an innovating firm, firms mustcreate and maintain a competitive advantage inthe marketplace by staking out and protectinga proprietary position through patents, trade se-crets, or market barriers, and by securing thecomplementary assets and skills needed to en-sure proper manufacturing, marketing, andsupport.
❚ Elements of Innovation Systems� Successful commercialization requires an envi-
ronment conducive to innovation and requisiteindustrial infrastructure. Institutional arrange-ments are needed to establish standards, regula-tions, and rules governing areas such asintellectual property and antitrust. Human, fi-nancial, and scientific resources are required asthe basic inputs to the innovation process.Complementary assets—both related technol-ogies and necessary skills in manufacturingand distribution—are often needed to ensurethat companies can succeed in the marketplace.Potential customers frequently need additionalassurances and warranties that new products,processes, and services will work as advertised.Policymakers cannot assume that investmentsin the science base alone will ensure economicsuccess.
� Government and industry both play a role in es-tablishing the environment and infrastructurenecessary to support innovation and commer-cialization. Government influences innovationand commercialization through tax and finan-cial policies and through the patent system.Furthermore, in fulfilling its public missions,government affects technology developmentand market acceptance through procurement,regulations to protect human health and the en-vironment, development of technologies, andfunding of basic research. The unintentional ef-fects of government actions on the innovation
4 | Innovation and Commercialization of Emerging Technology
and commercialization process must be under-stood in order to maintain a healthy economy.
❚ Increasing Competition� U.S. firms face an increasingly competitive en-
vironment for developing new science andtechnology. The United States continues to gar-ner a disproportionate share of Nobel Prizesand to patent a growing number of inventions.However, the proportion of foreign patenting inthe United States has grown, and Japanese andEuropean firms lead U.S. inventors in somecritical technologies. The Newly IndustrializedCountries (NICs) of Asia (Hong Kong, Singa-pore, South Korea, and Taiwan) are also in-creasing their technological capabilities in suchareas as telecommunications and semiconduc-tors.
� International competition in developing andmarketing new products, processes, and ser-vices has reduced U.S. market shares slightly inmost high-technology industries, demonstrat-ing the ability of foreign-based companies tosuccessfully convert new technology into mar-ketable products. Competitors from Europe,Japan, and elsewhere in Asia have penetratedmarkets in the United States and abroad for air-craft, computers, and semiconductors, in par-ticular. Nevertheless, the United Statesmaintains a trade surplus in the most advancedtechnology products.
� As a percentage of gross domestic product, to-tal U.S. expenditures on nonmilitary R&D lagthose of Japan and Germany by a wide marginand are more comparable with those of Franceand the United Kingdom. Continued reduc-tions in federal R&D expenditures and increas-ing budgetary concerns are likely to furtherreduce overall R&D spending and place a
greater burden on the private sector for main-taining the nation’s R&D investment.
� Private-sector funding for R&D has stagnatedsince 1991 as U.S. firms have attempted to re-spond to new competitive challenges. Greaterattention to short-term projects has limited sup-port for long-term R&D, and many corporatelaboratories have been scaled back or shifted tomore product-oriented work. These changeshave likely aided the recent resurgence of U.S.manufacturing industries, but raise questionsabout U.S. competitiveness in the long term.
NATIONAL INTEREST IN INNOVATIONThe United States has many reasons to maintainstrong capabilities in innovation and the commer-cialization of emerging technologies. These acti-vities confer numerous benefits on the nation.Novel technologies spur the development of newindustries and help existing industries remaincompetitive by enabling improvements that lowercosts or enhance performance. Today’s semicon-ductor and biotechnology industries both grewout of recent technological advances and nowemploy hundreds of thousands of workers in theUnited States alone, ranging from scientists, engi-neers, and managers to administrators, productionline workers, and technicians. Continuous im-provement in the styling, performance, and fueleconomy of American cars has allowed the U.S.auto industry to repel some of the advances madeby rivals in Japan, Europe, and Korea during the1980s.
Much of the nation’s growth in jobs and pro-ductivity can be traced to technological innova-tion. Economic studies estimate that technologicalchange has contributed over half of the growth ineconomic output since the Great Depression and17 percent or more of the growth in productivity
Chapter 1 Summary and Introduction | 5
since 1973.3 Increased productivity, in turn, is aprimary driver of rising wages and standards ofliving, and is one of the nation’s most effectivemeans to compete against low-wage nations suchas Mexico, Taiwan, and Malaysia. High-technolo-gy industries characterized by high levels of R&Dspending, such as pharmaceuticals, electronics,aircraft, and professional equipment, comprise agrowing portion of the national economy. Togeth-er, these industries represented 20 percent of U.S.manufacturing output and 38 percent of U.S.manufacturing exports in 1991, up from 16 and 29percent, respectively, a decade earlier.4 More im-portantly, the output of some of these industriesallows improvements in other portions of theeconomy, as demonstrated by the widespread useof information technologies in service sector jobs.
Innovation contributes to other national goalsas well. New medical devices improve humanhealth through better diagnostic and therapeuticprocedures; cleaner-burning automobile enginesand more efficient wind turbines meet transporta-tion and energy needs, while limiting damage tothe environment; advances in electronics and in-formation technology allow new forms of enter-tainment and improvements in education; andnew fighter aircraft and radar systems enhance na-tional security. Ironically, technology has alsocontributed to many of the problems or situationsthat innovation must now attempt to remedy, suchas environmental degradation (including threatsto public safety), depletion of energy and naturalresources, and the greater destructive potential ofwarfare.
To capture the full benefit of innovation, theUnited States must actively commercialize new
technologies. Only through commercializationcan the nation enjoy the benefits of job and wealthcreation. Invention alone is not sufficient. Someof the advantages of innovation can be acquired bypurchasing new products developed by foreignfirms, but neither the economic or social benefitswill be as great as if commercialization occurs athome. Licensing technology to foreign producersdoes not generate the revenues or the jobs createdby a domestic industry; nor do products, proc-esses, and services developed by foreign countriesnecessarily match the requirements of the U.S.market. U.S. semiconductor manufacturers, forexample, complained throughout the 1980s thatthey could not fully benefit from new semicon-ductor manufacturing equipment produced byleading Japanese suppliers because it was tailoredto the needs of the Japanese industry.
THE CHANGING ENVIRONMENT FORINNOVATIONThe United States remains a strong innovator. Thenation as a whole continues to spend more on re-search and development than any other nation,and patent statistics suggest that the rate of U.S.invention accelerated over the last decade. U.S.firms perform well at turning new technologiesinto successful products, processes, and servicesand dominate most markets for high-technologygoods such as aircraft, computers, and pharma-ceuticals, turning out new innovations at a stag-gering rate.
In the past, much of this success rested on thenation’s strong science base. With little competi-tion in the postwar period, U.S. firms could easilytranslate new scientific and technological break-
3 Jan Fagerberg, “Technology and International Differences in Growth Rates,” Journal of Economic Literature, September 1994, pp.1147-1175. See also Edward Mansfield, “Contribution of Research and Development to Economic Growth of the United States,” Papers andProceedings of a Colloquium on Research and Development and Economic Growth Productivity, National Science Foundation, Washington,DC, 1972; M. Ishaq Nadiri, “Contributions and Determinants of Research and Development Expenditures in the U.S. Manufacturing Indus-tries,” Capital, Efficiency and Growth, George M. von Furstenberg (ed.) (Cambridge, MA: Ballinger, 1980); Zvi Griliches, “The Search forR&D Spillovers,” National Bureau of Economic Research, Working Paper #3768, 1991; and M. Ishaq Nadiri, Innovations and TechnologicalSpillovers, Economic Research Report # 93-31, C.V. Starr Center for Applied Economics (New York, NY: New York University Press, August1993).
4 Organisation for Economic Cooperation and Development, Economic Analysis and Statistics Division, Structural Analysis Industrial
Database, No. 1, May 1994. Hereafter referred to as OECD, STAN (1), May 1994.
6 | Innovation and Commercialization of Emerging Technology
throughs into market successes. Increasingly,however, firms based in Japan, Europe, and else-where in Asia are creating a new challenge forU.S. firms. By concentrating on rapid product de-sign and manufacturing, these nations have en-tered into markets long considered the soleprovince of U.S. firms. Japanese companies havebeen first to commercialize some new products—such as liquid crystal displays—based on U.S. in-ventions. In industries with rapid productdevelopment cycles, newly industrialized coun-tries (NICs) such as Hong Kong, Singapore,South Korea, and Taiwan have at times been firstto market new generations of existing producttypes, such as 16-megabyte DRAMs5 (dynamicrandom access memories), or have followedclosely on the heels of the original innovator. Ascontinued globalization of manufacturing net-works and advances in telecommunicationstechnologies accelerate the diffusion of technolo-gy around the world, such competition will likelybecome more fierce, and U.S. firms will havemore difficulty maintaining market leadership infields they have pioneered.
Good standard indicators do not exist withwhich to gauge the effects of these changes onU.S. firms. It is difficult to measure the ability of anation’s firms to devise new products, processes,and services and bring them successfully to mar-ket. The three indicators most commonly used tomeasure innovation—patent statistics, trade sta-tistics, and R&D spending—each capture onlyone small element of the innovation and commer-cialization processes and suffer from numerousdrawbacks. Patent statistics, for example, registernew inventions that meet certain criteria for novel-ty and utility, but provide no information abouttheir economic value. Moreover, many innova-tions are not patented. In some cases, inventorsdecide that secrecy is better protection againstimitation than a patent. Also, technological prog-ress often emerges from incremental innovation,learning-by-doing, and the adaptation of existing
technologies—activities that may not be patent-able. Nevertheless, patents can be used to helpgauge the comparative inventiveness of nationsand identify particular technological strengthsand weaknesses.
Trade statistics provide some indication of thecommercial success of products, processes, andservices. The degree to which consumers preferthe output of one nation’s firms to that of anotherresults in part from the ability of those firms tosuccessfully design, develop, manufacture, andmarket innovations that meet market demand. Inhigh-technology industries such as aerospace,electronics, and pharmaceuticals, customer pref-erences are strongly influenced by the technologi-cal sophistication of new products, processes, andservices. Yet, trade performance is strongly in-fluenced by factors other than effective innovationand commercialization. Macroeconomic factorssuch as interest rates and currency fluctuations in-fluence the cost of products, processes, and ser-vices, and the ability of customers to afford them.Trade barriers, whether explicit tariffs and quotasor more subtle differences in national regulationsand customs, can affect a firm’s ability to pene-trate export markets. Despite these limitations,trade data provide one of the few output measuresof innovation and commercialization. When com-bined with patent information, trade data can helptrace the linkages between the invention of a newproduct, process, or service and its subsequentcommercialization.
R&D spending is also used to measure a na-tion’s innovative abilities because statistics arewidely available, and because R&D is one of thecentral activities of innovation. But R&D spend-ing is an input to the innovation process, not a re-sult of innovation. R&D statistics measure theamount of resources a firm or a nation dedicates toinnovation, but not their effectiveness in convert-ing that effort into successful products, processes,and services. While some correlation does existbetween R&D spending and innovative success,the relationship between the two is not always di-
5 IBM was the first to produce 16-Mbit DRAMs, but for internal consumption only.
Chapter 1 Summary and Introduction 7
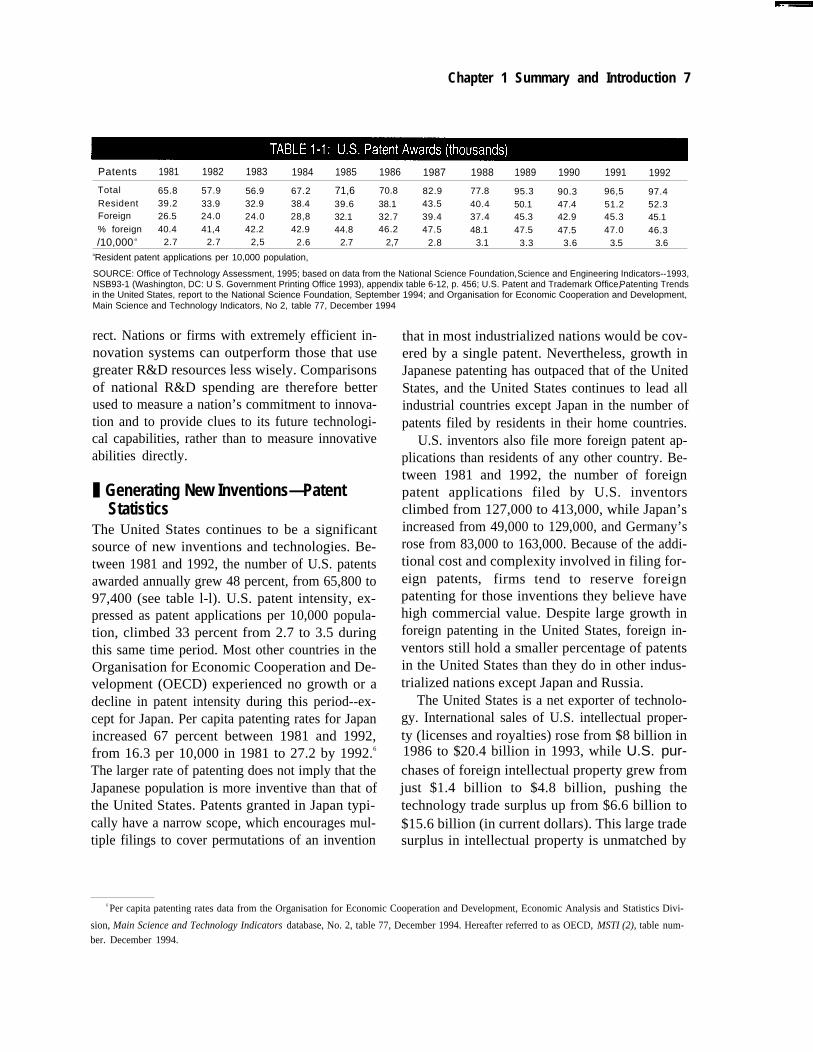
Patents 1981 1982 1983 1984 1985 1986 1987 1988 1989 1990 1991 1992
Total 65.8 57.9 56.9 67.2 71,6 70.8 82.9 77.8 95.3 90.3 96,5 97.4Resident 39.2 33.9 32.9 38.4 39.6 38.1 43.5 40.4 50.1 47.4 51.2 52.3Foreign 26.5 24.0 24.0 28,8 32.1 32.7 39.4 37.4 45.3 42.9 45.3 45.1% foreign 40.4 41,4 42.2 42.9 44.8 46.2 47.5 48.1/10,000 a
47.5 47.5 47.0 46.32.7 2.7 2,5 2.6 2.7 2,7 2.8 3.1 3.3 3.6 3.5 3.6
aResident patent applications per 10,000 population,
SOURCE: Office of Technology Assessment, 1995; based on data from the National Science Foundation, Science and Engineering Indicators--1993,NSB93-1 (Washington, DC: U S. Government Printing Office 1993), appendix table 6-12, p. 456; U.S. Patent and Trademark Office, Patenting Trendsin the United States, report to the National Science Foundation, September 1994; and Organisation for Economic Cooperation and Development,Main Science and Technology Indicators, No 2, table 77, December 1994
rect. Nations or firms with extremely efficient in-novation systems can outperform those that usegreater R&D resources less wisely. Comparisonsof national R&D spending are therefore betterused to measure a nation’s commitment to innova-tion and to provide clues to its future technologi-cal capabilities, rather than to measure innovativeabilities directly.
❚ Generating New Inventions—PatentStatistics
The United States continues to be a significantsource of new inventions and technologies. Be-tween 1981 and 1992, the number of U.S. patentsawarded annually grew 48 percent, from 65,800 to97,400 (see table l-l). U.S. patent intensity, ex-pressed as patent applications per 10,000 popula-tion, climbed 33 percent from 2.7 to 3.5 duringthis same time period. Most other countries in theOrganisation for Economic Cooperation and De-velopment (OECD) experienced no growth or adecline in patent intensity during this period--ex-cept for Japan. Per capita patenting rates for Japanincreased 67 percent between 1981 and 1992,from 16.3 per 10,000 in 1981 to 27.2 by 1992.6
The larger rate of patenting does not imply that theJapanese population is more inventive than that ofthe United States. Patents granted in Japan typi-cally have a narrow scope, which encourages mul-tiple filings to cover permutations of an invention
that in most industrialized nations would be cov-ered by a single patent. Nevertheless, growth inJapanese patenting has outpaced that of the UnitedStates, and the United States continues to lead allindustrial countries except Japan in the number ofpatents filed by residents in their home countries.
U.S. inventors also file more foreign patent ap-plications than residents of any other country. Be-tween 1981 and 1992, the number of foreignpatent applications filed by U.S. inventorsclimbed from 127,000 to 413,000, while Japan’sincreased from 49,000 to 129,000, and Germany’srose from 83,000 to 163,000. Because of the addi-tional cost and complexity involved in filing for-eign patents, firms tend to reserve foreignpatenting for those inventions they believe havehigh commercial value. Despite large growth inforeign patenting in the United States, foreign in-ventors still hold a smaller percentage of patentsin the United States than they do in other indus-trialized nations except Japan and Russia.
The United States is a net exporter of technolo-gy. International sales of U.S. intellectual proper-ty (licenses and royalties) rose from $8 billion in1986 to $20.4 billion in 1993, while U.S. pur-chases of foreign intellectual property grew fromjust $1.4 billion to $4.8 billion, pushing thetechnology trade surplus up from $6.6 billion to$15.6 billion (in current dollars). This large tradesurplus in intellectual property is unmatched by
6 Per capita patenting rates data from the Organisation for Economic Cooperation and Development, Economic Analysis and Statistics Divi-
sion, Main Science and Technology Indicators database, No. 2, table 77, December 1994. Hereafter referred to as OECD, MSTI (2), table num-ber. December 1994.
8 I Innovation and Commercialization of Emerging Technology
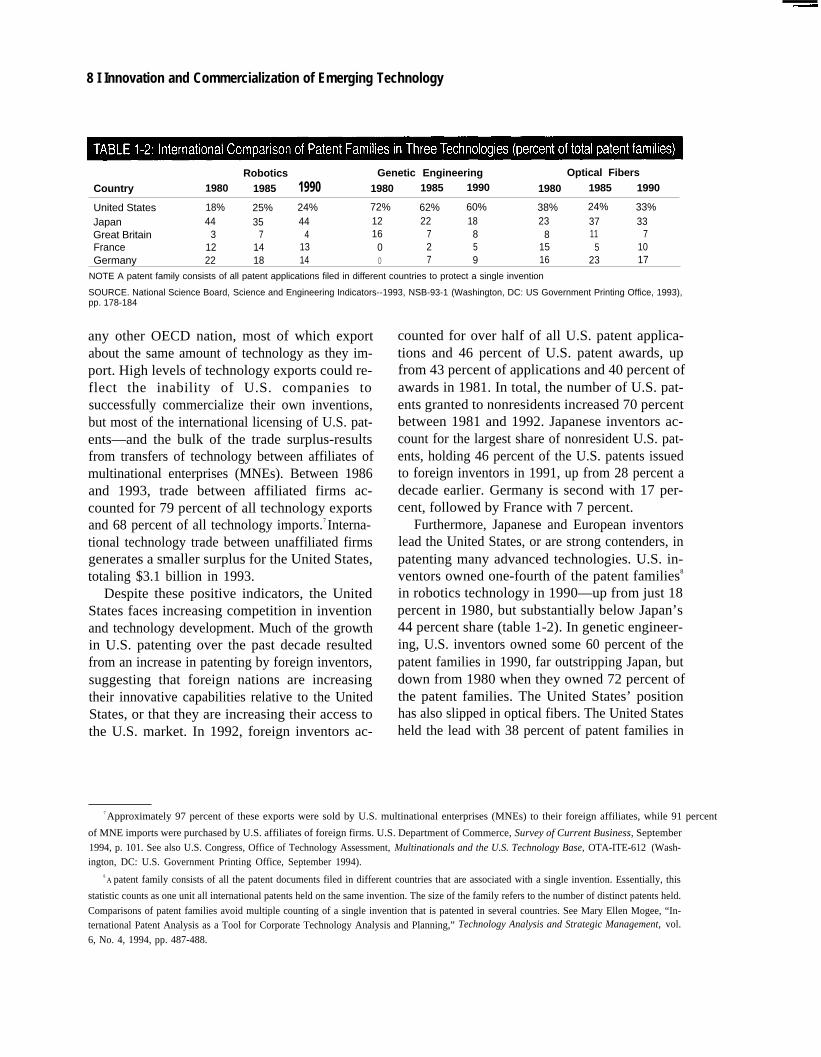
Robotics Genetic Engineering Optical Fibers
Country 1980 1985 1990 1980 1985 1990 1980 1985 1990
United States 18% 25% 24% 72% 62% 60% 38% 24% 33%Japan 44 35 44 12 22 18 23 37 33Great Britain 3 7 4 16 7 8 8 11 7France 12 14 13 0 2 5 15 5 10Germany 22 18 14 0 7 9 16 23 17
NOTE A patent family consists of all patent applications filed in different countries to protect a single invention
SOURCE. National Science Board, Science and Engineering Indicators--1993, NSB-93-1 (Washington, DC: US Government Printing Office, 1993),pp. 178-184
any other OECD nation, most of which exportabout the same amount of technology as they im-port. High levels of technology exports could re-flect the inability of U.S. companies tosuccessfully commercialize their own inventions,but most of the international licensing of U.S. pat-ents—and the bulk of the trade surplus-resultsfrom transfers of technology between affiliates ofmultinational enterprises (MNEs). Between 1986and 1993, trade between affiliated firms ac-counted for 79 percent of all technology exportsand 68 percent of all technology imports.7 Interna-tional technology trade between unaffiliated firmsgenerates a smaller surplus for the United States,totaling $3.1 billion in 1993.
Despite these positive indicators, the UnitedStates faces increasing competition in inventionand technology development. Much of the growthin U.S. patenting over the past decade resultedfrom an increase in patenting by foreign inventors,suggesting that foreign nations are increasingtheir innovative capabilities relative to the UnitedStates, or that they are increasing their access tothe U.S. market. In 1992, foreign inventors ac-
counted for over half of all U.S. patent applica-tions and 46 percent of U.S. patent awards, upfrom 43 percent of applications and 40 percent ofawards in 1981. In total, the number of U.S. pat-ents granted to nonresidents increased 70 percentbetween 1981 and 1992. Japanese inventors ac-count for the largest share of nonresident U.S. pat-ents, holding 46 percent of the U.S. patents issuedto foreign inventors in 1991, up from 28 percent adecade earlier. Germany is second with 17 per-cent, followed by France with 7 percent.
Furthermore, Japanese and European inventorslead the United States, or are strong contenders, inpatenting many advanced technologies. U.S. in-ventors owned one-fourth of the patent families8
in robotics technology in 1990—up from just 18percent in 1980, but substantially below Japan’s44 percent share (table 1-2). In genetic engineer-ing, U.S. inventors owned some 60 percent of thepatent families in 1990, far outstripping Japan, butdown from 1980 when they owned 72 percent ofthe patent families. The United States’ positionhas also slipped in optical fibers. The United Statesheld the lead with 38 percent of patent families in
7 Approximately 97 percent of these exports were sold by U.S. multinational enterprises (MNEs) to their foreign affiliates, while 91 percent
of MNE imports were purchased by U.S. affiliates of foreign firms. U.S. Department of Commerce, Survey of Current Business, September1994, p. 101. See also U.S. Congress, Office of Technology Assessment, Multinationals and the U.S. Technology Base, OTA-ITE-612 (Wash-ington, DC: U.S. Government Printing Office, September 1994).
8 A patent family consists of all the patent documents filed in different countries that are associated with a single invention. Essentially, this
statistic counts as one unit all international patents held on the same invention. The size of the family refers to the number of distinct patents held.
Comparisons of patent families avoid multiple counting of a single invention that is patented in several countries. See Mary Ellen Mogee, “In-ternational Patent Analysis as a Tool for Corporate Technology Analysis and Planning,” Technology Analysis and Strategic Management, vol.
6, No. 4, 1994, pp. 487-488.
Chapter 1 Summary and Introduction 19
3 -
2 -
1
0
-1-■ United States
- 2 - ▲ J a p a n
● Germany-3
◆ Total U.S. manufacturing
-4 I I I I I I I I [ I I I I I I I I I I I {
1970 1972 1974 1976 1978 1980 1982 1984 1986 1988 1990 1992
NOTE: High-technology trade balances encompass trade in six industries with the highest ratios of R&D expenditures to sales on a global basisdrugs and medicines, office and computing equipment, electrical machinery, electronic components and equipment, aerospace, and scientific andprofessional equipment.
SOURCE: Organisation for Economic Cooperation and Development, Scoreboard Indicators, No 2, tables 9, 14, 25,29, December 1994
1980, but Japan achieved parity by 1990 wheneach nation held 33 percent of the patent families.
Newly industrialized countries of Hong Kong,Singapore, South Korea, and Taiwan have also in-creased their patenting activity. Between 1985 and1990, the total number of patents awarded bythese nations more than doubled from 13,100 to32,500—more than one-third the number of pat-ents awarded by the United States. Awards to resi-dents and nonresidents are relatively balanced,with nonresident awards outnumbering residentawards by a factor of 1.37. Among the most activepatent classes are amplifiers, telecommunica-tions, semiconductor manufacturing processes,and dynamic magnetic information storage or re-trieval. 9
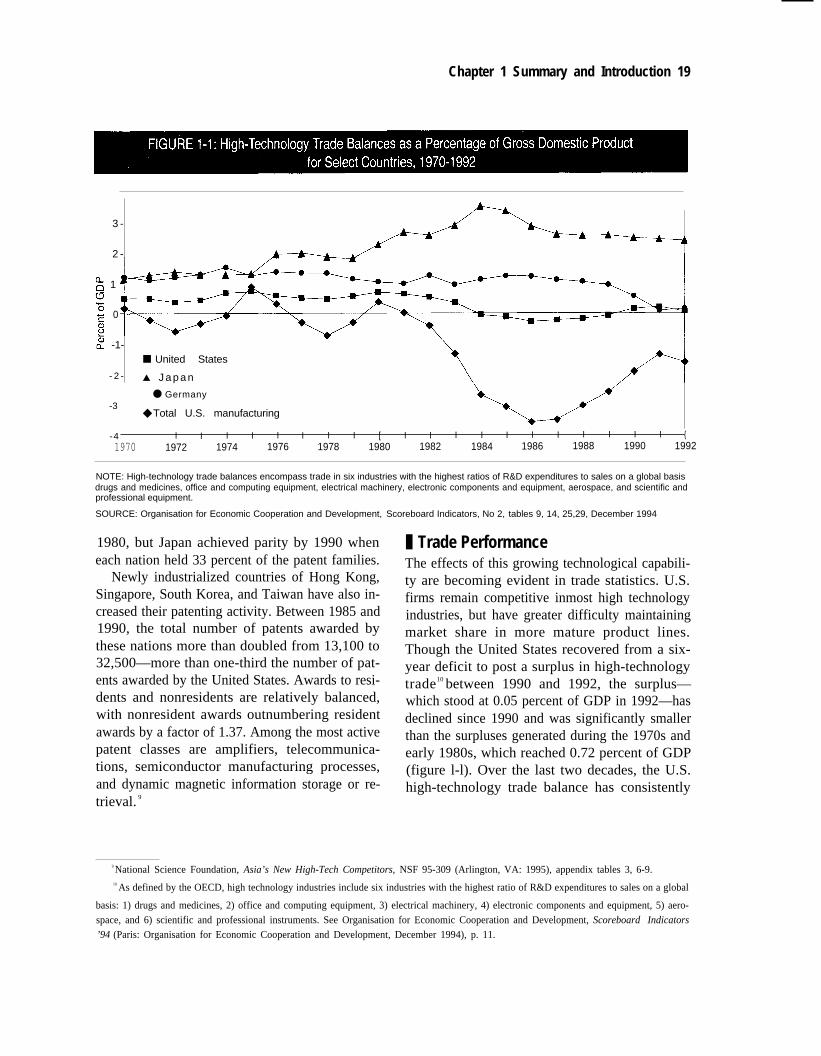
❚ Trade PerformanceThe effects of this growing technological capabili-ty are becoming evident in trade statistics. U.S.firms remain competitive inmost high technologyindustries, but have greater difficulty maintainingmarket share in more mature product lines.Though the United States recovered from a six-year deficit to post a surplus in high-technologytrade10 between 1990 and 1992, the surplus—which stood at 0.05 percent of GDP in 1992—hasdeclined since 1990 and was significantly smallerthan the surpluses generated during the 1970s andearly 1980s, which reached 0.72 percent of GDP(figure l-l). Over the last two decades, the U.S.high-technology trade balance has consistently
9 National Science Foundation, Asia’s New High-Tech Competitors, NSF 95-309 (Arlington, VA: 1995), appendix tables 3, 6-9.10 As defined by the OECD, high technology industries include six industries with the highest ratio of R&D expenditures to sales on a global
basis: 1) drugs and medicines, 2) office and computing equipment, 3) electrical machinery, 4) electronic components and equipment, 5) aero-space, and 6) scientific and professional instruments. See Organisation for Economic Cooperation and Development, Scoreboard Indicators
’94 (Paris: Organisation for Economic Cooperation and Development, December 1994), p. 11.
10 I Innovation and Commercialization of Emerging ‘Technology
Imports Exports Balance a
——— —.. —Computer Equipment
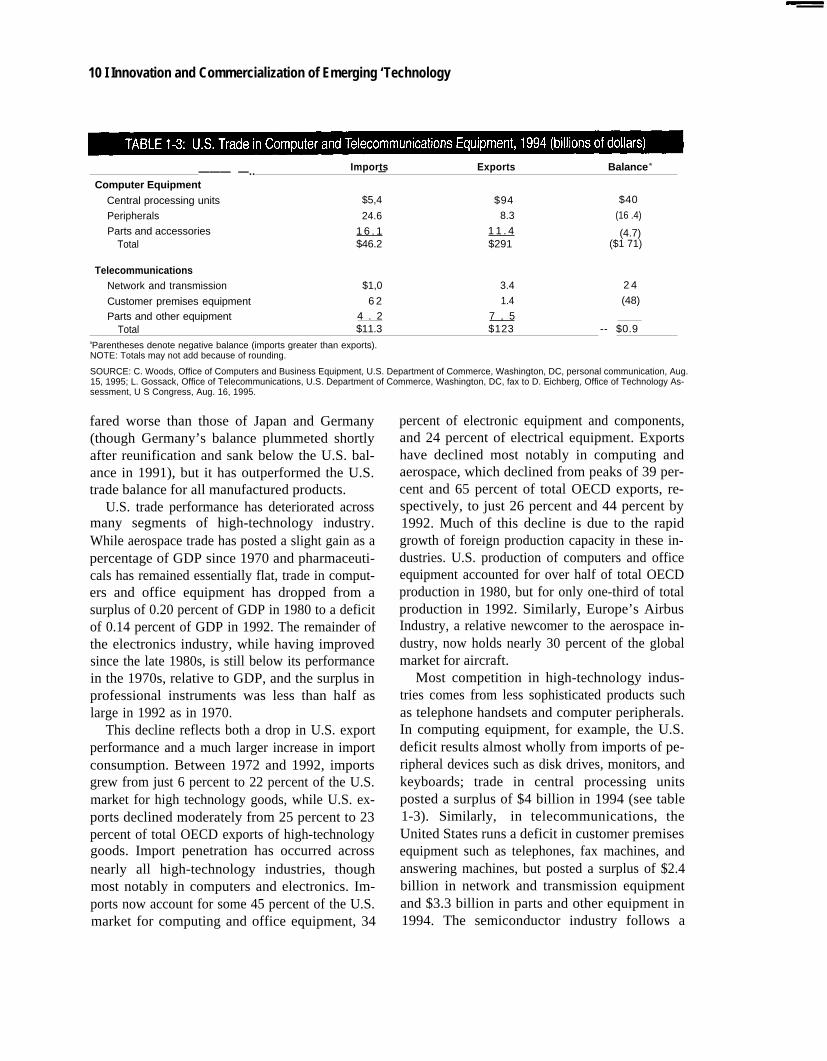
Central processing units $5,4 $94 $40
Peripherals 24.6 8.3 (16 .4)
Parts and accessories 1 6 . 1 1 1 . 4 (4.7)Total $46.2 $291 ($1 71)
TelecommunicationsNetwork and transmission $1,0 3.4 2 4
Customer premises equipment 6 2 1.4 (48)
Parts and other equipment 4 . 2 7 , 5Total $11.3 $123 -- $0.9
aParentheses denote negative balance (imports greater than exports).NOTE: Totals may not add because of rounding.
SOURCE: C. Woods, Office of Computers and Business Equipment, U.S. Department of Commerce, Washington, DC, personal communication, Aug.15, 1995; L. Gossack, Office of Telecommunications, U.S. Department of Commerce, Washington, DC, fax to D. Eichberg, Office of Technology As-sessment, U S Congress, Aug. 16, 1995.
fared worse than those of Japan and Germany(though Germany’s balance plummeted shortlyafter reunification and sank below the U.S. bal-ance in 1991), but it has outperformed the U.S.trade balance for all manufactured products.
U.S. trade performance has deteriorated acrossmany segments of high-technology industry.While aerospace trade has posted a slight gain as apercentage of GDP since 1970 and pharmaceuti-cals has remained essentially flat, trade in comput-ers and office equipment has dropped from asurplus of 0.20 percent of GDP in 1980 to a deficitof 0.14 percent of GDP in 1992. The remainder ofthe electronics industry, while having improvedsince the late 1980s, is still below its performancein the 1970s, relative to GDP, and the surplus inprofessional instruments was less than half aslarge in 1992 as in 1970.
This decline reflects both a drop in U.S. exportperformance and a much larger increase in importconsumption. Between 1972 and 1992, importsgrew from just 6 percent to 22 percent of the U.S.market for high technology goods, while U.S. ex-ports declined moderately from 25 percent to 23percent of total OECD exports of high-technologygoods. Import penetration has occurred acrossnearly all high-technology industries, thoughmost notably in computers and electronics. Im-ports now account for some 45 percent of the U.S.market for computing and office equipment, 34
percent of electronic equipment and components,and 24 percent of electrical equipment. Exportshave declined most notably in computing andaerospace, which declined from peaks of 39 per-cent and 65 percent of total OECD exports, re-spectively, to just 26 percent and 44 percent by1992. Much of this decline is due to the rapidgrowth of foreign production capacity in these in-dustries. U.S. production of computers and officeequipment accounted for over half of total OECDproduction in 1980, but for only one-third of totalproduction in 1992. Similarly, Europe’s AirbusIndustry, a relative newcomer to the aerospace in-dustry, now holds nearly 30 percent of the globalmarket for aircraft.
Most competition in high-technology indus-tries comes from less sophisticated products suchas telephone handsets and computer peripherals.In computing equipment, for example, the U.S.deficit results almost wholly from imports of pe-ripheral devices such as disk drives, monitors, andkeyboards; trade in central processing unitsposted a surplus of $4 billion in 1994 (see table1-3). Similarly, in telecommunications, theUnited States runs a deficit in customer premisesequipment such as telephones, fax machines, andanswering machines, but posted a surplus of $2.4billion in network and transmission equipmentand $3.3 billion in parts and other equipment in1994. The semiconductor industry follows a

Chapter 1 Summary and Introduction 11
Field Exports Imports Balance a
Advanced materials
Aerospace
Biotechnology
Electronics
Flexible manufacturing
Information and communications
Life science
Nuclear technology
Optoelectronics
Weapons
Total
$0.9
35.01,0
25.8
5.2
42,9
6.8
1.6
0.9
0.7
$120.8
$06
11,4
01
259
2 9
49,9
4.8
0
2,5
0.1
$98.4
$02
236
1 0
(o 1)
2 3
(7 o)
2 0
1,5
(1 6)
0 6
$224aParentheses denote negative balance (Imports greater than exports)NOTE: Totals may not add because of rounding
SOURCE: Nick Orsini, Foreign Trade Division, Bureau of the Census, U.S. Department of Commerce, Washington, DC, fax to J Sheehan, Off Ice ofTechnology Assessment, U S Congress, Washington, DC, Mar 8, 1995
similar pattern. While U.S. semiconductormanufacturers lagged far beyond Japan in 1992with an 18.2-percent share of the world market fordynamic random access memories, a commoditymemory chip for computers, they dominated themarket for microprocessors with a 69-percentmarket share. 11
U.S. firms perform better in products that in-corporate leading-edge technology. Trade in ad-vanced technology products, as defined by theU.S. Bureau of the Census,12 posted a surplus of$22.4 billion in 1994; however, the surplus has de-clined 46 percent in real terms since its peak in1991. Advanced technology products comprise agrowing portion of U.S. trade. The total volume oftrade (imports plus exports) accounted for by ad-vanced technology products grew from 12 percentof total U.S. merchandise trade in 1982 to 18.7percent in 1994. At the same time, advancedtechnology trade grew from 1.7 percent to 3.3 per-
cent of U.S. GDP, demonstrating the growing im-portance of these products to the U.S. economy.Most of the current surplus is generated by trade inaerospace, which includes exports of U.S. mili-tary—as well as civilian—aircraft; in other areasof great importance to the economy, such as in-formation and communications technology andoptoelectronics, the United States runs a deficit(see table 1-4).
❚ Research and Development SpendingTrends in research and development spending alsoindicate growing competition. In absolute terms,the United States remains the world leader inR&D spending. Private and public expenditureson R&D totaled almost $173 billion in 1994. Onaverage, between 1981 and 1992, U.S. R&Dspending, measured in terms of purchasing powerparity, was six times higher than that of Germanyand 1.5 times higher than that of Japan. ] 3 In
11 Daraquest, “Final 1992 Worldwide Market Share,” 1993.12Trade statistics for advanced technology products are collected and published by the U.S. Bureau of the Census. The measure attempts to
account for the mix of high- and low-technology products contained within industrial trade data by including only those products that incorpo-rate significant amounts of one or more leading-edge technologies, as determined by bureau analysts. The product mix changes annually, re-flecting new technological developments. While it excludes some products manufactured by high-technology industries (such as telephoneanswering machines), it includes products such as advanced materials and nuclear technology that are not reflected in the OECD trade data.
13 Data from OECD, MSTI (2), table 2, December 1994.
12 Innovation and Commercialization of Emerging Technology
2.8
2.6
2.4
1.6
1.4
1.2
1
1
● ●
■ United States
▲ J a p a n
● Germany
◆ F r a n c e
● United Kingdom
I 1 I I 1 I
I
b
1970 1972 1974 1976 1978 1980 1982 1984 1986 1988 1990 1992
— .
NOTE: Data for Germany Include the former East Germany after 1990
SOURCE: National Science Foundation, National Patterns of R&D Resources 1994 (Arlington, VA 1995), table B-20, p 77
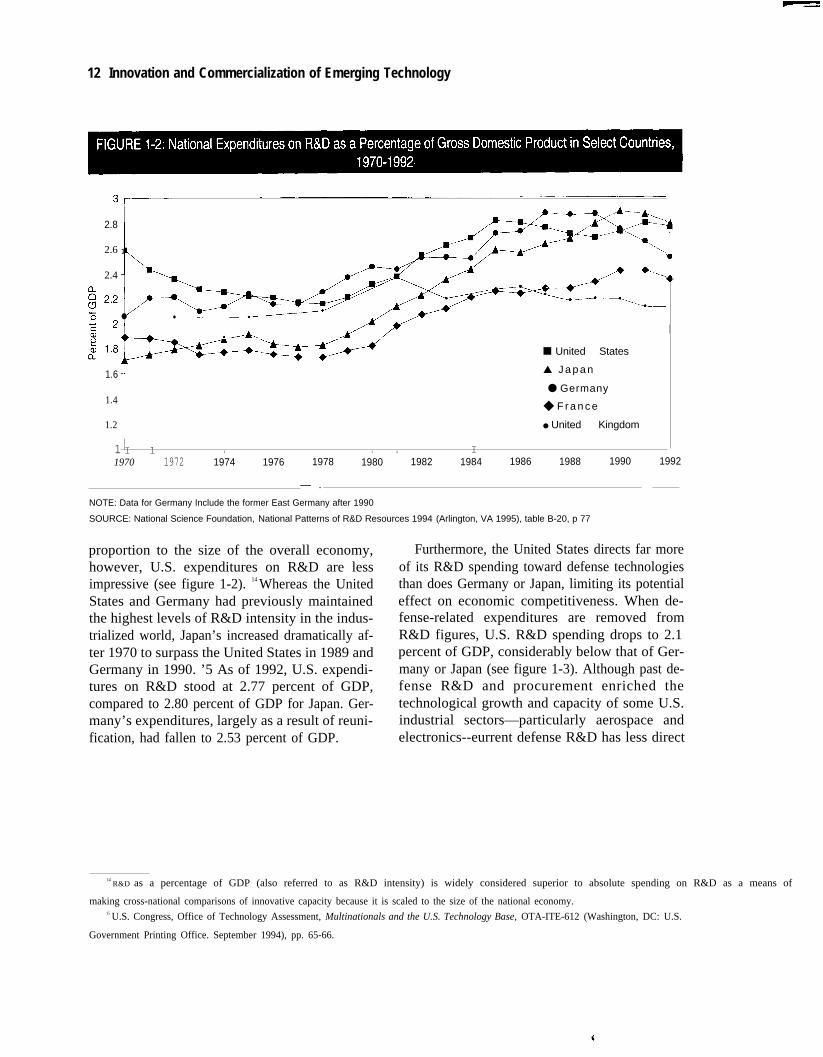
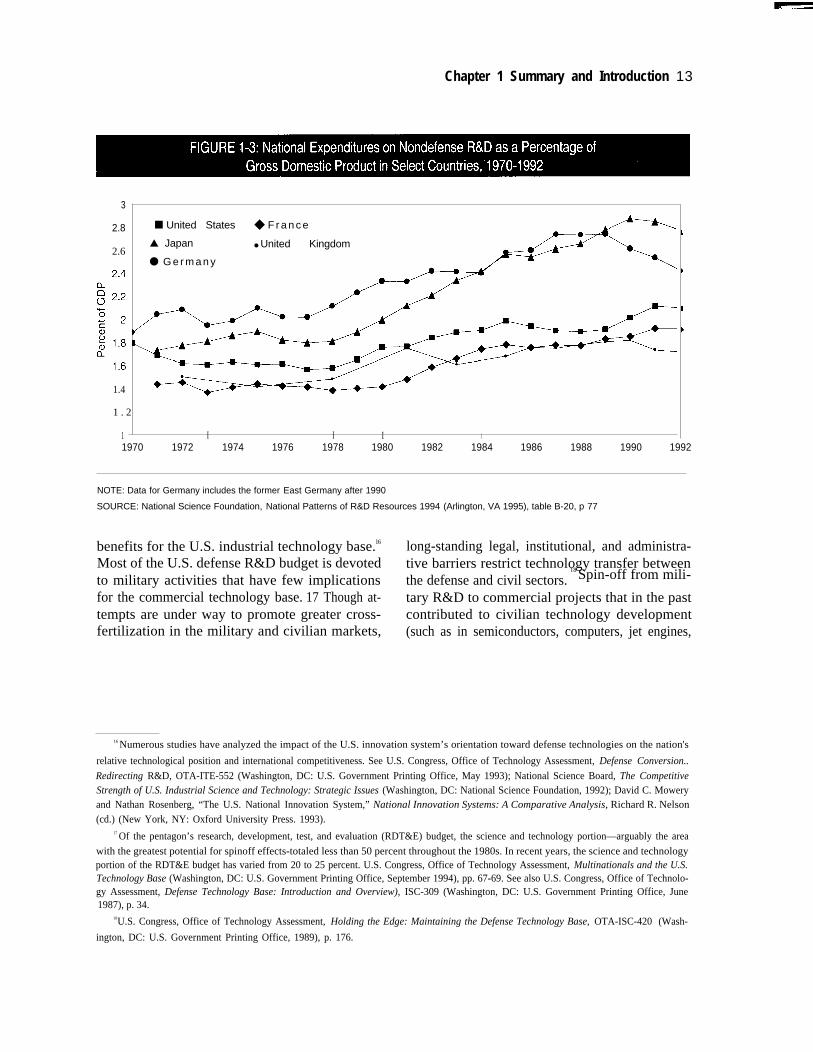
proportion to the size of the overall economy, Furthermore, the United States directs far morehowever, U.S. expenditures on R&D are less of its R&D spending toward defense technologiesimpressive (see figure 1-2). 14 Whereas the United than does Germany or Japan, limiting its potentialStates and Germany had previously maintained effect on economic competitiveness. When de-the highest levels of R&D intensity in the indus- fense-related expenditures are removed fromtrialized world, Japan’s increased dramatically af- R&D figures, U.S. R&D spending drops to 2.1ter 1970 to surpass the United States in 1989 and percent of GDP, considerably below that of Ger-Germany in 1990. ’5 As of 1992, U.S. expendi- many or Japan (see figure 1-3). Although past de-tures on R&D stood at 2.77 percent of GDP, fense R&D and procurement enriched thecompared to 2.80 percent of GDP for Japan. Ger- technological growth and capacity of some U.S.many’s expenditures, largely as a result of reuni- industrial sectors—particularly aerospace andfication, had fallen to 2.53 percent of GDP. electronics--eurrent defense R&D has less direct
14 R&D as a percentage of GDP (also referred to as R&D intensity) is widely considered superior to absolute spending on R&D as a means of
making cross-national comparisons of innovative capacity because it is scaled to the size of the national economy.15 U.S. Congress, Office of Technology Assessment, Multinationals and the U.S. Technology Base, OTA-ITE-612 (Washington, DC: U.S.
Government Printing Office. September 1994), pp. 65-66.
Chapter 1 Summary and Introduction 13
3
2.8
2.6
1.4
■ United States ◆ F r a n c e
▲ Japan ● United Kingdom
● G e r m a n y
1 . 2
1 I I I I
1970 1972 1974 1976 1978 1980 1982 1984 1986 1988 1990 1992
NOTE: Data for Germany includes the former East Germany after 1990
SOURCE: National Science Foundation, National Patterns of R&D Resources 1994 (Arlington, VA 1995), table B-20, p 77
benefits for the U.S. industrial technology base.l6 long-standing legal, institutional, and administra-Most of the U.S. defense R&D budget is devoted tive barriers restrict technology transfer between
18 Spin-off from mili-to military activities that have few implications the defense and civil sectors.for the commercial technology base. 17 Though at- tary R&D to commercial projects that in the pasttempts are under way to promote greater cross- contributed to civilian technology developmentfertilization in the military and civilian markets, (such as in semiconductors, computers, jet engines,
16 Numerous studies have analyzed the impact of the U.S. innovation system’s orientation toward defense technologies on the nation's
relative technological position and international competitiveness. See U.S. Congress, Office of Technology Assessment, Defense Conversion..
Redirecting R&D, OTA-ITE-552 (Washington, DC: U.S. Government Printing Office, May 1993); National Science Board, The CompetitiveStrength of U.S. Industrial Science and Technology: Strategic Issues (Washington, DC: National Science Foundation, 1992); David C. Moweryand Nathan Rosenberg, “The U.S. National Innovation System,” National Innovation Systems: A Comparative Analysis, Richard R. Nelson(cd.) (New York, NY: Oxford University Press. 1993).
17 Of the pentagon’s research, development, test, and evaluation (RDT&E) budget, the science and technology portion—arguably the area
with the greatest potential for spinoff effects-totaled less than 50 percent throughout the 1980s. In recent years, the science and technologyportion of the RDT&E budget has varied from 20 to 25 percent. U.S. Congress, Office of Technology Assessment, Multinationals and the U.S.Technology Base (Washington, DC: U.S. Government Printing Office, September 1994), pp. 67-69. See also U.S. Congress, Office of Technolo-gy Assessment, Defense Technology Base: Introduction and Overview), ISC-309 (Washington, DC: U.S. Government Printing Office, June1987), p. 34.
18U.S. Congress, Office of Technology Assessment, Holding the Edge: Maintaining the Defense Technology Base, OTA-ISC-420 (Wash-
ington, DC: U.S. Government Printing Office, 1989), p. 176.
14 I Innovation and Commercialization of Emerging Technology
80 I I 60%
72 74 76 78 80 82 84 86
1
■
�
90 92 94
❏ Federal R&D ■ Federal R&D as a percent of total R&D
NOTE Data for Germany include the former East Germany after 1990
SOURCE National Science Foundation, National Patterns of R&D Resources’ 1994 (Arlington, VA: 1995), tables B-1, B-3, pp. 53, 57
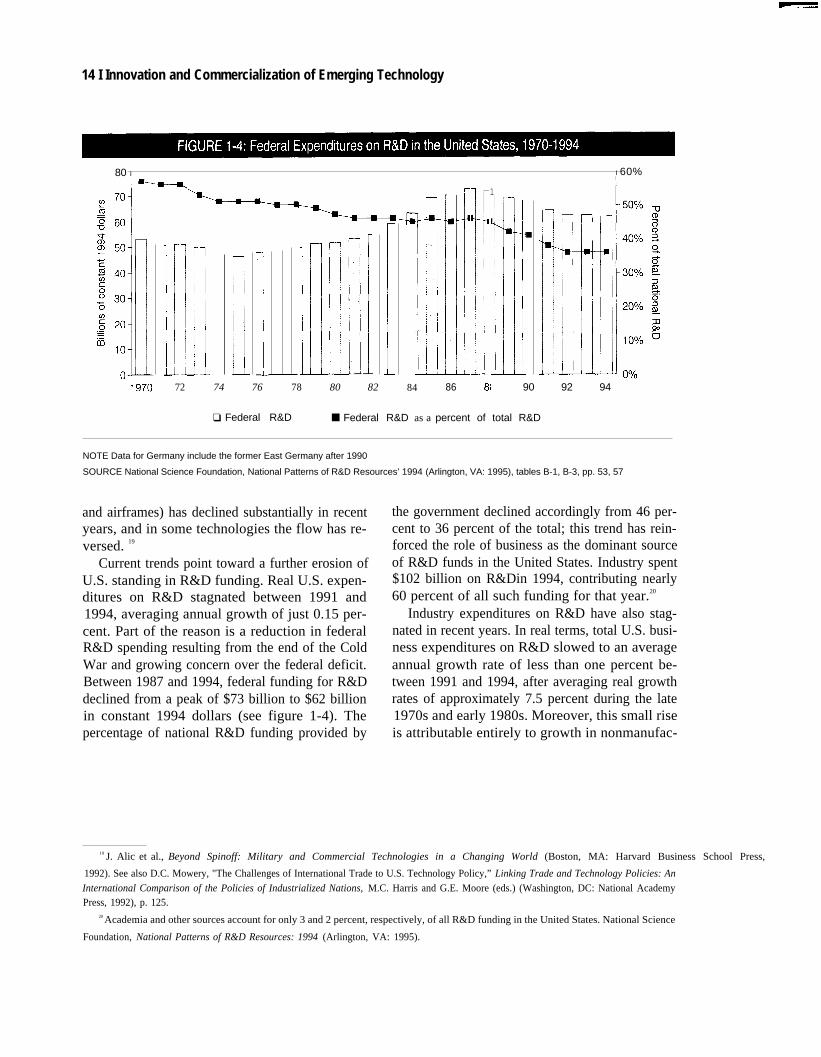
and airframes) has declined substantially in recentyears, and in some technologies the flow has re-versed. 19
Current trends point toward a further erosion ofU.S. standing in R&D funding. Real U.S. expen-ditures on R&D stagnated between 1991 and1994, averaging annual growth of just 0.15 per-cent. Part of the reason is a reduction in federalR&D spending resulting from the end of the ColdWar and growing concern over the federal deficit.Between 1987 and 1994, federal funding for R&Ddeclined from a peak of $73 billion to $62 billionin constant 1994 dollars (see figure 1-4). Thepercentage of national R&D funding provided by
the government declined accordingly from 46 per-cent to 36 percent of the total; this trend has rein-forced the role of business as the dominant sourceof R&D funds in the United States. Industry spent$102 billion on R&Din 1994, contributing nearly60 percent of all such funding for that year.20
Industry expenditures on R&D have also stag-nated in recent years. In real terms, total U.S. busi-ness expenditures on R&D slowed to an averageannual growth rate of less than one percent be-tween 1991 and 1994, after averaging real growthrates of approximately 7.5 percent during the late1970s and early 1980s. Moreover, this small riseis attributable entirely to growth in nonmanufac-
19 J. Alic et al., Beyond Spinoff: Military and Commercial Technologies in a Changing World (Boston, MA: Harvard Business School Press,
1992). See also D.C. Mowery, "The Challenges of International Trade to U.S. Technology Policy,” Linking Trade and Technology Policies: An
International Comparison of the Policies of Industrialized Nations, M.C. Harris and G.E. Moore (eds.) (Washington, DC: National AcademyPress, 1992), p. 125.
20 Academia and other sources account for only 3 and 2 percent, respectively, of all R&D funding in the United States. National Science
Foundation, National Patterns of R&D Resources: 1994 (Arlington, VA: 1995).
Chapter 1 Summary and Introduction | 15
turing industries, which posted real annual growthrates of 26 percent from 1987 to 1992.21 Real ratesof R&D spending in manufacturing industries de-clined an average of 2 percent per year throughoutmost of this period, due primarily to cutbacks intransportation equipment, electronic and otherelectric equipment, petroleum refining and ex-traction, and industrial machinery and equipment.Despite the current economic expansion, realR&D spending declined 0.2 percent in 1994, andrecent surveys predict only a modest increase in1995.22
As a result of such cutbacks, the U.S. share ofOECD expenditures on R&D in high technologyindustries declined from 63 percent in 1973 to 50percent in 1992, driven by substantial declines inall high-technology sectors except pharmaceuti-cals and instruments. Similarly, in mediumtechnology industries23 the U.S. share decreasedfrom 48 to 37 percent, with long-term declines inall sectors except industrial chemicals and trans-portation equipment (excluding motor vehicles).In many high-technology industries, such as aero-space, electronic equipment and components, andto a lesser extent pharmaceuticals, U.S. R&Dspending has not kept pace with value added. Av-
erage U.S. R&D intensity levels in high technolo-gy industries were substantially above most othermajor industrial nations for most of the 1970s and1980s, but they declined from 0.28 in 1985 to 0.22in 1992, to approximately the level of France andthe United Kingdom, though they still exceedthose of Japan and Germany.24
❚ Changing R&D PrioritiesIn response to increasing competitive pressures,U.S. firms have begun to alter their R&D patterns.Firms have shifted a greater portion of their R&Dresources away from long-term investments andtoward shorter term projects. Recent evidence in-dicates that U.S. companies now allocate only 22percent of their R&D spending to long-term proj-ects, compared with their Japanese counterpartswho devote 50 percent.25 Increasingly, firms areemphasizing short-term R&D for immediateproblem-solving or near-term development overbasic research; and basic research is being directedtoward the needs of product development andmanufacturing teams.26 Many central researchlaboratories at large companies—such as AT&T,IBM, General Electric, Kodak, and Xerox—havebeen downsized and work more closely with prod-
21 There is considerable uncertainty associated with R&D figures for the nonmanufacturing sector. Such data have only recently been col-lected and as a result may overestimate growth rates. Nevertheless, nonmanufacturing R&D comprises about one-fourth of total U.S. R&Dexpenditures. These figures include R&D expenditures in communications, utility, engineering, architectural, research, development, testing,computer programming, and data processing service industries, as well as hospitals and medical labs. National Science Foundation, NationalPatterns of R&D Resources: 1994 (Arlington, VA: 1995).
22 See Industrial Research Institute, Annual R&D Trends Forecast (Washington, DC: Industrial Research Institute, November 1994); Jules
Duga, Steve Millett, and Tim Studt, “Battelle-R&D Magazine 1995 R&D Forecast,” Battelle Today, April 1995, pp. 4-7.
23 OECD defines medium technology industries to include nonpharmaceutical chemicals, rubber and plastics, nonferrous metals, nonelec-
trical machinery, motor vehicles and other transportation equipment, and other manufacturing.
24 OECD, MSTI (2), December 1994, op. cit., footnote 6; sectoral R&D intensities expressed as R&D divided by value added.
25 Erich Bloch and Mark S. Mahaney, “U.S. Research Effort Steers New Course,” Forum for Applied Research and Public Policy, spring
1995, p. 124.
26 Duga et al., op. cit., footnote 22, p. 7. A recent survey by the Industrial Research Institute also demonstrates cutbacks in basic researchamid overall increases in R&D. See Industrial Research Institute, Annual R&D Trends Forecast (Washington, DC: IRI, November 1994); seealso M.F. Wolff, “U.S. Industry Spent $124B on R&D Last Year, as Real-Dollar Decline Appears to Level Off,” Research-Technology Manage-ment, vol. 38, number 3, May-June 1995, pp. 2-3.
16 | Innovation and Commercialization of Emerging Technology
uct development divisions.27 They now receive alarger share of their operating funds from individ-ual business units rather than general corporatefunds.28 Even in strongly science-based indus-tries, such as chemicals and pharmaceuticals, ba-sic research declined from 1988 to 1993.29
Collaboration between firms—through jointventures, consortia, and outsourcing—is on therise as firms attempt to distribute risk, pool re-sources, and tap into necessary sources of exper-tise required to design and manufactureincreasingly complex products.30 Alliance strate-gies have become particularly common in bio-technology, as large pharmaceutical firms withdiverse product portfolios and powerful testingand marketing resources combine with smallerbiotechnology firms with leading-edge, nichetechnologies. Alliance strategies are also beingused heavily in information, communication, andadvanced electronics industries, in which firmsneed to maintain access to a rapidly changing andexpanding set of product and process technolo-gies. The magnitude of alliance formation is diffi-cult to gauge, as are the implications forinnovation and commercialization of new tech-nologies in the United States; however, thesealliances are likely to quicken the rate of technol-
ogy diffusion across firms, industries, and na-tions.31
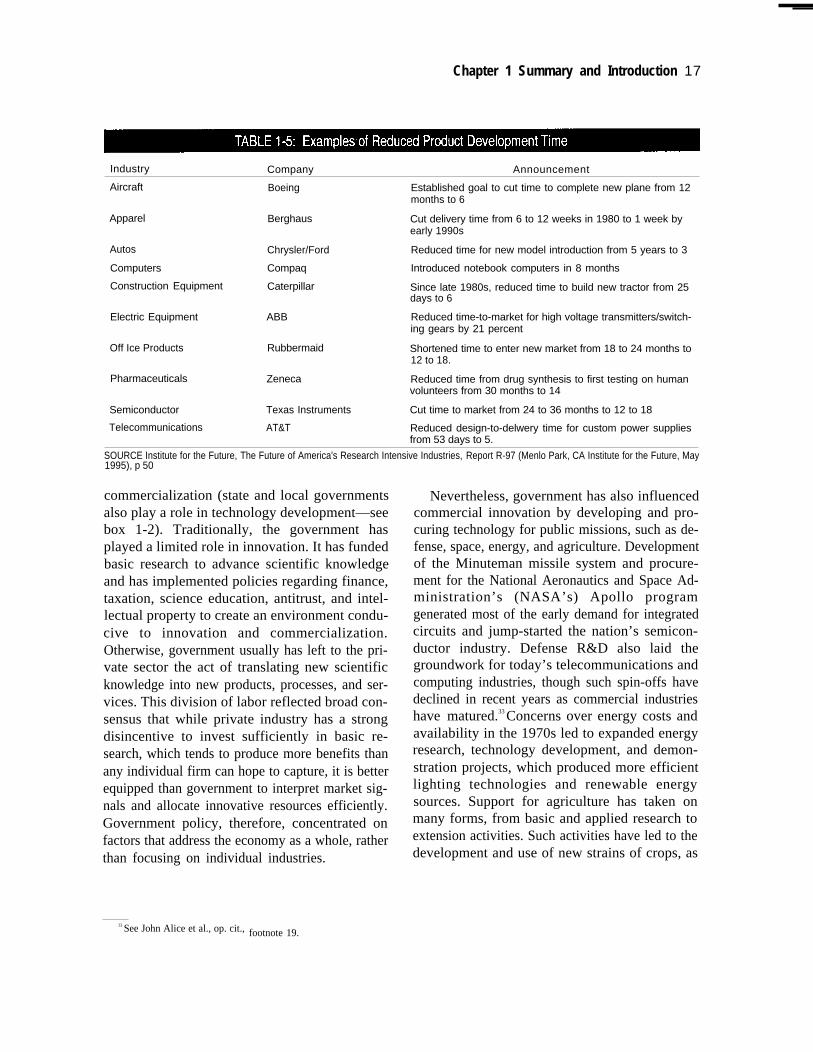
Firms have also increased their reliance on ba-sic research performed at universities and federallaboratories. Both the percentage of universityfunding provided by industry and the number ofcooperative research and development agree-ments (CRADAs) signed between industry andfederal laboratories have climbed in recentyears.32 Such restructuring seems to have paid offfor firms in terms of increased competitivenessand shortened production cycles (see table 1-5).Yet reductions in basic and long-term researchcould threaten the ability of U.S. firms to generatefuture high-payoff products and processes. Aspressures mount to reduce the federal budget defi-cit, and government expenditures for R&D con-tinue to decline, funding for basic research atuniversities and federal laboratories is likely todrop. This change could potentially reduce theamount of basic research results available to U.S.firms.
THE POLICY DEBATEThese changes in the competitive environmenthave triggered renewed debate over the properrole of the federal government in innovation and
27 See, for instance, Malcolm W. Browne, “Prized Lab Shifts to More Mundane Tasks,” New York Times, June 20, 1995, p. C12; GautamNaik, “Top Labs Shift Research Goals to Fast Payoffs,” Wall Street Journal, May 22, 1995, p. B1; Vanessa Houlder, “R&D Placed Under theMicroscope,” Financial Times, May 22, 1995; Vanessa Houlder, “Revolution in Outsourcing,” Financial Times, Jan. 6, 1995, p. 10; “CouldAmerica Afford the Transistor Today?” Business Week, Mar. 7, 1994, p. 80.
28 For example, corporate support for R&D at General Electric has declined from about 75 percent of its total R&D budget to about 25percent since 1985. At Kodak, corporate support for R&D has dropped from 85 percent to just 5 percent of the R&D budget. See Charles F.Larson, “Research/Development in the Private Sector,” Forum for Applied Research and Public Policy, spring 1995, p. 130.
29 ISI/CSIM preliminary survey results. By this estimate, chemical firms now spend about 3 percent of their R&D on basic research.30 A recent survey by the Industrial Research Institute indicates that the percentage of corporate R&D managers expecting an increase in
alliances and joint ventures rose from 33 percent to 49 percent between 1989 and 1993. The number of respondents expecting to license technol-ogy from or to other firms also increased from 14 percent to 22 percent and from 19 percent to 34 percent, respectively, during the same timeperiod. Industrial Research Institute, Annual R&D Trends Forecast (Washington, DC: Industrial Research Institute, November 1994).
31 The extent of international R&D spillovers has been a matter of debate. Some studies indicate that R&D spillovers remain relativelylocalized; see Adam B. Jaffe, Manuel Trajtenberg, and Rebecca Henderson, “Geographic Localization of Knowledge Spillovers as Evidencedby Patent Citations,” Quarterly Journal of Economics, August 1993, p. 577. Others indicate that international spillovers are much more signifi-cant for small countries than for large ones; see David T. Coe and Elhanan Helpman, “International R&D Spillovers,” National Bureau of Eco-nomic Research Working Paper No. 4444 (Cambridge, MA: National Bureau of Economic Research, 1993).
32 CRADAs do not typically support basic research, but they do allow companies to access basic research results derived from previous
laboratory work.
Chapter 1 Summary and Introduction 17
Industry Company Announcement
Aircraft Boeing Established goal to cut time to complete new plane from 12months to 6
Apparel Berghaus Cut delivery time from 6 to 12 weeks in 1980 to 1 week byearly 1990s
Autos Chrysler/Ford Reduced time for new model introduction from 5 years to 3
Computers Compaq Introduced notebook computers in 8 months
Construction Equipment Caterpillar Since late 1980s, reduced time to build new tractor from 25days to 6
Electric Equipment ABB Reduced time-to-market for high voltage transmitters/switch-ing gears by 21 percent
Off Ice Products Rubbermaid Shortened time to enter new market from 18 to 24 months to12 to 18.
Pharmaceuticals Zeneca Reduced time from drug synthesis to first testing on humanvolunteers from 30 months to 14
Semiconductor Texas Instruments Cut time to market from 24 to 36 months to 12 to 18
Telecommunications AT&T Reduced design-to-delwery time for custom power suppliesfrom 53 days to 5.
SOURCE Institute for the Future, The Future of America's Research Intensive Industries, Report R-97 (Menlo Park, CA Institute for the Future, May1995), p 50
commercialization (state and local governmentsalso play a role in technology development—seebox 1-2). Traditionally, the government hasplayed a limited role in innovation. It has fundedbasic research to advance scientific knowledgeand has implemented policies regarding finance,taxation, science education, antitrust, and intel-lectual property to create an environment condu-cive to innovation and commercialization.Otherwise, government usually has left to the pri-vate sector the act of translating new scientificknowledge into new products, processes, and ser-vices. This division of labor reflected broad con-sensus that while private industry has a strongdisincentive to invest sufficiently in basic re-search, which tends to produce more benefits thanany individual firm can hope to capture, it is betterequipped than government to interpret market sig-nals and allocate innovative resources efficiently.Government policy, therefore, concentrated onfactors that address the economy as a whole, ratherthan focusing on individual industries.
Nevertheless, government has also influencedcommercial innovation by developing and pro-curing technology for public missions, such as de-fense, space, energy, and agriculture. Developmentof the Minuteman missile system and procure-ment for the National Aeronautics and Space Ad-ministration’s (NASA’s) Apollo programgenerated most of the early demand for integratedcircuits and jump-started the nation’s semicon-ductor industry. Defense R&D also laid thegroundwork for today’s telecommunications andcomputing industries, though such spin-offs havedeclined in recent years as commercial industrieshave matured.33 Concerns over energy costs andavailability in the 1970s led to expanded energyresearch, technology development, and demon-stration projects, which produced more efficientlighting technologies and renewable energysources. Support for agriculture has taken onmany forms, from basic and applied research toextension activities. Such activities have led to thedevelopment and use of new strains of crops, as
33 See John Alice et al., op. cit., footnote 19.
18 I Innovation and Commercialization of Emerging Technology
Over the past 15 years, the number of states funding and operating programs to promote technolog-
ical innovation and commercialization has grown from nine to 50. These programs complement the
states’ longstanding interest in recruiting and retaining business and in funding higher education and
infrastructure development. Like these other policies, state-supported technology programs aim to le-
verage existing industry, universities, human resources, and services to promote economic growth. In
fiscal year 1994, states spent nearly $385 million on some 390 distinct technology programs. Although
programs vary considerably in structure, focus, and services offered, they generally fall into five catego-
ries: technology development, technology financing, industrial problem-solving, startup assistance, and
teaming.
Technology development programs received $131 million in 1994 to support research and applica-
tion of technology for new and enhanced products and processes. These programs assume several
forms. University-industry technology centers (UITCs) are the most common. They exist in nearly half
the states and received $105 million in 1994. UITCs concentrate on interdisciplinary and applied re-
search in specific technologies and industries, typically those most important to the regional economy.
Organized so that several companies work with one university, these centers seek to develop ongoing
relationships between the university and local businesses. An alternative type of arrangement, the uni-
versity-industry research partnership (UIRP), exists in 12 states and received $12 million in funding in
1994. UIRPs usually involve just two partners and are organized around a specific project with a timeta-
ble for developing a technology and bringing a new product to market. States also supported 10 equip-
ment and facility access programs, which provide small businesses with low-cost access to expensive
equipment and facilities, such as supercomputers and clean rooms. These programs received about $6
million in funding in 1994.
Technology financing programs received over $100 million in state funding in 1994 to help small
technology firms raise capital Two-thirds of this total supported specific R&D projects and local, non-
profit economic development programs, such as incubators. The remainder took the form of grants,
low-interest loans, or equity investments directly financed by state governments or accredited financial
institutions. Most states also assist companies applying for funding from federal technology programs,
such as the Small Business Innovative Research (SBIR) program and the Technology Reinvestment
Project (TRP).
Industrial problem-solving programs help firms improve production, management, and technical ca-
pabilities. Such programs received over $55 million in 1994. The most prominent form of industry prob-
lem-solving program is technology extension and development (TED), currently under way in 40 states.
TED programs teach firms about new manufacturing technologies and best-practice manufacturing
techniques to enhance their efficiency and productivity. Several states enjoy federal support from, and
play host to, federal manufacturing extension programs such as the Manufacturing Extension Partner-
ship (MEP).1
Startup assistance programs encourage entrepreneurship, commercialization of new technologies,
and the expansion of regional businesses. With $8 million in funding in 1994, these programs sup-
ported business incubators, small-business development centers, and research parks that, in turn, pro-
vide business, technical, and often financial assistance to new technology-based firms
(continued)
1 The National Institute for Standards and Technology’s (NIST’s) Manufacturing Extension Partnerships are made up of Manufac-
turing Technology Centers (seven have been established, 28 are planned) and the State Technology Extension Program, which
awards competitive grants to state-government or state-affiliated manufacturing extension programs
Chapter 1 Summary and Introduction 19
Teaming programs encourage collaboration among companies as a means of sharing technical informa-
tion and facilitating business development, These programs develop industrial networks and interactive
databases to match up business interests and develop communication within and across industries. Team-
ing programs received just under $8 million in 1994,
By bringing together a diverse set of players—venture capitalists and bankers, entrepreneurs and es-
tablished businesses, and university scientists and engineers—state technology programs encourage syn-
ergy between traditional state-sponsored activities and local and regional economies. Although many
states support only local firms or require project work to be carried out within the state, membership and
participation in state initiatives, especially UITCs, is not always limited to local or regional companies,
State programs are not substitutes for federal programs. Rather, state and federal technology initiatives
complement each another, though, to date, there has been Iittle coordination or cooperation between state
and federal efforts. State programs operate closer to immediate local needs and show preference for state
enterprises and interests, Federal programs, in contrast, address industrywide and regional problems, ad-
vancing innovation and commercialization through federal missions, regulatory bodies, and economic poli-
cies, Federal programs are also far larger than state-led efforts, Total federal funding for technology pro-
grams, excluding basic research, was seven times larger than state funding in 1994,
SOURCES: Robert D Atkinson, “New Partnerships in Technology Policy, ” Forum for Applied Research and Public Policy, fall 1992,
pp. 21-26, Christopher Coburn (ed.) and Dan Bergland, Partnerships: A Compendium of State and Federal Cooperative TechnologyPrograms (Columbus, OH: Battelle Press, 1995)
well as new methods of planting, growing, andharvesting them.
Starting in the 1980s, Congress and the execu-tive branch began to supplement this approachwith a series of programmatic efforts aimed athelping specific industries or correcting perceivedmarket failures in the innovation process. In SE-MATECH (the Semiconductor ManufacturingTechnology consortium), the government and in-dustry share the costs of strengthening the suppli-er base for the U.S. semiconductor industry.34 Inthe Advanced Technology Program (ATP), gov-ernment shares with industry the cost of precom-
petitive research projects—projects with anapplied focus, but in which the research resultsmay be useful to many companies developingsimilar products.35 Manufacturing TechnologyCenters (MTCs) help disseminate best-practicemanufacturing methods to the nation’s smallmanufacturing firms, many of which are unfamil-iar with the most advanced manufacturingtechnologies and practices. Legislation was alsoenacted to encourage greater transfer of technolo-gy from federal laboratories to the private sec-tor. 36
34 The industrial members of SEMATECH have decided not to request federal funding after FY 1996.35 Technological uncertainties often go unresolved and hinder the commercialization of such research results because (as with basic re-
search) individual firms cannot easily appropriate the benefits of their efforts.36 The Stevenson-Wydler Technology Innovation Act of 1980 (P.L. 96-480) established Offices of Research and Technology Applications
at federal labs and requires laboratory directors to allocate 0.5 percent of the R&D budget for their funding; the Federal Technology TransferAct of 1986 gave directors of government-owned and -operated laboratories the authority to enter into cooperative research and developmentagreements (CRADAs) with industry and established the Federal Laboratory Consortium for Technology Transfer (FLC) to match inquiries
from firms to appropriate lab researchers; the National Competitiveness Technology Transfer Act of 1989 (P.L. 101- 189) granted directors ofgovernment-owned, contractor-operated laboratories authority to sign CRADAs with industry.
20 | Innovation and Commercialization of Emerging Technology
This more programmatic approach to innova-tion expanded the government’s role into down-stream elements of the innovation process,including product development and manufactur-ing, in which Japanese competitors, in particular,were believed to hold an edge over U.S. firms. Itdid not, however, replace policies aimed at main-taining an economic environment conducive to in-novation. Continued revisions and extensions tothe research and experimentation (R&E) tax cred-it, for example, allowed firms to write off part oftheir R&D investments against tax liabilities. TheNational Cooperative Research Act of 1984 clari-fied antitrust laws related to cooperative R&Dventures and removed the threat of treble damagesin some cases, thereby encouraging the creation ofseveral hundred consortia in its first few years.Amendments in 1993 extended these provisionsto joint manufacturing efforts. Similarly, the con-solidation of patent-related appeals into the U.S.Court of Appeals for the Federal Circuit in 1982strengthened and clarified patent law, tilting thelaw in favor of patent owners.37
Many in the 104th Congress have begun toquestion the programmatic efforts of the past dec-ade and, more generally, the optimal scope andcharacter of the government’s role in the nationalinnovation system. Though proponents of cost-shared partnerships have assembled a mass of datato demonstrate the success of their programs, crit-ics contend that the programs interfere with mar-ket forces for allocating R&D resources (i.e., theypick winners and losers) and crowd out private-sector investment. The new congressional leader-ship has proposed a reversion to more traditionalforms of stimulating innovation through contin-ued support for basic research, revision and exten-sion of the R&E tax credit, and removal ofregulatory barriers to innovation. The first of theseproposals is seen as a way of creating the knowl-edge base necessary for innovation; the second, asa means of stimulating industry investment in
R&D to bring new technologies to market; and thethird, as a means of removing government inter-ference from the marketplace. Evaluation of thesealternative approaches to stimulating innovationshould take into account the complexity of in-novation and commercialization and the inade-quacy of the much-used linear model ofinnovation.
UNDERSTANDING INNOVATION ANDCOMMERCIALIZATIONDebate over the government’s role in innovationhinges implicitly on the conceptual models usedto describe innovation and commercialization.Traditional views of innovation have been strong-ly influenced by the linear model of innovation,which, in its simplest form, posits that innovationproceeds sequentially through stages of basic re-search, applied research, development, manufac-turing, and marketing. This model assumes thatbasic research serves as the source of innovation,and that new scientific knowledge initiates a chainof events culminating in the development and saleof a new product, process or service. In this view,basic research is the major source of uncertainty;once basic research is conducted, innovation andcommercialization can proceed apace. Firms withthe best technology, or that are first to market, winthe lion’s share of profits. Combined with argu-ments about the difficulties firms face in capturingthe returns from investments in basic research, thelinear model reinforces the view that governmentshould restrict its role to support of basic research,letting market forces control the rest of the innova-tion process.
❚ Models of InnovationThe linear model is an inadequate description ofthe innovation process because it describes onlyone pathway to innovation, that of reducing newscientific discoveries to practice. Innovation is amuch broader process of developing and putting
37 See U.S. Congress, Office of Technology Assessment, Making Things Better: Competing in Manufacturing, OTA-ITE-443 (Washington,
DC: U.S. Government Printing Office, February 1990), pp. 211-229.
Chapter 1 Summary and Introduction | 21
into use new and improved products, processes,and services. As such, it takes on many forms, in-cluding: 1) incremental extensions of existingproduct lines to provide new or enhanced features;2) development of entirely new products thatcombine existing technologies in novel ways toserve new market needs; 3) applications of exist-ing products and processes to new market needs—much as manufacturers of flat panel displays haveadapted semiconductor manufacturing equipmentto their needs; and 4) use of new technology toserve an existing market need, much as transis-tors, and later integrated circuits, replaced vacu-um tubes in electronic devices. Thoughincremental innovation and adaptations of exitingtechnology to new markets may seem mundane,they account for most innovative activity and, inaggregate, generate returns equal to those createdby less frequent radical innovations.
In many cases, science is not the genesis of in-novation. Ideas for new inventions more oftenarise from recognition of new market opportuni-ties, advancing manufacturing capabilities, or ad-vances in technology that proceed apart fromadvances in the underlying science. The Wrightbrothers, for example, developed the first airplanewithout an understanding of aerodynamic theory;Chester Carlson developed the first xerographiccopier without a thorough understanding of pho-toconductive materials; and many drugs havebeen developed with little or no understanding ofthe molecular basis for their effects. These inven-tions, in turn, have triggered considerable re-search into aerodynamics theory, materialsscience, and molecular biology, respectively, asscientists and engineers attempted to improveupon the basic invention.
Nevertheless, science plays a vital rolethroughout the innovation process. Many of themost radical innovations stem from scientificbreakthroughs, whether in solid state physics (thebasis of today’s semiconductor industry) or mo-
lecular biology (the source of many biotechnolo-gies). More frequently, knowledge gained fromscientific research (basic or applied) providesvaluable information for solving problems en-countered throughout the innovation process.During the product development phase, researchis often needed to understand and analyze theways in which components of the product interactor operate under different circumstances. In theproduction stage, research is often needed to im-prove yields, raise product quality, or lowermanufacturing costs. Much of the progress in inte-grated circuits, for example, derives from researchinto ways of making electronic devices smaller,which involves investigations into fields such asoptics, materials science, and quantum physics.
As this discussion suggests, innovation rarelyproceeds sequentially from one stage to the next.It is more often an iterative process in whichscientists, design engineers, production engi-neers, and marketing experts share information asthey design and test new products, processes, andservices. Many firms have attempted to institutio-nalize this type of process by reorganizing theiroperations into project teams with multidiscipli-nary membership, rather than maintaining a linearprogression from research lab, to product devel-opment teams, to production, to marketing. Thisolder model often produced mismatches betweenthe output of the research labs, the needs of theproduct designers, and the capabilities of themanufacturing process, resulting in wasted effort,high costs, and low quality. Insight from market-ing divisions and customers often failed to ade-quately influence decisionmakers in R&D,design, and manufacturing, resulting in productsill-suited to the marketplace.
The nature of innovation changes as industriesand product lines mature. In most industries, in-novation proceeds in an evolutionary fashionthrough long periods of cumulative incrementalinnovation punctuated by moments of radical in-
22 | Innovation and Commercialization of Emerging Technology
novation.38 An industry’s early stages typicallyshow a high degree of product innovation as firmsdevelop new means of satisfying a previously un-met demand. Designs are fluid as firms search forthe combination of features and performance thatmeets market demand and gains market accept-ance; competition is based primarily on productdifferentiation. Over time, a dominant designoften emerges that encapsulates a set of perfor-mance features that best matches market demand,and competition shifts away from performance to-ward cost. The rate of product innovation tends toslow and become more incremental, but the rate ofprocess innovation tends to rise. In many high-technology industries, innovation may shift to-ward improved cost/performance combinationsas firms develop new product generations withnoticeable improvements in performance (as withthe shift from 386 to 486 processors).
Such changes have strong implications for thenature of competition in an industry and the posi-tion of entrenched competitors. While incremen-tal innovation tends to reinforce the capabilities ofentrenched market leaders, radical innovationoften demands competencies that incumbentfirms lack. In this way, radical innovations can un-dermine the strengths of established competitorsand allow new firms to gain a foothold in the in-dustry.39 Sometimes entrenched firms lack thetechnical capability to develop or manufacture thenew technology: manufacturers of televisionscreens based on cathode ray tubes, for example,generally lack the skills required to develop flatpanel displays based on liquid crystal technology.At other times, competitors have a disincentive toabandon their existing product lines and markets.Despite inventing reduced instruction set comput-
ing (RISC), IBM was slow to introduce computersbased on the new technology, in part because itfeared the new machines would detract from salesof its existing product lines. Commercializationof RISC awaited new entrants, such as SUN Mi-crosystems and Apollo Computer Systems, whohad no stake in the existing complex instructionset computing (CISC) technology. There are alsocases in which entrenched firms fail to see themarket applications of a new technology. In thedisk drive industry, market leadership has passedto a new group of firms with each major genera-tional change, not because entrenched firmslacked the technical skills to adopt the newtechnology, but because the technology did notseem to serve the needs of their established cus-tomers, and manufacturers failed to perceive thevalue of the technology to a new group of custom-ers.40
❚ CommercializationCommercialization is an attempt by a firm to prof-it from innovation by incorporating new technolo-gy into products, processes, and services used orsold in the marketplace. Successful commercial-ization hinges on many factors. Firms must beable to: 1) finance new technology ventures; 2)hire and train skilled scientists, engineers, manag-ers, and production workers; 3) protect their in-novation from imitators; 4) acquire or accesscomplementary skills and technologies requiredto make an innovation useful; and 5) gain marketacceptance. The availability of standards, exis-tence of regulatory approval bodies, and the rela-tive ease of new business formation and interfirmcollaboration influence the ability of firms tocommercialize new technologies.
38 James M. Utterback, Mastering the Dynamics of Innovation (Boston, MA: Harvard Business School Press, 1994), p. xix. See also MichaelTushman and Philip Anderson, “Technological Discontinuities and Organizational Environments,” Administrative Science Quarterly, vol. 31,1986, pp. 439-465.
39 For a more detailed discussion of this phenomenon, see Utterback, op. cit., footnote 38.40 Richard S. Rosenbloom and Clayton M. Christensen, “Technological Discontinuities, Organizational Capabilities, and Strategic Com-
mitments,” forthcoming.
Chapter 1 Summary and Introduction | 23
Firms must anticipate future profits in order tocommit to commercializing a new technology.They must therefore be convinced that marketsexist for their innovation; that they will be able toappropriate an acceptable share of the total avail-able profits; and that they will be able to developor acquire the skills and assets needed to bring theinnovation to market. Estimates of overall profit-ability hinge on the size of the potential market,production costs, and the price consumers arewilling to pay for the innovation. These factorsare, in turn, influenced by the availability of com-plementary assets that make them useful. Newcomputers, for example, have little utility unlessaccompanied by software to run on them; electriccars are of little interest without recharging sta-tions. Unless these assets are developed anddeployed, a new product or service is unlikely tobe profitable. Competition from alternativetechnologies can also limit markets for innova-tions, as consumers have several means of satisfy-ing a particular need (see box 1-3).
In order to capture a share of the profits gener-ated by innovation, firms must be able to protecttheir proprietary position from imitators. In thepharmaceuticals industry, firms tend to protecttheir innovations through patents, which grant theowners exclusive rights to their invention for 20years from the date on which an application isfiled. In most other industries, including electron-ics, autos, and aircraft, patents do not offer suffi-cient protection because imitators can more easilyfind alternative ways of providing the same capa-bility without violating the patent. Therefore,firms in these industries attempt to keep the work-ings of their innovations secret (a difficult task forproduct innovations) or erect strong barriers toentry by investing in production capacity to re-duce production costs or by rapidly introducingimproved products.
Before they can do so, firms must develop oracquire the skills to design, manufacture, and mar-ket the innovation. Firms that can better harnessthese capabilities and orchestrate the contribu-tions of the various actors responsible for bringinga new technology to market have the best chanceof succeeding in commercialization.41 Japan’ssuccess in the global marketplace has often beenattributed to its ability to harness or develop com-plementary assets, such as the manufacturing ca-pabilities that allowed it to introduce newproducts faster than U.S. firms. Japanese firmsboasted faster product development cycle timesthan U.S. firms and often achieved higher qualityin the process. As a result, they were able to bringnew and improved products to market faster thanU.S. firms and win large portions of the market.Large investments in process technology ratherthan product technology increased this advantage,as U.S. firms continued to pour greater resourcesinto product innovation.42
Small U.S. firms are often at a disadvantage incompetition against large, vertically integratedfirms, whether in Japan or the United States, thathave access to necessary complementary assetsand skills internally. Without their own manufac-turing facilities or marketing and distributionchannels, small firms are often forced to alignwith larger firms or to license their technology tothe owners of such assets. This process not onlycan result in the transfer of technology to rivalcompanies and nations, but can take longer tocomplete than if conducted internally, therebyslowing the commercialization process in theUnited States. Conversely, the flexibility affordedsmall firms by their limited capital investmentscontributes to the dynamism of U.S. industry.They are less bound to existing investments andtechnological pursuits than large firms like Du-Pont and IBM.
41 For a more complete discussion of this topic, see David J. Teece, “Profiting from Technological Innovation: Implications for Integration,Collaboration, Licensing and Public Policy,” The Competitive Challenge: Strategies for Industrial Innovation and Renewal, David J. Teece(ed.) (New York, NY: Ballinger Publishing Company, 1987).
42 Edwin Mansfield, “Industrial R&D in Japan and the United States: A Comparative Study,” American Economic Review, vol. 78, No. 2,May 1988.
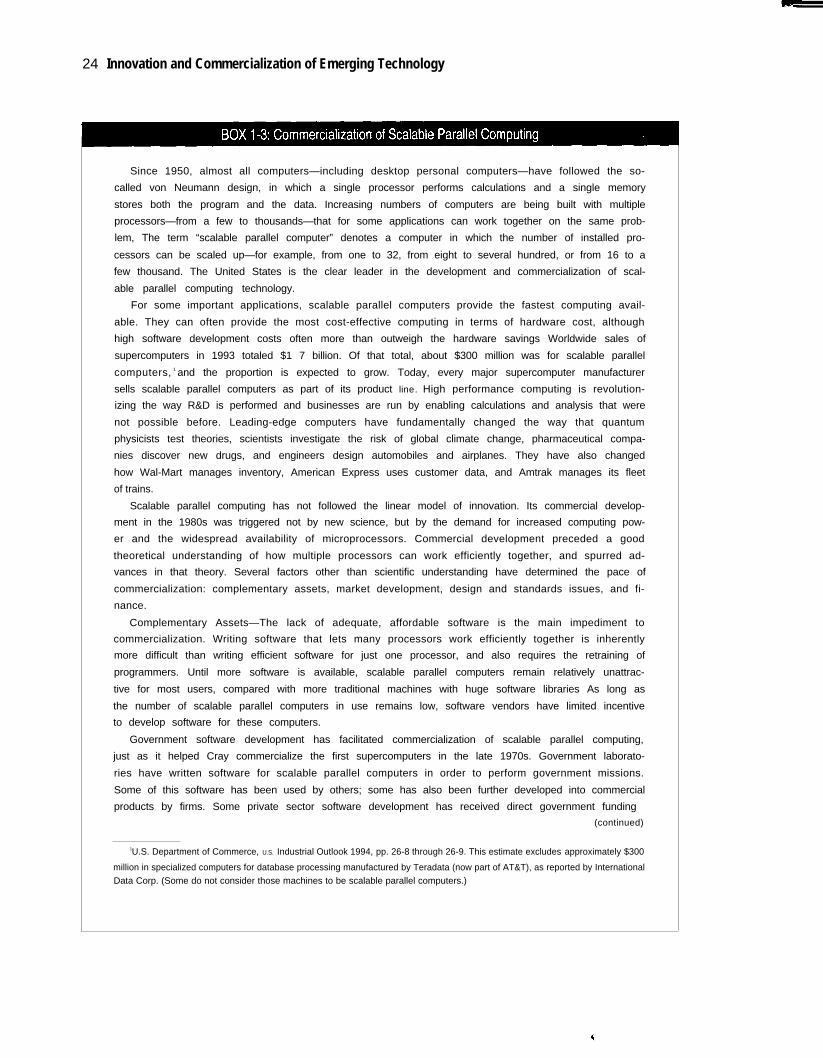
24 Innovation and Commercialization of Emerging Technology
Since 1950, almost all computers—including desktop personal computers—have followed the so-
called von Neumann design, in which a single processor performs calculations and a single memory
stores both the program and the data. Increasing numbers of computers are being built with multiple
processors—from a few to thousands—that for some applications can work together on the same prob-
lem, The term “scalable parallel computer” denotes a computer in which the number of installed pro-
cessors can be scaled up—for example, from one to 32, from eight to several hundred, or from 16 to a
few thousand. The United States is the clear leader in the development and commercialization of scal-
able parallel computing technology.
For some important applications, scalable parallel computers provide the fastest computing avail-
able. They can often provide the most cost-effective computing in terms of hardware cost, although
high software development costs often more than outweigh the hardware savings Worldwide sales of
supercomputers in 1993 totaled $1 7 billion. Of that total, about $300 million was for scalable parallel
computers, 1 and the proportion is expected to grow. Today, every major supercomputer manufacturer
sells scalable parallel computers as part of its product line. High performance computing is revolution-
izing the way R&D is performed and businesses are run by enabling calculations and analysis that were
not possible before. Leading-edge computers have fundamentally changed the way that quantum
physicists test theories, scientists investigate the risk of global climate change, pharmaceutical compa-
nies discover new drugs, and engineers design automobiles and airplanes. They have also changed
how Wal-Mart manages inventory, American Express uses customer data, and Amtrak manages its fleet
of trains.
Scalable parallel computing has not followed the linear model of innovation. Its commercial develop-
ment in the 1980s was triggered not by new science, but by the demand for increased computing pow-
er and the widespread availability of microprocessors. Commercial development preceded a good
theoretical understanding of how multiple processors can work efficiently together, and spurred ad-
vances in that theory. Several factors other than scientific understanding have determined the pace of
commercialization: complementary assets, market development, design and standards issues, and fi-
nance.
Complementary Assets—The lack of adequate, affordable software is the main impediment to
commercialization. Writing software that lets many processors work efficiently together is inherently
more difficult than writing efficient software for just one processor, and also requires the retraining of
programmers. Until more software is available, scalable parallel computers remain relatively unattrac-
tive for most users, compared with more traditional machines with huge software libraries As long as
the number of scalable parallel computers in use remains low, software vendors have limited incentive
to develop software for these computers.
Government software development has facilitated commercialization of scalable parallel computing,
just as it helped Cray commercialize the first supercomputers in the late 1970s. Government laborato-
ries have written software for scalable parallel computers in order to perform government missions.
Some of this software has been used by others; some has also been further developed into commercial
products by firms. Some private sector software development has received direct government funding
(continued)
1U.S. Department of Commerce, U.S. Industrial Outlook 1994, pp. 26-8 through 26-9. This estimate excludes approximately $300
million in specialized computers for database processing manufactured by Teradata (now part of AT&T), as reported by International
Data Corp. (Some do not consider those machines to be scalable parallel computers.)
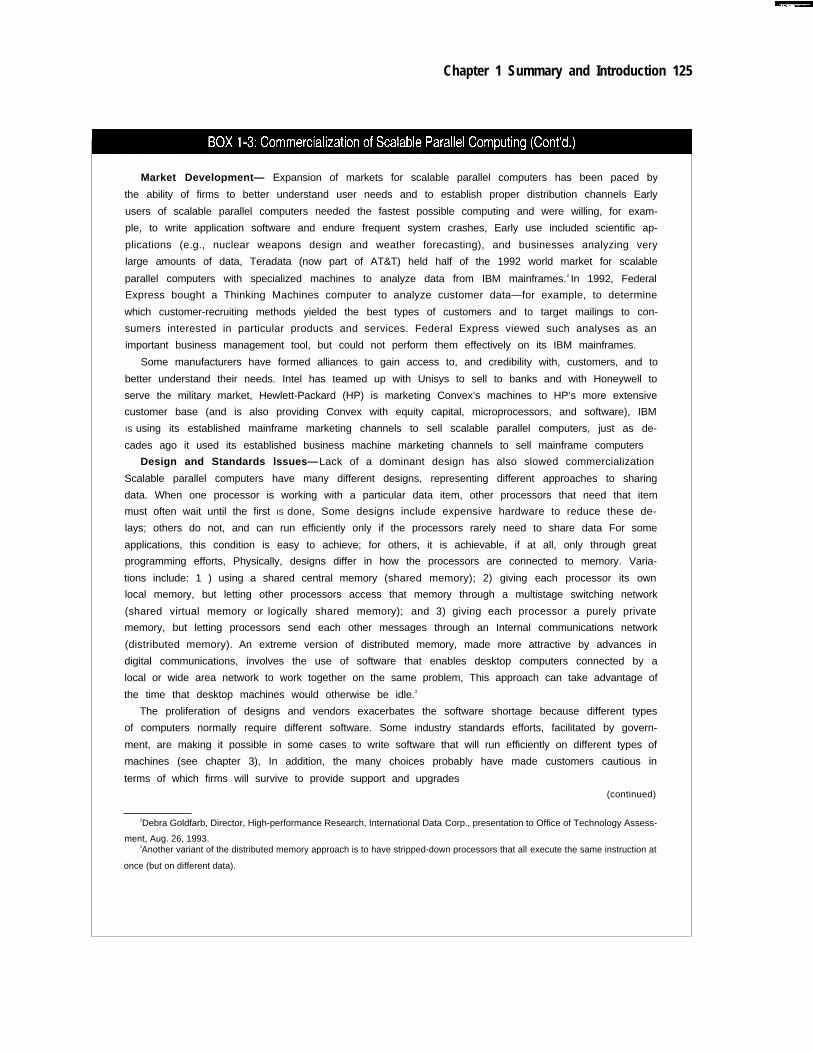
Chapter 1 Summary and Introduction 125
Market Development— Expansion of markets for scalable parallel computers has been paced by
the ability of firms to better understand user needs and to establish proper distribution channels Early
users of scalable parallel computers needed the fastest possible computing and were willing, for exam-
ple, to write application software and endure frequent system crashes, Early use included scientific ap-
plications (e.g., nuclear weapons design and weather forecasting), and businesses analyzing very
large amounts of data, Teradata (now part of AT&T) held half of the 1992 world market for scalable
parallel computers with specialized machines to analyze data from IBM mainframes.2 In 1992, Federal
Express bought a Thinking Machines computer to analyze customer data—for example, to determine
which customer-recruiting methods yielded the best types of customers and to target mailings to con-
sumers interested in particular products and services. Federal Express viewed such analyses as an
important business management tool, but could not perform them effectively on its IBM mainframes.
Some manufacturers have formed alliances to gain access to, and credibility with, customers, and to
better understand their needs. Intel has teamed up with Unisys to sell to banks and with Honeywell to
serve the military market, Hewlett-Packard (HP) is marketing Convex’s machines to HP’s more extensive
customer base (and is also providing Convex with equity capital, microprocessors, and software), IBM
IS using its established mainframe marketing channels to sell scalable parallel computers, just as de-
cades ago it used its established business machine marketing channels to sell mainframe computers
Design and Standards lssues—Lack of a dominant design has also slowed commercialization
Scalable parallel computers have many different designs, representing different approaches to sharing
data. When one processor is working with a particular data item, other processors that need that item
must often wait until the first IS done, Some designs include expensive hardware to reduce these de-
lays; others do not, and can run efficiently only if the processors rarely need to share data For some
applications, this condition is easy to achieve; for others, it is achievable, if at all, only through great
programming efforts, Physically, designs differ in how the processors are connected to memory. Varia-
tions include: 1 ) using a shared central memory (shared memory); 2) giving each processor its own
local memory, but letting other processors access that memory through a multistage switching network
(shared virtual memory or logically shared memory); and 3) giving each processor a purely private
memory, but letting processors send each other messages through an Internal communications network
(distributed memory). An extreme version of distributed memory, made more attractive by advances in
digital communications, involves the use of software that enables desktop computers connected by a
local or wide area network to work together on the same problem, This approach can take advantage of
the time that desktop machines would otherwise be idle.3
The proliferation of designs and vendors exacerbates the software shortage because different types
of computers normally require different software. Some industry standards efforts, facilitated by govern-
ment, are making it possible in some cases to write software that will run efficiently on different types of
machines (see chapter 3), In addition, the many choices probably have made customers cautious in
terms of which firms will survive to provide support and upgrades
(continued)
2Debra Goldfarb, Director, High-performance Research, International Data Corp., presentation to Office of Technology Assess-
ment, Aug. 26, 1993.3Another variant of the distributed memory approach is to have stripped-down processors that all execute the same instruction at
once (but on different data).
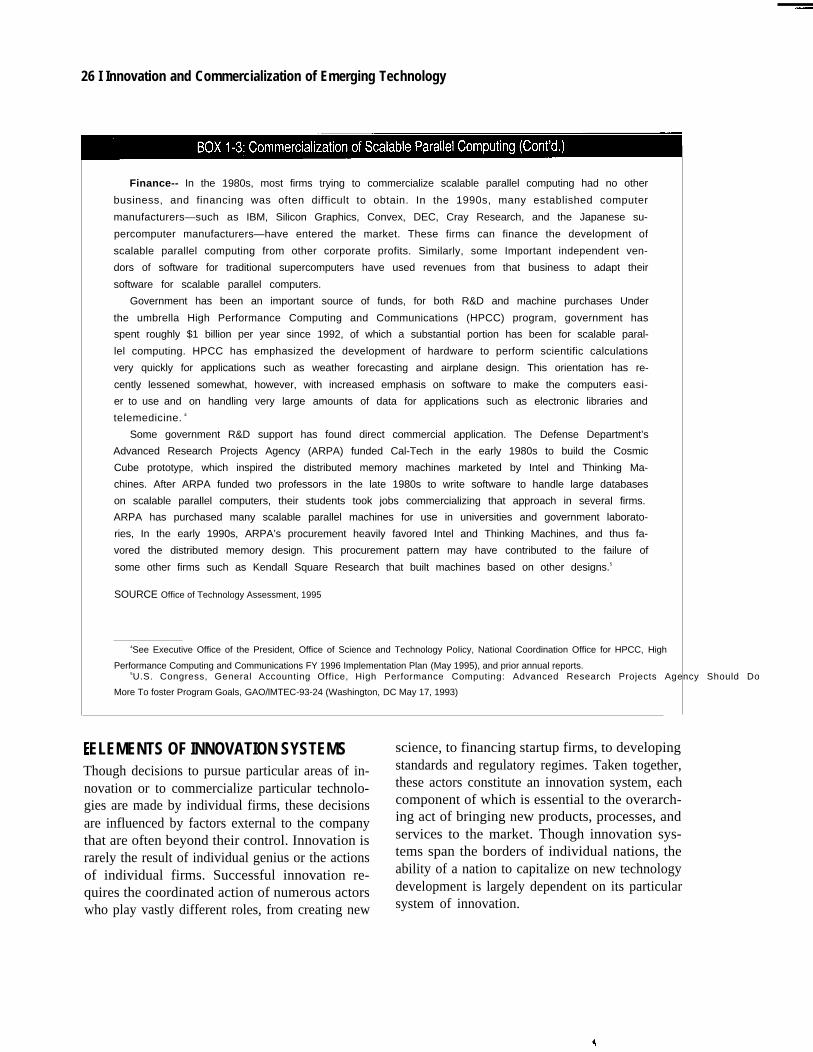
26 I Innovation and Commercialization of Emerging Technology
Finance-- In the 1980s, most firms trying to commercialize scalable parallel computing had no other
business, and financing was often difficult to obtain. In the 1990s, many established computer
manufacturers—such as IBM, Silicon Graphics, Convex, DEC, Cray Research, and the Japanese su-
percomputer manufacturers—have entered the market. These firms can finance the development of
scalable parallel computing from other corporate profits. Similarly, some Important independent ven-
dors of software for traditional supercomputers have used revenues from that business to adapt their
software for scalable parallel computers.
Government has been an important source of funds, for both R&D and machine purchases Under
the umbrella High Performance Computing and Communications (HPCC) program, government has
spent roughly $1 billion per year since 1992, of which a substantial portion has been for scalable paral-
lel computing. HPCC has emphasized the development of hardware to perform scientific calculations
very quickly for applications such as weather forecasting and airplane design. This orientation has re-
cently lessened somewhat, however, with increased emphasis on software to make the computers easi-
er to use and on handling very large amounts of data for applications such as electronic libraries and
telemedicine. 4
Some government R&D support has found direct commercial application. The Defense Department’s
Advanced Research Projects Agency (ARPA) funded Cal-Tech in the early 1980s to build the Cosmic
Cube prototype, which inspired the distributed memory machines marketed by Intel and Thinking Ma-
chines. After ARPA funded two professors in the late 1980s to write software to handle large databases
on scalable parallel computers, their students took jobs commercializing that approach in several firms.
ARPA has purchased many scalable parallel machines for use in universities and government laborato-
ries, In the early 1990s, ARPA’s procurement heavily favored Intel and Thinking Machines, and thus fa-
vored the distributed memory design. This procurement pattern may have contributed to the failure of
some other firms such as Kendall Square Research that built machines based on other designs.5
SOURCE Office of Technology Assessment, 1995
4See Executive Office of the President, Office of Science and Technology PoIicy, National Coordination Office for HPCC, High
Performance Computing and Communications FY 1996 Implementation Plan (May 1995), and prior annual reports.5U.S. Congress, General Accounting Office, High Performance Computing: Advanced Research Projects Agency Should Do
More To foster Program Goals, GAO/lMTEC-93-24 (Washington, DC May 17, 1993)
ELEMENTS OF INNOVATION SYSTEMSThough decisions to pursue particular areas of in-novation or to commercialize particular technolo-gies are made by individual firms, these decisionsare influenced by factors external to the companythat are often beyond their control. Innovation israrely the result of individual genius or the actionsof individual firms. Successful innovation re-quires the coordinated action of numerous actorswho play vastly different roles, from creating new
science, to financing startup firms, to developingstandards and regulatory regimes. Taken together,these actors constitute an innovation system, eachcomponent of which is essential to the overarch-ing act of bringing new products, processes, andservices to the market. Though innovation sys-tems span the borders of individual nations, theability of a nation to capitalize on new technologydevelopment is largely dependent on its particularsystem of innovation.
Chapter 1 Summary and Introduction | 27
❚ The FrameworkInnovation systems generally comprise threemain elements:43
1. institutional arrangements that establish thegeneral environment for innovation;
2. resource endowments that provide the basicfeedstock of innovation; and
3. proprietary functions, typically performed byprivate industry, that harness resources andcombine them into new products, processes,and services.
Responsibility for building and maintaining theseelements falls to both private- and public-sectoractors. While, on the surface, creation of institu-tional arrangements and resource endowmentsmight appear to be public responsibilities and pro-prietary functions may seem like private-sectorfunctions, all three major elements are influencedby both industry and government. Hence, bothgovernment and industry have roles to play inlaunching new technologies and new industries.
Institutional arrangements are mostly the re-sponsibility of government. Federal agencies pro-mulgate and enforce rules that establish norms forcorporate behavior. These include antitrust poli-cies to limit collusion, and patenting policies toprotect inventors’ rights and promote disclosureof inventions. Federal agencies also build con-sumer trust in new products, processes, and ser-vices by verifying or warranting their safety andefficacy; and they participate in standards-settingactivities. Industry also plays a role by individual-ly or collectively attempting to influence the legalframework to support its needs. Firms conduct le-gitimation activities by testing and providing war-ranties for their products. Many standards-settingbodies are industry-led; and firms often establishde facto standards by winning broad consumer ac-ceptance of their designs.
Resource endowments such as financial, scien-tific, and human resources also have both publicand private components. The federal governmenthas been the major supporter of basic research inthe United States since World War II, providingnearly half of the nation’s basic research fundingin 1994.44 It also funds applied research andtechnology development, both in support of itsown missions and through initiatives like theSmall Business Innovative Research program andthe Advanced Technology Program. Along withstate and local governments, the federal govern-ment provides support for public education fromkindergarten through graduate school. Privatefirms also have a role in resource creation. Thoughthe returns are difficult to appropriate, companiesdo fund basic research to promote their own busi-ness agendas and to maintain their ability to evalu-ate and acquire outside research. Private investorsput money into the stock market, venture capitalfunds, or directly into startup companies. In addi-tion, private-sector actors contribute to the devel-opment of human resources. On-the-job training,conferences, and employee turnover tend to createand disseminate human resources throughout anindustry.
Even the functions normally considered propri-etary—technology and product development, cre-ation of interfirm linkages and supply chains, andmarket creation—are influenced by governmentactivities. As government attempts to developtechnology for its own missions, whether defense,health, or energy, spin-offs to the commercial sec-tor are inevitable. Jet aircraft engines and super-computers are just two examples. Similarly,government purchases have provided early mar-kets for many new technologies, encouraging pro-ducers to invest in manufacturing capacity andgiving them an opportunity to demonstrate theirproducts in an operational environment. Aircraft,
43 This framework derives from Andrew Van de Ven and Raghu Garud, “A Framework for Understanding the Emergence of New Indus-tries,” Research on Technological Innovation, Management, and Policy, Volume 4, R. S. Rosenbloom and R. A. Burgelman (eds.) (Greenwich,CT: JAI Press, 1989), pp. 195-225.
44 National Science Foundation, National Patterns of R&D Resources: 1994, NSF 95-304 (Arlington, VA, 1995), table B-2, pp. 54-55.
28 | Innovation and Commercialization of Emerging Technology
integrated circuits, satellites, some energytechnologies, and biotechnology products all re-ceived significant early boosts from governmentprocurement. Recent efforts to stimulate coopera-tive research between federal laboratories and pri-vate industry intend to more fully exploit thecompatibility between government and commer-cial markets.
❚ ImplicationsThese observations suggest that government mayhave a valuable role to play in helping firms over-come the barriers they face in bringing newtechnologies to market. To many, barriers to in-novation simply represent the market at work,producing efficient outcomes. If a firm cannotfind financing, it is because financiers have deter-mined that the technology is not worth developingor that the firm does not have an acceptable busi-ness plan. If customers will not purchase a newproduct, it is because they have decided the prod-uct is too difficult to use, does not meet theirrequirements, or may have undesirable side-ef-fects. Not all inventions merit being put to actualuse; not all innovations merit being sold. The mar-ket provides an essential discipline as investorsand, ultimately, customers decide which newproducts and processes are worth paying for. Inthis view, government has little or no role to playin assisting innovation and commercialization ofparticular technologies.
This view, while correctly stressing the centralrole that market discipline plays in channeling in-novation and commercialization in profitabledirections, appears too simple. As shown in thebody of this paper, many factors can impede com-mercialization of a technology that producers cansupply and potential customers want. Often eco-nomic actors do not have enough information: in-vestors are not aware of investment opportunities,banks do not understand a firm’s business, pro-ducers have a hard time assessing potential cus-tomers’ needs, and potential customers cannoteasily determine whether a product will work as
claimed. Without such information, markets can-not operate efficiently, and commercializationprospects for new technologies can be greatly di-minished.
Government already participates in and shapesmarkets for new technologies in many ways. Itsupports R&D related to government missions;buys a great deal of goods and services; regulatesfinancial markets; provides a multitude of incen-tives and disincentives through its tax laws; hasvarious programs to help small business; controlsexports of many high-technology goods; and en-forces extensive regulations to protect health,safety, and the environment. Thus, the issue isoften not whether the government has a role in thecommercialization process, but rather how the in-teraction between government and industry canbest be structured to accommodate technologicalinnovation and commercialization. Often both in-dustry and government can help firms overcomethe barriers to commercialization, in whateverforms they may appear (see box 1-4).
The proper role for government can often be de-termined only on a sector-by-sector basis. Econo-my-wide measures, while often helpful inchanging general incentives for innovation andcommercialization, cannot always address thebarriers identified in this report. As the innovationprocess itself differs across industries, so do thebarriers to successful innovation and commercial-ization, and so, too, does the proper role of gov-ernment. In many cases, government has alreadyfound its niche in the commercialization process.In pharmaceuticals, government funding of basicresearch has enabled commercial enterprises todevelop new diagnostic and therapeutic productsand treatments. In electronics, government sup-port for basic research and the development oftechnologies for its own (typically defense) mis-sions has accelerated commercial development ofcomputers, telecommunications, and semicon-ductors. Changes in the competitive environmentaffect these industries differently, requiring differ-ent responses from government. New forms ofcooperation will need to be developed and tested.
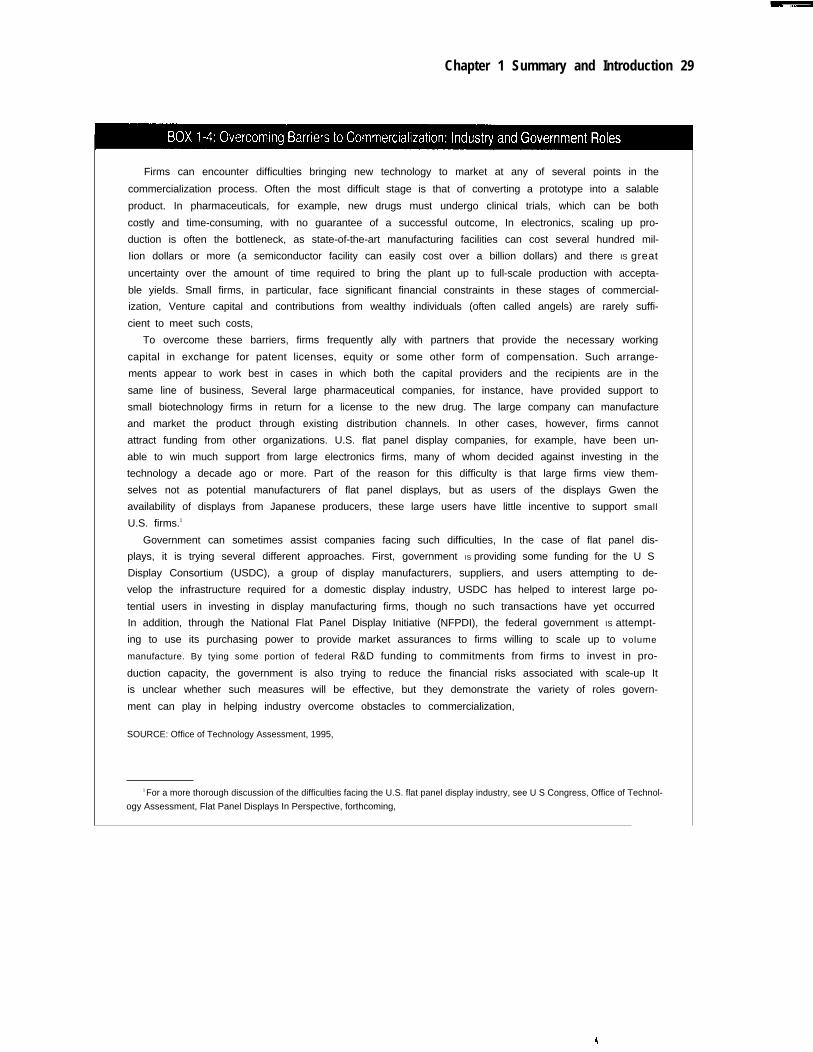
Chapter 1 Summary and Introduction 29
Firms can encounter difficulties bringing new technology to market at any of several points in the
commercialization process. Often the most difficult stage is that of converting a prototype into a salable
product. In pharmaceuticals, for example, new drugs must undergo clinical trials, which can be both
costly and time-consuming, with no guarantee of a successful outcome, In electronics, scaling up pro-
duction is often the bottleneck, as state-of-the-art manufacturing facilities can cost several hundred mil-
Iion dollars or more (a semiconductor facility can easily cost over a billion dollars) and there IS great
uncertainty over the amount of time required to bring the plant up to full-scale production with accepta-
ble yields. Small firms, in particular, face significant financial constraints in these stages of commercial-
ization, Venture capital and contributions from wealthy individuals (often called angels) are rarely suffi-
cient to meet such costs,
To overcome these barriers, firms frequently ally with partners that provide the necessary working
capital in exchange for patent licenses, equity or some other form of compensation. Such arrange-
ments appear to work best in cases in which both the capital providers and the recipients are in the
same line of business, Several large pharmaceutical companies, for instance, have provided support to
small biotechnology firms in return for a license to the new drug. The large company can manufacture
and market the product through existing distribution channels. In other cases, however, firms cannot
attract funding from other organizations. U.S. flat panel display companies, for example, have been un-
able to win much support from large electronics firms, many of whom decided against investing in the
technology a decade ago or more. Part of the reason for this difficulty is that large firms view them-
selves not as potential manufacturers of flat panel displays, but as users of the displays Gwen the
availability of displays from Japanese producers, these large users have little incentive to support small
U.S. firms.1
Government can sometimes assist companies facing such difficulties, In the case of flat panel dis-
plays, it is trying several different approaches. First, government IS providing some funding for the U S
Display Consortium (USDC), a group of display manufacturers, suppliers, and users attempting to de-
velop the infrastructure required for a domestic display industry, USDC has helped to interest large po-
tential users in investing in display manufacturing firms, though no such transactions have yet occurred
In addition, through the National Flat Panel Display Initiative (NFPDI), the federal government IS attempt-
ing to use its purchasing power to provide market assurances to firms willing to scale up to volume
manufacture. By tying some portion of federal R&D funding to commitments from firms to invest in pro-
duction capacity, the government is also trying to reduce the financial risks associated with scale-up It
is unclear whether such measures will be effective, but they demonstrate the variety of roles govern-
ment can play in helping industry overcome obstacles to commercialization,
SOURCE: Office of Technology Assessment, 1995,
1 For a more thorough discussion of the difficulties facing the U.S. flat panel display industry, see U S Congress, Office of Technol-
ogy Assessment, Flat Panel Displays In Perspective, forthcoming,