Embed Size (px)
Citation preview

INITIAL COIN OFFERINGS
FUNDINGREPORT

ICO REPORT 2017 funderbe.am/icoreport ICO Data: Coinbase 2
READING THE CHART
The grey bars show the total number of ICO rounds
since 2014.
The amount of total ICO funding yearly is
represented by the pink line.
KEY TAKEAWAY
ICO funding started gaining traction in 2016 and
exploded in 2017, where the funding increased from
$228m to $2,8bn.
The number of rounds has quadrupled and is nearly
reaching 150.
$500m
$1bn
$1.5bn
$2bn
$2.5bn
$3bn
2014 2015 2016 (2017)
ICO FUNDING NUMBER OF ROUNDS
149
36
76
INITIAL COIN OFFERINGS SINCE 2014
TOTAL FUNDING AND ROUNDS
REPORT BY

ICO REPORT 2017 funderbe.am/icoreport ICO Data: Coinbase
$500m
$1bn
$1.5bn
$2bn
$2.5bn
$3bn
$30bn
$60bn
$90bn
$120bn
$150bn
$180bn
3
READING THE CHART
The grey bars represent the total number of startup
funding rounds globally, the pink bars show the
total ICO rounds throughout time.
The grey line shows global funding since 2014,
including ICO funding. The pink line only shows ICO
funding.
KEY TAKEAWAY
While global funding has been decreasing slightly
over the last few years, ICOs have had a massive
increase in funding.
The same trend continues with the number of
rounds. While globally the rounds have been
decreasing faster than the rate of total funding, this
year ICO rounds have jumped to an all-time high.
NUMBER OF ROUNDS
2014 2015 2016 (2017)
ICO GLOBAL
4782
8917
13619
15481
149
36
76
COMPARED TO GLOBAL
REPORT BY
ICO
FU
ND
ING
GLO
BA
L F
UN
DIN
G

ICO REPORT 2017 funderbe.am/icoreport ICO Data: Coinbase 4
READING THE CHART
The grey line shows the average round-sizes of
global startup funding for all types of funding,
including ICO rounds.
The pink line shows only the average ICO round-
sizes. All data is from 2014 onward.
KEY TAKEAWAY
While the funding amounts are really different on a
global scale compared to ICO funding, the average
round-sizes are quite similar and follow a trend of
increasing round sizes.
The average ICO round-size is nearly $19m per
round while funding in all round types is almost
$24m per round.
AVERAGE ROUND-SIZES
$5m
$10m
$15m
$20m
$25m
2014 2015 2016 (2017)
ICO GLOBAL
ICO FUNDING COMPARED TO ALL FUNDING ROUNDS BY YEAR
REPORT BY
ICO REPORT 2017 funderbe.am/icoreport ICO Data: Coinbase 5
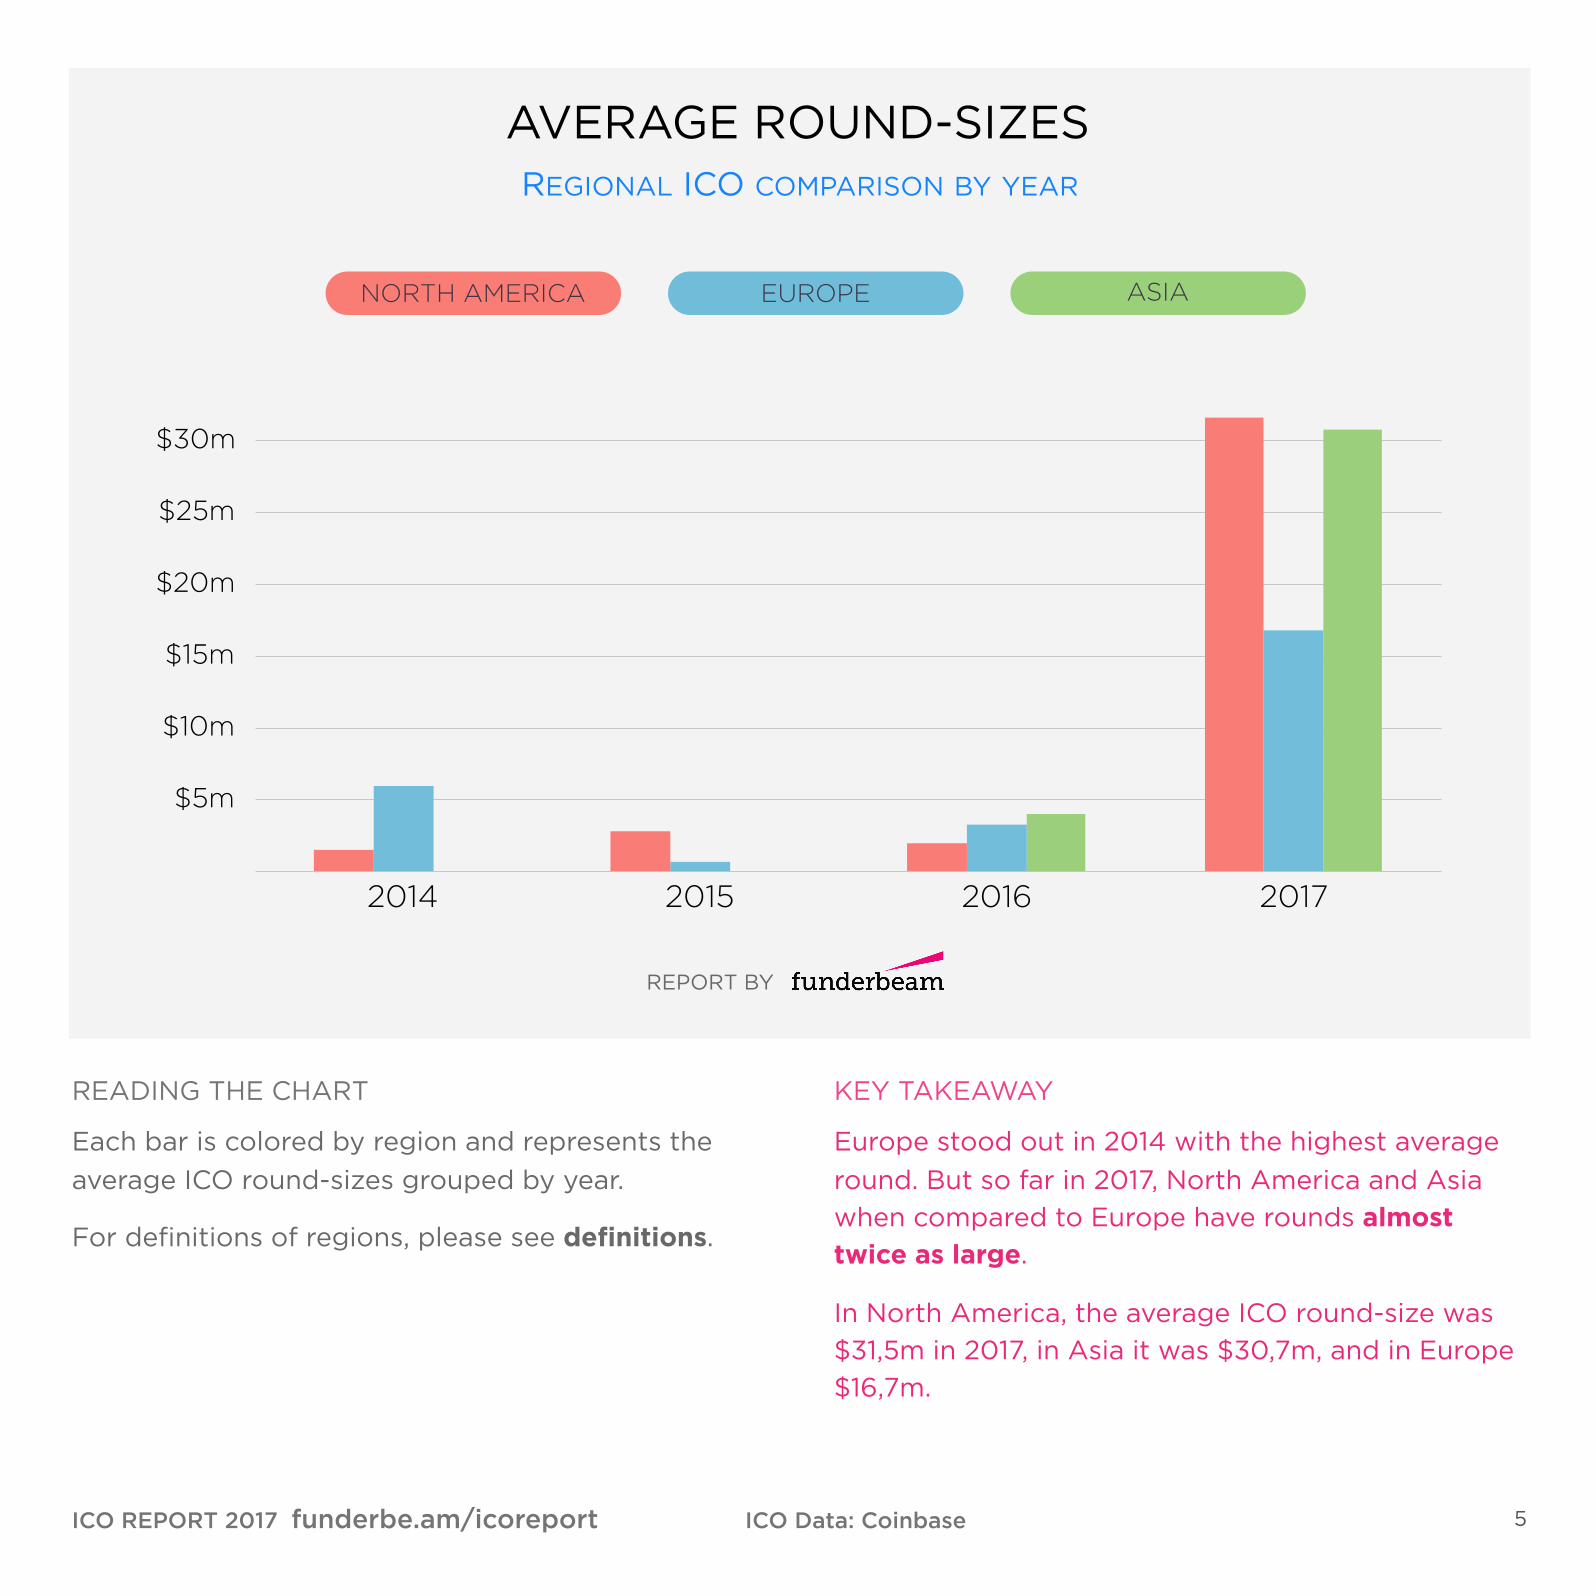
READING THE CHART
Each bar is colored by region and represents the
average ICO round-sizes grouped by year.
For definitions of regions, please see definitions.
KEY TAKEAWAY
Europe stood out in 2014 with the highest average
round. But so far in 2017, North America and Asia
when compared to Europe have rounds almost
twice as large.
In North America, the average ICO round-size was
$31,5m in 2017, in Asia it was $30,7m, and in Europe
$16,7m.
AVERAGE ROUND-SIZES
$5m
$10m
$15m
$20m
$25m
$30m
$35m
2014 2015 2016 2017
REGIONAL ICO COMPARISON BY YEAR
NORTH AMERICA EUROPE ASIA
REPORT BY

ICO REPORT 2017 funderbe.am/icoreport ICO Data: Coinbase 6
READING THE CHART
The graph represents the average round-sizes in
2917. Each line is color-coded by region and divided
by stage of funding.
For definitions of regions, please see definitions.
KEY TAKEAWAY
ICOs are generating significantly larger rounds
than both early-stage funding (angel, seed,
crowdfunding) and even Series A+ funding.
Average ICO round-sizes in Europe are the highest
when compared to all other stages of funding.
$25m
$50m
$75m
$100m
$125m
$150m
ICO EARLY STAGES SERIES A SERIES B+ DEBT
REGIONAL COMPARISON BY STAGES IN 2017
NORTH AMERICA EUROPE ASIA
REPORT BY
AVERAGE ROUND-SIZES

ICO REPORT 2017 funderbe.am/icoreport ICO Data: Coinbase
TOTAL ICO FUNDING BY REGION IN 2017
READING THE CHART
The size of each pie chart represents the total
amount of startup funding in each respective region
since 2014.
The slices show how much of this total funding was
raised by ICOs.
For definitions of regions, please see definitions.
KEY TAKEAWAY
North America has the most funding out of all
regions raised by ICOs, almost twice as much as in
Europe.
The overall share of total funding raised by ICOs is
almost twice as high in Europe reaching 3,83%
compared to just 2% in North America.
7
COMPARED TO OVERALL FUNDING IN 2017
REPORT BY
2.00 %
3.83 %
1.02 %
2.32 %
$637M
$60,5BTOTAL FUNDING
$1,2B
$338M
$45M$1,9B
$16,0B TOTAL FUNDING
$32,9BTOTAL FUNDING
ICOs
NORTH AMERICA
EUROPE
ASIA
REST OF THE WORLD

ICO REPORT 2017 funderbe.am/icoreport ICO Data: Coinbase
READING THE CHART
The darker the color of the country, the higher the
number of startups who have raised ICO funding.
Data is collected since 2014.
KEY TAKEAWAY
In Europe, Switzerland has seen the highest
number of ICOs, with a total of 13. This is just ahead
of the UK, who had 8 ICOs and a total of $71m in
ICO funding.
In general, mostly Western European countries have
started adopting ICOs, one exception being Estonia
with an impressive 4 ICOs from the tiny nation.
8
EUROPEAN ICOS
REPORT BY
NUMBER OF STARTUPS WHO
RAISED ICO FUNDING
13
8
4
3
3
32
2
2
2
21
1
1
1

ICO REPORT 2017 funderbe.am/icoreport ICO Data: Coinbase
TOP COUNTRIES FOR ICOs
9
$100m
$200m
$300m
$400m
$500m
$600m
Unite
d Sta
tes
Switz
erla
nd
Singap
ore
Canad
a
China
Estoni
a
Russia
UK
Hong K
ong
Finla
nd
REPORT BY
READING THE CHART
This chart shows the top 10 countries with the
highest amount of funds raised through ICOs.
All data is collected from 2014 onward.
KEY TAKEAWAY
The United States is flying off the chart as the
country with the highest amount of funds raised
through ICOs but only 0,45% of the total startup
funding is raised through ICOs in the country.
Out of the top 10 countries with ICO funding,
Estonia has the highest percentage of its overall
startup funding raised by ICOs. Out of the total
$240m, 28% was raised by ICOs.
TOTAL FUNDS RAISED IN ICOS SINCE 2014 BY COUNTRY
$1,12bn

ICO REPORT 2017 funderbe.am/icoreport ICO Data: Coinbase
INDUSTRY CORRELATIONS
10
NUMBER OF STARTUPS WHO HAVE RAISED ICO FUNDING
FINANCIAL
SERVICES
GAMING
NEWS AND MEDIA
SOCIAL MEDIA
MOBILE PLATFORMS
984
4
5
11
READING THE CHART
The circles represent startups who have raised ICO
funding and their association with industries.
Note that a startup can be associated with several
industries.
The size of each circle corresponds to the number
of startups associated with that particular industry.
KEY TAKEAWAY
Looking at the industries that are raising funds
through ICOs, it’s no surprise that the vast majority
of the companies are related to financial services
and cryptocurrencies.
Outside of these, there’s been a significant amount
of gaming companies, as well as companies related
to big data, AI, and media.
BIG DATA & AI
7
REPORT BY
CRYPTO-
CURRENCIES
82
SOFTWARE DEVELOPMENT
3

ICO REPORT 2017 funderbe.am/icoreport ICO Data: Coinbase
Name HQ Bio Funds raised
Filecoin USA Filecoin is a data storage network and electronic currency based on Bitcoin. $257m
Tezos USA Tezos is a new decentralized blockchain that governs itself by establishing a true digital commonwealth. $232m
Bancor CHEA protocol for the creation of Smart Tokens, a new standard for cryptocurrencies convertible directly through their smart contracts.
$153m
The DAO - To blaze a new path in business organization for the betterment of its members. $152m
Status.io USA Status,io is a platform that provides tracking for status pages, incidents and subscriber notifications. $100m
Kik Interactive CAN Kik lets users connect with friends, groups, and the world around them through chat. $97,5m
Status CHE A mobile ethereum OS. $95m
TenX SGP Spend cryptocurrencies. Anytime. Anywhere. $83m
PressOne CHN Decentralized content publishing. $82m
KyberNetwork SGP KyberNetwork is a new system which allows the exchange & conversion of digital assets. $60m
11
MOST FUNDED STARTUPSALL TIME IN THE INDUSTRY

ICO REPORT 2017 funderbe.am/icoreport
ABOUT FUNDERBEAMFunderbeam is creating a world where companies
are funded and traded across borders.
Companies can raise funds through syndicated
equity crowdfunding, raising from 100’s of investors
globally, and only adding one contact point to their
cap table. All investments are tradable on the
blockchain, so investors can choose when to return
on investments instead of waiting +5 years for an
exit. On top, Funderbeam has free data on +180k
startups and investors, helping both groups make
smarter investment and business decisions.
Funderbeam consists of 3 parts:
• Free world-class data intelligence for investors
and founders.
• Funding: Private/crowd syndicates for equity
funding.
• Trading: All investments are instantly tradable;
investors choose how long to keep investment. All
trades are secured by blockchain.
To get started, go to Funderbeam.com.
12

ICO REPORT 2017 funderbe.am/icoreport
DEFINITIONSRegions
Evaluating funding trends and aggregating numbers
on a global scale can be misleading. Due to the
sheer difference in funding activity in different
regions, global sums may not tell the full story. For
example, a moderate increase or decrease in
funding activity in North America might overpower
a significant increase or decrease in European
funding activity simply because of a rift in the
absolute funding amount within each region. To
reduce the effect of these powerhouses on
emerging regions, we’ve split the data into four
different regions so funding trends can be evaluated
on a more appropriate basis. Those regions are as
follows:North America: Canada, The US, and Mexico.Europe: Europe including Israel and Russia. ASIA: All countries in Asia.RoW: Rest of world consists of all countries not
included in the other three regions.
RoW groups together countries like Australia with
Middle Eastern, African, and South American
countries. These are not related, but from 2012 until
today, they only constitute about 2.5% of global
funding, so for meaningful comparison of the other
three regions, we’ve grouped these three together.
Industries (Tag clusters)
Grouping startups by industry can be a tricky
process. Due to the prevalence of tech startups,
along with the inherently disruptive nature of
innovative companies, it’s difficult to draw clear
boundaries between industries. Classical industry
classifications are too broad to capture the essence
of the startup world, but allowing each startup to
populate its own space would make any comparison
of trends meaningless.
To address this, we’ve used thousands of descriptive
tags and clustered them into 54 industries that
capture the diversity of the startup world while
maintaining meaningful comparability. This way,
patterns and trends in funding across different
industries can be evaluated over time.
13

ICO REPORT 2017 funderbe.am/icoreport
DATA SOURCESICOs
As a special situation in this report, we’ve collected the
majority of our data on ICOs from Coinbase, who keep
an amazing public list of ICOs. Thanks to Coinbase for
the amazing work!
Funderbeam data
Powering a data platform as large as Funderbeam’s
requires an extensive amount of both automatic and
manual work. In order to piece together an accurate
picture of the startup environment globally, we collect
data from a wide variety of sources, clean it and
structure it, and then run it through a number of fine-
tuned algorithms to bring out the story behind the
numbers.
Collecting the Data
Data is collected from a combination of public sources,
strategic partnerships, and the crowd.
Sources include social media profiles such as Facebook,
Twitter, and LinkedIn as well as media outlets, blogs,
and filings. The web pages of the startups themselves
also provide valuable data.
Partners include CrunchBase and regional partners
across Europe.
Structuring the Data
The amount of data available on startups has increased
dramatically over the last few years to the point that too
much data is an equal issue to the lack of it. In order to
find and make use of the data, it must be cleaned and
structured.
To address this, we use both automatic processing and
manual verification to update our data.
Data coming from different sources is cross-checked for
validity. In cases where the same data from different
sources are in conflict with each other, a thorough series
of algorithms is run to determine which data is most
likely to be correct.
In addition, data on our platform is constantly being
maintained by dedicated data administrators and
analysts. Every suggested edit to the data by the crowd
only makes it to the platform once it’s been manually
verified by our team.
Analyzing the Data
The data is run through a number of machine learning
algorithms that have been tuned and statistically
analyzed using hundreds of thousands of data points.
These algorithms give insight beyond the amount of
funding a startup has raised and the number of Twitter
followers they have.
Natural language processing is also leveraged to extract
meaningful data from news articles, allowing machines
to process thousands of articles in the time it would
take a human to read one.
The data in this version of the report is extracted from
our database on the 27th of October 2017, and rounds
are still coming in, so final numbers may vary slightly
later.
14