Embed Size (px)
Citation preview

�9 1989 by The Humana Press Inc. All rights of any nature whatsoever reserved. 0273-2289/89/2021--0181503.00
Inhibition of Methane Formation from Municipal Refuse in Laboratory
Scale Lysimeters
M. A. BARLAZ, .1'3 D. M. SCHAEFER, 2 AND R. K. HAM I
IDept. of Civil and Environmental Eng.; 2Dept. of Meat and Animal Sci., Univ. of Wisconsin, Madison, WI 53 706; and
3Present address: R. S. Kerr Environmental Research Laboratory, POB 1198, Ada, OK 74820
ABSTRACT
Changes in chemical composition and population development of key groups of bacteria (hydrolytic, acetogenic, and methanogenic) were measured in a laboratory scale simulation of refuse decomposition from the time of initial incubation through the methane production phase. Inhibition of methane production appeared to be characteristic of refuse decomposition. It was observed in 20 of 32 leachate recycle containers and all 19 control containers. Inhibition was not owing to an absence of indigenous microorganisms, toxic concentrations of carboxylic acids or cations, or insufficient ammonia. Characteristics of inhibited and successful containers are compared.
Index Entries: Refuse; landfill; methane; anaerobic decomposi- tion; bacteria.
INTRODUCTION
Methane produced in sanitary landfills represents a usable but under- utilized source of energy. Energy recovery projects are frequently rejected because the onset of methane production is unpredictable and methane yields vary from 1 to 50% of potential yields based on refuse biodegrada- bility data (1,2). Numerous studies on the enhancement of methane pro- duction (3-6) have not led to an understanding of the microbiology of refuse decomposition adequate to increase methane yields in sanitary landfills.
*Author to whom all correspondence and reprint requests should be addressed.
Applied Biochemistry and Biotechnology 1 8 1 Vol. 20/21, 1989

182 Barlaz, Schaefer, and Ham
Refuse conversion to methane is assumed to proceed on a pathway similar to that described for anaerobic sludge digestion. Three major groups of bacteria are involved (7): (1) the hydrolytic and fermentative bacteria that break down biological polymers such as cellulose and hemicellullose to sugars that are then fermented to carboxylic acids, alcohols, carbon dioxide, and hydrogen, (2) the obligate proton reducing acetogenic bac- teria that convert carboxylic acids and alcohols to acetate and hydrogen, and (3) the methanogenic bacteria that convert primarily acetate and hy- drogen plus carbon dioxide to methane.
Recently, Barlaz presented an updated characterization of refuse de- composition to include data on both microbial population development and chemical composition during decomposition (8). Characterization of refuse decomposition in four phases is summarized in Fig. 1 and below. Data for Fig. 1 were collected in laboratory scale landfills.
In the aerobic phase (1) both oxygen and nitrate are consumed and there is little change in the populations of cellulolytic, acetogenic, and methanogenic bacteria. Soluble sugars serve as the carbon source for microbial activity. In the anaerobic acid phase (2), carboxylic acids accumu- late, the pH decreases, and there is some cellulose and hemicellulose de- composition. The methanogen population begins to increase and methane is detected in the landfill gas. In phase 3, the accelerated methane produc- tion phase, there is a rapid increase in the rate of methane production to some maximum value, a methane concentration of 50-60%, a decrease in carboxylic acid concentrations, an increase in the pH of the ecosystem, little solids hydrolysis, and increases in the populations of cellulolytic, acetogenic, and methanogenic bacteria. The fourth phase is termed the decelerated methane production phase. The methane concentration, pH, cellulolytic, and methanogenic populations remain at levels similar to those in phase three. Concurrently, the methane production rate de- creases, the acetogen population increases, carboxylic acids are depleted, and there is an increase in the rate of cellulose plus hemicellulose hydroly- sis. In the absence of leachate recycle and neutralization, the time required for the onset of each phase may be significantly longer than the times shown in Fig. 1.
The objective of the study cited above was to characterize microbial and chemical changes which occur during refuse decomposition. During the study, inhibition of refuse methanogenesis was observed which ap- peared to be characteristic of decomposition. The objectives of this paper are to describe the observed inhibition, compare successful and inhibited refuse decomposition and evaluate potential causes of inhibition.
MATERIALS AND METHODS
Materials and Equipment
Shredded domestic refuse from Madison, WI was sampled from the Madison Energy Recovery Plant. Refuse with a particle size of about 1.9
Applied Biochemistry and Biotechnology Vol. 20/2I, 1989

Inhibition of Methane Formation 183
Aerobic Anaerobic 100 ~ j Acid
I N
~ ao
P, "~ 60
8 40
(.9 20
O 2
._
._~ 1
E n~ .75 e..-
�9 -s .5
LL 0.25 =
E c~ 8
"o '~ 6
o 4
o
Z a. 2 z;
Accelerated Methane
Acids
Population Development
Decelerated Methane
X Rate
~ %CH 4
pH ~
Solids .
6
0 7 20 2734 41 48 69 90 111 Days
32
16 Q- ~
100 g
75. 8
} - r -
25 ~,
Fig. 1. Refuse decomposition with leacheate recycle. Arrows indicate the axis showing the appropriate units for each line. MPN data are expressed as the log of the population measured in cells/dry gram of refuse removed from a container. The methanogen MPN data is the log of the average of the acetate and hydrogen utilizing populations. Solids decomposition data is the ratio of the weight of cellulose plus hemicellulose removed from a container divided by the weight added to the container initially. The total carboxylic acids are expressed as acetic acid equivalents.
Applied Biochemistry and Biotechnology Vol. 20/21, 1989

184 Barlaz, Schaefer, and Ham
cm was used for all experimental work. The refuse was incubated in 2 L, wide mouth, Nalgene containers. The containers were modified for in- stallation of a leachate collection port, a water addition port, a gas collec- tion outlet, and a gas sampling port. All ports and the container lid were sealed with silicone caulk (Dow Corning 732 RTV) to provide a gas tight system. Leachate was collected in a one liter Viaflem container (Travenol, Deerfield, IL) connected to the Nalgene container with tygon tube.
Experimental Design Fifty-six replicate 2-L containers were filled with shredded refuse to
begin the experiment. Leachate recycle and neutralization was performed for 37 of the containers to enhance methane production. Leachate recycle and neutralization is an effective method for the enhancement of methane production (3, 6) and in its absence refuse decomposition to methane may not have been observed for several years. Nineteen containers, termed the controls or unenhanced containers, were initiated to document refuse decomposition as it occurs in a sanitary landfill. All containers were incu- bated at 41~ the optimal mesophilic temperature for refuse decomposi- tion (9). This temperature accelerated decomposition, thus facilitating a short term study of a process that may require 2-10 y.
A complete microbial and chemical characterization required the entire contents of a container. Thus, once sampled a container could no longer be monitored. Containers that represented a logical progression in de- composition between fresh refuse and methane production were selected for sampling. Sample selection criteria included methane concentration and production data, and the leachate pH and volume recycled. A con- tainer was randomly selected for sampling from a subset in which be- havior conformed to typical trends in methane concentration, as reported previously (3).
All of the containers producing measurable volumes of methane were in the enhanced category. Nine of these were sampled and used to char- acterize successful refuse decomposition, as presented in Fig. 1. Five con- tainers that did not produce measurable volumes of methane were also sampled and these will be referred to as the unsuccessful containers.
The gas composition data suggested that there was little decomposi- tion in the control containers. Three controls were sampled in order to compare their characteristics with the successful leachate recycle con- tainers. Two leachate recycle containers in which there was no measurable methane production, termed the inhibited leachate recycle containers, were also sampled.
Incubation Conditions Refuse in the leachate recycle containers was adjusted to 73% moisture
(wet wt) with deionized water at the beginning of the experiment in order to generate ample leachate for neutralization and recycling. The control
Applied Biochernistry and Biotechnology Vol. 20/21, 1989

Inhibition of Methane Formation 185
containers were adjusted to 45% moisture and no leachate was generated. Leachate was neutralized and recycled 6 d/wk. Initially a 100 g/L sodium carbonate solution was used for neutralization. After seven weeks a po- tassium carbonate solution (171.6 g/L) was used for leachate neutraliza- tion to minimize the possibility of an inhibitory sodium concentration.
Procedure for Container Sampling and Inoculum Formation
On removal from a container, refuse was immediately placed in a plastic bag that was closed and all free air was removed by squeezing. Eighty percent by weight of the refuse in the bag was used for formation of an inoculum for Most Probable Number (MPN) enumerations. To form an inoculum the refuse was first adjusted to 88% moisture with sterile, anaerobic phosphate buffer (23.7 raM, pH 7.2). It was then blended for 1 rain in a Waring blender (model CB-6) with a one gallon stainless steel jar. The blender jar and all other equipment used to process the refuse were autoclaved and purged with nitrogen prior to use. After blending, an ex- tract of the refuse was formed by hand squeezing. The free liquid from hand squeezing (filtrate) was collected aseptically under nitrogen and used as the inoculum. Dilutions of the inoculum were made in phosphate buffer (23.7 mM, pH 7.2) in the presence of glass beads (3 ram) to disrupt flocs. This procedure was validated by the addition of ruminal bacteria to refuse, and extraction and enumeration as described elsewhere (10).
Twenty percent by weight of the refuse was used for analysis of the soluble constituents. To form an extract for soluble constituent analysis the contents of the leachate collection bag, and additional deaerated, de- ionized water as needed, were added to the refuse to adjust its moisture content o 90%. In the case of the control containers, where there was no leachate accumulation, the moisture content was adjusted to 90% with water only. After a 60 s equilibration period a hand squeezed extract of the refuse was formed. The resulting liquid was then processed for mea- surement of the concentration of various soluble constituents such as car- boxylic acids, phosphates, and ammonia. Concentrations were normalized to a per unit of dry refuse basis so that comparison of refuse with different moisture contents was possible.
After preparation of the inoculum and the soluble constituent extracts, the solids were recovered, dried, and used for determination of the mois- ture, cellulose, and hemicellulose content of the refuse.
Media Preparation and Enumeration Techniques
The total anaerobic population and the subpopulations of cellulolytic, hemicellulolytic, hydrogen producing acetogenic (based on butyrate cata- bolism) and acetate and H2/CO2 utilizing methanogenic bacteria were enumerated. The media and MPN method for each substrate were de- scribed previously (8) and are summarized here.
Applied Biochemistry and Biotechnology Vol. 20 /2 I, 1989

186 Barlaz, Schaefer, and Ham
Five tube MPNs were used for enumerations. Tubes were incubated at 41~ and checked for growth after 30 d, except for the acetogen MPN tubes which were checked after 60 d.
The medium for enumeration of the total anaerobic population con- tained 10 soluble carbon sources (cellobiose, glucose, maltose, xylose, galactose, arabinose, mannose, starch, glycerol, and galacturonic acid), each at a concentration of 2.5 mM. Carbon sources were representative of refuse hydrolysis products. Microbial growth on cellulose was detected by visible disappearance of ball milled Whatman number 1 filter paper (11,12). Xylan from oat spelts (Sigma Chemical Co., St. Louis, MO, cat. # X-0376, lot number 105F-0276) was used for enumeration of the hemi- cellulolytic bacteria. Prior to use the xylan was soaked in distilled water for 24 h to remove the soluble and non-settleable material. The turbid water was removed by aspiration and the settled xylan was dried, weighed into test tubes (5g/L of medium) and autoclaved prior to the addition of sterile media. Tubes were counted as positive if their optical density (A600) exceeded 0.4 (10). Methanogen MPN tests were performed with either 80 mM acetate or two atmospheres of hydrogen plus carbon dioxide. Aceto- genic bacteria were enumerated based on conversion of butyrate (40 mM) to acetate and hydrogen (13). Butyrate was used in the acetogen MPN because of its prevalence in leachate (3).
Analytical Methods
Techniques for measurement of the soluble constituents of refuse, solids composition, and gas composition and production have been pre- sented previously and are summarized here (8). Oxygen, nitrogen, car- bon dioxide, and methane concentrations were measured weekly by gas chromatography, two days prior to the day on which a container was dis- mantled. Gas production was measured by a water displacement method (14). Carboxylic acids were measured by liquid chromatography (LC) with a differential refractometer detector (15). Cellulose, hemicellulose, and soluble sugars were measured by acid hydrolysis (in the case of cellu- lose and hemicellulose) followed by LC analysis (16). Moisture content, sulfates, ammonia and phosphates were measured, as described in refer- ences 17-20, respectively. Sulfides were measured by acidification and trapping in zinc acetate followed by a potassium bi-iodate/sodium thio- sulfate titration (21). Total organic carbon (TOC) was determined with a Dohrmann DC 80 Analyzer.
RESULTS
A description of all of the sampled containers is presented in Table 1. Solids decomposition data, soluble constituent concentrations and car- boxylic acid concentrations for the sampled containers are presented in Tables 2, 3, and 4, respectively. Microbial population data are presented in Table 5.
Applied Biochernistry and Biotechnology Vol. 20/21, 1989

Inhibition o f Methane Formation 1 8 7
o
o
2 ~
U "~ o ~
�9
c~
o U
0
0
0 0 0 0 0
0 0 0 O O txl
) s
o
U
o o o .o .Ol
o o o ~ t
S o
o o o o d d d d d n
~ ~ 8 ~ o o o o d d d d , ~ ~ ~
~ ~ ~ .~
~ o ~
~ 8 . ~ , ~ ' 0
~ 0 ~ U P ~
. ~ . a ~ ~ ~ |
0
Applied Biochemistry and Biotechnology Vol. 20/2I, 1989

188 Bartaz, Schaefer, and Ham
Table 2 Solids Decomposition in the Sampled Containers
Cellulose ~a) Mc (b~ HemicelluloseCa~ Mh (b)
Fresh Refuse 51.2 1.0 11.9 1.0 Unsuccessful Containers
Control containers 1C 52.5 1.09 12.1 1.08 11C 53.2 1.04 11.4 0.96 16C 46.4 1.0 10.8 1.0
Inhibited leachate recycle containers 28L 39.7 0.66 9.0 0.64 15L 41.9 0.68 7.6 0.54
Successful Leachate Recycle Containers 31L 53.0 0.89 13.4 0.96 16L 52.4 0.89 12.4 0.91 10L 48.7 0.7 12.0 0.75 35L 40.5 0.68 7.2 0.52 1L 46.6 0.72 10.3 0.68 9L 42.3 0.65 9.3 0.61 22L 40.5 0.64 9.1 0.62 24L 31.7 0.44 7.3 0.44 5L 24.5 0.29 4.4 0.23
aData expressed as a percentage of the total dry mass of refuse removed from the con- tainer.
bThe ratio of the cellulose (c) or hemicellulose (h) removed from a container divided by the weight of cellulose or hemicellulose in the container initially.
Methane Concentrations in the Control Containers
Traces of methane were detected in three of the control containers on d 53 and by d 81 there was methane in all 17 remaining control containers. However , the highest methane concentration on d 81 was 1.2%. There were no increases in the methane concentration of any of the control con- tainers through day 222 and no measurable gas production.
Methane Concentrations in the Leachate Recycle Containers
Increasing methane concentration was the primary indicator that a container was in the process of population development and approaching an active state of methane production. Methane concentrations in the successful leachate recycle containers are presented in Table I and Fig. 1. There was a steady increase in the methane concentration of the success- ful containers through d 69 when the methane concentration was 64.9%. Thereafter me thane concentrations remained nearly constant at values be tween 55% and 65%, as has been reported previously for refuse in an active state of methane production (1-3).
Applied Biochemistry and Biotechnology Vol. 20/2 I, 1989
Inhibition of Methane Formation 189
O~
o
o L~
o
o
N
~ 2
c~ ~.
L~
0
o
~ ~ "
~ , - q
Applied Biochemistry and Biotechnology Vol. 20/21 , 1989

1 9 0 Barlaz, Schaefer, and Ham
o U
,..o
Z
u O
~J ~A cJ
i r
~J
. . . . . . . . . . . . ~ 0 ~ 0 ~
0
~ ~.~.~'~v~.~ ~ u ~ ~ ~ r.. _ o o o o
~'~ ~ 0 Cq Cq r162 Ch ~ t"q
u~ ~6 ~ ~6 ~6 t4 o6 06
Applied Biochemistry and Biotechnology Vol. 20 /2 I, 1989

Inhibition of Methane Formation 191
",~
o U C~
,.o
oo o
o
�9 . o ~ . ~
Applied Biochemistry and Biotechnology Vol. 20 /21 , 1989

192 Barlaz, Schaefer, and Ham
o L)
~3 F~
o C~
cI)
~ m
, ~ , . ~
,.., u3 ~"
~ . ~ 0 0
. ~ .~ ~ ~
~.~
e?:?: m
,~ .~.~
e S.~ ~ . "~ ~.~
tao~
Applied Biochemistry and Biotechnology Vol. 20/21, 1989

Inhibition of Methane Formation 193
t~
o
~9
�9
<
i.)
"u .E
o
l',,,. , t~ . 0 b. ~ b,. ,.4 V V ~
0
v v ~ . - .
V V ~
v v
8X@~@~@
~ o
~ C q U ~ C ~ I
V V V V
o
Applied Biochemistry and Biotechnology Vol. 20 /2 I, 1989

1 g4 Barlaz, Schaefer, and Ham
o
0
t~
o
r~
o
<
~ ~ ~ ~ . .
V V V V
V V V V V V V V
0 L~
~o V V V V
o . . ~ . . ~ . ~ V V
�9 �9 . 0 �9 . 1 2 - , . ~ .
V V
V V
V V V V
0 ".~
2 ~
0 "
e"
~ o
0
~ 8
~ o ~
~. <
Applied Biochemistry and Biotechnology Vol. 20 /21 , ] 989

Inhibition of Methane Formation 195
Q~
o u
t~ d~
m f~
r!
o
%
o
,t--i ~,-,I ,r--I X X X X
,-4 ~
X X , - ~ o-, "m"l X
X x X ,..-I Om b,,.
0",
X X
X
x X
~ X X X
o
m
~ X X X XX
X X X X b" ,,D r
q#
o
O
~, x x
o
cN ~
r
0 u
Pm
d~
X X X X X X X X
~ N V ~ N ~
X X X X X X X X X b,, b,,,, O", ~I::~ t',,I b,,, b") oO ',,D ,...; ~ ,,6 ,-; ,:4 K ~ ~ ,,6 .-u O
,.q
X X X X X X X X X ,,,,1~ [',,. ~ ',,O ' ~ 00 Lt') b,,, ,u")
O
X X X X X X X X
8 z
o,.. O
X X X X X X X X X
E'.u
X X X X X X X X X ~ "
g~ • m
N o pz
Applied Biochemistry and Biotechnology Vol. 2 0 / 2 I, 1989

196 Barlaz, Schaefer, and Ham
Table 6 Distribution of Methane Concentrations in the Leachate Recycle Containers a
Methane concentration, % 0-10 11-20 21-30 31-40 41-50 > 50(b)
Day 25 29 1 3 1 1 0 32 20 5 4 3 2 0 39 10 6 8 7 0 2 46 4 0 19 5 2 2 53 1 1 15 9 1 4 60 1 0 13 8 3 6 67 0 0 10 8 3 9 74 0 3 11 4 2 9 81 0 2 9 7 1 10 88 0 3 8 6 1 10 95 0 1 10 4 2 10
102 0 1 8 4 2 12 109 0 1 9 2 1 14
aPresented as the number of containers in a methane concentration category. The total number of containers decreases over time as containers were sampled.
bContainers with a methane concentration of greater than 50% were in an active state of methane production.
Weekly me thane concentrat ion data for all leachate recycle containers are p resen ted in Table 6. On d 25 there were 29 containers in which the m e t h a n e concentrat ion was be tween 0 and 10%, and 6 containers with m e t h a n e concentrat ions greater than 10%. On d 32 there were 20 contain- ers in which the methane concentrat ion was be tween 0 and 10%, and 14 containers with me thane concentrat ions greater than 10%. By d 46 the dis tr ibut ion of me thane concentrat ions had spread out considerably and only 4 containers had me thane concentrat ions be tween 0 and 10% with 19 of the containers be tween 21% and 30% methane .
With the decrease in the n u m b e r of containers be tween 21% and 30% m e t h a n e on d 53 through 81 (Table 6), there was an increase in the num- ber of containers in which the me thane concentrat ion exceeded 50%. Concentra t ions above 50% cor responded to refuse actively p roduc ing me thane . However , the rate at which containers progressed to greater than 50% me thane decreased after d 67 and the methane concentra t ion increased in only a few containers be tween days 81 and 109. There were still a n u m b e r of containers in the 21-30% category on d 81-109 indicating an apparen t bot t leneck in me thane concentra t ion progression.
The failure of some containers to progress beyond 21-30% me thane may be expressed in another way by establishing a working definition for inhibition. Inhibit ion was def ined as the failure of the methane concentra- t ion in a container to progress for three consecut ive weeks. For example,
Applied Biochemistry and Biotechnology Vol. 20/21, 1989

Inhibition of Methane Formation 197
one container progressed consistently to 33.2% methane on d 53 then stagnated and its methane concentration was 23.2% on d 109. Once a con- tainer exceeded 50% methane further concentration increases were not expected. Such containers were always in an active state of methane pro- duction and were not considered inhibited although their methane con- centration may have been stagnant.
In summary, there was inhibition and no methane production in 11 leachate recycle containers, 5 were sampled before they could be classi- fied, and 21 containers were successful in that they eventually reached an active state of methane production. Of the 21 successful leachate recycle containers, nine were classified as inhibited at some point prior to the onset of measurable methane production. That is, their methane concen- tration stagnated for at least three weeks and only thereafter, increased. This could suggest either microbial population shifts or adaptation of the population to an inhibitory environment. An additional 5 of the 21 suc- cessful containers were stagnant for two weeks. Only 7 of the 21 success- ful leachate recycle containers exhibited a steady increase in methane concentration on a weekly basis. Overall, 20 of 32 leachate recycle con- tainers exhibited inhibition including 11 that did not produce methane and 9 which ultimately recovered and reached an active state of methane production.
DISCUSSION
The first part of this section addresses trends in refuse decomposition and causes of inhibition for the sampled control containers. Following that, characteristics and potential causes of inhibition in the inhibited leachate recycle containers are discussed. Finally, cation concentrations in all of the leachate recycle containers and nutrient limitations during refuse decomposition are discussed.
Characterization of Refuse Decomposition in the Control Containers
Containers 1C, 11C, and 16C were sampled early (d 14), near the mid- dle (d 77) and at the end (d 118) of the experiment, respectively. Only traces of methane were detected in the headspace of containers 11C and 16C and there was no measurable gas production. All three controls were characterized by the absence of detectable cellulose and hemicellulose decomposition (Table 2).
Oxygen was depleted from the control containers within 6 d. There was a decrease in the pH of the refuse from an initial value of 7.5 to 5.8, 5.2, and 5.3, in containers 1C, 11C, and 16C, respectively. Mass balances which account for the weight of refuse, refuse composition, and container pore space indicated that there was insufficient oxygen and nitrate present
Applied Biochemistry and Biotechnology VoL 20/21, I989
198 Barlaz, Schaefer, and Ham
initially for complete oxidation of the sugars present in fresh refuse to car- bon dioxide and water. After depletion of oxygen and nitrate these sugars would be fermented to carboxylic acids. Thus, the initial pH decrease can be attributed to the fermentation of sugars in fresh refuse and the low acid consuming activity of the methanogenic and acetogenic bacteria.
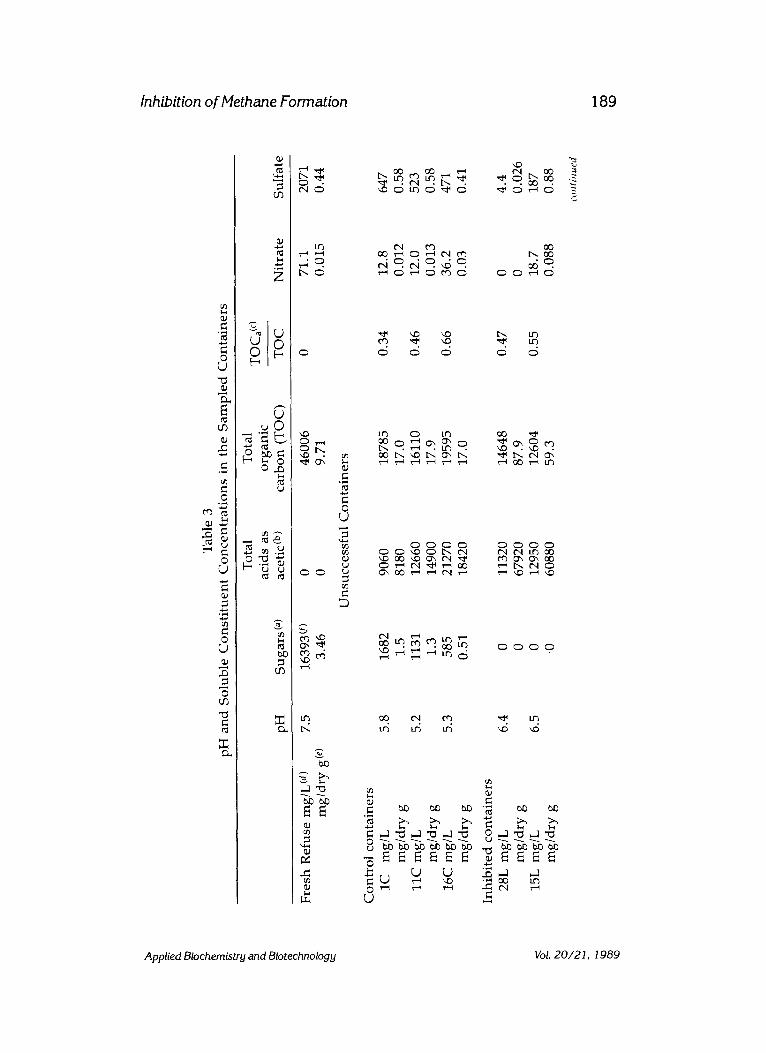
Acetate and butyrate were the major carboxylic acids present in all containers (Table 4) with lesser amounts of lactate, propionate, isobuty- rate, and valerate. The soluble total organic carbon (TOC) of the control containers (Table 3), expressed as a fraction of the dry weight, remained constant between containers 1C, 11C, and 16C after the initial increase between fresh refuse and container 1C. Increases in the total carboxylic acid concentration were measured between containers 1C and 16C and the fraction of the TOC, which could be accounted for by carboxylic acids (TOCa/TOC) increased from 34% in container 1C to 46% in container 11C and 66% in container 16C (Table 3). The increase in acids was a result of the conversion of organic carbon solubilized in the first 14 d of the experi- ment to carboxylic acids.
Microbial activity was inhibited in the control containers, as evidenced by the absence of both methane production and solids decomposition. Nevertheless, acid production and the increase in the TOCa/TOC ratio between containers 1C and 16C is indicative of some microbial activity.
Nitrates were not depleted from the control containers as they were in the successful leachate recycle containers (Table 3). Rapid nitrate deple- tion was expected because its use as a terminal electron acceptor is ener- getically more favorable than sugar fermentation to carboxylic acids. The absence of a decrease in nitrate between fresh refuse and the control con- tainers suggests inhibition of refuse decomposition prior to nitrate deple- tion. However, the accumulation of acids and the presence of hydrogen (date not shown) in the controls are indicative of fermentative activity ex- pected after nitrate depletion. The presence of nitrates and acids in the control containers suggests that refuse decomposition was not uniform. This can be explained by the absence of water flux and mixing. Similarly, nonuniform refuse decomposition may also explain why sugars were not depleted in the control containers.
All of the trophic groups required for the conversion of refuse to methane were present in the fresh refuse (Table 5). However, no group multiplied in the controls relative to fresh refuse. There was a two order of magnitude increase for the acetate and H2/CO2 utilizing methanogenic bacteria between containers 1C and 16C, however, it was due to a meth- anogen population decrease between the fresh refuse and container 1C.
The increase in the methanogen population in the control containers occurred at a pH below 6. Methanogen population increases below pH 6.3 were also observed in the successful leachate recycle containers (Fig. 1). This is below the optimal pH for methanogenic activity, 6.8-7.4 (7). Perhaps assimilatory methanogen activity is not as severely inhibited by
Applied Biochemistry and Biotechnology Vol. 20 /2 I, 1989

Inhibition of Methane Formation 199
low pH as is dissimilatory activity. Although the methanogen population increased under acidic conditions, there was no measurable methane pro- duction.
In summary, the rapid production of acids and subsequent pH de- crease in the control containers appeared to inhibit most microbial ac- tivity. In the successful containers methane production was enhanced by external pH adjustment via leachate neutralization.
The increase in the methanogen population observed in the control containers suggests a mechanism by which methane may be produced in sanitary landfills in the absence of external neutralization. Assuming in- creases in the methanogen population were to continue beyond the time frame of this experiment, the methanogen population would eventually reach a critical level from which it could begin to consume acetate and reduce refuse acidity enroute to methane production. Given the low mois- ture contents typical of sanitary landfills and the absence of high water flux, it may be difficult for the methanogen population to spread through- out the refuse. Hence, only portions of the refuse may be converted to methane. This could explain the low conversions of refuse to methane in sanitary landfills.
Inhibition in the Control Containers
The 45% moisture used for the control containers left the refuse dry to the touch and raises the possibility that there was insufficient moisture for microbial activity. However, rapid oxygen depletion and the produc- tion of carboxylic acids suggests that moisture did not limit either aerobic or anaerobic activity.
A second potential explanation for inhibition in the control containers is a toxic carboxylic acid concentration. An acetate concentration of 9753 mg/L was measured in a leachate sample from container 22L on d 55, at which time its methane production rate was increasing. Similarly, a buty- rate concentration of 6956 mg/L was measured in container 9L at take- down (Table 4). Here, too, the methane production rate was increasing. Thus, acetate and butyrate concentrations of at least 9753 mg/L and 6956 mg/L, respectively, occurred concurrently with increasing methane pro- duction rates. The acetate concentration did not exceed 9753 mg/L in any of the control containers. However, the butyrate concentration exceeded 6956 mg/L in all three controls. Inhibition due to butyrate in the control containers is possible, but not probable in that high acid concentrations corresponded with high rates of methane production (Tables 1 and 4).
As discussed previously, the acidic pH was the apparent cause for stagnation of refuse fermentation in the control containers. However, the presence of an inhibitory compound should also be considered. There was significantly less water in the control containers relative to the leachate recycle containers. Based on the different moisture levels, the concentra-
Applied Biochemistry and Biotechnology Vol. 20/21, 1989

200 Barlaz, Schaefer, and Ham
tion of a soluble material would have been about three times higher in the controls relative to the leachate recycle containers. Thus, any inhibitory compound would have been present at a higher concentration in the con- trois.
It is possible that an inhibitory compound was released from the re- fuse after incubation. Phenolic monomers from the degradation of plant material would be expected shortly after refuse burial. Phenolic com- pounds have been shown to inhibit the in vitro digestibility of cellulose by ruminal microorganisms (22). The value of TOCa/TOC in containers 1C and 11C, 0.34 and 0.46, respectively, was low relative to the range of this ratio for the successful leachate recycle containers in the anaerobic acid and accelerated methane production phases (Table 3). This suggests a relatively high concentration of non-carboxylic acid, soluble organic car- bon in containers 1C and 11C.
There was an increase in both the methanogen population and the TOCa/TOC ratio in container 16C relative to container 11C, and the TOCd TOC ratio in container 16C (0.67), was similar to the ratios in the success- ful leachate recycle containers (Table 3). Thus, a decrease in the concen- tration of noncarboxylic acid, soluble organic carbon in container 16C corresponded with an increase in the methanogen population. The slow increase in the methanogen population and the absence of methane pro- duction in the control containers cannot be attributed to low pH with total certainty as methanogen population increases and increasing methane production rates were noted in container 9L at pH 6.3. The TOC, carboxy- lic acid, pH, and methanogen population data are consistent with the possibility that an inhibitory compound was converted to carboxylic acids by the time that container 16C was sampled. However, there is not suffi- cient data on the composition of the noncarboxylic acid TOC to conclude that an organic carbon compound was inhibitory.
Characteristics of Refuse Decomposition in the Inhibited Leachate Recycle Containers
Two inhibited leachate recycle containers were sampled (28L and 15L). The methane concentration in container 28L, 0.9%, was the lowest in any of the remaining leachate recycle containers on d 60. The methane concentration in container 15L was 34.9% on d 39, and only 22% on d 81, 2 d before it was sampled. There was no measurable methane production in either container.
The cellulose and hemicellulose decomposition measured in 28L and 15L (Table 2) was typical of that measured in the successful containers in the accelerated methane production phase (1L, 9L, and 22L). Similarly, sugars were also depleted in containers 28L and 15L. Acid production, dominated by acetate and butyrate, was typical of that in containers sam- pled in the anaerobic acid phase. The pH in containers 28L and 15L was 6.4 and 6.5, respectively. The carbon flow data indicate that there was significant microbial activity in these containers.
Applied Biochemistry and Biotechnology Vol. 20/21, 1989
Inhibition of Methane Formation 201
The microbial populations in container 28L (Table 5) were similar to those for refuse in an early stage of decomposition. Only the total anaero- bic population increased relative to fresh refuse.
In container 15L only the total anaerobic and methanogenic popula- tions increased relative to fresh refuse. The methanogen population in- creased by 3-4 orders of magnitude relative to fresh refuse, similar to that of successful containers sampled late in the anaerobic acid phase. This population development suggests that the methanogens at least partially adapted to the inhibitory condition in the container. However, there was no measurable methane production and there was a large acetate accumu- lation. As proposed for the successful and control containers, these data suggest that assimilatory methanogen activity may occur in the absence of dissimilatory activity. The acetogenic and cellulolytic populations in container 15L were typical of the successful containers prior to the onset of methane production in that there were no population development.
Potential Causes of Inhibition in Containers 28L and 15L
Neither low pH nor toxic accumulations of carboxylic acids is an ex- planation for inhibition in containers 28L and 15L. The pH in containers 28L and 15L was higher than the pH in container 1L at the onset of mea- surable methane production. Acetate and butyrate concentrations in 28L and 15L were below the maximum concentrations observed for the suc- cessful containers given earlier.
The TOC in container 28L was higher than that in the successful con- tainers sampled in an early stage of decomposition (Table 3) and the TOCa/ TOC ratio in container 28L was 0.47. This indicates the presence of much noncarboxylic acid, soluble carbonaceous material. It is, therefore, possi- ble that inhibition was related to a high concentration of an unidentified soluble organic compound or group of compounds.
The presence of nitrate in container 15L (Table 3) is not compatible with the presence of methane, carboxylic acids, and sulfides. Nitrate was rapidly depleted in the successful containers, indicating an adequate population of denitrifying bacteria in refuse. Container 15L was well mixed owing to leachate recycle, thus the presence of nitrate in micro- environments is unlikely. Carboxylic acids and sulfides are indicative of anaerobic activity expected after nitrate depletion. The data do not sug- gest that nitrate was the root cause of inhibition in container 15L although its presence is anomalous.
Sulfate reducing bacteria (SRB) are reported to outcompete methano- genic bacteria for hydrogen (23). Thus in a hydrogen limited ecosystem sulfate can inhibit methane production though some will occur (23). Sig- nificant fermentative activity, as evidenced by the accumulation of car- boxylic acids, suggests that hydrogen is probably not limiting in the refuse ecosystem during the anaerobic acid phase.
Applied Biochemistry and Biotechnology Vol. 20/21, 1989

202 Barlaz, Schaefer, and Ham
It is unlikely that sulfate was inhibitory in container 28L. The sulfate concentration was relatively low, indicating that sulfate was either de- pleted or reduced to sulfide as it dissolved. Even if there were competi- tion for hydrogen in container 28L, as a result of a high sulfate turnover rate, some methane production would have been expected (23). The de- crease in the sulfate concentration relative to fresh refuse suggests that the sulfate reducing bacteria were not inhibited.
The possibility of sulfate inhibition in container 15L cannot be dis- counted. The sulfate concentration in this container was higher than that in the successful containers sampled in the accelerated and decelerated methane production phases. However, the complete inhibition of methane production by sulfate seems unlikely given the role of hydrogen in the refuse fermentation.
The ammonia concentrations in containers 28L and 15L were typical of those in the successful leachate recycle containers prior to the onset of methane production (31L, 16L, 35L). Thus inhibition cannot be attributed to an ammonia limitation. The 1.7 mg/L of phosphate in container 28L was greater than the concentration in containers 9L and 22L, which were sampled while their methane production rates were increasing. The phos- phate concentration in container 15L, 0.5 mg/L, was less than in any suc- cessful container with the exception of 5L, sampled after production of a significant volume of methane. It is possible that phosphate limited the onset of methane production in container 15L.
In summary, identification of the inhibitory factor or factors in contain- ers 28L and 15L has not been possible. There was hydrolytic and fermenta- tive activity in both containers and methanogen population development in container 15L. Either the cause of the inhibition did not develop until after some fermentative activity, or the inhibition did not affect the hy- drolytic and fermentative bacteria. In container 15L, the high sulfate and low phosphate concentrations were of concern. There was a large mass of unidentified soluble carbon in both containers, thus fueling speculation that the inhibitory compound or group of compounds contained soluble organic carbon. A more detailed description of soluble organic compounds in the refuse ecosystem is needed. The response of the refuse ecosystem to increased phosphate concentrations should also be explored.
Cation Toxicity and pH Inhibition
The preceeding discussion on inhibition addressed the sampled con- tainers owing to the availability of extensive data. In this section, all of the leachate recycle containers are considered and the possibility that certain containers were inhibited owing to high cation concentrations or low pH is evaluated. The addition of sodium and potassium carbonate for leachate neutralization increased the concentrations of these cations in the leachate recycle containers.
Applied Biochemistry and Biotechnology Vol. 20/21, 1989
Inhibition of Methane Formation 203
Inhibitory cation levels have not been evaluated for the refuse ecosys- tem although Kugelman and Chin (24) have studied cation toxicity in anaerobic digestors. They suggested that sodium concentrations of 6900- 8000 mg/L would not be inhibitory if the sodium accumulated slowly and other cations (antagonists) were present. They also recommended that potassium levels not exceed 5865-7820 mg/L under conditions where the potassium was applied in one dose with antagonists present. The case of a slowly increasing potassium concentration was not evaluated.
The calculated cation concentrations did not exceed the concentra- tions recommended by Kuelman and Chin (24) in any of the leachate re- cycle containers. The highest sodium concentrations in the successful containers were in 3L, 8L, 27L, and 30L, which had an average concentra- tion of 5593 mg/L. The highest potassium concentrations in successful containers were in 27L, 29L, and 37L, which had an average concentration of 4628 mg/L. Cation concentrations were calculated from the mass of sodium and potassium carbonate added for leachate neutralization and do not include cations present in the fresh refuse.
The sodium and potassium concentrations in inhibited containers 28L and 15L were less than the concentrations in many of the successful leach- ate recycle containers. Thus, their inhibition cannot be attributed to cation toxicity. The sodium concentration in inhibited container 2L was 6197 mg/L by d 47, higher than that in all of the successful containers except 30L. The potassium concentration in 2L, 4534 mg/L, was higher than that in any of the successful containers. However, container 2L was first classi- fied as inhibited on d 74, at which time its potassium concentration was 2884 mg/L, below the potassium concentration in several successful con- tainers. Similarly, the potassium concentration in container 36L (5501 mg/L) was higher than that in any of the successful containers on d 110. However, when container 36L was first classified as inhibited on d 60, its potassium concentration of 2336 mg/L was below that in several success- ful containers. With the possible exception of the sodium concentration in container 2L, high cation concentrations are not an explanation for inhibi- tion in any of the leachate recycle containers.
The average pH for all successful containers at the onset of methane production was 6.2 (stnd. dev. = 0.16). The average pH in the unsuccess- ful containers on d 118 was 6.3 (stnd. dev. =0.12). Thus, low pH was not the cause of inhibition in the leachate recycle containers that did not pro- duce methane.
Nutrient Concentrations in the Sampled Leachate Recycle Containers
The maximum rate of methane production for any container was measured for container 22L--32.8 ft3 CH4/dry kg-y. Ammonia and phos- phate concentrations of 88.8 mg/L and 1 rag/L, respectively, were mea-
Applied Biochemistry and Biotechnology Vol. 20 /2 I, 1989

204 Barlaz, Schaefer, and Ham
sured concurrent with this rate of methane production. It is not possible to determine whether these nutrient concentrations limited the methane production rate.
A leachate sample from container 5L on d 41 contained 160 mg/L of ammonia and 3.1 mg/L of phosphate. At takedown on day 111 the ammo- nia concentration was 7.5 mg/L and no phosphate was detected. The decrease in nutrient concentrations in container 5L is consistent with the trend exhibited over containers 22L, 24L, and 5L (Table 3). At takedown, the methane production rate in container 5L was 18% of its maximum rate. The rate decrease was attributed to depletion of the accumulated carboxylic acids (8). Alternatively, ammonia and/or phosphate concentra- tions may have limited the rate of methane production in container 5L.
At field scale nutrient depletion in the decelerated methane produc- tion rate phase may not occur as observed in container 5L. Fresh refuse is typically buried over older refuse in full scale landfills and nutrients could potentially percolate from refuse in the anaerobic acid phase of decom- position, where nutrient concentrations are higher, to more decomposed, nutrient poor refuse.
Sulfate concentrations decreased as refuse decomposition progressed in the successful containers (Table 3). This suggests that the refuse eco- system has the capacity to reduce sulfate to sulfide. Thus sulfate as well as sulfide can contribute to microbial sulfur requirements. Most of the sulfate was consumed while the pH of the refuse ecosystem was at or below 6.3. At a pH of 6.3, 75% of the dissolved sulfide will be in the form of H2S (pk= 6.9). The high levels of sulfate and the relatively low levels of sulfide in the successful containers suggests that most of the sulfide evolved from the refuse ecosystem as hydrogen sulfide. Sulfides may also have formed precipitates with metals. It is probable that there was sufficient flux of sulfide through the liquid phase for microorganisms to meet their sulfur requirements.
The rate of methane production in containers 9L and 22L was increas- ing at takedown when sulfide concentrations were 5 and 8 mg/L, respec- tively. Though lower than the concentrations used by Boone (25) for the growth of methogens (9.6 to 19.2 mg/L), there is no evidence to suggest that sulfide was limiting the rate of methane production in containers 9L and 22L.
In summary, measurable methane production occurred in 21 of 32 containers enhanced by leachate recycle and neutralization and 0 of 19 unenhanced containers. Inhibition in the control containers appeared to be related to low pH or an unidentified soluble carbon compound. Methane concentration data suggested that inhibition was characteristic of refuse decomposition with leachate recycle. Inhibition of methane production in the leachate recycle containers was not due to an absence of indigenous microorganisms, low pH, toxic carboxylic acid or cation concentrations, or insufficient ammonia. An unidentified soluble carbon compound and low phosphates may be significant in inhibition.
Applied Biochemistry and Biotechnology Vol. 20/21, 1989

Inhibition o f Methane Format ion 205
ACKNOWLEDGEMENTS
This work was s u p p o r t e d by the Amer i can Public P o w e r Associat ion, Wiscons in P o w e r and Light, and the Wiscons in A l u m n i Research F o u n d a - t ion. Mar i lyn Effland of the US Forest P roduc t s Labora tory p e r f o r m e d the cellulose, hemice l lu lose and sugar analyses . The exper t ise of Deirdre Barlaz in edi t ing the m a n u s c r i p t is apprec ia ted .
REFERENCES
1. Halvadakis, C. P., et al. (1983), Technical Report No. 271, Department of Civil Engineering, Stanford Univ.
2. Ham, R. K. et al. (1979), "Recovery, Processing and Utilization of Gas From Sanitary Landfills," EPA-600/2-79-001.
3. Barlaz, M. A. et al. (1987), Waste Mgmt Res. 5, p. 27. 4. Kinman, R. N. et al. (1987), Waste Mgmt Res. 5, p. 13. 5. Buivid, M. G. et al. (1981), Res. Rec. Cons. 6, p. 3. 6. Pohland, F. G. (1975), Georgia Institute of Technology, EPA Grant No. R-
801397. 7. Zehnder, A. J. B. (1978), Water Pollution Microbiology, vol. 2, R. Mitchell ed.,
Wiley, NY, p. 349. 8. Barlaz, M. A. et al., (1989) to appear in Appl. Env. Microbiol. (Jan.) v. 55. 9. Hartz, K. E. et al. (1982), ASCE J. of. the Environ. Eng. Div. 108, E4, p. 629.
10. Barlaz, M. A. et al., (1989) to appear in Appl. Env. Microbiol. (Jan.) v. 55. 11. Varel, V. H., et al. (1984), Appl. Environ. Microb. 47, 1, p. 219. 12. Warshaw, J. E. et al. (1985), Appl. Environ. Microb. 50, 4, p. 807. 13. Mackie, R. I. and M. P. Bryant (1981), Appl. Environ. Microb. 41, 6, p. 1363. 14. Ripley, et al. (1985), Proc. of the 40th Purdue Industrial Waste Conference,
May 14 to 16, West Lafayette, IN. I5. Ehrlich, G. G. (1981), Appl, Environ Microbiol. 42, 5, p. 878. 16. Pettersen, Roger, C. et al. (1984), J. Chroma. Sci. 22, p. 478. 17. Am. Public Works Assn (APWA) (1970), Municipal Refuse Disposal, Public
Admn. Service, Chic, II. 18. Hoeft, R. G. et al. (1973), Soil Sci. Am. Proc. vol. 37, p. 401. 19. Keeney, D. R. and D. W. Nelson (1982), Methods of Soils Analysis Part 2,
Chemical and Microbiological Properties, Page, A. L., ed., 2nd ed., Am. Soc. of Argonomy, Madison, WI, p. 643.
20. Bray, R. H. and L. T. Kurtz (1945), Soil Sci. 59, p. 39. 21. American Public Health Asscn. (APHA) (1985), Standard Methods for the Ex-
amination of Water and Wastewater, 16th, ed., Washington, DC. 22. Varel, V. H. and Jung, H. G. (1986), Appl. Env. Microbiol. 52, 2, p. 275. 23. Robinson, J. A. and Tiedje, J. M. (1984), Arch. Microb. 137, p. 26. 24. Kugelman, I. J. and Chin, K. K. (1971), Anaerobic Biological Treatment Pro-
cesses-Advances in Chemistry Series, Pohland, F. G., ed., vol. 105, American Chemical Society, Wash., DC.
25. Boone, D. R. et al. (1987), Appl. Environ. Microb. 53, 5, p. 946.
Applied Biochemistry and Biotechnology Vol. 20/21, 1989