Embed Size (px)
Citation preview

Inheritance of Traits:An Introduction to Genetics &
Human GeneticsChapters 6.3 - 6.5
1

ReviewWhich type of cells are responsible for passing traitson from parent to offspring?
- Sex cells: sperm & egg
Which type of cell division makes these sex cells?– Meiosis
What does this cell division do to chromosome #?– Reduce chromosome # by half
What type of cells are made during mitosis?- Body cells
2

What does this cell division do to chromosome #?- Maintains the same/identical chromosome #
What part inside a nucleus carries ones traits?– Chromosomes
What makes up a chromosome?– DNA and histones
What is the study of how traits are passed from parents to offspring?- Genetics
What is the name of a scientist who studies Genetics?- Geneticist 3
You have body cells and Gametes
• The cells in your body are divided into two groups.– 1. Somatic cells – are your body cells that
make up your body.
– 2. Sex cells or gametes – the cells that make up sperm and ova (egg).
• Gametes are responsible for passing on your DNA to your offspring/children.
4

I. Chromosomes
A. Autosomes – also known as body cells
Two characteristics of autosomes:• Chromosomes are paired. Always two of each
type of chromosome. One from mom and one from dad.
• There are 22 pairs of autosomes.
B. Sex Chromosomes – Come from Gametes
Three characteristics of sex cells• Half as many chromosomes• Only one of each kind of chromosome• Sperm or eggs

KaryotypeA picture which shows a person’s chromosomes
6

There are thousands of genes on a Chromosome
• Genes are small sections of chromosomes that determine a persons traits (characteristics).
• Genes are arranged one after another like beads on a necklace
Eye color
Nose size
Widow’s peak
Shape of ears
Eye color
7

Genes come in pairs just like chromosomes.One gene comes from mom, the other from dad.
Every trait or characteristic has a gene pair to represent it.
Traits are inherited characteristics. Allele is an alternate form of a gene.
EXAMPLE: Gene – eye colorAlleles – blue, green, brown
Shape of ears
Nose size
Widow’s peak
Eye color
Nose size
Widow’s peakShape of ears
Eye color
8

Passing traits to offspring Mom makes ova (egg) with her genes from her
chromosomes. AND
Dad makes sperm with his genes from his chromosomes.
• The egg and the sperm unite through fertilization
• The zygote now gets one gene from the mother and one from the father.
9
F F
f f
F f Ff
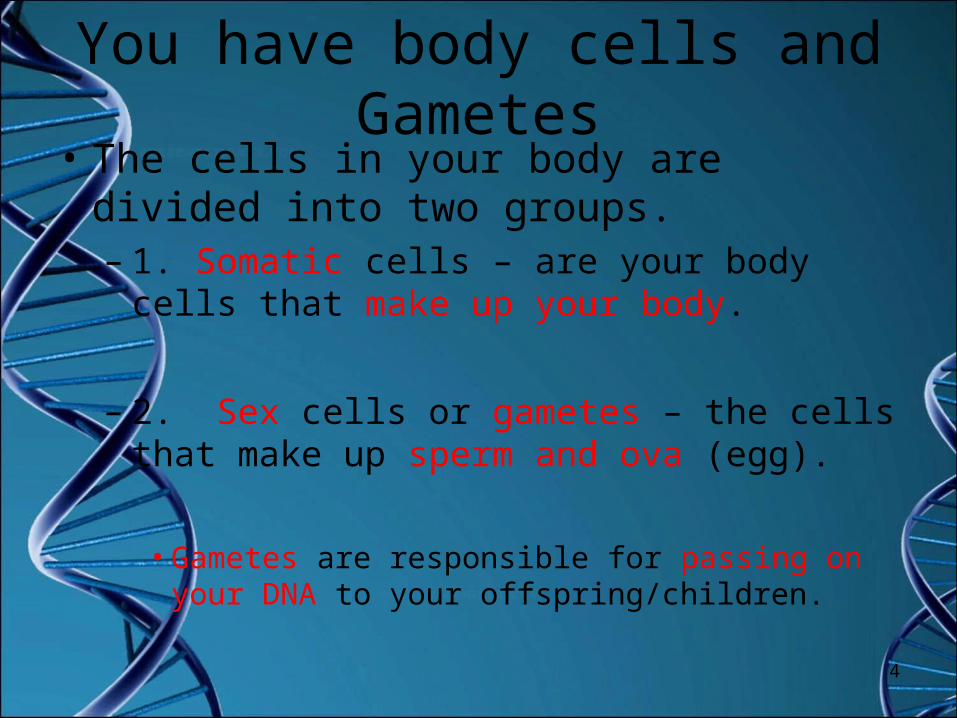
Gregor Mendel • Was an Austrian monk who became known as the
Father of Genetics.• Around 1868 he studied and worked with pea plants.• Pea plants have 7 traits each with 2 contrasting alleles
– seed shape– seed color– plant height– pod color– pod shape– seed coat color– flower position
10

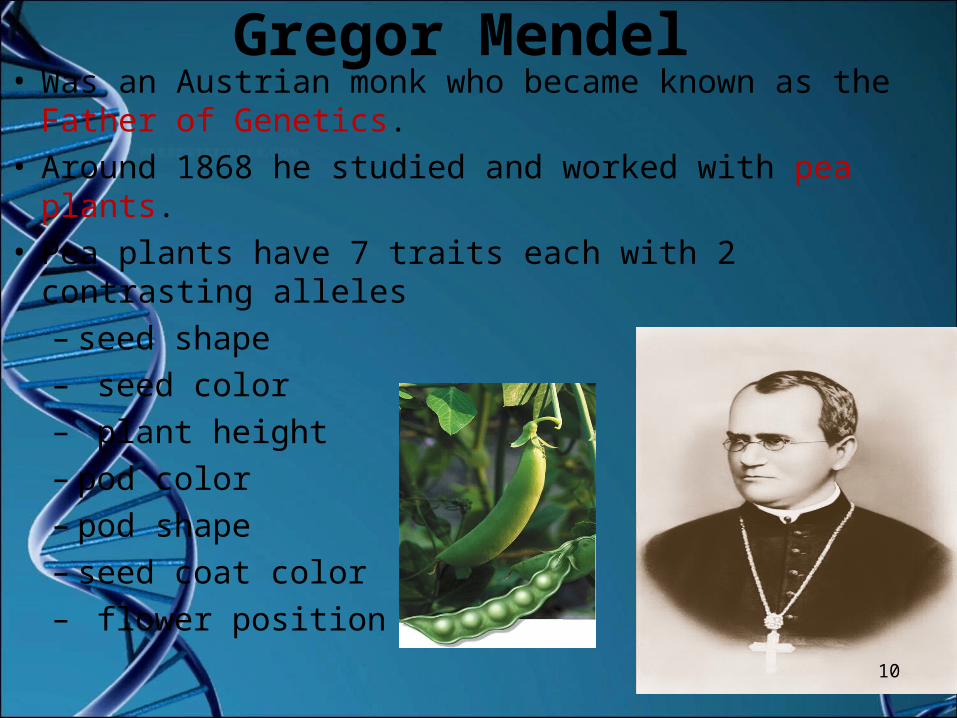
Mendel’s 1st experiment1. Used purebred (homozygous) plants
- This was known as the P generation (parents)
2. Control over breeding
- Mendel used pollen to fertilize selected pea plants.
Mendel controlled thefertilization of his pea plantsby removing the male parts,or stamens.
He then fertilized the femalepart, or pistil, with pollen froma different pea plant. 11
Offspring were all purple.
12

Genes/Alleles– Each parent donates
one allele for every gene trait.
– Homozygous describes two alleles that are the same
– Heterozygous describes two alleles that are different
13

Mendel’s 1st Conclusion• Law of Dominance
– Genotype = gene combination (represented by alphabet letters)
– Phenotype = Physical appearance (represented by words)
– A dominant allele is expressed as a phenotype when at least one allele is dominant.
• Dominant = Capital letter (ex: T = tall)• Dominant allele hides Recessive allele
– A recessive allele is expressed as a phenotype only when two copies are present.• recessive = Lowercase letter (ex: t =small) 14

Genotype-genes
Phenotype- appearance
Homozygous
Same 2 alleles
Heterozygous
Mixed Alleles
15
TT
tt
Tt
Tall
Short
Tall

Dominant and Recessive Genes(Homozygous = Having two of the same alleles)(Heterozygous = Having two different alleles)
Homozygous Dominant: Have two of the same (dominant) genes
Homozygous Recessive: Have two of the same (recessive) genes
Heterozygous: Have one dominant and one recessive gene (2 different)
16

Mendel’s 2nd Conclusion• Law of segregation
– Organisms donate only one copy of each gene in their gametes.
– Thus, the 2 copies of each gene
segregate, or separate, during
gamete formation.– Organisms inherit 2 copies of each gene, one from
each parent.
17

Traits and ProbabilityThe Punnett square is a grid system for predicting
all possible genotypes & phenotypes resulting from a cross.– The axes represent
the possible gametesof each parent.
– The boxes show thepossible genotypesof the offspring.
– Shows ONLY the
probability for each
child (like rolling a die), it is chance!
18

Steps for using the Punnett square in a Monohybrid Cross
Monohybrid Cross = a cross between only 1 trait or characteristic
1. Draw 4 boxes. Each square stands for one possible combination of genes for offspring.
Possible offspring
Possible offspring
Possible offspring
Possible offspring
19

2. Draw eggs and write the letters for the genes that will be in the Mother’s sex cells on the top.
T t
20

3. Draw sperm and write the letters for the genes that will be in the Father’s sex cells on the side.
T t
t
t
21

4. Copy the letters that appear at the top of the square into each box below it.
T t
t
t
T
T
t
t
22

T t
t
t
T
T
t
t
t
tt
t
5. Copy the letters at the left of the box into the boxes next to each letter.
Look at all the possible combinations of sperm and eggs. These are the possible combinations of genes an organism can have.
23

Practice
• Do the punnett square for a heterozygous couple for height
• Mom Tt x Dad Tt
T
t
T t
TT Tt
Tt tt
Complete:
Genotype1: TT2: Tt1: tt
Phenotype3:Tall (75%)1: short (25%) 24

Observed vs Expected
• The punnet square shows ONLY the probability for each child– not for the family as a whole. (like rolling a die)
• The more data that’s observed, the closer it gets to the EXPECTED.