Embed Size (px)
Citation preview

Online poker Online poker
The Online Poker Database of the University The Online Poker Database of the University of Hamburg (OPD-UHH)
Ingo Fiedler
Thanks to: Ann-Christin WilckeThanks to: Ann-Christin Wilcke
Presentation forPresentation for
Quebec‘s Working Group on Online Gambling
University of HamburgInstitute of Law & EconomicsDivision on Gambling
21th February 2012
AgendaAgenda
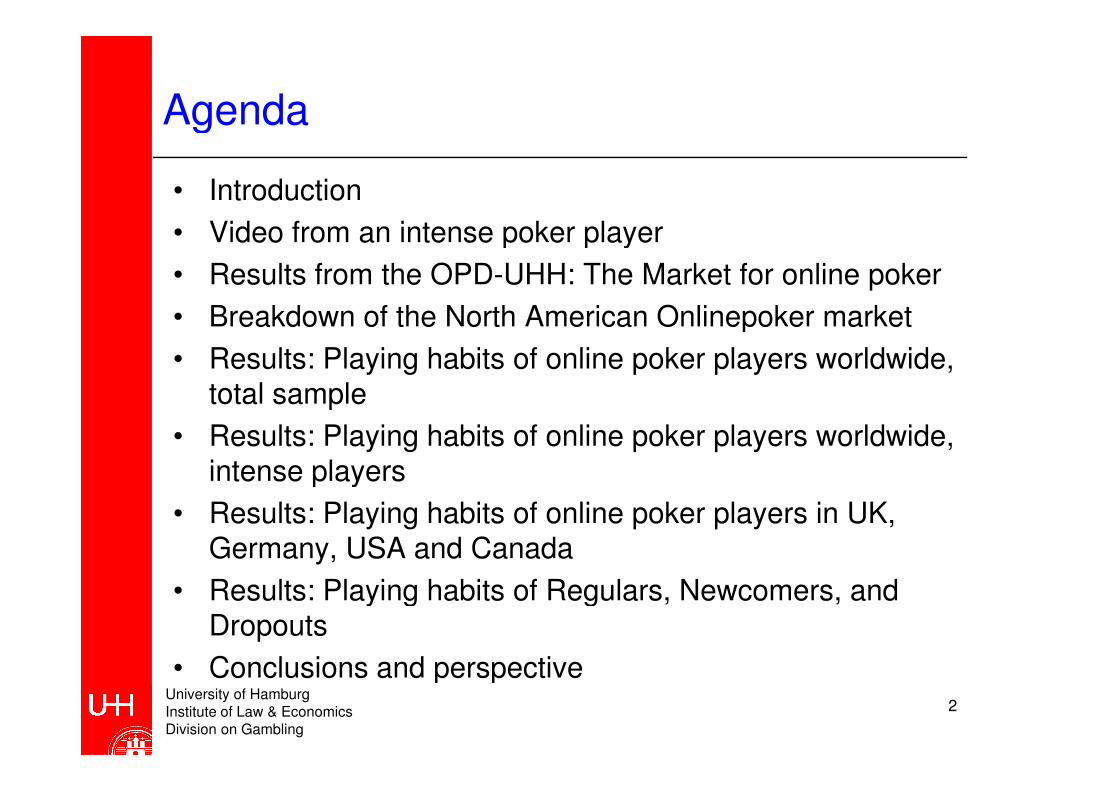
• Introduction
• Video from an intense poker player• Video from an intense poker player
• Results from the OPD-UHH: The Market for online poker
• Breakdown of the North American Onlinepoker market• Breakdown of the North American Onlinepoker market
• Results: Playing habits of online poker players worldwide, total sampletotal sample
• Results: Playing habits of online poker players worldwide, intense playersintense players
• Results: Playing habits of online poker players in UK, Germany, USA and Canada
• Results: Playing habits of Regulars, Newcomers, and• Results: Playing habits of Regulars, Newcomers, andDropouts
• Conclusions and perspectiveUniversity of HamburgInstitute of Law & EconomicsDivision on Gambling
• Conclusions and perspective2

IntroductionIntroduction
University of HamburgInstitute of Law & EconomicsDivision on Gambling

Introducing GermanyIntroducing Germany
University of HamburgInstitute of Law & EconomicsDivision on Gambling
4

Introducing the Institute of Law & EconomicsEconomics
• Chair: Professor Adams
• Research focus: Using laws to solve social problems• Research focus: Using laws to solve social problems� Tobacco control, reducing smoking rates
� Alcohol � law on alcopops (tax increase to kill the market forjuvenile drinking)
� CEO-payments
� Marketing to children� Marketing to children
� Obesity, coca cola and other soft drinks
� Problem gambling and its social costs
• Changing the environment (law) to give people the right• Changing the environment (law) to give people the rightincentives
University of HamburgInstitute of Law & EconomicsDivision on Gambling
5

Introducing my researchIntroducing my research
• Research interests: Onlinepoker, gambling, social costs, Law Economics, antitrust, money laundering, learning in Law Economics, antitrust, money laundering, learning in games
• PhD thesis „Empirical studies on online poker“• PhD thesis „Empirical studies on online poker“
• Post-Doc thesis „Gambling. A health economic analysis“
• Since 2008: research associate at the University of HamburgHamburg
• 2010: Semester in Berkeley
• Since 2012: member of the „Task Force: Behavioral• Since 2012: member of the „Task Force: BehavioralAddictions“
• Background: EconomicsUniversity of HamburgInstitute of Law & EconomicsDivision on Gambling
• Background: Economics
6

Excurs: What is EconomicsExcurs: What is Economics
• Economics is all about optimizing and efficiency• Economics is all about optimizing and efficiency
� maximizing and minimizing
• What is to be optimized is up to the user! • What is to be optimized is up to the user! � Profits
� Green energy
� Utility� Utility
� Usually: Social welfare (increasing social benefits, reducing socialcosts)
• Economics is a toolbox, using theoretical models andstatistics
• What we do: Finding optimal solutions, comparing them to• What we do: Finding optimal solutions, comparing them toreality, and finding ways to bring reality closer to theoptimum by setting incentives with laws
University of HamburgInstitute of Law & EconomicsDivision on Gambling
optimum by setting incentives with laws
7

Introducing my personIntroducing my person
• 28 years old (this, of course, still holds true in ten years)
• Interested in card, board and later computer games since• Interested in card, board and later computer games sinceI can think � mostly complex strategy games
• At least somewhat addicted to games• At least somewhat addicted to games
• Addicted to the internet and emails/Blackberry
• Other interests include• Other interests include� Influence Consciousness vs. Subconsiousness
� Deception and Self-Deception
� Strategic interactions� Strategic interactions
� The influence of variance in life (from evolution to financial markets)
University of HamburgInstitute of Law & EconomicsDivision on Gambling
8

Introducing Gambling research in HamburgHamburg
• Background: German gambling treaty� Regulates gambling in Germany (except slot machines) � Regulates gambling in Germany (except slot machines)
� Mostly a state monopoly
� Internet gambling prohibited (06/2012 sports betting will be legal)
� Forces states to finance gambling research� Forces states to finance gambling research
� Independent circle of experts to be consulted, so called„Fachbeirat“ � Prof. Adams is a member
• Diploma thesis „The social costs of gambling“ � Determined rangorder of harmfulness to society of different
gambling productsgambling products
� Allowed to set priorities
University of HamburgInstitute of Law & EconomicsDivision on Gambling
9

Introducing poker research in HamburgIntroducing poker research in Hamburg
• The beginning: 2007 at the conference of the German • The beginning: 2007 at the conference of the German conference for gambling addiction someone said: „Poker is a game of chance because it is a bet on cards“
• Obviously, there is an influence of skill in poker – but how• Obviously, there is an influence of skill in poker – but howmuch? � Answer is crucial for legal status!
• Research project to answer this question yielded:• Research project to answer this question yielded:� Skill adds up, chance cancels out
� In mixed games the question is when it does become a game of skill rather than if it is a game of skill
� This point is called „Critical Repetition Frequency“ (CRF)
� Empirical evidence for poker: average player reaches CRF after � Empirical evidence for poker: average player reaches CRF after 1,000 hands or 13 playing hours online
� Average player plays only 4.88 hours � poker is a game of chance
� For social costs it does not matter whether skill has an influenceUniversity of HamburgInstitute of Law & EconomicsDivision on Gambling
� For social costs it does not matter whether skill has an influence
10

Video
University of HamburgInstitute of Law & EconomicsDivision on Gambling
11
The Market for Online PokerThe Market for Online Poker
University of HamburgInstitute of Law & EconomicsDivision on Gambling

Before OPD-UHH: What we knew aboutthe online poker marketthe online poker market
Poker site
2009a 2010b
DataPlayers Market Players MarketPoker site
collection?Players
(Ø 7 days)
Market
share
Players
(Ø 7 days)
Market
share
Pokerstars 22,000 35.07% 29,200 40.20% Yes
Full Tilt Poker 12,000 19.13% 14,600 20.10% Yes
iPoker Network 5,900 9.41% 5,900 5.99% No
Party Poker 5,300 8.45% 4,400 6.06% No
Cereus Network 2,300 3.67% 1,960 3.67% No
Everest Poker 2,050 3.27% 2,100 2.89% YesEverest Poker 2,050 3.27% 2,100 2.89% Yes
Microgaming 1,980 3.16% 2,000 2.75% No
IPN (Boss Media) 1,920 3.06% 2,250 3.10% Yes
Cake Poker 1,580 2.52% 1,300 1.79% Yes
Ongame (bwin) 1,260 2.01% 2,650 3.65% NoOngame (bwin) 1,260 2.01% 2,650 3.65% No
Others 6,450 10.25% 7,250 9.80% No
Total 62,720 100% 73,610 100%
a: 18th June 2009, www.pokerscout.com.b: 11th May 2010, www.pokerscout.com.
University of HamburgInstitute of Law & EconomicsDivision on Gambling
13

Before OPD-UHH: What we did not knowBefore OPD-UHH: What we did not know
• Online poker market operates (mostly) in a gray area
• There were a lot of unsettled questions:• There were a lot of unsettled questions:� Total market size? Market size per country?
� How many active players?
� Do inter- and intra-country differences exist?
� What are the parameters influencing the market size?
� What are the playing habits of poker players?� What are the playing habits of poker players?
� City of Hamburg financed the research project
University of HamburgInstitute of Law & EconomicsDivision on Gambling
14

Data Set of the OPD-UHHData Set of the OPD-UHH
• Data collection in corporation with PokerScout (independent market investigator)(independent market investigator)� 6 months
� 5 poker sites (65% market share)� 5 poker sites (65% market share)
� 4.6 million player identities observed
� Origion (country or city)
� Limits played� Limits played
� Session length
� Number of tables� Number of tables
University of HamburgInstitute of Law & EconomicsDivision on Gambling
15
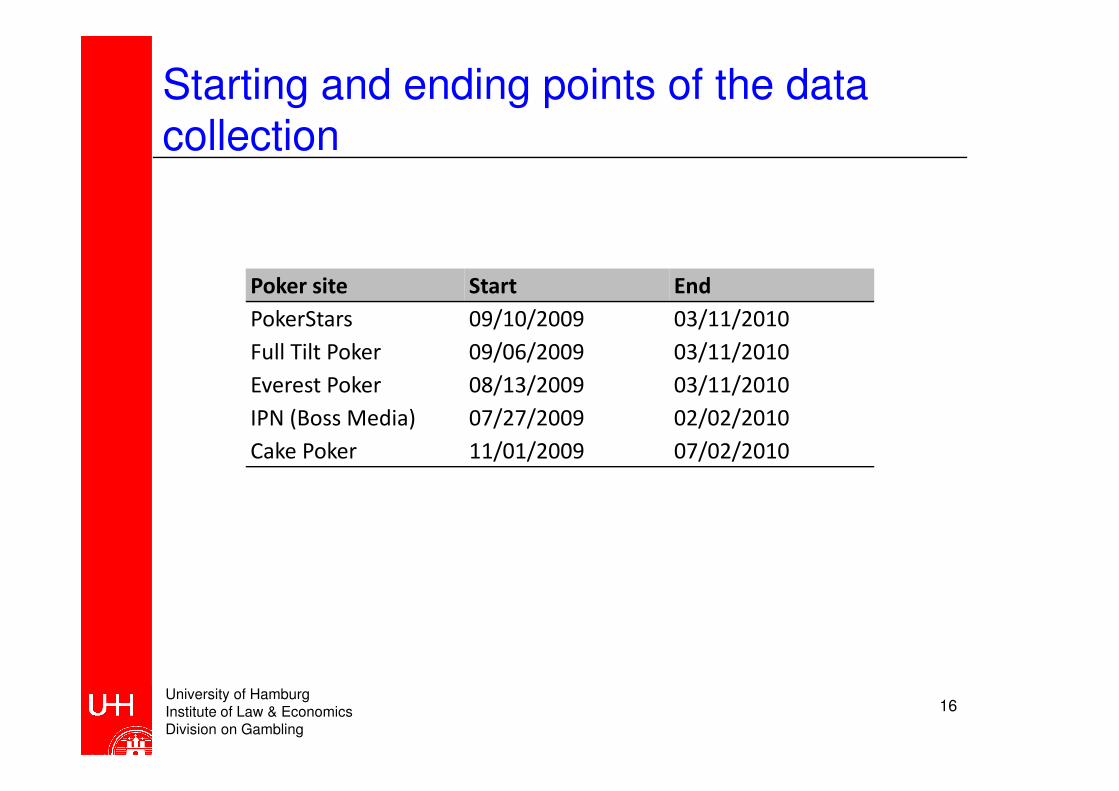
Starting and ending points of the data collectioncollection
Poker site Start End
PokerStars 09/10/2009 03/11/2010 PokerStars 09/10/2009 03/11/2010
Full Tilt Poker 09/06/2009 03/11/2010
Everest Poker 08/13/2009 03/11/2010Everest Poker 08/13/2009 03/11/2010
IPN (Boss Media) 07/27/2009 02/02/2010
Cake Poker 11/01/2009 07/02/2010
University of HamburgInstitute of Law & EconomicsDivision on Gambling
16

Limitations of the Data SetLimitations of the Data Set
• Only cash games (no tournaments)
• Not all sites accept US-players• Not all sites accept US-players
• Non-identified origin of some player identities
• Potential false information• Potential false information
• 92% successful assignement of cities to regions andcountries countries
• One player identity ≠ one player (multiple accounts)
University of HamburgInstitute of Law & EconomicsDivision on Gambling
17

Players per CountryPlayers per Country
Rank Country Active players Share
1 USA 1,429,943 23.71%
2 Germany 581,350 9.64%
3 France 445,860 7.39%
4 Russia 401,701 6.66%4 Russia 401,701 6.66%
5 Canada 345,971 5.74%
6 Great Britain 269,247 4.47%
7 Spain 253,043 4.20%7 Spain 253,043 4.20%
8 Netherlands 239,700 3.98%
9 Brazil 153,889 2.55%
10 Australia 129,714 2.15%10 Australia 129,714 2.15%
Other 1,571,389 26.06%
TOTAL 5,490,908 100%
University of HamburgInstitute of Law & EconomicsDivision on Gambling
18

Players per Internet UserPlayers per Internet User
Rank Country Active players Internet user Players/internet user
1 Hungary 122,482 6,176,400 1.983%
2 Estonia 19,212 969,700 1.981%
3 Portugal 100,075 5,168,800 1.936%3 Portugal 100,075 5,168,800 1.936%
4 Denmark 90,532 4,750,500 1.906%
5 Iceland 4,996 301,600 1.657%
6 Netherlands 239,700 14,872,200 1.612%6 Netherlands 239,700 14,872,200 1.612%
7 Finland 71,543 4,480,900 1.597%
8 Cyprus 6,445 433,800 1.486%
9 Norway 64,535 4,431,100 1.456%9 Norway 64,535 4,431,100 1.456%
10 Slovenia 18.899 1,298,500 1.455%
… … … …
36 USA 1,429,943 239,893,600 0.596%36 USA 1,429,943 239,893,600 0.596%
… … … …
TOTAL 6,029,930 1,965,162,316 0.307%
University of HamburgInstitute of Law & EconomicsDivision on Gambling
19

Drivers of the prevalence of online poker: GDP per capitaGDP per capita• Simple linear regression
• GDP per capita as independent variable • GDP per capita as independent variable
• Players/Internet users as dependent variable
• Only countries with more than 100,000 internet users
Sample (n=161)
Regression
• Only countries with more than 100,000 internet users
Variable coefficient t-value Significance
Constant 0.192 4.123 0.000Constant 0.192 4.123 0.000
GDP per capita in 1000
US$ 0.009 5.786 0.000
Goodness of fit R²=0,177; adjusted R²=0,171; F-value=33,477 (p=0.000)
• Player fraction per internet users +0.009 percentage points ifGDP per capita +1,000 USD.
University of HamburgInstitute of Law & EconomicsDivision on Gambling
20
GDP per capita +1,000 USD.

Drivers of the prevalence of online poker: Culture, OperationalizationCulture, Operationalization
Variable OperationalizationVariable Operationalization
dependent variable
Proportion of poker players Propotion of poker players in a country per internet users
Percentage factorPercentage factor
Cultural group
1=Western, 2=Orthodox, 3=Islamic, 4=African, 5= Latin
American,
6=Sinic, 7=Hindu, 8=Buddhist, 0=Others6=Sinic, 7=Hindu, 8=Buddhist, 0=Others
covariate
GDP per capita in thousand US$
University of HamburgInstitute of Law & EconomicsDivision on Gambling
21
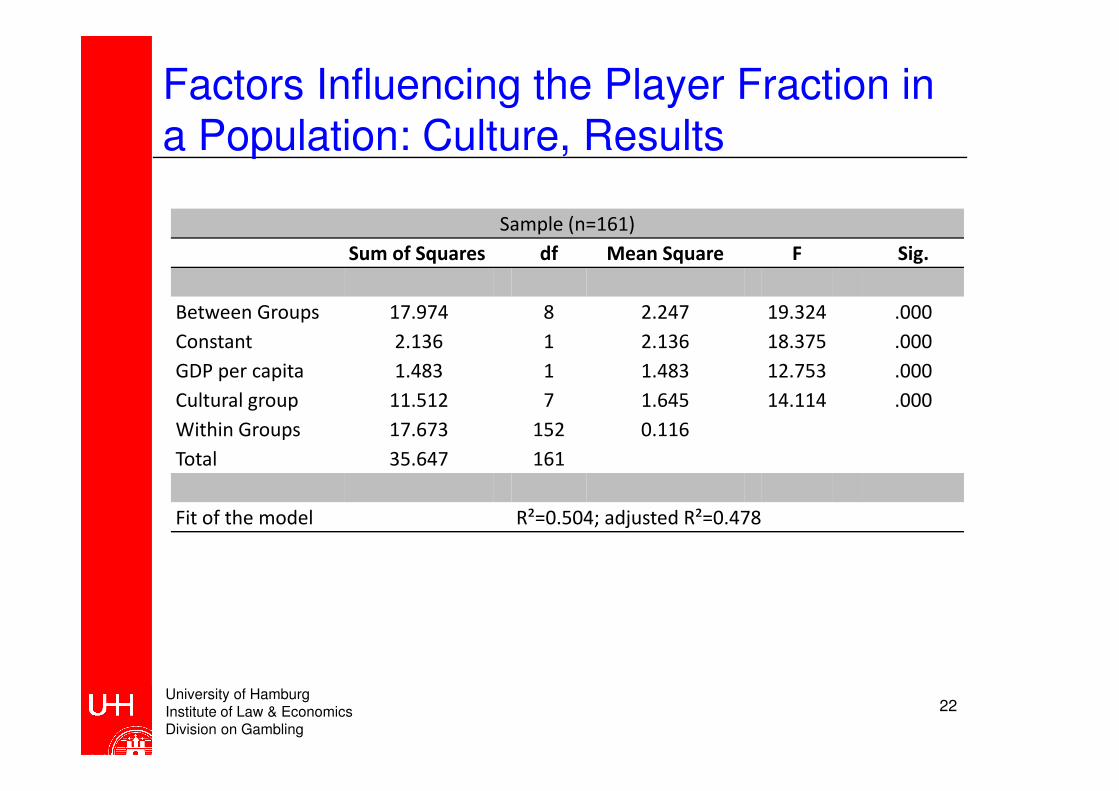
Factors Influencing the Player Fraction in a Population: Culture, Resultsa Population: Culture, Results
Sample (n=161)Sample (n=161)
Sum of Squares df Mean Square F Sig.
Between Groups 17.974 8 2.247 19.324 .000Between Groups 17.974 8 2.247 19.324 .000
Constant 2.136 1 2.136 18.375 .000
GDP per capita 1.483 1 1.483 12.753 .000
Cultural group 11.512 7 1.645 14.114 .000Cultural group 11.512 7 1.645 14.114 .000
Within Groups 17.673 152 0.116
Total 35.647 161
Fit of the model R²=0.504; adjusted R²=0.478
University of HamburgInstitute of Law & EconomicsDivision on Gambling
22
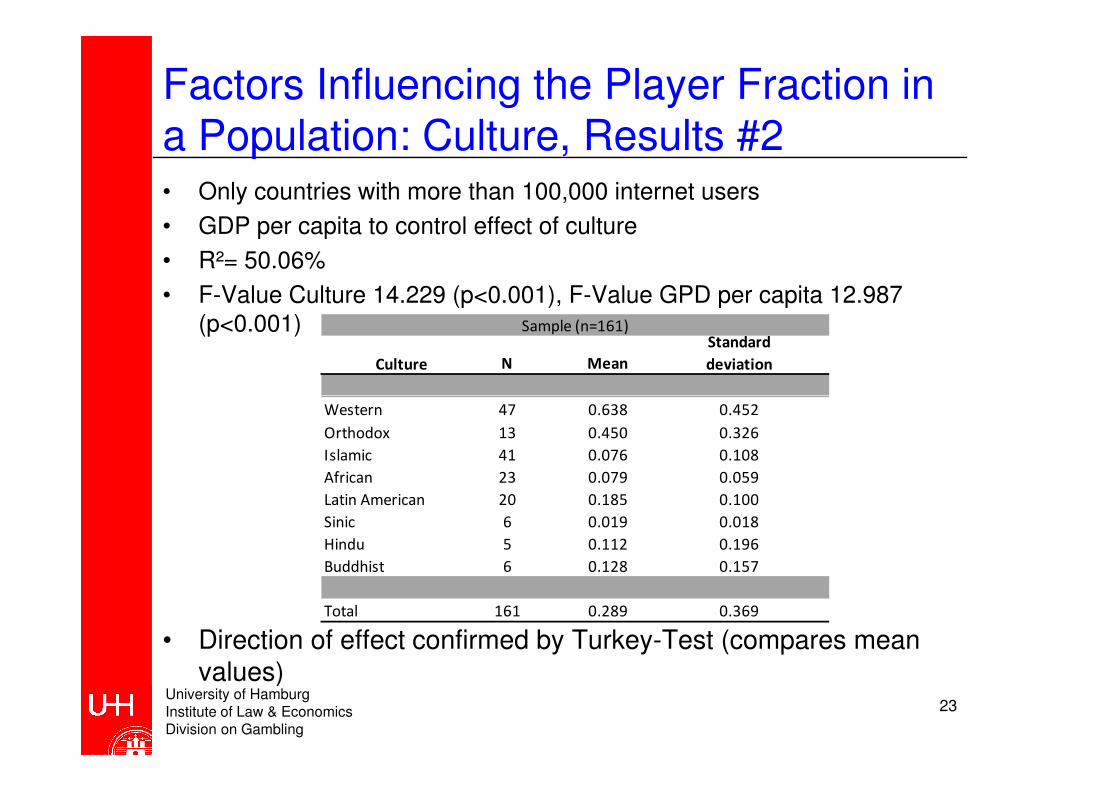
Factors Influencing the Player Fraction in a Population: Culture, Results #2a Population: Culture, Results #2• Only countries with more than 100,000 internet users
• GDP per capita to control effect of culture• GDP per capita to control effect of culture
• R²= 50.06%
• F-Value Culture 14.229 (p<0.001), F-Value GPD per capita 12.987 • F-Value Culture 14.229 (p<0.001), F-Value GPD per capita 12.987 (p<0.001)
N Mean
Standard
deviationCulture
Sample (n=161)
Western 47 0.638 0.452
Orthodox 13 0.450 0.326
Islamic 41 0.076 0.108
African 23 0.079 0.059African 23 0.079 0.059
Latin American 20 0.185 0.100
Sinic 6 0.019 0.018
Hindu 5 0.112 0.196
Buddhist 6 0.128 0.157
• Direction of effect confirmed by Turkey-Test (compares meanvalues)
Total 161 0.289 0.369
University of HamburgInstitute of Law & EconomicsDivision on Gambling
values)23

Factors Influencing the Player Fraction in a Population: Law & Ordera Population: Law & Order
• Regression Analysis 1: • Regression Analysis 1: � 15 Countries
� GDP per capita to control effect of legislation� GDP per capita to control effect of legislation
� Prohibition of online poker = 0
� Online poker unprohibited = 1
� No significant effect of legislation� No significant effect of legislation
• Interpretation: Presently, prohibition of online poker is not • Interpretation: Presently, prohibition of online poker is not enforced
University of HamburgInstitute of Law & EconomicsDivision on Gambling
24

Factors Influencing the Player Fraction in a Population: Age structure?a Population: Age structure?
• Most players are between 18 and 35 years old• Most players are between 18 and 35 years old� From a non-representative survey among pokerstrategy.deusers
� Used as an indicator?
• Player fraction in relation to 18-35 year olds?
University of HamburgInstitute of Law & EconomicsDivision on Gambling
25The Regional Breakdown of the Online Poker Market
Vienna 2010

Market SizeMarket Size
Gross Market size 2010Rank Country
Gross Market size 2010
Size in mil. US$ per year Share
1 USA 973.30 26.95%
2 Germany 391.94 10.85%2 Germany 391.94 10.85%
3 Russia 235.12 6.51%
4 Canada 219.63 6.08%
5 France 187.35 5.19%5 France 187.35 5.19%
6 Great Britain 159.72 4.42%
7 Netherlands 152.80 4.23%
8 Spain 117.07 3.24%8 Spain 117.07 3.24%
9 Sweden 99.25 2.75%
10 Finland 80.93 2.24%
Total 3,611.59 100%Total 3,611.59 100%
University of HamburgInstitute of Law & EconomicsDivision on Gambling
26

Player Fraction in the Federal States of the USAthe USA
University of HamburgInstitute of Law & EconomicsDivision on Gambling
27

The online poker market in the USA #1The online poker market in the USA #1
University of HamburgInstitute of Law & EconomicsDivision on Gambling
28The Regional Breakdown of the Online Poker Market
Vienna 2010

The online poker market in the USA #2The online poker market in the USA #2
University of HamburgInstitute of Law & EconomicsDivision on Gambling
29
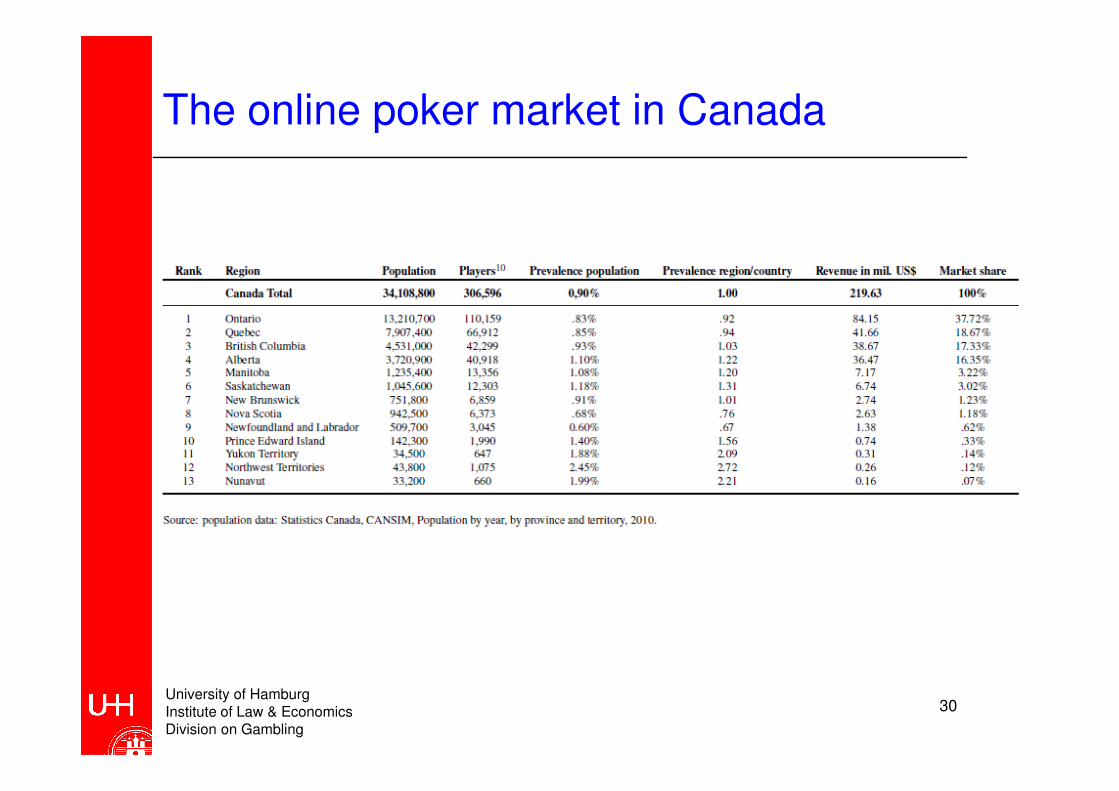
The online poker market in CanadaThe online poker market in Canada
University of HamburgInstitute of Law & EconomicsDivision on Gambling
30

Playing habits of online poker Playing habits of online poker playersplayers
(worldwide, total sample)
University of HamburgInstitute of Law & EconomicsDivision on Gambling
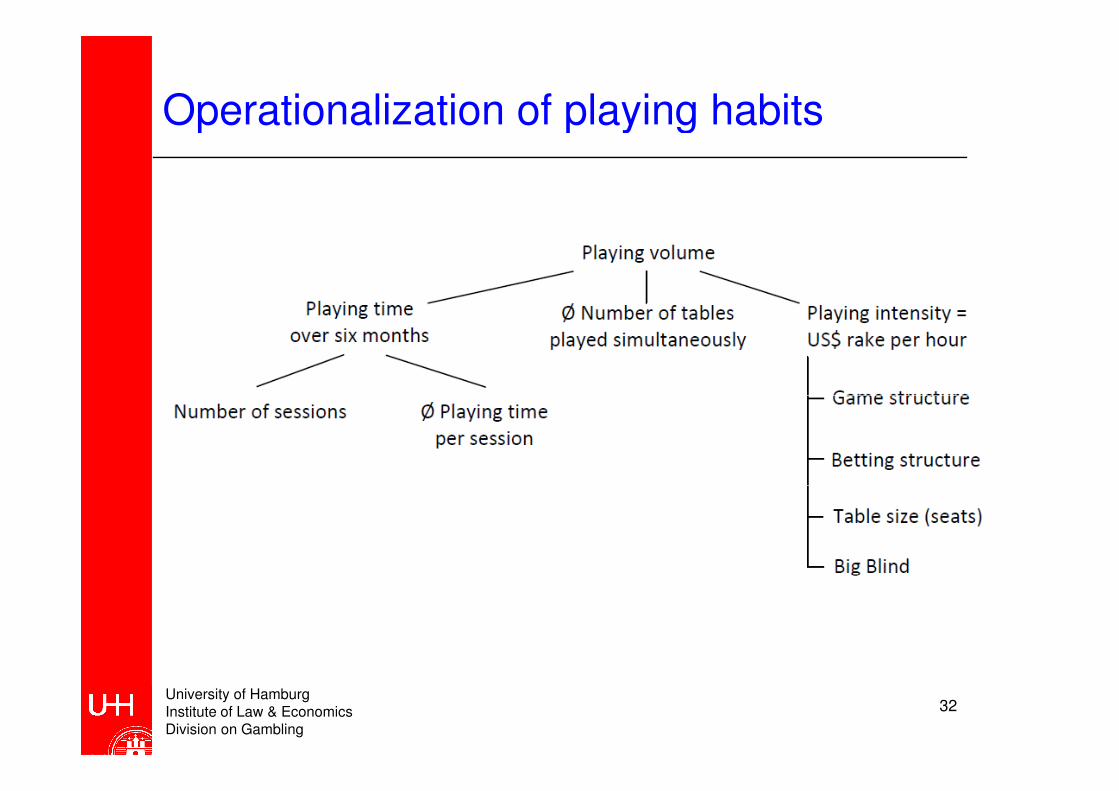
Operationalization of playing habitsOperationalization of playing habits
University of HamburgInstitute of Law & EconomicsDivision on Gambling
32

Number of sessionsNumber of sessions
OperatorPlaying
identities
Number of
sessions
Ø
sessions
Median
sessions
σ
sessionsidentities sessions sessions sessions sessions
IPN (Boss Media) 258,962 5,025,076 19.40 5 42.80IPN (Boss Media) 258,962 5,025,076 19.40 5 42.80
Everest Poker 270,823 6,099,113 22.52 6 47.94
Cake Poker 231,355 4,055,062 17.53 6 36.38Cake Poker 231,355 4,055,062 17.53 6 36.38
Full Tilt Poker 1,380,691 33,013,567 23.91 8 45.51
Pokerstars 2,411,745 57,667,398 23.91 7 49.02Pokerstars 2,411,745 57,667,398 23.91 7 49.02
Gesamt 4,553,576 105,860,216 23.25 7 47.03
University of HamburgInstitute of Law & EconomicsDivision on Gambling
33

Number of sessions #2Number of sessions #2
18,41%
22,85%
18,52%18,41% 18,52%17,54%
10,48%
7,03%7,03%
3,31%
1,85%1,85%
1 1-4 5-10 11-25 26-50 51-100 101-180 180+
University of HamburgInstitute of Law & EconomicsDivision on Gambling
34

Number of sessions #3Number of sessions #3
235250
200
103
150
41
60
103
50
100
1 1 1 2 2 3 3 4 5 7 8 11 13 1722
30
41
0
50
5 10 15 20 25 30 35 40 45 50 55 60 65 70 75 80 85 90 95 995 10 15 20 25 30 35 40 45 50 55 60 65 70 75 80 85 90 95 99
Percentile
University of HamburgInstitute of Law & EconomicsDivision on Gambling
35

Session length in minutesSession length in minutes
OperatorØ-session length Ø-session length of the σ of the Ø-session
OperatorØ-session length
of the Ø player
Ø-session length of the
median player
σ of the Ø-session
length
IPN (Boss Media) 47.52 40.00 36.72
Everest Poker 45.48 37.56 37.76Everest Poker 45.48 37.56 37.76
Cake Poker 45.76 39.00 39.53
Full Tilt Poker 51.21 42.42 39.57
Pokerstars 50.27 42.00 37.76Pokerstars 50.27 42.00 37.76
Total 49.85 41.50 38.46
University of HamburgInstitute of Law & EconomicsDivision on Gambling
36

Session length in minutes #2Session length in minutes #2
39,12%
25,35%25,35%
14,41%
8,11% 7,52%5,49%
<=30 31-60 61-90 91-120 121-180 180+
University of HamburgInstitute of Law & EconomicsDivision on Gambling
37

Session length #3Session length #3
326
300
350
189200
250
Min
ute
s
39 4150 54
6170
8193
111
139
100
150
Min
ute
s
5 5 520 20 23
30 3139 41
50 54
0
50
5 10 15 20 25 30 35 40 45 50 55 60 65 70 75 80 85 90 95 99
Percentile
University of HamburgInstitute of Law & EconomicsDivision on Gambling
38

Playing time over 6 monthsPlaying time over 6 months
Ø playing Median σ playing
OperatorPlayer
Identities
Playing time
in hours
Ø playing
time in
hours
Median
playing time
in hours
σ playing
time in
hours
IPN (Boss Media) 258,962 5,155,933 19.91 3.10 57.10IPN (Boss Media) 258,962 5,155,933 19.91 3.10 57.10
Everest Poker 270,823 6,524,126 24.09 3.82 66.85
Cake Poker 231,355 4,032,517 17.43 3.97 46.21Cake Poker 231,355 4,032,517 17.43 3.97 46.21
Full Tilt Poker 1,380,691 34,172,102 24.75 5.67 59.45
Pokerstars 2,411,745 60,510,682 25.09 4.89 64.81Pokerstars 2,411,745 60,510,682 25.09 4.89 64.81
Total 4,553,576 110,395,360 24.24 4.87 62.13
University of HamburgInstitute of Law & EconomicsDivision on Gambling
39

Playing time over 6 months in hoursPlaying time over 6 months in hours
28,29%
22,17%
20,32%
12,99%
10,50%
5,73%
<1 Std. 1-5 Std. 5-15 Std. 15-35 Std. 35-100 Std. > 100 Std.
University of HamburgInstitute of Law & EconomicsDivision on Gambling
40

Playing time over 6 months in hours #2Playing time over 6 months in hours #2
18114
16000
18000
20000
10000
12000
14000
16000
Min
ute
s
3604
6692
4000
6000
8000
10000
Min
ute
s
5 20 34 50 70 97 130 171 224 292 381 496 650 860 11571598
2308
0
2000
4000
5 10 15 20 25 30 35 40 45 50 55 60 65 70 75 80 85 90 95 99
Percentile
University of HamburgInstitute of Law & EconomicsDivision on Gambling
41

Extrapolation: Playing time 1 yearExtrapolation: Playing time 1 year
Operator Hours Days Years Human Lives Share
IPN (Boss Media) 10,311,866 429,661 1,177 15.70 3.02%IPN (Boss Media) 10,311,866 429,661 1,177 15.70 3.02%
Everest Poker 13,048,252 543,677 1,490 19.86 3.82%
Cake Poker 8,065,034 336,043 921 12.28 2.36%
Full Tilt Poker 68,344,204 2,847,675 7,802 104.02 20.03%Full Tilt Poker 68,344,204 2,847,675 7,802 104.02 20.03%
Pokerstars 121,021,364 5,042,557 13,815 184.20 35.47%
Other 120,356,870 4,953,638 13,572 181 35.28%
Total 341,147,590 14,153,251 38,776 517 100,00%Total 341,147,590 14,153,251 38,776 517 100,00%
University of HamburgInstitute of Law & EconomicsDivision on Gambling
42

Total playing time, session length andnumber of sessions: increase per percentilenumber of sessions: increase per percentile
PerzcntileTotal playing
time
Increase in
%
Session
length
Increase in
%
Number of
sessions
Increase in
%time % length % sessions %
5 5 - 5 - 1 -
10 20 300,0% 5 0,0% 1 0,0%
15 34 70,0% 5 0,0% 1 0,0%
20 50 47,1% 20 300,0% 2 100,0%20 50 47,1% 20 300,0% 2 100,0%
25 70 40,0% 20 0,0% 2 0,0%
30 97 38,6% 23 15,0% 3 50,0%
35 130 34,0% 30 30,4% 3 0,0%35 130 34,0% 30 30,4% 3 0,0%
40 171 31,5% 31 3,3% 4 33,3%
45 224 31,0% 39 25,8% 5 25,0%
50 292 30,4% 41 5,1% 7 40,0%
55 381 30,5% 50 22,0% 8 14,3%55 381 30,5% 50 22,0% 8 14,3%
60 496 30,2% 54 8,0% 11 37,5%
65 650 31,0% 61 13,0% 13 18,2%
70 860 32,3% 70 14,8% 17 30,8%70 860 32,3% 70 14,8% 17 30,8%
75 1157 34,5% 81 15,7% 22 29,4%
80 1598 38,1% 93 14,8% 30 36,4%
85 2308 44,4% 111 19,4% 41 36,7%
90 3604 56,2% 139 25,2% 60 46,3%University of HamburgInstitute of Law & EconomicsDivision on Gambling
43
90 3604 56,2% 139 25,2% 60 46,3%
95 6692 85,7% 189 36,0% 103 71,7%
99 18114 170,7% 326 72,5% 235 128,2%

MultitablingMultitabling
Operator Ø tables Median tables σ tables
IPN (Boss Media) 1.22 1.01 0.70IPN (Boss Media) 1.22 1.01 0.70
Everest Poker 1.25 1.02 0.73
Cake Poker 1.44 1.03 1.21
Full Tilt Poker 1.35 1.05 0.89Full Tilt Poker 1.35 1.05 0.89
Pokerstars 1.31 1.05 1.04
Total 1.32 1.04 0.97
University of HamburgInstitute of Law & EconomicsDivision on Gambling
44

Multitabling #2Multitabling #2
62,03%
16,15%
5,82% 5,35% 4,49%2,25% 2,24% 1,67%
1 2 3 4 5-6 7-8 9-12 12+
• Not per player but per session!
University of HamburgInstitute of Law & EconomicsDivision on Gambling
45

Multitabling #3Multitabling #3
18
16
14
16
18N
um
be
r o
f ta
ble
s p
laye
d s
imu
lta
ne
ou
sly
8
10
12
Nu
mb
er
of
tab
les
pla
yed
sim
ult
an
eo
usl
y
3
4
5
8
4
6
8
Nu
mb
er
of
tab
les
pla
yed
sim
ult
an
eo
usl
y
1 1 1 1 1 1 1 1 1 1 1 1
2 2 2
3
0
2
4
5 10 15 20 25 30 35 40 45 50 55 60 65 70 75 80 85 90 95 99
Nu
mb
er
of
tab
les
pla
yed
sim
ult
an
eo
usl
y
5 10 15 20 25 30 35 40 45 50 55 60 65 70 75 80 85 90 95 99
Percentile
• Not per player but per session!
University of HamburgInstitute of Law & EconomicsDivision on Gambling
46

Game types and limits, definition for No Limit Holdem Limit Holdem
Limit (Small Blind/Big Blind) StakesLimit (Small Blind/Big Blind) Stakes
0,01/0,02-0,05/0,10 Micro
0,10/0,20- 0,5/1 Low
0,75/1,50-5/10 Mid0,75/1,50-5/10 Mid
8/16-500/1000 High
University of HamburgInstitute of Law & EconomicsDivision on Gambling
47

Players per poker variant and stake
Pokervariant*Microstakes Lowstakes Midstakes Highstakes Total
Players % Var % Tot Players % Var % Tot Players % Var % Tot Players % Var % Tot Absolut % Tot
Texas Holdem NL 3015319 48,4% 28,4% 2567389 41,2% 24,22% 621010 9,97% 5,86% 22404 0,36% 0,21% 6226122 58,73%
Texas Holdem FL 936269 52,6% 8,83% 674773 37,9% 6,37% 158451 8,89% 1,49% 12334 0,69% 0,12% 1781827 16,81%
Texas Holdem PL 178560 33,2% 1,68% 335521 62,3% 3,17% 24329 4,52% 0,23% 170 0,03% 0,00% 538580 5,08%Texas Holdem ML 8.943 68,81% 0,08% 3.913 30,11% 0,04% 93 0,72% 0,00% 47 0,36% 0,00% 12.996 0,12%
Omaha NL 652 56,99% 0,01% 313 27,36% 0,00% 155 13,55% 0,00% 24 2,10% 0,00% 1.144 0,01%
Omaha FL 15.657 54,97% 0,15% 7.730 27,14% 0,07% 5.073 17,81% 0,05% 21 0,07% 0,00% 28.481 0,27%
Omaha PL 404516 41,1% 3,82% 404347 41,0% 3,81% 162.187 16,5% 1,53% 14203 1,44% 0,13% 985253 9,29%Omaha PL 404516 41,1% 3,82% 404347 41,0% 3,81% 162.187 16,5% 1,53% 14203 1,44% 0,13% 985253 9,29%Omaha Hi/Lo NL 31.771 24,61% 0,30% 74.929 58,04% 0,71% 22.190 17,19% 0,21% 200 0,15% 0,00% 129.090 1,22%
Omaha Hi/Lo FL 50.068 33,54% 0,47% 67.797 45,41% 0,64% 28.307 18,96% 0,27% 3.120 2,09% 0,03% 149.292 1,41%
Omaha Hi/Lo PL 79.438 48,29% 0,75% 69.120 42,02% 0,65% 15.736 9,57% 0,15% 209 0,13% 0,00% 164.503 1,55%
Omaha Hi/Lo ML 16 44,44% 0,00% 20 55,56% 0,00% 0 0,00% 0,00% 0 0,00% 0,00% 36 0,00%
7 Card Stud NL 9 52,94% 0,00% 3 17,65% 0,00% 5 29,41% 0,00% 0 0,00% 0,00% 17 0,00%
7 Card Stud FL 70.155 44,41% 0,66% 72.992 46,21% 0,69% 13.889 8,79% 0,13% 929 0,59% 0,01% 157.965 1,49%
7 Card Stud PL 37 48,05% 0,00% 38 49,35% 0,00% 2 2,60% 0,00% 0 0,00% 0,00% 77 0,00%7 Card Stud PL 37 48,05% 0,00% 38 49,35% 0,00% 2 2,60% 0,00% 0 0,00% 0,00% 77 0,00%
7 Card Stud Hi/Lo FL 29.303 39,07% 0,28% 35.860 47,82% 0,34% 8.930 11,91% 0,08% 903 1,20% 0,01% 74.996 0,71%
5 Card Stud FL 0 0,00% 0,00% 251 100,00% 0,00% 0 0,00% 0,00% 0 0,00% 0,00% 251 0,00%
5 Card Draw NL 0 100,00% 0,15% 15.382 100,00% 0,15% 0 0,00% 0,00% 0 0,00% 0,00% 15.382 0,15%
5 Card Draw FL 43.448 50,27% 0,41% 38.356 44,38% 0,36% 4.569 5,29% 0,04% 49 0,06% 0,00% 86.422 0,82%
5 Card Draw PL 4.513 14,76% 0,04% 17.279 56,52% 0,16% 8.727 28,55% 0,08% 52 0,17% 0,00% 30.571 0,29%
5 Card 7-A Draw FL 5.512 26,98% 0,05% 13.085 64,05% 0,12% 1.831 8,96% 0,02% 0 0,00% 0,00% 20.428 0,19%
5 Card 7-A Draw PL 12.348 45,89% 0,12% 14.561 54,11% 0,14% 0 0,00% 0,00% 0 0,00% 0,00% 26.909 0,25%5 Card 7-A Draw PL 12.348 45,89% 0,12% 14.561 54,11% 0,14% 0 0,00% 0,00% 0 0,00% 0,00% 26.909 0,25%
Triple Draw Lowball 2-7 NL 0 0,00% 0,00% 2.102 100,00% 0,02% 0 0,00% 0,00% 0 0,00% 0,00% 2.102 0,02%
Triple Draw Lowball 2-7 FL 8.738 39,34% 0,08% 9.613 43,28% 0,09% 3.059 13,77% 0,03% 799 3,60% 0,01% 22.209 0,21%
Triple Draw Lowball 2-7 PL 0 0,00% 0,00% 791 100,00% 0,01% 0 0,00% 0,00% 0 0,00% 0,00% 791 0,01%
Single Lowball 2-7 NL 0 0,00% 0,00% 4.242 88,30% 0,04% 552 11,49% 0,01% 10 0,21% 0,00% 4.804 0,05%
Razz FL 29.375 41,13% 0,28% 32.027 44,85% 0,30% 9.372 13,12% 0,09% 643 0,90% 0,01% 71.417 0,67%
Soko FL 0 0,00% 0,00% 1.865 100,00% 0,02% 0 0,00% 0,00% 0 0,00% 0,00% 1.865 0,02%
Badugi FL 0 0,00% 0,00% 18.395 87,19% 0,17% 2.339 11,09% 0,02% 363 1,72% 0,00% 21.097 0,20%Badugi FL 0 0,00% 0,00% 18.395 87,19% 0,17% 2.339 11,09% 0,02% 363 1,72% 0,00% 21.097 0,20%
HORSE/HEROS FL 8.589 42,04% 0,08% 10.676 52,25% 0,10% 1.127 5,52% 0,01% 40 0,20% 0,00% 20.432 0,19%
HOSE FL 360 72,43% 0,00% 111 22,33% 0,00% 24 4,83% 0,00% 2 0,40% 0,00% 497 0,00%
8-Game FL 0 0,00% 0,00% 19.189 82,39% 0,18% 2.881 12,37% 0,03% 1.221 5,24% 0,01% 23.291 0,22%
Other Mixed Games FL 1.480 71,64% 0,01% 574 27,78% 0,01% 10 0,48% 0,00% 2 0,10% 0,00% 2.066 0,02%
SUMME 4.935.076 46,55% 4.513.244 42,57% 1.094.848 10,33% 57.745 0,54% 10.600.913 100,00%
*NL = No Limit, FL = Fixed Limit, PL = Pot Limit, ML = Mixed Limit.
University of HamburgInstitute of Law & EconomicsDivision on Gambling
48
*NL = No Limit, FL = Fixed Limit, PL = Pot Limit, ML = Mixed Limit.

Players per stakePlayers per stake
46,55%
42,57%
10,33%
0,54%
Microstakes Lowstakes Midstakes Highstakes
University of HamburgInstitute of Law & EconomicsDivision on Gambling
49

Players per betting structurePlayers per betting structure
60,17%
23,23%
16,48%16,48%
0,12%
No Limit Fixed Limit Pot Limit Mixed Limit
University of HamburgInstitute of Law & EconomicsDivision on Gambling
50
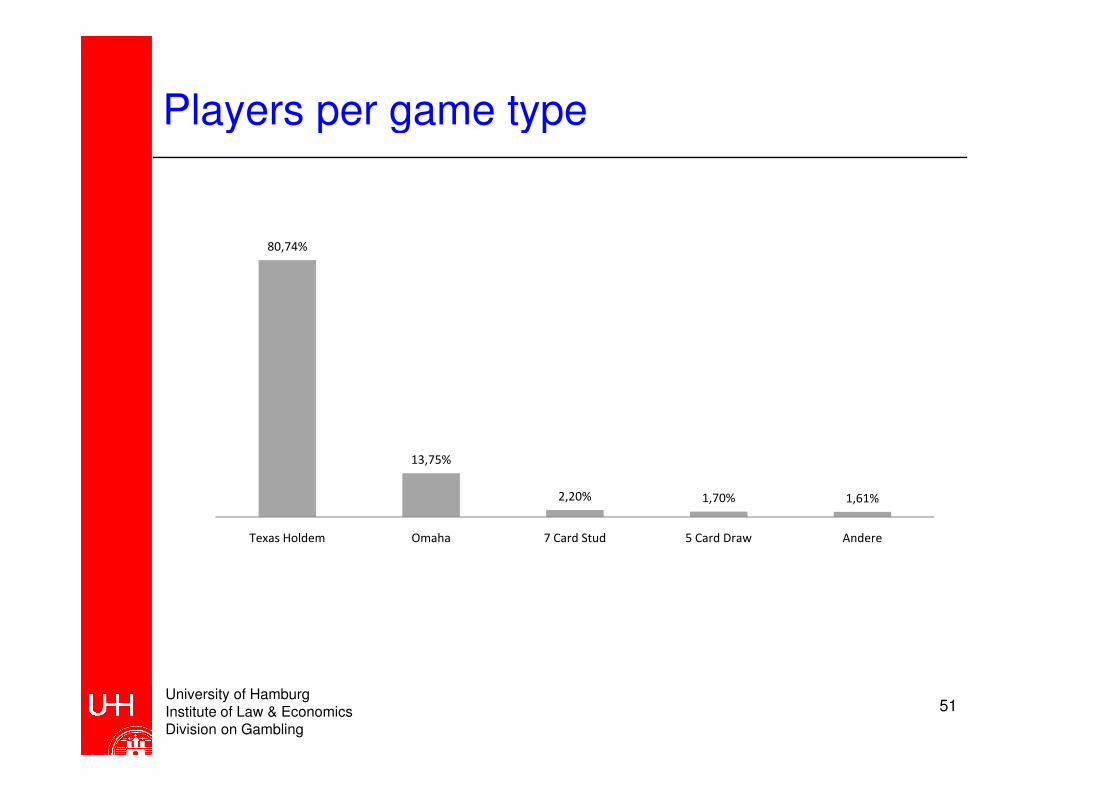
Players per game typePlayers per game type
80,74%
13,75%
2,20% 1,70% 1,61%
Texas Holdem Omaha 7 Card Stud 5 Card Draw Andere
University of HamburgInstitute of Law & EconomicsDivision on Gambling
51

Rake per 100 hands: No Limit Texas Holdem (industry average)
3535,00 $
Holdem (industry average)
25
30
25,00 $
30,00 $
$/100h 10max
15
20
15,00 $
20,00 $
BB
/10
0h
$/1
00
h
$/100h 10max
BB/100h 10max
$/100h 6max
10
15
10,00 $
15,00 $
BB/100h 6max
$/100h 2max
BB/100h 2max
0
5
0,00 $
5,00 $BB/100h 2max
University of HamburgInstitute of Law & EconomicsDivision on Gambling
52

Rake per 100 hands: Fixed Limit Texas Holdem (industry average)Holdem (industry average)
860,00 $
6
750,00 $
4
5
30,00 $
40,00 $
BB
/10
0h
$/1
00
h
$/100h 10max
$/100h 6max
$/100h 2max
1
2
3
10,00 $
20,00 $
BB
/10
0h
BB/100h 10max
BB/100h 6max
BB/100h 2max
0
1
0,00 $
BB/100h 2max
University of HamburgInstitute of Law & EconomicsDivision on Gambling
53

Rake per 100 hands: Pot Limit Omaha (industry average)(industry average)
3540,00 $
30
35
30,00 $
35,00 $
40,00 $
20
25
20,00 $
25,00 $
30,00 $
BB
/10
0h
$/1
00
h
$/100h 6max
BB/100h 6max
10
15
10,00 $
15,00 $
20,00 $
BB
/10
0h
$/1
00
h
BB/100h 6max
$/100h 2max
BB/100h 2max
0
5
0,00 $
5,00 $
10,00 $
00,00 $
University of HamburgInstitute of Law & EconomicsDivision on Gambling
54

Playing intensity: $ Rake per hour(industry average)(industry average)
2040
14
16
18
20
30
35
40
10
12
14
20
25
BB
/10
0h
US
$/1
00
h
US$/100h 10max
4
6
8
10
15 BB
/10
0h
US
$/1
00
h
BB/100h 10max
0
2
0
5US$/100h 6max
BB/100h 6max
• ~2,400 combinations for the different operators, game types, betting structures, number of players, and limits
University of HamburgInstitute of Law & EconomicsDivision on Gambling
55
types, betting structures, number of players, and limits

Playing intensity: $ Rake per hourPlaying intensity: $ Rake per hour
Operator Ø Rake/h in $ Median Rake/h in $ σ Rake/h in $
IPN (Boss Media) 4.70 1.94 8.51IPN (Boss Media) 4.70 1.94 8.51
Everest Poker 3.82 1,56 6.44
Cake Poker 4.57 1.99 6.80
Full Tilt Poker 3.82 1.72 5.84
Pokerstars 2.40 0.87 4.46
Total 3.20 1.25 5.58Total 3.20 1.25 5.58
University of HamburgInstitute of Law & EconomicsDivision on Gambling
56

Playing intensity: $ Rake per hour #2Playing intensity: $ Rake per hour #2
20,56%
15,82%
17,98%17,28%
14,76%
10,19%
3,42%
<=0,2 0,2-0,5 0,5-1 1-2 2-5 5-15 15+
University of HamburgInstitute of Law & EconomicsDivision on Gambling
57

Playing intensity: $ Rake per hour #3Playing intensity: $ Rake per hour #3
30,0
25,8
25,0
30,0
20,0
Ra
ke
in
$ p
er
ho
ur
8,2
12,5
10,0
15,0
Ra
ke
in
$ p
er
ho
ur
0,4 0,5 0,6 0,7 0,9 1,0 1,3 1,5 1,9 2,32,9
3,64,6
6,0
8,2
5,0
0,1 0,2 0,3 0,4 0,5 0,6 0,7 0,9 1,0 1,3
0,0
5 10 15 20 25 30 35 40 45 50 55 60 65 70 75 80 85 90 95 99
Percentile
University of HamburgInstitute of Law & EconomicsDivision on Gambling
58

Key figure: Playing volume ($ rake over 6 months)months)
Operator Plaing volume in $ Ø Rake in $ Median Rake in $ σ Rake $Operator Plaing volume in $ Ø Rake in $ Median Rake in $ σ Rake $
Pokerstars 419,211,026 172.57 4.71 2,231.30
Full Tilt Poker 301,490,088 217.13 11.25 1,546.00
Everest Poker 55,235,725 200.47 5,75 1,771.25Everest Poker 55,235,725 200.47 5,75 1,771.25
IPN (Boss Media) 48,963,418 185.20 6.13 1,434.60
Cake Poker 38,010,623 162.74 9.12 963,17
Total 862,910,881 187.95 6.69 1,926.61Total 862,910,881 187.95 6.69 1,926.61
Playing volume = players‘ losses = industry‘s profits = market size
University of HamburgInstitute of Law & EconomicsDivision on Gambling
59
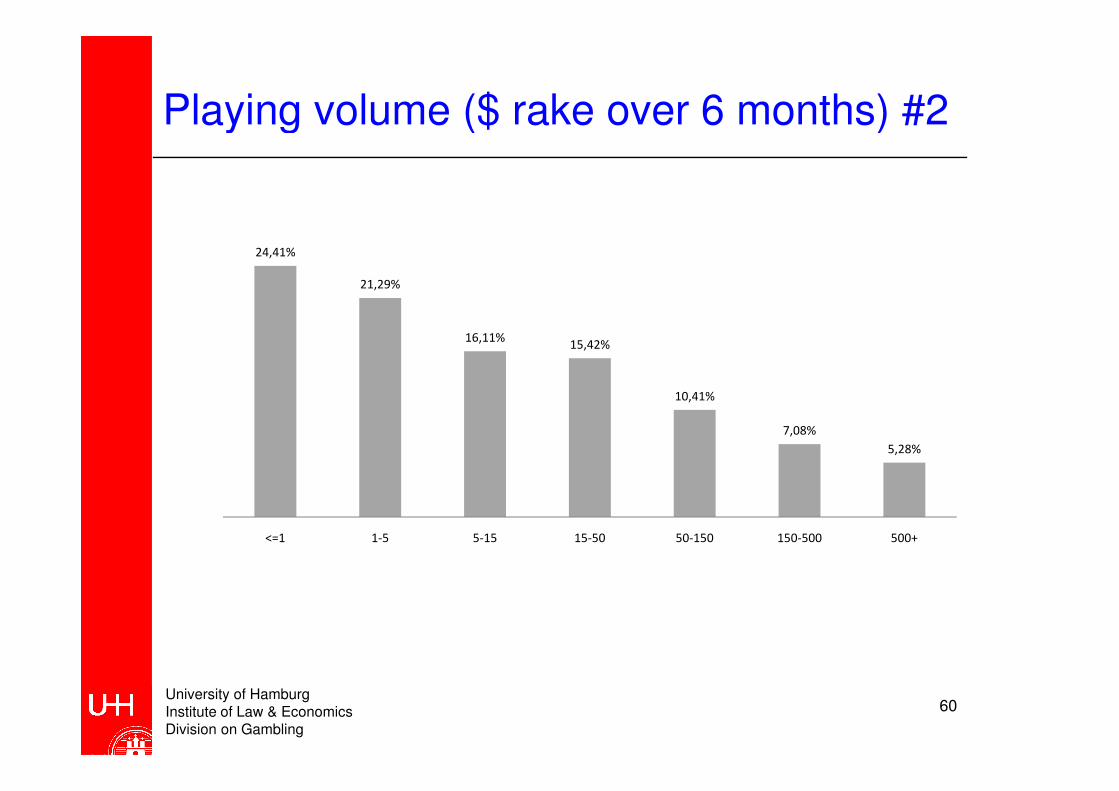
Playing volume ($ rake over 6 months) #2Playing volume ($ rake over 6 months) #2
24,41%
21,29%
16,11%15,42%
10,41%10,41%
7,08%
5,28%
<=1 1-5 5-15 15-50 50-150 150-500 500+
University of HamburgInstitute of Law & EconomicsDivision on Gambling
60

Playing volume ($ rake over 6 months) #3Playing volume ($ rake over 6 months) #3
3058
3000,0
3500,0
1500,0
2000,0
2500,0
Pla
yin
g v
olu
me
in
$
536
500,0
1000,0
1500,0
Pla
yin
g v
olu
me
in
$
0,1 0,2 0,4 0,7 1,1 1,6 2,4 3,4 4,8 6,7 9,4 13,2 18,9 27,4 41,2 64,5 109208
0,0
500,0
5 10 15 20 25 30 35 40 45 50 55 60 65 70 75 80 85 90 95 99
PercentilePercentile
University of HamburgInstitute of Law & EconomicsDivision on Gambling
61

Nonparametric Spearman correlations among the variables of the gambling habits (n=2,127,887)variables of the gambling habits (n=2,127,887)
SessionsSession
Length
Playing
TimeTables
Playing
Intensity
Playing
Volume
Playing
Duration
Sessions
/Day
Time
/Day
Rake
/DayLength Time Intensity Volume Duration /Day /Day /Day
Sessions - .360** .939** .534** .160** .793** .831** -.171** .139** .264**
Session Length - .644** .428** .031** .527** .235** .049** .612** .483**
Playing Time - .587** .141** .836** .749** -.100** .345** .399**
Tables - .113** .564** .416** -.037** .246** .357**
Playing
Intensity
- .633** .187** -.106** -.078** .674**
Playing
Volume
- .667** -.130** .243** .689**
Playing
Duration
- -.607** -.290** -.029**
Duration
Sessions/Day - .771** .448**
Time/Day - .642**
Rake/Day -Rake/Day -
** Correlation significant at p<.01.
• Playing habits reinforce each other• Only playing frequency is a moderator to gambling involvementUniversity of HamburgInstitute of Law & EconomicsDivision on Gambling
62
• Only playing frequency is a moderator to gambling involvement
Playing habits of intensse players(worldwide)(worldwide)
University of HamburgInstitute of Law & EconomicsDivision on Gambling

Number of sessions, intense playersNumber of sessions, intense players
235250
8190
103119
141
174
100
150
200
60 66 73 8190
0
50
100
90 91 92 93 94 95 96 97 98 99
Percentile
35%
40%Increase
14,4% 15,5%18,5%
23,4%
35,1%
10%
15%
20%
25%
30%
35% Increase
10,0% 10,6% 11,0% 11,1%14,4% 15,5%
0%
5%
10%
90-91 91-92 92-93 93-94 94-95 95-96 96-97 97-98 98-99
Percentiles
University of HamburgInstitute of Law & EconomicsDivision on Gambling
64
Percentiles

Session length, intense playersSession length, intense players
262
326
300
350
139 146 152 162 173189
205229
262
100
150
200
250
300
Min
ute
s
0
50
100
90 91 92 93 94 95 96 97 98 99
PercentilePercentile
24,4%20%
25%
30%Increase
5,0% 4,1% 6,6% 6,8%9,2% 8,5%
11,7%14,4%
24,4%
0%
5%
10%
15%
20%
0%
90-91 91-92 92-93 93-94 94-95 95-96 96-97 97-98 98-99
Percentiles
University of HamburgInstitute of Law & EconomicsDivision on Gambling
65
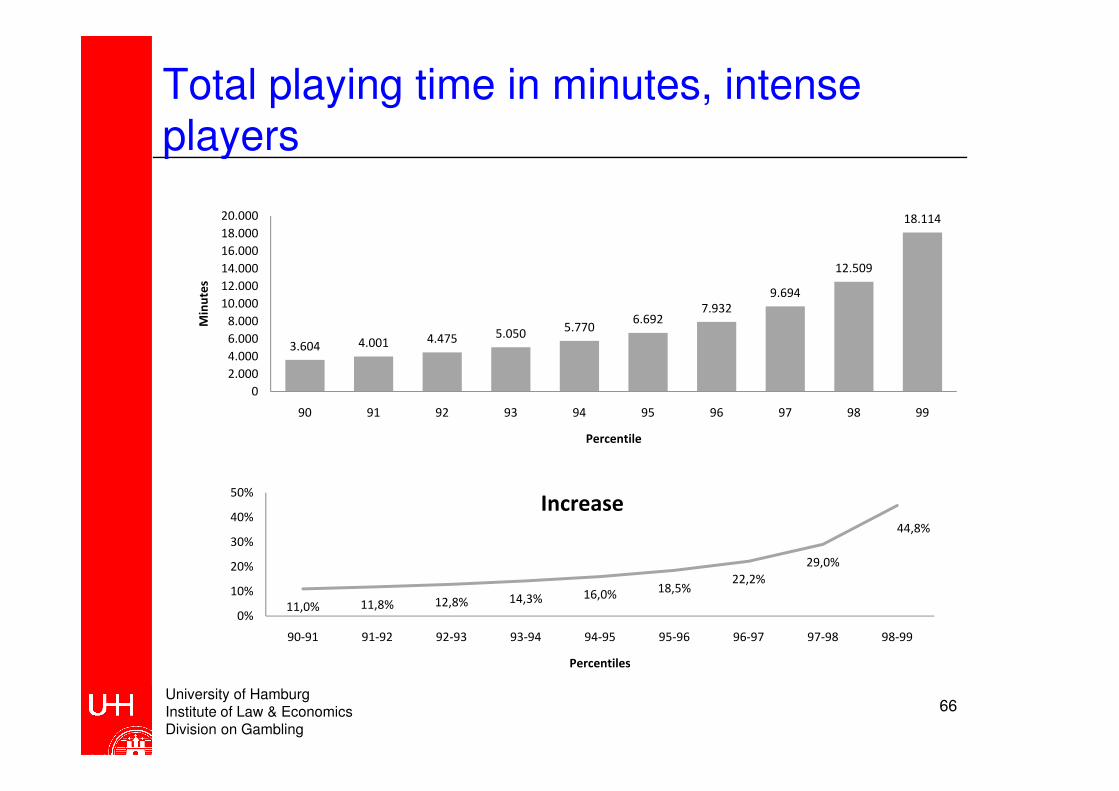
Total playing time in minutes, intenseplayersplayers
18.11420.000
7.932
9.694
12.509
18.114
10.000
12.000
14.000
16.000
18.000
20.000M
inu
tes
3.604 4.001 4.475 5.0505.770
6.6927.932
0
2.000
4.000
6.000
8.000
10.000
Min
ute
s
0
90 91 92 93 94 95 96 97 98 99
Percentile
50%
22,2%
29,0%
44,8%
20%
30%
40%
50%Increase
11,0% 11,8% 12,8% 14,3% 16,0%18,5%
22,2%
0%
10%
90-91 91-92 92-93 93-94 94-95 95-96 96-97 97-98 98-99
Percentiles
University of HamburgInstitute of Law & EconomicsDivision on Gambling
66
Percentiles

Aggregate playing time, intense playersAggregate playing time, intense players
Group Hours Share of total hours
Top 1% 21,364,306 19.35%Top 1% 21,364,306 19.35%
Top 5% 53,185,320 48.18%
Top 10% 71,696,232 64.94%
University of HamburgInstitute of Law & EconomicsDivision on Gambling
67

Playing time of intense players comparedto median playerto median player
Percentile Compared to the median playerPercentile Compared to the median player
90 12,34
91 13,70
92 15,33
93 17,29
94 19,7694 19,76
95 22,92
96 27,1696 27,16
97 33,20
98 42,84
99 62,03
University of HamburgInstitute of Law & EconomicsDivision on Gambling
68

Multitabling, intense playersMultitabling, intense players
1616
18
78 8
10
12
8
10
12
14
5 56 6
7
2
4
6
8
0
90 91 92 93 94 95 96 97 98 99
Percentile
• Not per player but per session!
University of HamburgInstitute of Law & EconomicsDivision on Gambling
69

Playing intensity, intense playersPlaying intensity, intense players
25,830
10,4 11,412,5
14,015,9
19,1
25,8
15
20
25
$ R
ak
e p
er
ho
ur
8,2 8,9 9,6 10,4 11,412,5
0
5
10
15
$ R
ak
e p
er
0
90 91 92 93 94 95 96 97 98 99
Percentile
35,2%35%
40%
Increase
13,5%
20,2%
35,2%
10%
15%
20%
25%
30% Increase
8,4% 8,3% 8,6% 9,3% 9,4%12,3% 13,5%
0%
5%
10%
90-91 91-92 92-93 93-94 94-95 95-96 96-97 97-98 98-99
Percentiles
University of HamburgInstitute of Law & EconomicsDivision on Gambling
70
Percentiles

Key figure: Playing volume, intenseplayersplayers
3.0583.500
1.529
3.058
1.500
2.000
2.500
3.000p
aid
in 6
mo
nth
s
208 243 288 346 424 536703
982
0
500
1.000
1.500
$ R
ak
e p
aid
0
90 91 92 93 94 95 96 97 98 99
Percentiles
100%
120%
Increase
39,8%
55,7%
100,0%
20%
40%
60%
80%
100%
Increase
16,9% 18,4% 20,1% 22,6% 26,3%31,1%
39,8%
0%
20%
90-91 91-92 92-93 93-94 94-95 95-96 96-97 97-98 98-99
Percentiles
University of HamburgInstitute of Law & EconomicsDivision on Gambling
71

Playing volume of intense playerscompared to median playercompared to median player
Percentile Compared to the median player
90 31,12
91 36,3891 36,38
92 43,06
93 51,70
94 63,4094 63,40
95 80,09
96 105,03
97 146,8297 146,82
98 228,56
99 457,06
University of HamburgInstitute of Law & EconomicsDivision on Gambling
72

Share of total playing volume, intenseplayersplayers
Group $ Rake Share of total RakeGroup $ Rake Share of total Rake
Top 1% 448,939,210 54.88%
Top 5% 658,081,834 80.44%
Top 10% 731,079,221 89.36%Top 10% 731,079,221 89.36%
University of HamburgInstitute of Law & EconomicsDivision on Gambling
73

Are intense players at risk of becomingpathological gamblers?pathological gamblers?
• Poker can be played with positive expected value
• There are (semi-)professionals in the player pool• There are (semi-)professionals in the player pool
• (Semi-)professionals hafe the financial incentive to playintensely � they are in the group of intense playersintensely � they are in the group of intense players
• Intense players do not necessarily have gamblingproblems
• Distinguishing professionals froom pathological gamblers: Impulsivity (Weinstock & Petry 2009)
• No answer – yet. • No answer – yet.
University of HamburgInstitute of Law & EconomicsDivision on Gambling
74

Results of the playing habits: OverviewResults of the playing habits: Overview
Ø Median σ Top 10% Top 5% Top 1% TotalØ Median σ Top 10% Top 5% Top 1% Total
Number of sessions 24.03 7 49.30 63 108 247 51,141,167
Session length in min. 50.27 42.0 37.76 94.78 118.6 182.3 -Session length in min.
Total playing time in h 25.28 4.88 65.21 62.78 117.6 318.0 53,785,011
Number of tables 1.31 1.05 1.04 1.65 2.36 6.03 -
Playing intensity (US$ Playing intensity (US$
rake/h)2.40 0.87 4.46 6.12 9.90 19.75 -
Playing volume in US$ 177.5 4.86 1,935 173.9 460.1 2,685 377,714,269
Playing duration 55.32 27 60.83 160 175 182 -Playing duration 55.32 27 60.83 160 175 182 -
Sessions/day 0.74 0.60 .66 1.50 2 3 -
Playing time/day 38.70 20.00 53.62 98.34 142.03 259.00 -Playing time/day 38.70 20.00 53.62 98.34 142.03 259.00 -
Playing volume in US$/day 2.48 .27 14.45 4.42 9.15 35.42 -
Attention: Overview for all Pokerstars players, not total sample!
University of HamburgInstitute of Law & EconomicsDivision on Gambling
75
Attention: Overview for all Pokerstars players, not total sample!

Playing habits of Regulars, Newcomers and DropoutsNewcomers and Dropouts
University of HamburgInstitute of Law & EconomicsDivision on Gambling

Definition of Regulars, Newcomers, andDropouts (W=Week)Dropouts (W=Week)
University of HamburgInstitute of Law & EconomicsDivision on Gambling
77

Hypotheses about gambling behaviorHypotheses about gambling behavior
• H0: Regulars do not show a different playing volume to non-• H0: Regulars do not show a different playing volume to non-
regulars.
• H1: Newcomers do not show a different playing volume to non-
newcomersnewcomers
• H2: Dropouts do not show a different playing volume to non-
dropouts
• H3: Dropouts do not show a different playing volume to
newcomers.
• H : The variables of playing behavior do not reinforce each • H4: The variables of playing behavior do not reinforce each
other.
• H5: Playing behavior of regulars does not change over time.5
• H7: Playing behavior of dropouts does not change over time.
• H6: Playing behavior of newcomers does not change over time.
University of HamburgInstitute of Law & EconomicsDivision on Gambling
78

Overview: Playing habits of Regulars, Newcomers, and DropoutsNewcomers, and Dropouts
RegularsNon-
RegularsNewcomers
Non-
NewcomersDropouts
Non-
Dropouts
Total
SampleRegulars Newcomers Dropouts Sample
n 228332 1899555 69734 2058153 321568 1799957 2127887
Number of
Sessions
ø 92.44 15.81 16.53 24.29 17.73 25.09 24.03
Median 59 5.00 5 7.00 7 7.00 7Sessions
σ 99.72 29.96 31.35 49.78 30.58 51.84 49.30
Avg. Session
Length in
Min.
ø 57.90 49.35 49.51 50.30 47.17 50.82 50.27
Median 50.53 40.94 41.10 42.00 40.00 42.54 42.00
σ 33.27 38.16 37.72 37.76 35.06 38.21 37.76Min. σ 33.27 38.16 37.72 37.76 35.06 38.21 37.76
Total Playing
Time in h
ø 101.21 16.15 17.14 25.55 17.59 26.58 25.28
Median 49.52 3.77 3.75 4.92 4.43 4.93 4.88
σ 142.16 39.47 42.32 65.83 40.01 68.62 65.21
ø 1.73 1.26 1.24 1.32 1.31 1.31 1.31
AvgTables
ø 1.73 1.26 1.24 1.32 1.31 1.31 1.31
Median 1.13 1.04 1.03 1.05 1.05 1.05 1.05
σ 1.82 .89 .82 1.05 1.02 1.05 1.04
Avg Playing
Intensity in
ø 3.03 2.32 2.30 2.40 2.27 2.42 2.40
Median 1.50 .81 .80 0.88 .78 .89 .87Intensity in
US$
Median 1.50 .81 .80 0.88 .78 .89 .87
σ 4.03 4.50 4.64 4.45 4.12 4.52 4.46
Total Rake
in US$
ø 998.29 78.85 73.01 181.05 109.02 189.33 177.51
Median 92.83 3.50 3.52 4.92 4.04 4.97 4.86
University of HamburgInstitute of Law & EconomicsDivision on Gambling
79
in US$σ 5,387.68 783.47 610.56 1,964.05 1,017.54 2,056.52 1,934.86

Overview: Playing habits of Regulars, Newcomers, and Dropouts #2Newcomers, and Dropouts #2
RegularsNon-
RegularsNewcomers
Non-
NewcomersDropouts
Non-
Dropouts
Total
Sample
228332 1899555 69734 2058153 321568n 228332 1899555 69734 2058153 321568 1799957 2127887
Playing
Duration in
Days
ø 171.34 41.37 42.67 55.75 52.10 55.56 55.32
Median 174 17.00 23 27.00 36 25.00 27
σ 9.25 48.19 43.57 61.29 50.33 62.37 60.83Days σ 9.25 48.19 43.57 61.29 50.33 62.37 60.83
Sessions per
Day
ø .53 .76 .72 0.74 .66 .75 .74
Median .34 .67 .59 0.60 .47 .63 .60
σ .55 .67 .65 0.66 .63 .67 .66
ø 34.58 39.20 36.63 38.77 32.10 39.95 38.70Time per Day
in Min.
ø 34.58 39.20 36.63 38.77 32.10 39.95 38.70
Median 17.35 20.00 19.50 20.00 15.70 20.00 20.00
σ 47.55 54.29 50.79 53.71 46.76 54.73 53.62
Rake per Day ø 5.63 2.10 1.83 2.50 2.12 2.55 2.48
Median .54 .25 .23 .28 .19 .29 .27Rake per Day
in US$Median .54 .25 .23 .28 .19 .29 .27
σ 29.97 11.16 9.38 14.59 12.72 14.74 14.45
University of HamburgInstitute of Law & EconomicsDivision on Gambling
80

Mann-Whitney-Test shows that for all variables, the two groups do not have the same population (p<.001)groups do not have the same population (p<.001)
Session Playing Playing Playing Sessions Playing RakeSessions
Session
Length
Playing
TimeTables
Playing
Intensity
Playing
VolumeDays
Sessions
/Day
Playing
Time/Day
Rake
/Day
Regulars
vs. Non-
Regulars
M-W-U 5.1E+10 1.7E+11 6.2E+10 1.3E+11 1.7E+11 7.4E+10 1.4E+09 1.7E+11 2.1E+11 1.8E+11
p <.001 <.001 <.001 <.001 <.001 <.001 <.001 <.001 <.001 <.001Regulars p <.001 <.001 <.001 <.001 <.001 <.001 <.001 <.001 <.001 <.001
Newcomers
vs. Non-
Newcomers
M-W-U 6.6E+10 7.1E+10 6.6E+10 6.8E+10 6.9E+10 6.7E+10 6.5E+10 7.1E+10 7.0E+10 6.8E+10
p <.001 <.001 <.001 <.001 <.001 <.001 <.001 <.001 <.001 <.001Newcomers
p <.001 <.001 <.001 <.001 <.001 <.001 <.001 <.001 <.001 <.001
Dropouts
vs. Non-
Dropouts
M-W-U 2.9E+11 2.8E+11 2.9E+11 3.0E+11 2.8E+11 2.8E+11 2.9E+11 2.6E+11 2.6E+11 2.6E+11
p <.001 <.001 <.001 .719 <.001 <.001 <.001 <.001 <.001 <.001
Newcomers
vs.
Dropouts
M-W-U 1.1E+10 1.1E+10 1.1E+10 1.1E+10 1.1E+10 1.1E+10 1.0E+10 1.1E+10 1.1E+10 1.1E+10
p <.001 <.001 <.001 <.001 <.001 <.001 <.001 <.001 <.001 <.001
H0 - H3 can be rejectedNonparametric Spearman-Correlations show that H4 can be rejected
University of HamburgInstitute of Law & EconomicsDivision on Gambling
81
Nonparametric Spearman-Correlations show that H4 can be rejected

Absolute and Relative Total Playing Volume per GroupVolume per Group
Number of Share of Playing Volume in Share of Playing
Sample Players Players US$ Volume
Regulars 228,332 10.73%
227,940,442
60.35%
Newcomers 69,734 3.28%
5,091,308
1.35%
36,933,685
Dropouts 327,930 15.41%
36,933,685
9.78%
Total
Sample 2,127,887 100.00% 377,714,269 100.00%Sample 2,127,887 100.00% 377,714,269 100.00%
University of HamburgInstitute of Law & EconomicsDivision on Gambling
82

Average playing volume of Regulars, Dropouts, and Newcomers over TimeDropouts, and Newcomers over Time
80 $
60 $
70 $
40 $
50 $
Ø $
Ra
ke Regulars
Dropouts
Newcomers
10 $
20 $
30 $
Ø $
Ra
ke
Newcomers
0 $
10 $
1 2 3 4 5 6 7 8 9 10 11 12 13 14 15 16 17 18 19 20 21 22 23 24 25 26
WeekWeek
• Sufficient to reject H5 (playing volume of regulars does not increase over time)• Not sufficient to reject H5 and H6 (averages are biased as players did not play
the whole observation period)University of HamburgInstitute of Law & EconomicsDivision on Gambling
83
the whole observation period)

Player Retention of NewcomersPlayer Retention of Newcomers
80%
100%
60000
70000
60%
80%
40000
50000
Sh
are
of
Pla
ye
rs
Nu
mb
er
of
Ac
tive
Pla
ye
rs
40%
20000
30000
40000
Sh
are
of
Pla
ye
rs
Nu
mb
er
of
Ac
tive
Pla
ye
rs
20%
10000
20000Nu
mb
er
of
Ac
tive
Pla
ye
rs
0%010 11 12 13 14 15 16 17 18 19 20 21 22 23 24 25 26
Week
University of HamburgInstitute of Law & EconomicsDivision on Gambling
84

Analysis as a dynamic panel: Playinghabits over time, dropouts
35 $
45 $
Ab
so
lute
Pla
yin
g V
olu
me
co
mp
are
d t
o w
ee
k 2
2
25-PercentileMedian75-Percentile
2500%
Re
lati
ve
Pla
yin
g V
olu
me
co
mp
are
d t
o w
ee
k
25-Percentile Median
75-Percentile 90-Percentile
15 $
25 $
Ab
so
lute
Pla
yin
g V
olu
me
co
mp
are
d t
o w
ee
k 2
2
250%
2500%
Re
lati
ve
Pla
yin
g V
olu
me
co
mp
are
d t
o w
ee
k
22
, lo
ga
rith
mic
-15 $
-5 $
5 $
Ab
so
lute
Pla
yin
g V
olu
me
co
mp
are
d t
o w
ee
k 2
2
25%
250%
Re
lati
ve
Pla
yin
g V
olu
me
co
mp
are
d t
o w
ee
k
22
, lo
ga
rith
mic
Week1 2 3 4 5 6 7 8 9 10 11 12 13 14 15 16 17 18 19 20 21 22
-15 $25%
1 2 3 4 5 6 7 8 9 10 11 12 13 14 15 16 17 18 19 20 21 22
Week
• H6 can be rejected• H6 can be rejected
University of HamburgInstitute of Law & EconomicsDivision on Gambling
85

Analysis as a dynamic panel: Playinghabits over time, newcomers
10000%
Re
lati
ve
Pla
yin
g V
olu
me
co
mp
are
d t
o
25-Percentile Median
75-Percentile 90-Percentile25 $
30 $
Ab
so
lute
Pla
yin
g V
olu
me
co
mp
are
d t
o w
ee
k 1
25-PercentileMedian75-Percentile
1000%
Re
lati
ve
Pla
yin
g V
olu
me
co
mp
are
d t
o
we
ek
1, lo
ga
rith
mic
5 $
10 $
15 $
20 $
Ab
so
lute
Pla
yin
g V
olu
me
co
mp
are
d t
o w
ee
k 1
10%
100%
10 11 12 13 14 15 16 17 18 19 20 21 22 23 24 25 26
Re
lati
ve
Pla
yin
g V
olu
me
co
mp
are
d t
o
Week
10 11 12 13 14 15 16 17 18 19 20 21 22 23 24 25 26
-10 $
-5 $
0 $
5 $
Ab
so
lute
Pla
yin
g V
olu
me
co
mp
are
d t
o w
ee
k 1
10 11 12 13 14 15 16 17 18 19 20 21 22 23 24 25 26 10 11 12 13 14 15 16 17 18 19 20 21 22 23 24 25 26
• H7 can only partly be rejected: There is a group of Newcomersthat increases its playing volume dramaticallythat increases its playing volume dramatically
• This group is interesting for the industry as well as theprevention of problem gambling
University of HamburgInstitute of Law & EconomicsDivision on Gambling
86
prevention of problem gambling

Playing habits in UK, Germany, USA and CanadaUK, Germany, USA and Canada
University of HamburgInstitute of Law & EconomicsDivision on Gambling

Number of SessionsNumber of Sessions
Country ø Sessions Median Sessions σ Sessions
Canada 24.89 8 49.4
USA 24.92 7 50.8USA 24.92 7 50.8
Germany 27.43 9 50.5
Great Britain 21.47 6 44.3
World 23.25 7 47.0World 23.25 7 47.0
University of HamburgInstitute of Law & EconomicsDivision on Gambling
88

Session lengthSession length
Country
ø Session length in
minutes
Median session length
in minutes
σ session length in
minutes
Canada 49.49 41 37.28Canada 49.49 41 37.28
USA 50.46 42 37.81
Germany 50.91 43 37.36
Great Britain 49.75 41 38.66Great Britain 49.75 41 38.66
World 49.85 42 38.46
University of HamburgInstitute of Law & EconomicsDivision on Gambling
89

Total playing timeTotal playing time
Country
ø playing time in
hours
Median playing time in
hours
σ playing time in
hours
Canada 25.12 5.43 62.69Canada 25.12 5.43 62.69
USA 25.18 5.37 63.13
Germany 29.23 6.40 67.90
Great Britain 22.54 4.33 59.63Great Britain 22.54 4.33 59.63
World 24.23 4.87 62.13
University of HamburgInstitute of Law & EconomicsDivision on Gambling
90

MultitablingMultitabling
Country ø tables Median tables σ tables
Canada 1.21 1.00 0.70
USA 1.04 1.00 0.80USA 1.04 1.00 0.80
Germany 1.47 1.07 1.27
Great Britain 1.27 1.03 0.86
World 1.32 1.04 0.97World 1.32 1.04 0.97
University of HamburgInstitute of Law & EconomicsDivision on Gambling
91

Playing intensityPlaying intensity
Country ø $ rake per hour Median $ rake per hour σ $ rake per hour
Canada 4.48 1.85 7.84
USA 3.76 1.76 5.76USA 3.76 1.76 5.76
Germany 2.68 1.08 5.04
Great Britain 4.55 1.96 7.88
World 3.20 1.25 5.58World 3.20 1.25 5.58
University of HamburgInstitute of Law & EconomicsDivision on Gambling
92

Playing volumePlaying volume
Country ø $ rake 6 months Median $ rake 6 months σ $ rake 6 months
Canada 213.12 9.57 1,894.34
USA 214.09 10.20 2,023.22USA 214.09 10.20 2,023.22
Germany 226.35 8.06 1,691.31
Great Britain 199.16 7.87 1,811.53
World 187.95 6.69 1,926.61World 187.95 6.69 1,926.61
University of HamburgInstitute of Law & EconomicsDivision on Gambling
93

Conclusions and PerspectiveConclusions and Perspective
University of HamburgInstitute of Law & EconomicsDivision on Gambling

ConclusionsConclusions
• Huge data set gathered• Huge data set gathered
• First time the poker market can be broken down tocountries and regions
• Many possibilities for data analysis• Many possibilities for data analysis
• GDP and culture have a huge impact on the fraction of active online poker players in a populationactive online poker players in a population
• Enforcement of poker prohibition is not strong enough toyield a significant effectyield a significant effect
• Some people play excessively, most do not
• 90% of the revenue comes from 10% of the players, 55% • 90% of the revenue comes from 10% of the players, 55% from 1% of the players
• Everybody – prevention and industry – is interested in theintense gamblers
University of HamburgInstitute of Law & EconomicsDivision on Gambling
intense gamblers95The Regional Breakdown of the Online Poker Market
Vienna 2010

PerspectivePerspective
• It is necessary to distinguish between professional andpathological playerspathological players
• The way to do this is by looking at their betting patterns
• If these patterns suggest chasing, impulsivity, or• If these patterns suggest chasing, impulsivity, orirrationality the player may be at risk
• Current research project compares the betting patterns of clinically diagnosed pathological poker players with theclinically diagnosed pathological poker players with thetotal player pool
• This may allow to put a red flag on everybody who is a • This may allow to put a red flag on everybody who is a probable pathological gambler
University of HamburgInstitute of Law & EconomicsDivision on Gambling
96

Thank you for your kind attention!Thank you for your kind attention!
[email protected] [email protected]
University of HamburgInstitute of Law & EconomicsDivision on Gambling