Embed Size (px)
Citation preview

ING Behavioral Finance:
The Power of Not Losing
Presenter Name - Title
2012
CID: 2775

2 Behavioral Finance and Managing Our Biases
Bank of America Corporation (“Bank of America”) is a financial holding company that, through its subsidiaries and affiliated companies, provides banking and investment products and other financial services .
Merrill Lynch, Pierce, Fenner & Smith Incorporated is a wholly-owned subsidiary of Bank of America Corporation, and a registered broker-dealer and member of FINRA and SIPC.
Investment products provided by Merrill Lynch, Pierce, Fenner & Smith, Incorporated:
The views and opinions expressed in this presentation are not necessarily those of Bank of America Corporation; Merrill Lynch, Pierce, Fenner & Smith Incorporated; or any affiliates.
Nothing discussed or suggested in these materials should be construed as permission to supersede or circumvent any Bank of America, Merrill Lynch, Pierce, Fenner & Smith Incorporated policies, procedures, rules, and guidelines.
Merrill Lynch, Pierce, Fenner & Smith Incorporated are not tax or legal advisors. Clients should consult a personal tax or legal advisor prior to making any tax or legal related investment decisions.
Are Not FDIC Insured Are Not Bank Guaranteed May Lose Value

3 Behavioral Finance and Managing Our Biases
Does the Market Have You Feeling Like This?
Content of this presentation has been approved by the ING Investment Management (Americas) Compliance Department. Certain copywrited and trademarked information illustrated or presented in this material are the property of their respective firms. This material is for illustrative purposes only.

4 Behavioral Finance and Managing Our Biases
Winning by not Losing
Today’s Agenda:
Investor Results in the Market
The Emotions of Investing
The Bedrock of Behavioral Finance – Loss Aversion
Rate at which to buy and sell
It’s Important to Reduce the Chance of Losing
Content of this presentation has been approved by the ING Investment Management (Americas) Compliance Department. Certain copywrited and trademarked information illustrated or presented in this material are the property of their respective firms. This material is for illustrative purposes only.

5 Behavioral Finance and Managing Our Biases
Investor Results in the Market

6 Behavioral Finance and Managing Our Biases
Investors Aren’t Keeping Up
Data source: Dalbar, Inc. (as of 12/31/10)
Past performance is no guarantee of future results. The Standard & Poor’s 500 Index is an unmanaged capitalization-weighted index of 500 stocks designed to measure performance of the broad domestic economy through changes in the aggregate market value of 500 stocks representing all major industries. Investors cannot invest directly in an index.

7 Behavioral Finance and Managing Our Biases
Stop Or Your Portfolio Gets It!
“For investors as a whole, returns decrease as motion increases” – Warren Buffet

8 Behavioral Finance and Managing Our Biases
Long-Term Goals Giving Way to Short-Term Actions
Data source: Dalbar, Inc. (as of 12/31/10)

9 Behavioral Finance and Managing Our Biases
Buy High, Sell Low?
Investors tend to . . .
Past performance is no guarantee of future results. Russell 1000 Growth Index measures the large-cap growth segment of the U.S. equity market including Russell 1000 companies with higher price-to-book ratios and forecasted growth. Investors cannot invest directly in an index.
Source: Strategic Insight; utilizes Morningstar Large Cap Growth category as definition
-$10,000
-$5,000
$0
$5,000
$10,000
$15,000
-60%
-40%
-20%
0%
20%
40%
60%
1996-12 1997-12 1998-12 1999-12 2000-12 2001-12 2002-12 2003-12 2004-12 2005-12 2006-12 2007-12 2008-12 2009-12
R10
00G
Ret
urn
–
12 m
on
ths
Net N
ew F
low
s –
Ro
lling
3 mo
nth
buy at market highs
sell at market lows

10 Behavioral Finance and Managing Our Biases
The Emotions of Investing

11 Behavioral Finance and Managing Our Biases
Investor Returns or Investment Returns?
Yahoo!® Finance – 6 Numbers Every Investor Should Follow
“Investor Returns
Morningstar® calculates "investor returns," which measure the average investor's returns in a particular fund, versus its published returns. These returns reveal how much money investors actually make or lose in a fund based on when they buy and sell.
More volatile funds generally have lower investor returns because investors make emotional decisions to buy or sell at the wrong times.”
Source: Yahoo! Finance. 6 Numbers Every Investor Should Follow. 5/10/11

12 Behavioral Finance and Managing Our Biases
The Power of Not Losing
Where is an Investor’s Trigger
Point?
Investment Loss Gain Needed to Recover
? -10% +11%
? -20% +25%
? -30% +43%
? -40% +67%
? -50% +100%
“Rule No.1: Never lose money. Rule No.2: Never forget rule No.1.” – Warren Buffet
Past performance is no guarantee of future results. This example is for illustrative purposes only.

13 Behavioral Finance and Managing Our Biases
Our Biases – Emotional Reaction, Physical Impact
Losses have
DOUBLE the
psychological effect
of gains

14 Behavioral Finance and Managing Our Biases
Our Biases – Emotional Reaction, Physical Impact
How Quickly Do You Return to Normal After Winning $1,000?
How Long Does it Take to Get Over Losing the Family Pet?

15 Behavioral Finance and Managing Our Biases
Loss Aversion

16 Behavioral Finance and Managing Our Biases
Bias: Loss Aversion
Loss Aversion - refers to people's tendency to strongly prefer avoiding losses to acquiring gains, typically caused by recent losses.
Behavioral Observations
Removing all money from the market, going to 100% cash
Dramatically overweighting fixed income investments
Quick to sell investments with short-term underperformance
Losing focus on longer-term goals and concentrating on daily market volatility
Key Concepts
Investors tend to be their own worst enemy, buying and selling at the wrong times
This behavior is the main cause of poor investor outcomes
Every investor has a Trigger Point that creates this reaction and it’s different for everyone
The most important part of achieving long-term goals is to build a plan designed to help eliminate or diminish these behaviors

17 Behavioral Finance and Managing Our Biases
Is the Image Moving?
This example is for illustrative purposes only.
18 Behavioral Finance and Managing Our Biases
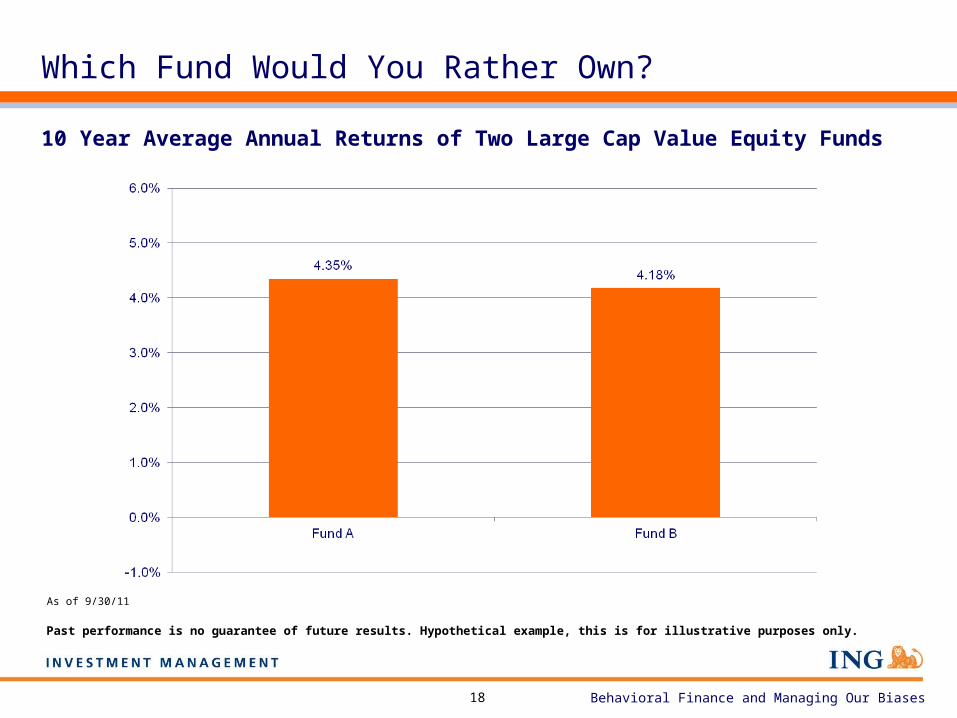
Which Fund Would You Rather Own?
10 Year Average Annual Returns of Two Large Cap Value Equity Funds
As of 9/30/11
Past performance is no guarantee of future results. Hypothetical example, this is for illustrative purposes only.

19 Behavioral Finance and Managing Our Biases
Which Fund Would You Rather Own Now?
Fund B experiences a 39% loss during that same time period
Fund A loses over 55% during the 2008 downturn…
10 Year Rolling Returns of Two Large Cap Value Equity Funds
Past performance is no guarantee of future results. Hypothetical example, this is for illustrative purposes only.
Investors Typically Buy At The Peak
Investors Typically Sell At The Bottom

20 Behavioral Finance and Managing Our Biases
We All Have Our Trigger Point

21 Behavioral Finance and Managing Our Biases
Understanding and Planning Around the Trigger Point
Ask a Few Questions To Help Clients Think Through Their Decision
Do you believe that an investment under consideration produces a return with little risk? Do you understand the risks?
Are you looking to this investment to help you reach your long-term—10 years— investment goals?
Do you expect the value to decline the day after you make an investment?
If the value does decline immediately, will you withdraw your funds?
What if the value declines over the next 12-24 months?
Identify The Trigger Point, Build A Portfolio Aimed at Avoiding It
Understand this behavior is deeply rooted in us and nearly impossible to stop
Establish the Trigger Point – What will cause loss aversion behavior to kick in?
Build a portfolio to help avoid the Trigger Point

22 Behavioral Finance and Managing Our Biases
Planning Ahead to Manage the Trigger Point
If the Trigger Point is Hit, Ask a Few Questions Before Acting
Other than the price, what else has changed?
What other information do I need to determine if this is truly bad news?
Are my original reasons to invest still valid?
If I liked this investment enough to buy at a higher price, shouldn’t I like it even more at a lower price?
Has this investment ever gone down this much before, and if so would I have done better selling out or increasing my position?

23 Behavioral Finance and Managing Our Biases
Everyone’s Relationship to Money is Unique
Each of us views the value of money differently
Which means we each will view loss and risk differently
All of us will have a Trigger Point…but the actual number will be unique to us
Content of this presentation has beem approved by the ING Investment Management (Americas) Compliance Department. Certain copywrited and trademarked information illustrated or presented in this material are the property of their respective firms. This material is for illustrative purposes only.
My View of Money Your View of Money

24 Behavioral Finance and Managing Our Biases
The Lesson of Behavioral Finance – Managing Loss
High negative returns have the potential to put portfolios in a deep hole and trigger our emotional biases
Biases are typically deeply engrained in us and can cause us to make poor decisions
Understand your biases
Don’t fight them, use them to plan in a way that gives you a higher probability of not veering from your established goals

25 Behavioral Finance and Managing Our Biases
This information is proprietary and cannot be reproduced or distributed. Certain information may be received from sources ING Investment Management (“ING IM”) considers reliable; ING IM does not represent that such information is accurate or complete. Certain statements contained herein may constitute "projections," "forecasts" and other "forward-looking statements" which do not reflect actual results and are based primarily upon applying retroactively a hypothetical set of assumptions to certain historical financial data. Actual results, performance or events may differ materially from those in such statements due to, among other things, (i) general economic conditions, in particular economic conditions in ING IM's core markets, (ii) performance of financial markets, including emerging markets, (iii) the frequency and severity of insured loss events, (iv) mortality and morbidity levels and trends, (v) persistency levels, (vi) interest rate levels, (vii) currency exchange rates (viii) general competitive factors, (ix) changes in laws and regulations, (x) changes in the policies of governments and/or regulatory authorities, (xi) conclusions with regard to purchase accounting assumptions and methodologies, (xii) ING IM's ability to achieve projected operational synergies. Any opinions, projections, forecasts and forward looking statements presented herein are valid only as of the date of this document and are subject to change. Nothing contained herein should be construed as (i) an offer to buy any security or (ii) a recommendation as to the advisability of investing in, purchasing or selling any security. ING IM assumes no obligation to update any forward-looking information.
26 Behavioral Finance and Managing Our Biases
Appendix

27 Behavioral Finance and Managing Our Biases
Understanding Our Decision Making
Which return is more attractive to you?
+5% or +6%
+10% or +15%
+15% or +22%
-5% or -6%
-10% or -15%
-15% or -22%

28 Behavioral Finance and Managing Our Biases
Evaluating Portfolios - Definitions
Standard DeviationThe variance or dispersion of a portfolio’s returns around its average returns over a period of time. This is a good tool, but it’s important to remember that it’s relative to Fund’s own average.
BetaThe portfolio's volatility in comparison to the market or benchmark. This helps investors identify a fund’s risk relative to benchmarks either low (beta < 1) or high (beta >1). It’s important to review the Fund’s benchmark performance when considering beta.
AlphaThe difference between a portfolio’s actual returns and its expected performance, given its level of risk as measured by Beta. This helps investors identify the value a manager is adding relative to a benchmark.
Sharpe RatioThe reward per unit of risk, with the higher the ratio the better the historical risk-adjusted performance. This helps investors measure risk-adjusted performance. This is not relative to a benchmark and enables comparison of portfolios with different risk levels
Downside Capture RatioA portfolio’s overall performance relative to an index in down markets. This helps investors evaluate how well (<100) or poorly (>100) a manager performed relative to an index’s down periods.
Information RatioA special version of the Sharpe Ratio that uses a portfolio’s benchmark in evaluating risk. This helps investors measure both excess return against a benchmark and the consistency of those returns. In other words, did a manager obtain strong returns by beating the benchmark a lot in a few months or consistently by a little each month.

29 Behavioral Finance and Managing Our Biases
Bias: Loss Aversion
Loss Aversion - loss aversion refers to people's tendency to strongly prefer avoiding losses to acquiring gains. Some studies suggest that losses are twice as powerful, psychologically, as gains
Key Concepts
Investors tend to be their own worst enemy, buying and selling at the wrong times
This behavior is the main cause of poor investor outcomes
Every investor has a Trigger Point that creates this reaction and it’s different for everyone
The most important part of achieving long-term goals is to build a plan designed to help eliminate or diminish these behaviors
Your Financial Advisor can help you build a portfolio designed to help reduce the chances of experiencing Loss Aversion