Embed Size (px)
Citation preview

INFRASTRUCTURE SECTOR - FACILITIESZakiya Seymour, leadMessner Progress Meeting
July 24,2009 SEB 122

Overview
Progress Efficiencies
Technical Efficiency Systematic Efficiency Integrated Efficiency
Next Steps

Progress
Crisis of Credit Geography of a Recession Road to Recovery Benchmarking Recovery Approaches
Japan, Sweden Land Use
Vacancy Rates Current Trends Options
Efficiencies

Benchmarking Follow UpHousehold Debt to GDP Ratio
Country Years Debt to GDP Ratio
Japan19911995
125%95%
US20072009
133%130%
SOURCE: Federal Reserve Bank of San Francisco Economic Letter 2009-16

Land Use – Vacancy Rates Residential Vacancy
Number Vacancy Rates Total Square Footage
19 million(130 million)
14%(67.3% home
ownership)
42.2 billion(median footage: 2,219)
SOURCE: United States Census Bureau Report on Homeownership and Vacancy (as of April 27, 2009; Colliers North American Industrial, Office, and Retail Real Estate Q12009 Highlights (as of March 31, 2009)
Commercial Vacancy
Category Vacancy Rates Total Square FootageIndustrial 9.6% 12.4 billion
Office 14.7% 1.6 billion
Retail 10.2% 2.6 billion
------------ ------------
TOTAL 58.8 billion

Land Options – Current Trends Current Trends
Used as Temporary Shelters Consumed in Fires Turned into Squatter Locations Demolished Reclaimed in Distressed
Neighborhoods

Land Options - Approaches Land Use Options for Vacant,
Foreclosed Land : Remain Public Sale to Private Bank the Land Do nothing…

Efficiencies – A Framework for Innovation Technical Efficiency
Efficiency based on the individual components of an infrastructure sector Example: installing no flow/low-flow toilets
Systematic Efficiency Efficiency based on the entire
infrastructure sector Example: determining appropriate energy
mixes
Integrated Efficiency Efficiency based on the synergies found
between infrastructure sectors Example: developing decentralized power and
water systems
9
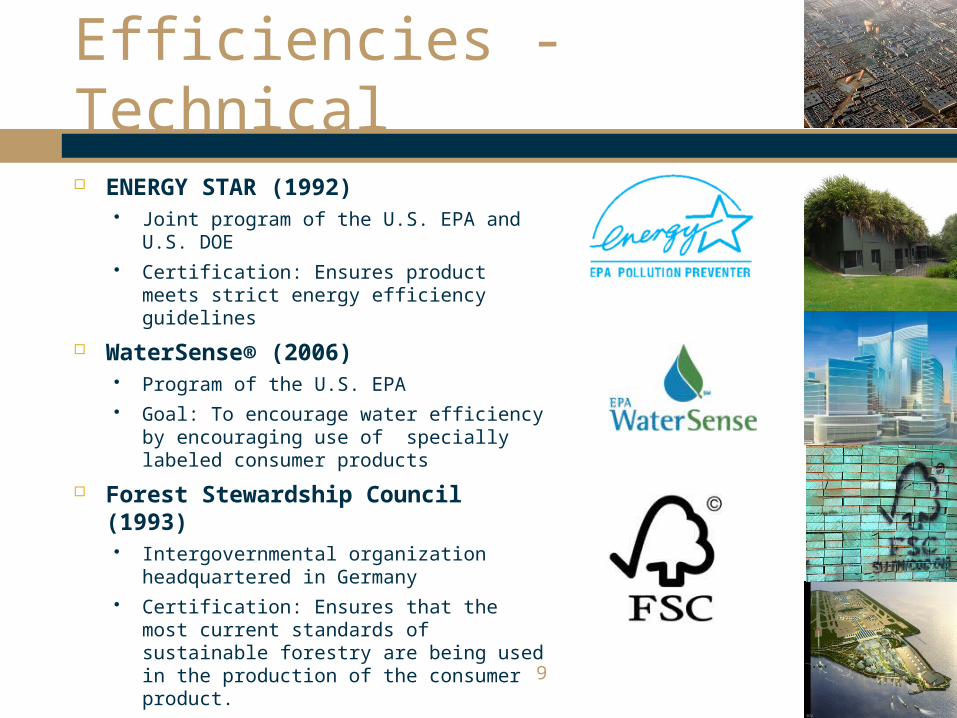
Efficiencies - Technical
ENERGY STAR (1992) Joint program of the U.S. EPA and U.S.
DOE Certification: Ensures product meets
strict energy efficiency guidelines
WaterSense® (2006) Program of the U.S. EPA Goal: To encourage water efficiency by
encouraging use of specially labeled consumer products
Forest Stewardship Council (1993) Intergovernmental organization
headquartered in Germany Certification: Ensures that the most
current standards of sustainable forestry are being used in the production of the consumer product.

10
Efficiencies - Technical
LEED (1998) Leadership in Energy and
Environmental Design A green building rating system Developed by the U.S. Green
Building Council (USGBC)
EarthCraft House™ (1999) Joint program of the Greater
Atlanta Home Builders Association and Southface Energy Institute
Partnered with ENERGYSTAR Goal: To educate on resource and
energy-efficient construction

Efficiencies - Systematic Systematic Efficiency
Mixed-Use Development
Livable Centers/Communities Initiatives

Efficiencies - Integrated
Integrated Efficiency Integrated City/ Development
PlanningCase Study: Turn unused roof space into power supply
Case Study: Use wastewater to heat homes
SOURCE: “How America's Greenest Cities Got Green” Popular Science, Feb 8, 2009 http://www.popsci.com/environment/gallery/2008-02/how-americas-greenest-cities-got-green

Efficiencies – Facilities
Technical Efficiency ENERGY STAR, WaterSense®,
EarthCraft Homes™, Forest Stewardship Council, LEED
Systematic Efficiency Mixed-Use Development, Livable
Centers/Communities Initiatives Integrated Efficiency
Integrated City/Integrated Developing Planning

Home Energy Use Consumption
Consumption* Expenditures*
Total U.S. Residential 10.55 Quadrillion Btu $201.07 Billion
Per Household 94.9 Million Btu $1,810
Per Household Member 37.0 Million Btu $705
Per Square Foot 43.7 Thousand Btu $0.83
SOURCE: 2005 Residential Energy Consumption Survey conducted by the Energy Information Administration (http://www.eia.goe.gov/emeu/recs/recs2005/c&e/detailed_tables2005c&e.html)

Energy Expenditures by Type of Housing Unit
Type of Home % of Population
Homes Detached 68.9%
Attached 6.6%
Apartments 2 to 4 Unit Building 6.6%
5 or More Unit Building 11.9%
Mobile Homes 6.0%
SOURCE: 2005 Residential Energy Consumption Survey conducted by the Energy Information Administration (http://www.eia.goe.gov/emeu/recs/recs2005/c&e/detailed_tables2005c&e.html)
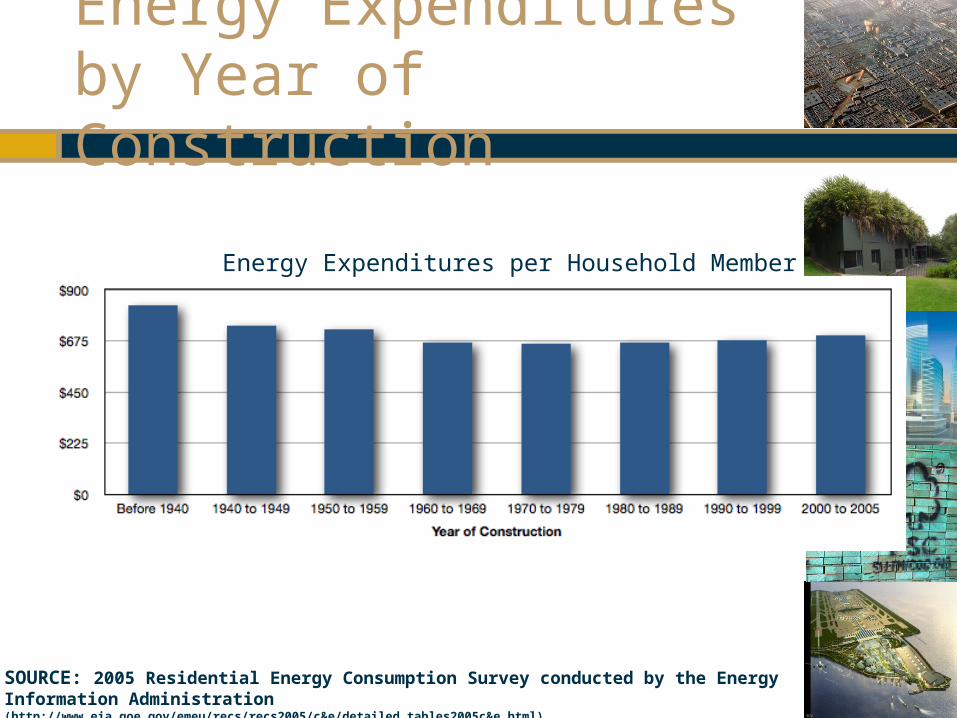
Energy Expenditures by Year of Construction
Energy Expenditures per Household Member
SOURCE: 2005 Residential Energy Consumption Survey conducted by the Energy Information Administration (http://www.eia.goe.gov/emeu/recs/recs2005/c&e/detailed_tables2005c&e.html)