Embed Size (px)
Citation preview

Infrastructure investment
and growth
Luis Servén
The World Bank
IMF, November 2010
2
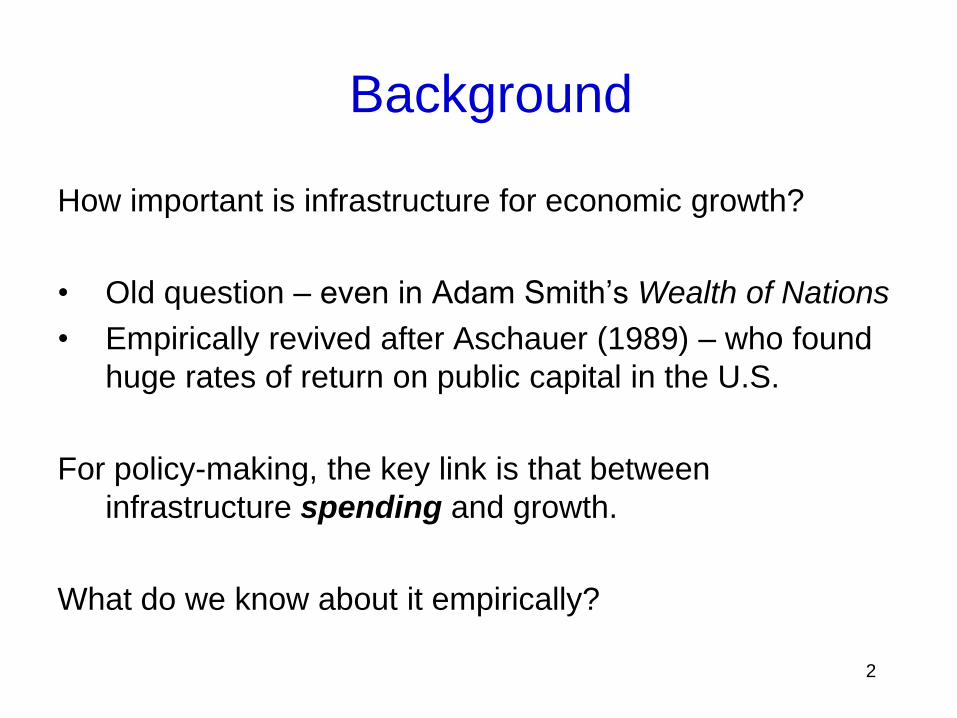
How important is infrastructure for economic growth?
• Old question – even in Adam Smith’s Wealth of Nations
• Empirically revived after Aschauer (1989) – who found
huge rates of return on public capital in the U.S.
For policy-making, the key link is that between
infrastructure spending and growth.
What do we know about it empirically?
Background

3
Two distinct logical steps involved:
(1) From spending to infrastructure services – the cost of
acquiring (and operating) infrastructure assets
(2) From infrastructure assets to growth – the productivity
of infrastructure assets (or their services)
The bulk of empirical macro research has focused on (2).
But for optimal spending / provision decisions we need to
know more about (1) too.
Background

Start with (2): from assets to output / growth
Two common empirical approaches:
– Growth regressions augmented with infrastructure measures
– Infrastructure as another input in aggregate production function
(or its dual, the cost function)
On balance, majority of studies – especially recent ones on
developing economies – find significant positive effects
Some methodological caveats with many studies – reverse
causality, heterogeneity, non-stationarity...
A key issue is the measurement of infrastructure assets
– Physical indicators (e.g., road km)
– Monetary indicators (investment flows or their cumulative totals) 4
Infrastructure and growth

5
Infrastructure and growth
Empirical studies, by reported finding (Straub 2007)
Negative None Positive
Measures of infrastructure spending can be very poor
proxies for the quantity / quality of assets
• Poor project selection; procurement; corruption (Tanzi-Davoodi
1997; Pritchett 2000; Keefer-Knack 2007) – more on this later

6
4.1.1 Infrastructure Stock and Economic Growth
AGO
ARE
ARG
AUS
AUT
BDI
BEL
BENBFABGD BGR
BHR
BLR
BOL
BRA
BWA
CAF
CAN
CHE
CHL
CHN
CIVCMR COG
COLCRI
CYP
CZEDEUDNK
DOM
DZAECU
EGY
ESP
ESTETH
FINFRA
GAB
GBR
GHA
GIN
GMBGNB
GRC
GTM
HKG
HND
HRVHTI
HUNIDNIND
IRL
IRN
IRQ
ISLISRITA
JAM
JOR
JPN
KAZKEN
KGZ
KOR
LBY
LKA
LTU
LUX
LVAMAR
MDG
MEX
MLT
MRTMWI
MYS
NER
NGA
NIC
NLD
NOR
NPL NZL
OMN
PAK PAN
PER
PHL
POL
PRT
PRY
QAT
ROM
RUS
RWA
SAU
SDN
SEN
SGP
SLE
SLV
SVK
SVNSWESYR
TCDTGO
THA
TTOTUN
TUR
TWN
TZA
UGA
UKR
URY
USA
VENYEM
YSR
ZAF
ZAR
ZMBZWE
y = 0.4812x + 1.6724
R2 = 0.1701
-4
-3
-2
-1
0
1
2
3
4
5
6
7
-4 -3 -2 -1 0 1 2 3 4
Aggregate Index of Infrastructure Stocks, IK1 (in logs)
Gro
wth
in
real
GD
P p
er
cap
ita (
%)

7
4.1.2 Infrastructure Quality and Economic Growth
ZWEZMB
ZAR
ZAF
YSR
YEM VEN
USA
URY
UKR
UGA
TZA
TWN
TUR
TUNTTO
THA
TGOTCD
SYR SWESVN
SVK
SLV
SLE
SGP
SEN
SDN
SAU
RWA
RUS
ROM
QAT
PRY
PRT
POL
PHL
PER
PANPAK
OMN
NZLNPL
NOR
NLD
NIC
NGA
NER
MYS
MWIMRT
MLT
MEX
MDG
MARLVA
LUX
LTU
LKA
LBY
KOR
KGZ
KENKAZ
JPN
JOR
JAM
ITAISRISL
IRQ
IRN
IRL
IND IDNHUN
HTI HRV
HND
HKG
GTM
GRC
GNBGMB
GIN
GHA
GBR
GAB
FRAFIN
ETHEST
ESP
EGY
ECUDZA
DOM
DNKDEUCZE
CYP
CRICOL
COG CMRCIV
CHN
CHL
CHE
CAN
CAF
BWA
BRA
BOL
BLR
BHR
BGRBGDBFA BEN
BEL
BDI
AUT
AUS
ARG
ARE
AGO
y = 0.6312x + 1.8891
R2 = 0.2054
-4
-3
-2
-1
0
1
2
3
4
5
6
7
-4 -3 -2 -1 0 1 2 3
Aggregate Index of Infrastructure Quality, IQ (in logs)
Gro
wth
in
real G
DP
per
cap
ita (
%)
8
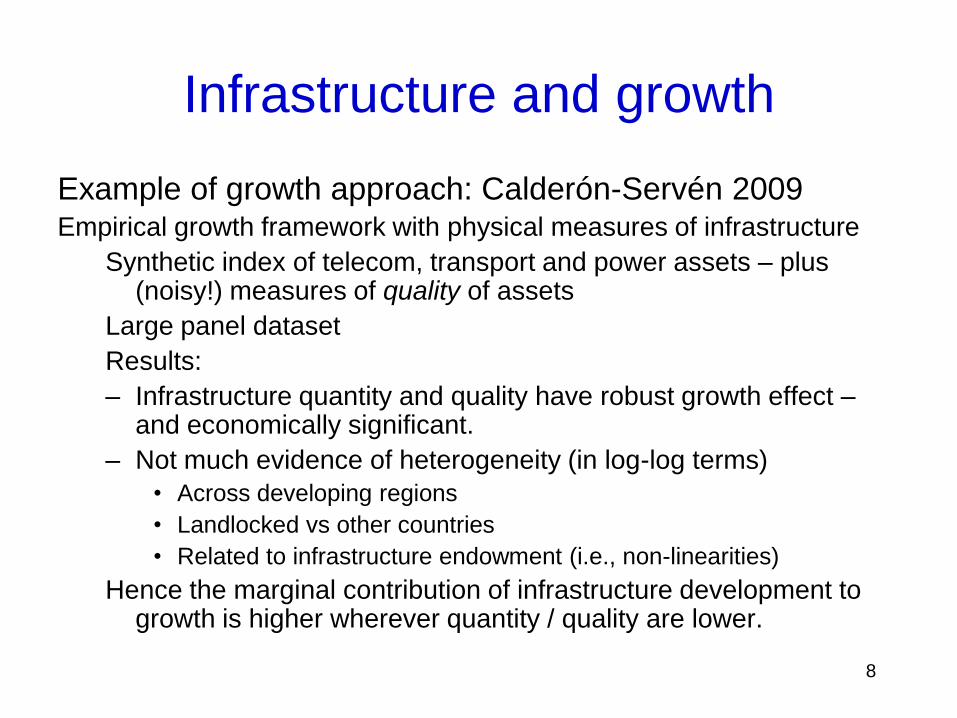
Example of growth approach: Calderón-Servén 2009Empirical growth framework with physical measures of infrastructure
Synthetic index of telecom, transport and power assets – plus (noisy!) measures of quality of assets
Large panel dataset
Results:
– Infrastructure quantity and quality have robust growth effect –and economically significant.
– Not much evidence of heterogeneity (in log-log terms)
• Across developing regions
• Landlocked vs other countries
• Related to infrastructure endowment (i.e., non-linearities)
Hence the marginal contribution of infrastructure development to growth is higher wherever quantity / quality are lower.
Infrastructure and growth

Infrastructure capital -- Brookings 2010 9
Figure 2
Growth changes across regions due to infrastructure development
(2001-5 vs.1991-5 averages)
-1.0
-0.5
0.0
0.5
1.0
1.5
2.0
2.5
3.0
World Western
Europe
East Asia South Asia Middle East &
North Africa
Sub-Saharan
Africa
Ch
an
ges
in g
row
th p
er
cap
ita (
%)
Infrastructure Stocks Infrastructure Quality

10
How does the growth contribution of infrastructure development vary across countries? Closer look
Calderón, Moral and Servén (2010): Cobb-Douglas production function approach -- physical and human capital; infrastructure
• Focus on the contribution of infrastructure to labor productivity (GDP per worker)
• synthetic infrastructure index (as before)
• 88 industrial and developing countries,1960-2000 (> 3,500 obs)
• Allow for heterogeneity of infrastructure contribution – both generic and along specific dimensions
– Empirical framework allows intercepts, error variances and short-run dynamics to differ freely across countries.
– Imposes (testable) cross-country homogeneity of long-run coefficients.
Infrastructure and growth

11
Main results• Infrastructure elasticity in range .07 to .10 – and robust.
• Elasticities of other inputs (physical and human capital) in line with literature (around 0.35, 0.10 respectively)
• No evidence of (general) cross-country parameter heterogeneity
– Accords with cross-country stability of factor shares (Gollin 2002)
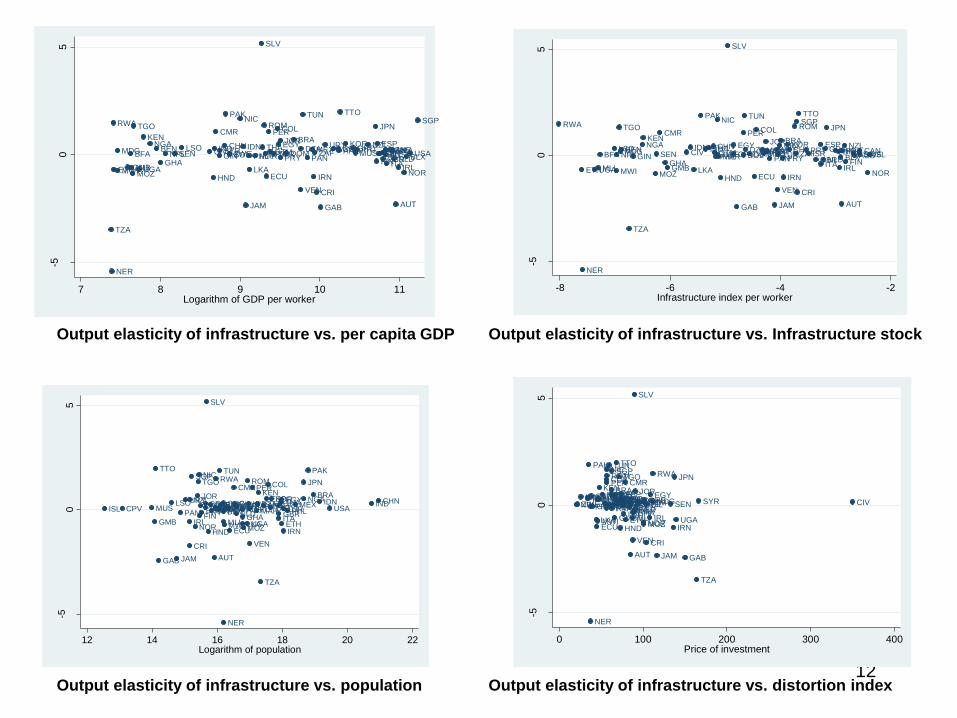
• But country-specific estimates are noisy (especially in LICs), so tests may have low power. Test for specific forms of heterogeneity
– By income level: infrastructure elasticity could differ in rich and poor countries
– By level of infrastructure endowment: nonlinear effects of infrastructure (network effects?)
– By population size: economies of scale / congestion effects.
– By quality of policy framework: high / low distortions
Only this test comes close to 10% significance
Infrastructure and growth
DZA ARGAUS
AUT
BLXBEN
BOL
BRA
BFA
CMR
CANCPVCHLCHN
COL
CRI
CIV DNKDOM
ECU
EGY
SLV
ETHFIN
FRA
GAB
GMBGHA
GRCGTMGIN
HND
ISLIND IDN
IRN
IRL
ISR
ITA
JAM
JPN
JORKENKOR
LSOMDG
MWI
MYS
MLI
MUSMEXMAR
MOZ
NPLNLD
NZL
NIC
NER
NGA
NOR
PAK
PANPRY
PER
PHLPRT
ROMRWA
SEN
SGP
ZAFESP
LKA
SWECHESYR
TZA
THA
TGO
TTOTUN
TUR
UGA
GBRUSA
URY
VEN
ZWE
-50
5
Lo
ng-r
un
co
effic
ient
7 8 9 10 11Logarithm of GDP per worker
12
Output elasticity of infrastructure vs. per capita GDP Output elasticity of infrastructure vs. Infrastructure stock
DZA ARGAUS
AUT
BLXBEN
BOL
BRA
BFA
CMR
CANCPVCHLCHN
COL
CRI
CIV DNKDOM
ECU
EGY
SLV
ETHFIN
FRA
GAB
GMBGHA
GRCGTMGIN
HND
ISLINDIDN
IRN
IRL
ISR
ITA
JAM
JPN
JORKENKOR
LSOMDG
MWI
MYS
MLI
MUSMEXMAR
MOZ
NPLNLD
NZL
NIC
NER
NGA
NOR
PAK
PANPRY
PER
PHLPRT
ROMRWA
SEN
SGP
ZAFESP
LKA
SWECHESYR
TZA
THA
TGO
TTOTUN
TUR
UGA
GBRUSA
URY
VEN
ZWE
-50
5
Lo
ng-r
un
co
effic
ient
-8 -6 -4 -2Infrastructure index per worker
DZAARGAUS
AUT
BLXBEN
BOL
BRA
BFA
CMR
CANCPVCHL CHN
COL
CRI
CIVDNKDOM
ECU
EGY
SLV
ETHFIN
FRA
GAB
GMBGHA
GRCGTMGIN
HND
ISLINDIDN
IRN
IRL
ISR
ITA
JAM
JPN
JOR KENKOR
LSO MDG
MWI
MYS
MLI
MUS MEXMAR
MOZ
NPLNLD
NZL
NIC
NER
NGA
NOR
PAK
PAN PRY
PER
PHLPRT
ROMRWA
SEN
SGP
ZAFESP
LKA
SWECHE SYR
TZA
THA
TGO
TTO TUN
TUR
UGA
GBRUSA
URY
VEN
ZWE
-50
5
Lo
ng-r
un
co
effic
ient
12 14 16 18 20 22Logarithm of population
Output elasticity of infrastructure vs. population Output elasticity of infrastructure vs. distortion index
DZAARGAUS
AUT
BLXBEN
BOL
BRA
BFA
CMR
CANCPVCHLCHN
COL
CRI
CIVDNKDOM
ECU
EGY
SLV
ETHFIN
FRA
GAB
GMBGHA
GRC GTMGIN
HND
ISLINDIDN
IRN
IRL
ISR
ITA
JAM
JPN
JORKENKOR
LSO MDG
MWI
MYS
MLI
MUS MEXMAR
MOZ
NPLNLD
NZL
NIC
NER
NGA
NOR
PAK
PANPRY
PER
PHLPRT
ROM RWA
SEN
SGP
ZAFESP
LKA
SWECHE SYR
TZA
THA
TGO
TTOTUN
TUR
UGA
GBRUSA
URY
VEN
ZWE
-50
5
Lo
ng-r
un
co
effic
ient
0 100 200 300 400Price of investment

13
Further homogeneity tests
Break sample into high / low along the relevant dimension – and test for equality of mean infrastructure elasticity.
Infrastructure and growth
Per Capita
Income (A)
Per Capita
Income (B)
Infrastructure
Endowment
Total
PopulationDistortions
High 0.054 0.044 0.059 -0.016 -0.156
Low 0.059 0.062 0.055 0.131 0.271
p-value 0.985 0.94 0.988 0.576 0.102
Overall, no strong evidence that the elasticity varies across countries.
The implication is that the marginal product of infrastructure declines as the infrastructure / output ratio rises.

14
• All this is only about the benefit side of infrastructure –
what about the cost?
• Cost-benefit comparison is needed to assess the extent
of under-provision of infrastructure – and whether it is
greater than that of other inputs (e.g., human capital)
– Limited evidence on this (e.g., Canning and Pedroni 2008: no
generalized infrastructure shortage across countries / sectors)
– Calderón and Servén (2010): big growth impact of infrastructure
catch-up in Africa – but massive cost involved: 10% to 15% of
GDP for (half) catching-up, even ignoring O&M.
– Loayza (2010): big growth impact in Egypt – but only if much of
the cost is financed by spending cuts elsewhere
From spending to assets

15
Sub-Saharan Africa: cost of infrastructure catch-up

16
Is spending a good proxy for infrastructure development?
– Spending is often very inefficient: bad projects, waste…
– Weak link between spending and assets / services (Pritchett
2000): it is mediated by government technical capacity, fiscal
institutions, budgetary practices, governance...
– Big scope for corruption and political clientelism
• Tanzi and Davoodi 1997; Keefer-Knack 2007: weak governance
and corruption raise measured ‘public investment’ – in reality, much
is rent extraction rather than asset acquisition.
• Incentives for investment over O&M: bigger room for corruption,
political favors and photo-ops – so build new roads rather than
maintain old ones.
From spending to assets

17
Better understanding of costs of asset acquisition, and their
determinants, is needed for policy decisions.
– Without it, a ‘big push’ to infrastructure may lead to massive
waste
But this requires much more complete and detailed data on
infrastructure spending and performance
– Often we cannot even establish the facts – especially on O&M,
but in many countries also on sector-wise investment spending
– Bad data also hampers accountability / transparency
Poor data arguably is one of the biggest obstacles to better
diagnostic of the problems and design of solutions
From spending to assets

New database under construction – investment by
infrastructure sector in developing countries
• Builds on earlier data collection for Latin America
(Calderón and Servén 2004, 2010)
• Disaggregation into power, water/sanitation, roads, rail,
telecom – when feasible
• Disaggregation into public and private investment
• Time coverage from 1980
Preview of work in progress.
From spending to assets
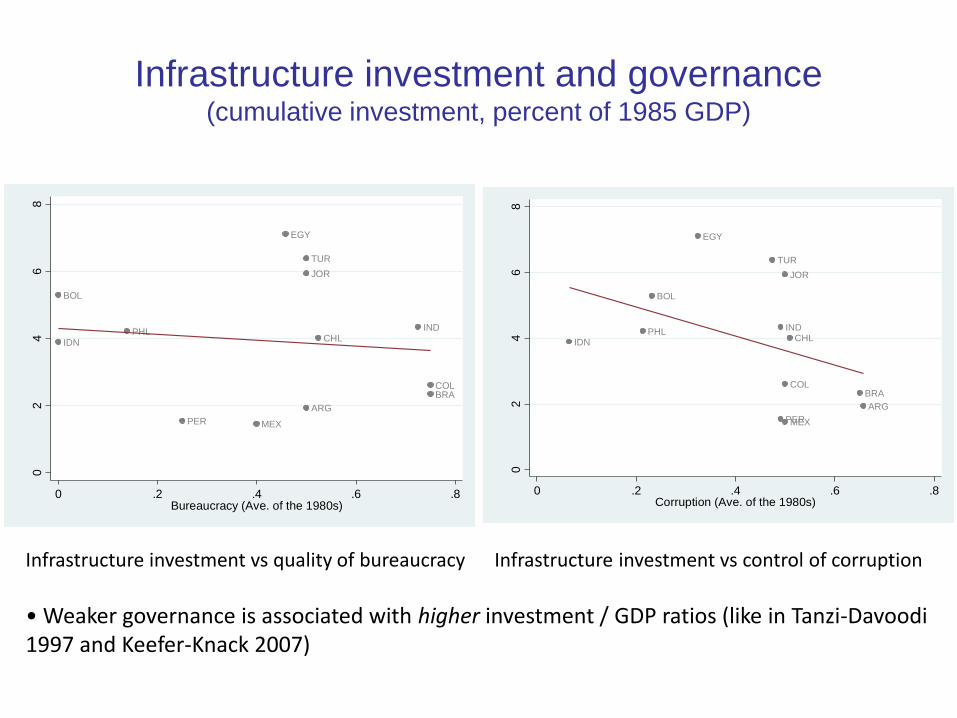
Infrastructure investment and governance(cumulative investment, percent of 1985 GDP)
IDN
BOL
PHL
PER MEX
EGY
TUR
ARG
JOR
CHLIND
COLBRA
02
46
8
Cum
ula
tive in
ve
stm
ent (%
of G
DP
) ('85
-)
0 .2 .4 .6 .8Bureaucracy (Ave. of the 1980s)
Infrastructure investment vs quality of bureaucracy Infrastructure investment vs control of corruption
• Weaker governance is associated with higher investment / GDP ratios (like in Tanzi-Davoodi 1997 and Keefer-Knack 2007)
IDNPHL
BOL
EGY
TUR
PER
IND
JOR
MEX
COL
CHL
BRA
ARG
02
46
8
Cum
ula
tive in
ve
stm
ent (%
of G
DP
) ('85
-)
0 .2 .4 .6 .8Corruption (Ave. of the 1980s)

How big is the cost impact of governance?
Look at the average unit cost of infrastructure assets
Note that c should be expected to vary across infrastructure sectors.
Construct sector-specific c – with K respectively given by– road km
– power generation capacity (Gw)
– telephone lines
0
0
T
t
t
T
I
cK K
From spending to assets

Across countries, c may vary with per capita GDP (wages, RER) and other factors
• Add also climatic / geographic / demographic controls in regressions
Some data limitations:• No information on O&M spending
• No information on asset quality (except % roads paved)
• Small country sample (only 17 countries for the moment…)
No retrospective info on fiscal / budgetary institutions, so look instead at the correlation of unit cost with broader governance-related variables:
• (Control of) corruption [higher is better]
• Quality of bureaucracy [project selection, procurement…]
From spending to assets

IDN
PHL
BOL
EGY
MEX
TUR
PER
CHL
JOR
COL
ARG
BRA
IND
MNG
-2-1
01
23
Unit c
osts
for
roa
ds (
'85-)
-.4 -.2 0 .2 .4Corruption (Ave. of the 1980s)
IDN
PHL
BOL
MEX
EGY
TUR
CHL
PER
PAK
JOR
COL
ARG
THA
BRA
VNM
IND
ZAF
-1-.
50
.51
Unit c
osts
for
EG
C (
'85
-)
-.4 -.2 0 .2 .4Corruption (Ave. of the 1980s)
IDN
PHL
BOL
EGY
MEX
TUR
PER
CHL
JOR
COL
ARG BRA
IND
MNG
-1-.
50
.51
Unit c
osts
for
ml ('8
5-)
-.4 -.2 0 .2 .4Corruption (Ave. of the 1980s)
Power Phone
lines
Roads
Unit cost of infrastructure assets and control of
corruption (controlling for GDP per capita)

Power Phone
lines
Roads
BOL
IDN
PHL
PER
MEX
ARG
VNMTUR
JOR
CHL
EGY
PAK
BRA
COLTHA
IND
ZAF
-1-.
50
.51
Unit c
osts
for
EG
C (
'85
-)
-.4 -.2 0 .2 .4Bureaucracy (Ave. of the 1980s)
BOL
IDN
PHL
PER
MEX MNGARG
TUR
JOR
CHL
EGY
BRA
COL
IND
-1-.
50
.51
Unit c
osts
for
ml ('8
5-)
-.4 -.2 0 .2 .4Bureaucracy (Ave. of the 1980s)
BOL
IDN
PHL
PERMEX
MNG
ARG
TUR
JOR
CHL
EGY
BRACOL
IND
-2-1
01
23
Unit c
osts
for
roa
ds (
'85-)
-.4 -.2 0 .2 .4Bureaucracy (Ave. of the 1980s)
Unit cost of infrastructure assets and quality of
bureaucracy (controlling for GDP per capita)

Weaker governance is associated with higher asset costs
in all sectors examined.
Corruption and low bureaucratic quality drive a wedge
between investment spending and actual infrastructure
development.
Regression estimates suggest that the magnitude of the
wedge is considerable
– 1 sd improvement in corruption raises by 25% the volume of
assets acquired with a given amount of investment
– 1 sd improvement in bureaucratic quality raises it by 18%
From spending to assets

25
Extensive research on the growth benefits of infrastructure– Overall, solid evidence that infrastructure quantity and quality
help growth
– Also evidence of a positive impact on equity – hence scope for a double poverty-reducing effect
– Effects are bigger where infrastructure endowments are lower –so potentially a big payoff from infrastructure catchup for LICs
But much less attention has been paid to the costs– More analysis of returns vs costs of infrastructure assets is
needed – with more focus on specific sectors in specific countries
– Poor data on spending (especially O&M) is one of the biggest obstacles to better understanding of costs
Conclusions

26
Poor governance drives a wedge between infrastructure spending and actual infrastructure development
– Low government capacity, weak fiscal governance and corruption inflate asset costs, discourage O&M, and reduce the efficiency of spending
– This has big effects on the cost of infrastructure development
Raising the efficiency of spending is a key priority– Research needs to identify institutional mechanisms and
incentives that favor sound spending decisions
Developing stronger project selection and evaluation capacity
Assessing if / how different budgetary institutions, checks and balances can help
– Otherwise, more spending may yield a lot of waste and not much more infrastructure development.
Conclusions

End