Embed Size (px)
Citation preview

INFRASTRUCTURE EVIDENCE BASE
TEN-YEAR CAPITAL INTENTIONS PLAN 2016
21 October 2016
TEN-YEAR CAPITAL INTENTIONS PLAN 2016
2
Contents
INTRODUCTION ............................................................................................................................................................ 4
The Thirty Year New Zealand Infrastructure Plan 2015 ........................................................................................ 6 Improvements to How Government Makes Investment Decisions ...................................................................... 6 National Infrastructure Evidence Base ................................................................................................................. 7 Other Sources of Information ............................................................................................................................... 7
DATA REALITIES AND CAVEATS .................................................................................................................................... 8
METHODOLOGY ............................................................................................................................................................ 9
General .................................................................................................................................................................. 9 Central Government ............................................................................................................................................. 9 Local Government ................................................................................................................................................. 9 Private Sector ...................................................................................................................................................... 10
GLOSSARY ................................................................................................................................................................... 11
ACTUALS AND INTENTIONS: 2012–2025 .................................................................................................................... 12
Overall Summary Analysis and Figures ............................................................................................................... 12
Central Government ................................................................................................................................................... 13
By Agency ............................................................................................................................................................ 13 By Region ............................................................................................................................................................ 15 By Year ................................................................................................................................................................ 16 By Start Date ....................................................................................................................................................... 16 By Sector ............................................................................................................................................................. 17 Social Sector ........................................................................................................................................................ 17 Transport Sector ................................................................................................................................................. 17
Local Government ...................................................................................................................................................... 18
By Region ............................................................................................................................................................ 18 By Year ................................................................................................................................................................ 19 By Start Date ....................................................................................................................................................... 20 By Sector ............................................................................................................................................................. 20 Environment ....................................................................................................................................................... 20 Water .................................................................................................................................................................. 21 Transport ............................................................................................................................................................ 21 Social ................................................................................................................................................................... 22
Private Sector ............................................................................................................................................................. 23
By Region ............................................................................................................................................................ 23 By Company ........................................................................................................................................................ 24 By Start Date ....................................................................................................................................................... 24 By Sector ............................................................................................................................................................. 25 By Sub-sector ...................................................................................................................................................... 25

TEN-YEAR CAPITAL INTENTIONS PLAN 2016
3
INTENTIONS: 2016–2025 ............................................................................................................................................ 14
Central Government Capital Intentions – Summary........................................................................................... 28 Central Government Capital Intentions – Regional Spread Diagram ................................................................. 29 Local Government – Capital Intentions Summary Diagram ............................................................................... 30 Local Government Capital Intentions – Regional Spread Diagram – Part 1 ....................................................... 31 Local Government Capital Intentions – Regional Spread Diagram – Part 2 ....................................................... 32 Private Sector – Capital Intentions Summary Diagram and Regional Spread Diagram ...................................... 33
TEN-YEAR CAPITAL INTENTIONS PLAN 2016
4
INTRODUCTION The Treasury’s National Infrastructure Unit (NIU) is pleased to publish the Ten-Year Capital Intentions Plan 2016. This year’s Capital Intentions Plan is the third in a series since 2014. The Capital Intentions Plan provides a view of spending on infrastructure across central government, local government and the private sector to 2025.
This year’s Capital Intentions Plan follows the release of the Thirty Year New Zealand Infrastructure Plan 2015, published in August last year. Delivering annual Capital Intentions Plans is one of eight anchor actions in the 2015 Infrastructure Plan.
The purpose of the Capital Intentions Plan is to provide the construction and infrastructure sectors with greater visibility of upcoming investment commitments and opportunities. It recognises that a key focus of the 2015 Infrastructure Plan is to provide businesses with greater certainty and confidence about current and future infrastructure provision. This is important because an efficient and reliable infrastructure network underlies our economy and is the basis for our social, economic, environmental and cultural wellbeing. As a unit within the Treasury, delivering higher living standards for New Zealanders is central to our purpose.
The Capital Intentions Plan brings together data from government departments, local authorities, State-owned enterprises and publicly-listed companies. Central government data are drawn from information that agencies submit to the Treasury three times a year on their investment commitments and intentions. Local government data draw from council long-term investment plans and thirty year infrastructure strategies. Private sector data are based on information available in publicly-available reports, such as annual reports and websites. All central and local government data have been subsequently verified by the respective government departments and councils.
With time, our aim is that future Capital Intentions Plans will become increasingly detailed and specific. To achieve this, we are relying on the information submitted by central government and the content of council long-term plans in order to achieve this specificity. Many contributors to this report are in a position to deliver information that is detailed and specific; for others, this is something that they strive to improve.
The planning and management of capital spending is still a relatively new but improving process. New requirements on central and local government to undertake investment planning has led to substantial progress over recent years as to how government departments and councils understand the performance of their assets and the ongoing management and investment they require.
This year’s Capital Intentions Plan represents a reset of our baseline data. Because this year we have access to more detailed reporting information, we have been able to separate actuals spent since 2012 from intentions for 2016 to 2025. As a result, this Capital Intentions Plan is broken in to two sections: Actuals and Intentions 2012–2025 and Intentions 2016–2025. From 2017, we will be able to show forward intentions for the next ten years only.
The projects listed in this report and the analysis provided come with a number of caveats and parameters, reflecting the uncertainty inherent in longer-terms plans, the financial rules for how government funding is allocated, the processes and sign-offs required for major capital expenditure and the reality that infrastructure only exists to enable the delivery of services – infrastructure requirements and projects can change as the mix of services to be delivered changes. Most significantly, inclusion of a project does not mean that it has been
TEN-YEAR CAPITAL INTENTIONS PLAN 2016
5
funded or approved, will proceed or that, if it does proceed, it will be the scale and timeframe indicated in this report. It is, however, the best available picture at this particular point in time.
We welcome your feedback on the Capital Intentions Plan and your suggestions for how future plans could be more valuable or useful to you. You can send us your feedback by emailing [email protected]
David Taylor Manager, National Infrastructure Unit, the Treasury

TEN-YEAR CAPITAL INTENTIONS PLAN 2016
6
The following section provides an update on the the Thirty Year New Zealand Infrastructure Plan 2015 and the measures that central government has implemented to improve how investment decisions are made across the public sector. This section also describes how this year’s Capital Intentions Plan builds upon the National Infrastructure Evidence and directs readers to additional sources of information related to infrastructure investment intentions.
The Thirty Year New Zealand Infrastructure Plan 2015
The Thirty Year New Zealand Infrastructure Plan 2015 advocates for a step-change in New Zealand’s approach to infrastructure planning and management. In particular, we need a better understanding of the levels of service we want to deliver, more mature asset management practices and use of data, and more effective decision-making that considers non-asset solutions.
Central and local government own over $200 billion of infrastructure assets and, including the private sector, $100 billion is estimated to be spent on infrastructure by 2025.
Given such a large amount will be spent on infrastructure, it is critical that our infrastructure is well planned, managed, delivered and used.
One of the aims of this Capital Intentions Plan is to help ensure this amount is spent responsibly. By infrastructure providers having greater visibility of future investment trends, they are able to make decisions that do not overburden the labour market, identify synergies between different projects and make the most of other opportunities presented by having more information about future trends.
The Thirty Year New Zealand Infrastructure Plan 2015 can be viewed at infrastructure.govt.nz/plan
Improvements to How Government Makes Investment Decisions
In July 2015, the Government introduced measures that required greater long-term planning and closer scrutiny of how agencies make investment decisions. The new requirements acknowledge that projects within a public sector agency (and across agencies) are often inter-related and compete for resources and attention.
The new measures re-enforced the Treasury’s role as having lead responsibility for the investment management system across central government. As part of this, the Treasury is now required to apply confidence ratings to agencies with respect to their investment decision-making capability. Formally known as the Investor Confidence Rating (ICR), the ICR assesses agencies’ investment management maturity and applies a performance rating. As part of the ICR process, agencies submit long-term investment plans (LTIPs). LTIPs help inform all-of-government prioritisation processes, decisions on fiscal policy settings, the affordability of current policies and future service delivery strategies.
These measures are expected to significantly improve the coordination and sequencing of large-capital projects, as well as identify any capability gaps across central government.
These measures supplement new requirements introduced to local government in August 2014, which required councils to produce 30 year infrastructure strategies. The infrastructure strategies outline how councils will responsibly manage, maintain or replace assets and identify the significant capital decisions councils may be required to make within the 30 year timeframe.

TEN-YEAR CAPITAL INTENTIONS PLAN 2016
7
More information on the recent improvements to the Investment Management System can be viewed at treasury.govt.nz/statesector/investmentmanagement
National Infrastructure Evidence Base
This year’s Capital Intentions Plan builds on the existing suite of documents that together make up the National Infrastructure Evidence Base.
The first Evidence Base, published in 2014, helped to establish a shared understanding of the current state of New Zealand’s infrastructure, and allowed stakeholders across the sectors to agree on the nature of our strengths, weaknesses, opportunities and future challenges.
Through our performance indicators, resilience assessment and scenario/trend analysis, we previously developed sector-specific narratives. The narratives summarise the current performance of infrastructure in the sector and highlight future opportunities and challenges. Narratives were produced in March 2015 for the transport, telecommunications, energy, urban water, productive water and the social sector.
The National Infrastructure Evidence Base can be viewed at infrastructure.govt.nz/plan/evidencebase
Other Sources of Information
The Treasury produces a suite of information and data relating to the Government’s future capital intentions, which can be viewed at treasury.govt.nz/statesector/investmentmanagement/publications
The Ministry of Business, Innovation and Employment (MBIE) also released the latest National Construction Pipeline in July 2016. The report forecasts the nature and timing of future building and construction work by type and region, complemented by information on known non-residential building and construction intentions. The current report can be found at mbie.govt.nz/info-services/building-construction/skills-innovation-productivity/national-construction-pipeline
Infrastructure and capital spending
In preparing this year’s Capital Intentions Plan, we have used the definition of infrastructure as included in the 2011 National Infrastructure Plan: “Infrastructure refers to the fixed, long-lived structures that facilitate the production of goods and services and underpin many aspects of quality of life. Infrastructure is made up of physical networks, principally transport, water, energy, communications and social assets.” For this Capital Intentions Plan, it means that we have principally focused on buildings and large assets and excluded a large number of projects that are less durable or fixed (for example, ICT projects).
Key differences from previous Capital Intentions Plans
Because this year we have had access to more detailed reporting information, we have been able to separate actuals from intentions. However, in order to accurately compare 2016 figures with 2014 and 2015, we have continued to combine actuals and intentions.
But to the give the market a more accurate picture of future investment intentions, we have also shown intentions for 2016–2025 separately. This will help avoid confusion as to what has already been spent and what is still estimated.

TEN-YEAR CAPITAL INTENTIONS PLAN 2016
8
DATA REALITIES AND CAVEATS The Capital Intentions Plan is best used for identifying broad trends over a ten-year period. However, like with previous years, we have shown estimated spending from 2016–2025 on a project-by-project basis. This can be viewed at http://www.infrastructure.govt.nz/plan/evidencebase
The projects included in this year’s Capital Intentions Plan are based on the best view of future spending at a particular point in time. However, we acknowledge that the information included can quickly become out of date, as priorities and circumstances across the public and private sectors change. There can be several reasons for this.
Firstly, thinking is constantly evolving on exactly what services need to be delivered and how best these services are provided. This means that some of the future infrastructure projects listed will be superseded by new or changed thinking about what services need to be provided, what infrastructure best supports the delivery of these services and how or who provides the infrastructure.
Secondly, the Government’s financial system means that funding is appropriated to agencies on an annual basis through the Budget process. While appropriations can be for more than one year, the checks and balances that protect our system mean that a future Parliament may direct funds to different purposes or change the amounts of funds available.
Thirdly, related to the above point, any large capital project has a process to go through, including indicative and detailed business cases. These often require Cabinet approval. Many of the medium to long-term projects included on this list have yet to undertake this process and, therefore, do not have committed funding or a finalised scope and scale.
It is also worth noting that certain large-scale investments have not been included in this Capital Intentions Plan. For example, the $1 billion Housing Infrastructure Fund, announced by the Government in July 2016, is not included because funding will not begin being allocated to high-growth councils until 2017. Similarly, the Ultra-fast Broadband (UFB) Phase 2 rollout, announced in Budget 2015, has not been included in this Capital Intentions Plan as commercial negotiations and contracts are yet to be finalised.
Finally, our private sector data draw on publicly-available resources, which are generally not as detailed as data available from central and local government. Because of this limitation, considerable private sector investment has not been captured in this Capital Intentions Plan, despite our best efforts.
While bearing these caveats in mind, it is also important to note that the focus of this Capital Intentions Plan is on the long term. Current projects that are in the market or shortly to come to market have a higher level of certainty. This certainty decreases the further into the future you look, but this is where the value can be the greatest and where the market has identified a key information gap.

TEN-YEAR CAPITAL INTENTIONS PLAN 2016
9
METHODOLOGY
General
For all data included in this Capital Intentions Plan: · Only data over $1 million have been included. · For large programmes of work covering multiple years where we have not been able to break down the
cost by year, we have included the full cost in the first year (2016). · Forms of capital investment that do not meet our definition of built infrastructure include: computer
projects, vessels, motor vehicles, furniture and fittings, military equipment, commercial forests, library renewals, ICT projects, land not for future infrastructure.
· Projects expected to begin after 2025 have not been included. · For projects with start dates before 2025 but completion dates after 2025, only the value up to 2025 has
been included. · Some land projects have been included as future infrastructure use.
Central Government
· This Capital Intentions Plan uses data submitted to the Treasury by government agencies in mid-2016 as part of their Government Project Portfolio requirements.1
· This Capital Intentions Plan excludes projects and programmes closed out before October 2016. · Central government information collected in 2015 and 2016 includes projects with start dates before
2025 but completion dates after 2025. For these projects, only the value up to 2025 has been included. Central government data collected in 2014 contains full capital values for projects that will be completed after 2025.
· Some programmes of work have been excluded in order to be consistent with the methodology used for the Investment Pipeline 2015–2019, produced by the Treasury in July 2016.2
· All agencies referred to in this Capital Intentions Plan have had the opportunity to review the data, and most agencies have verified the data that they are responsible for.
Local Government
· The local government information is drawn from ten-year long-term plans, the most recent of which were published in 2015.
· This Capital Intentions Plan is the first we have produced since the publication of new council long-term plans in mid-to-late 2015.
· To show the full value of local government programmes and projects, we have – where necessary – shown the capital cost from 2012 to 2015, on top of the capital cost from 2015 to 2025.
· This year’s Capital Intentions Plan goes into further detail than previous versions by providing a year-by-year breakdown of actuals and intentions above $1 million.
· Local government information collected in 2015 and 2016 covers the period to 2025. However, due to limitations with the availability of data at the time, the 2014 data only covers the period to 2022
· All councils referred to in this Capital Intentions Plan have had the opportunity to review the data, and most agencies have verified the data that they are responsible for.
1 Government Project Portfolio data collection: http://www.treasury.govt.nz/statesector/investmentmanagement/think/datacollection 2 Investment Pipeline 2015–2019: http://www.treasury.govt.nz/statesector/investmentmanagement/publications

TEN-YEAR CAPITAL INTENTIONS PLAN 2016
10
Private Sector
· Private sector companies included in this Capital Intentions Plan are those listed on the New Zealand Stock Exchange.
· The private sector information was drawn from company annual reports, websites and other public sources of information.
· Projects closed out in 2015 or earlier have been excluded from this Capital Intentions Plan. Because of limitations with the private sector data, 2015 is the most up-to-date point in time that we could use.
· Some private sector companies advised of projects or programmes of works on their websites, but no dates or costs were given. These projects have not been included.

TEN-YEAR CAPITAL INTENTIONS PLAN 2016
11
GLOSSARY All of New Zealand (as referred to under “Private Sector Regional Spread Summary”) – either refers to projects that may take place across multiple regions, or for projects that – from the sources we have used – do not specify a location
CERA – Canterbury Earthquake Recovery Authority
Community – this includes social infrastructure such as libraries, community halls, civic buildings, council buildings and cemeteries
DIA – Department of Internal Affairs
Environment – this includes water catchment services, harbour management, embankments, drainage and contamination management services
HNZC – Housing New Zealand Corporation
ICR – Investor Confidence Rating
IRD – Inland Revenue Department
Land – this includes the acquisition of land (including parks, reserves and esplanades) for the purposes of development
LINZ – Land Information New Zealand
LTIPs – Long-term Investment Plans
MBIE – Ministry of Business, Innovation and Employment
MCH – Ministry for Culture and Heritage
MFAT – Ministry of Foreign Affairs and Trade
MoE – Ministry of Education
MoH – Ministry of Health
MoJ – Ministry of Justice
MPI – Ministry for Primary Industries
MSD – Ministry of Social Development
NIU – National Infrastructure Unit
NZDF – New Zealand Defence Force
NZTA – New Zealand Transport Agency
Sports and recreation – includes swimming pools, sports fields, astro-turf and cycling and walking tracks
TEC – Tertiary Education Commission
UFB – Ultra-Fast Broadband
TEN-YEAR CAPITAL INTENTIONS PLAN 2016
12
ACTUALS AND INTENTIONS: 2012–20253
Overall Summary Analysis and Figures
The following section includes estimated spending from 2012 to 2025. The report is broken down by central government, local government and the private sector. These sections are subsequently broken down so that actuals and intentions are shown by year, region and sector.
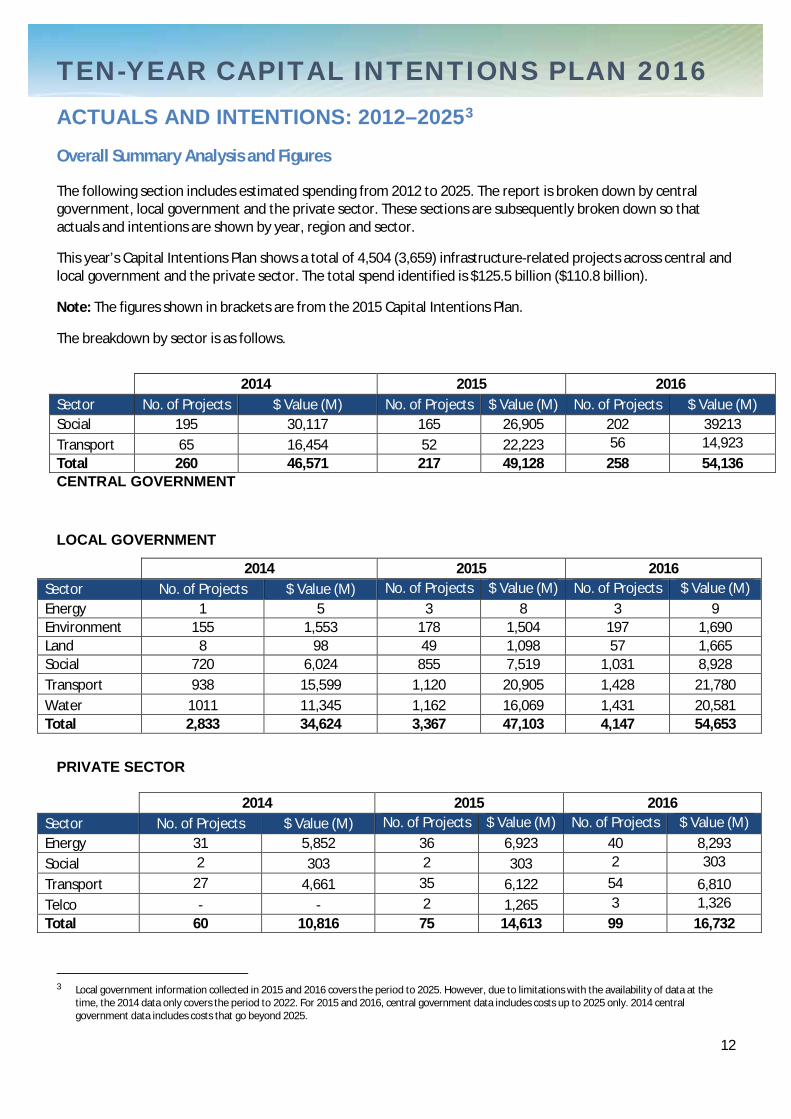
This year’s Capital Intentions Plan shows a total of 4,504 (3,659) infrastructure-related projects across central and local government and the private sector. The total spend identified is $125.5 billion ($110.8 billion).
Note: The figures shown in brackets are from the 2015 Capital Intentions Plan.
The breakdown by sector is as follows.
CENTRAL GOVERNMENT LOCAL GOVERNMENT
PRIVATE SECTOR
3 Local government information collected in 2015 and 2016 covers the period to 2025. However, due to limitations with the availability of data at the
time, the 2014 data only covers the period to 2022. For 2015 and 2016, central government data includes costs up to 2025 only. 2014 central government data includes costs that go beyond 2025.
2014 2015 2016 Sector No. of Projects $ Value (M) No. of Projects $ Value (M) No. of Projects $ Value (M) Social 195 30,117 165 26,905 202 39213 Transport 65 16,454 52 22,223 56 14,923 Total 260 46,571 217 49,128 258 54,136
2014 2015 2016 Sector No. of Projects $ Value (M) No. of Projects $ Value (M) No. of Projects $ Value (M) Energy 1 5 3 8 3 9 Environment 155 1,553 178 1,504 197 1,690 Land 8 98 49 1,098 57 1,665 Social 720 6,024 855 7,519 1,031 8,928 Transport 938 15,599 1,120 20,905 1,428 21,780 Water 1011 11,345 1,162 16,069 1,431 20,581 Total 2,833 34,624 3,367 47,103 4,147 54,653
2014 2015 2016 Sector No. of Projects $ Value (M) No. of Projects $ Value (M) No. of Projects $ Value (M) Energy 31 5,852 36 6,923 40 8,293 Social 2 303 2 303 2 303
Transport 27 4,661 35 6,122 54 6,810 Telco - - 2 1,265 3 1,326 Total 60 10,816 75 14,613 99 16,732

ACTUALS AND INTENTIONS: 2012–2025
13
CENTRAL GOVERNMENT 258 (217) projects have been included from central government agencies totalling over $54 billion ($49 billion).
Note: The figures shown in brackets are from the 2015 Capital Intentions Plan.
By Agency
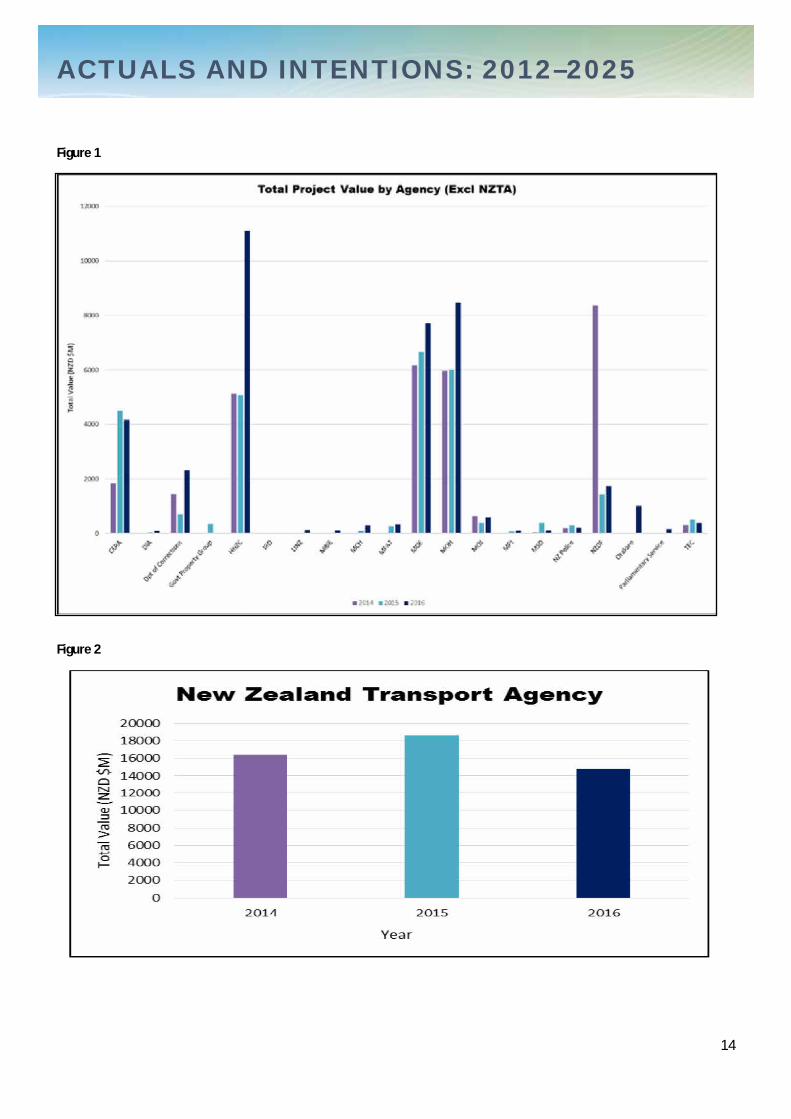
Projects are captured from 18 agencies with the largest contributors by number being the Ministry of Health (MoH) 121 (78), the New Zealand Transport Agency (NZTA) 56 (47) and Department of Corrections 15 (11).
By total value of projects, NZTA is significantly the highest at $14.9 billion ($18 billion), followed by Housing New Zealand Corporation (HNZC), Ministry of Education (MoE) and Ministry of Health (MoH). The middle range, by value, is shown in the chart below (NZTA has been excluded owing to their large estimated spend).
The reduction in NZTA’s estimated spending is mainly owing to the Waitematā Harbour Crossing ($4.5 billion, 2015) being excluded from our data sets because it is projected to be outside the timeframe of the ten-year scope of the Capital Intentions Plan.
The increase in HNZC’s estimated spending is mainly owing to an increase in acquisition and redevelopment programmes.
This is the first year that Ōtākaro has featured, having replaced many of the functions of the Canterbury Earthquake Recovery Authority (CERA). CERA’s figures for 2016 largely include projects that are recorded as formally reaching completion by mid-2017.
ACTUALS AND INTENTIONS: 2012–2025
14
Figure 1
Figure 2

ACTUALS AND INTENTIONS: 2012–2025
15
By Region
At a regional level, the data are heavily influenced by a number of major programmes of work that cover New Zealand and are not disaggregated. These are reflected in the over $21 billion ($13 billion) allocated to the “All of New Zealand” category.
Selected examples of programmes of work in this category include:
· HNZC programmes to acquire and redevelop assets · Department of Corrections’ Community Corrections Facilities programme, and · MoE’s schools and kura programme.
Figure 3
Figure 4

ACTUALS AND INTENTIONS: 2012–2025
16
By Year
Project funding is based on the expected capital cost – not whole-of-life cost. Projects that we have not been able to break down by year are listed under “2016”. This explains why there is such a large amount of investment indicated for 2016.
Note: Figures 5 and 6 only show projects that have start dates in the 2016 financial year and beyond. There may be programmes of works that began prior to 2016 which are included in the Capital Intentions Plan but are not included in Figures 5 and 6.
Figure 5
By Start Date
Figure 6
Total Spend by Sector and Start Date ($ million)
2016 2017 2018 2019 2020 2021 2023 2024 Total
Social 16,574 1,146 233 308 127 124 120 28 18,658
Transport 942 1,050 698 270 722 102 61 611 4,455
Total 17,516 2,195 931 578 849 225 180 639 23,113

ACTUALS AND INTENTIONS: 2012–2025
17
By Sector
The central government data are divided into two sectors – social (Figure 7) and transport (Figure 8). The social sector includes sub-sectors of health, housing, justice and security, earthquake among others. The transport sector comprises roading projects only. For transport, the investment figures for 2016 to 2018 reflect the investment the Government has made in State Highway projects, especially in the Roads of National Significance programme. Many of these projects are expected to be complete by 2020.
Social Sector Figure 7
Transport Sector Figure 8

ACTUALS AND INTENTIONS: 2012–2025
18
LOCAL GOVERNMENT 4,147 (3,367) projects have been included from local authorities totalling over $54.6 billion ($47.1 billion).
Note: The figures shown in brackets are from the 2015 Capital Intentions Plan.
By Region
This section shows estimated spending by regional and district councils across an entire region. For example, the data on Wellington below include the combined estimated spending of the Greater Wellington Regional Council, Wellington City, Hutt City, Upper Hutt City, Porirua City, Kapiti Coast District, South Wairarapa District, Carterton District and Masterton District Councils.
Figure 9 shows that the largest local government spend is generally taking place in New Zealand’s high-growth areas (Auckland, Bay of Plenty, Waikatō, Wellington and Canterbury). The only exception to this is Central Otago.
Figures 10 and 11 show that Auckland and Canterbury are estimating the largest spend. In Auckland, larger projects include the City Rail Loop, large-scale wastewater and water supply projects and land acquisition projects for the purpose of urban development.
Canterbury’s larger projects include a new sports facility for Christchurch, large-scale water services renewals and other renewals projects in Christchurch City.
Figure 9

ACTUALS AND INTENTIONS: 2012–2025
19
Figure 10 Figure 11
By Year
Note: Figures 12 and 13 only show projects that have start dates in the 2016 financial year and beyond. There may be programmes of work that began prior to 2016 which are included in the Capital Intentions Plan but are not included in Figures 12 and 13.
Figure 12
ACTUALS AND INTENTIONS: 2012–2025
20
By Start Date
Figure 13
Total Spend by Sector and Start Date ($ million)
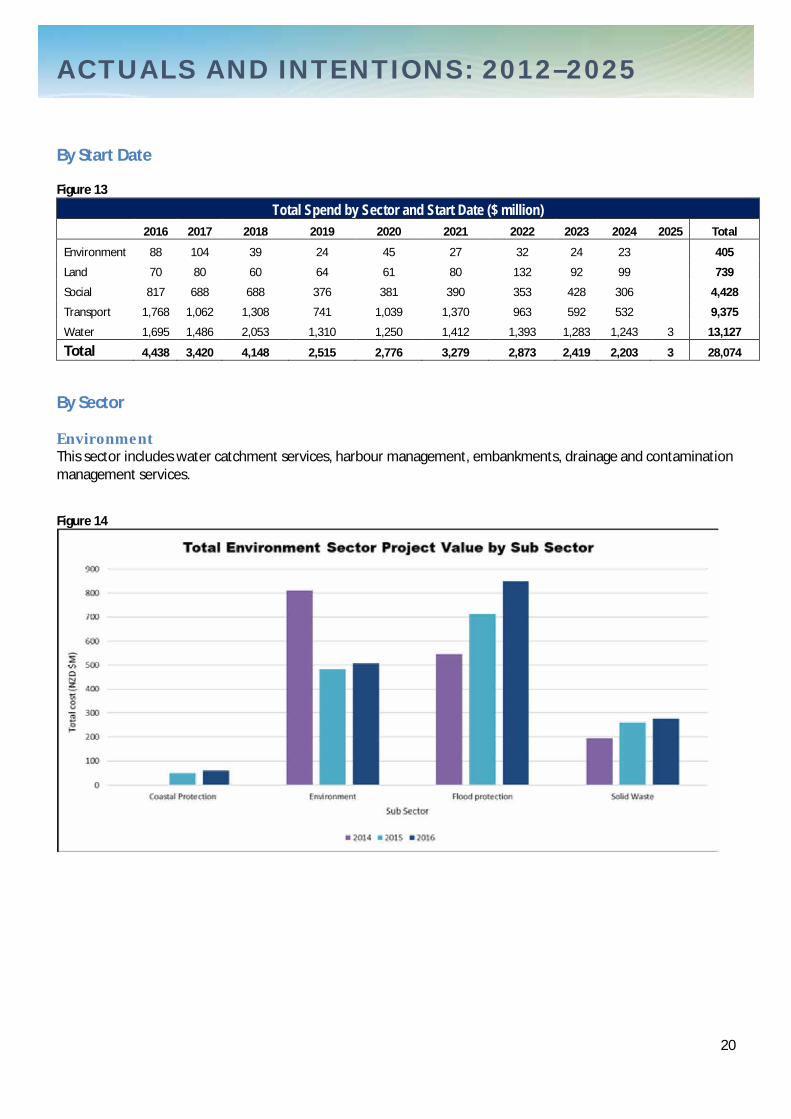
2016 2017 2018 2019 2020 2021 2022 2023 2024 2025 Total
Environment 88 104 39 24 45 27 32 24 23
405
Land 70 80 60 64 61 80 132 92 99
739
Social 817 688 688 376 381 390 353 428 306
4,428
Transport 1,768 1,062 1,308 741 1,039 1,370 963 592 532
9,375
Water 1,695 1,486 2,053 1,310 1,250 1,412 1,393 1,283 1,243 3 13,127
Total 4,438 3,420 4,148 2,515 2,776 3,279 2,873 2,419 2,203 3 28,074
By Sector
Environment This sector includes water catchment services, harbour management, embankments, drainage and contamination management services.
Figure 14

ACTUALS AND INTENTIONS: 2012–2025
21
Water Figure 15
Transport Figure 16
ACTUALS AND INTENTIONS: 2012–2025
22
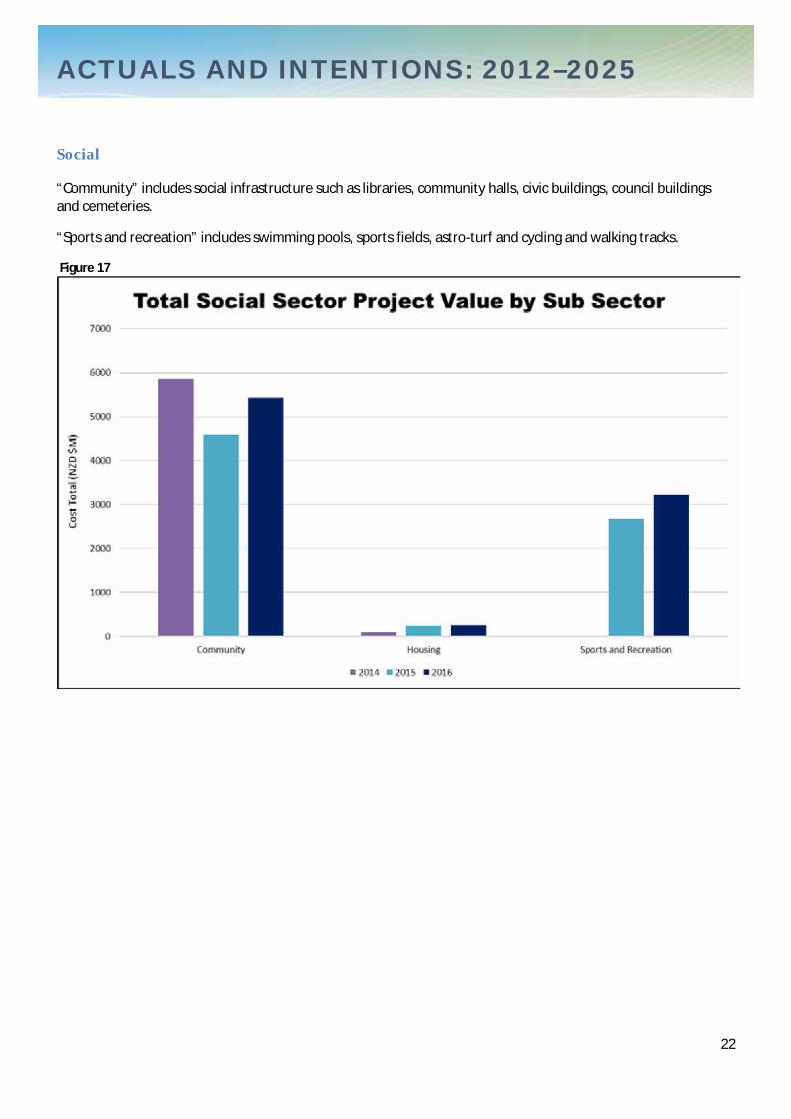
Social “Community” includes social infrastructure such as libraries, community halls, civic buildings, council buildings and cemeteries.
“Sports and recreation” includes swimming pools, sports fields, astro-turf and cycling and walking tracks.
Figure 17

ACTUALS AND INTENTIONS: 2012–2025
23
PRIVATE SECTOR 99 (75) projects have been included from the private sector totalling over $16.7 billion ($14.6 billion).
Note: The figures shown in brackets are from the 2015 Capital Intentions Plan.
The three largest private sector projects are:
· Transpower grid refurbishment and replacement · New Air New Zealand aircraft, and · KiwiRail network and infrastructure renewals and upgrades on rail freight networks.
Figure 18 shows that the largest forward-looking intentions will be in Wellington, most of which are made up of Wellington International Airport upgrades. The offshore projects include Trustpower’s Dundonnell Wind Farm in Victoria, Australia and an Infratil offshore electricity initiative in Australia.
By Region
Figure 18
Figure 19

ACTUALS AND INTENTIONS: 2012–2025
24
By Company
Figure 20
By Start Date
Figure 21
Total Spend by Sector and Start Date (NZD $M)
2016 2017 2018 2022 Total
Energy 197 650 847
Transport 124 128 9 3 264
Total 321 778 9 3 1,111
Note: Figures 20 and 21 only show projects that have start dates in the 2016 financial year and beyond. There may be programmes of works that began prior to 2016 which are included in the Capital Intentions Plan but are not included in this analysis.

ACTUALS AND INTENTIONS: 2012–2025
25
By Sector
Figure 22
By Sub-sector
Figure 23

ACTUALS AND INTENTIONS: 2012–2025
26
Figure 24
Figure 25

INTENTIONS: 2016–2025
27
INTENTIONS: 2016–2025 The following section contains intentions for the period 2016–2025 only. Actuals from the period 2012–2016 have been removed.
This section is broken down by central government, local government and the private sector. More specifically, these sectors have been broken down into sub-sectors.
In terms of future intentions, $40.5 billion will be spent by central government, $51.1 billion by local government and $9.2 billion by the private sector.
The diagrams over the page show these data by government, agency, region and sub-sector.
CENTRAL GOVERNMENT LOCAL GOVERNMENT
PRIVATE SECTOR
2016 Sector No. of Projects $ Value (M) Social 168 25,672 Transport 51 14,835 Total 219 40,507
2016 Sector No. of Projects $ Value (M) Energy 2 4 Environment 158 1,548 Land 45 1,555 Social 885 8,211 Transport 1,270 20,344 Water 1,199 19,519 Total 3,559 51,181
2016 Sector No. of Projects $ Value (M) Energy 10 3,820 Transport 35 5,397 Total 45 9,217

INTENTIONS: 2016–2025
28
INTENTIONS: 2016–2025 Central Government Capital Intentions – Summary
NOTE: Available as a separate PDF.

INTENTIONS: 2016–2025
29
Central Government Capital Intentions – Regional Spread Diagram
NOTE: Available as a separate PDF.
INTENTIONS: 2016–2025
30
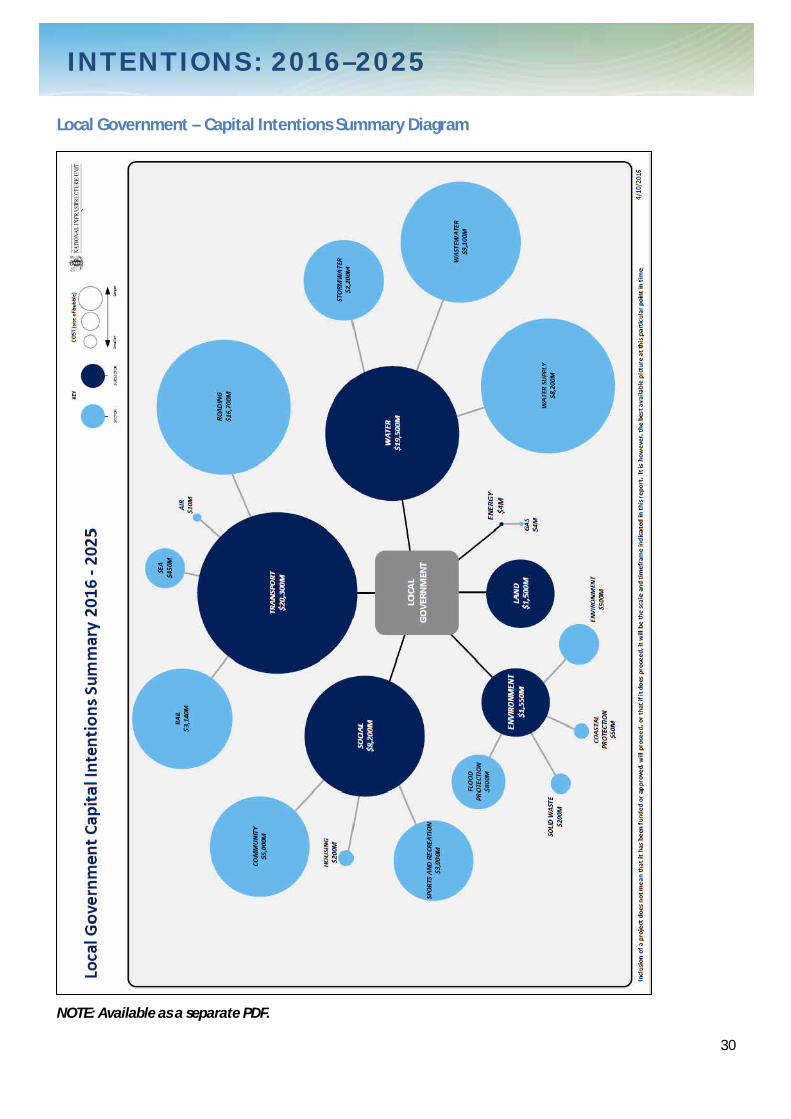
Local Government – Capital Intentions Summary Diagram
NOTE: Available as a separate PDF.

INTENTIONS: 2016–2025
31
Local Government Capital Intentions – Regional Spread Diagram – Part 1
NOTE: Available as a separate PDF.

INTENTIONS: 2016–2025
32
Local Government Capital Intentions – Regional Spread Diagram – Part 2
NOTE: Available as a separate PDF.

INTENTIONS: 2016–2025
33
Private Sector – Capital Intentions Summary Diagram and Regional Spread Diagram
NOTE: Available as a separate PDF.