Embed Size (px)
Citation preview

Infrastructure
adapted fromMark Crovella and Balachander Krishnamurthy

Properties to Measure
• Physical Properties– Links
• wired, wireless– radio spectrum
• propagation delay, capacity, packet delay, packet loss, jitter
– Devices• NAT boxes• Firewalls• Switches• Routers
– FIFO queue, active queue management– network measurements typically try to elicit responses from routers
» internal mechanisms affect responses– IP aliases, geo-location

Properties to Measure
• Topology Properties
– Autonomous System (AS)
– Point of Presence (PoP)
– Router
– Interface

Properties to Measure
• Traffic Properties– Delays
• Transmission (s/t) • Propagation (d/v)• Routing (Queuing + Processing + Other)
– Losses• ln = Ln / Cn
– Throughput • (Cn-Ln)/T
– Jitter• depends on inter-arrival time
– End-to-end connections• goodput

Challanges

Challenges
“Poor Observability”
• Reasons for this:– Core simplicity
– Layered architecture
– Hidden pieces
– Administrative barriers

Core Simplicity
• Keep It Simple Stupid (KISS) design principle
• End-to-End argument
• Stateless nature w.r.t connections/flows– no support for measurement– SNMP: considerable overhead even with per-packet/byte counters
• As network elements do not track packets individually, interaction of traffic with the network is hard to observe
Layered Architecture
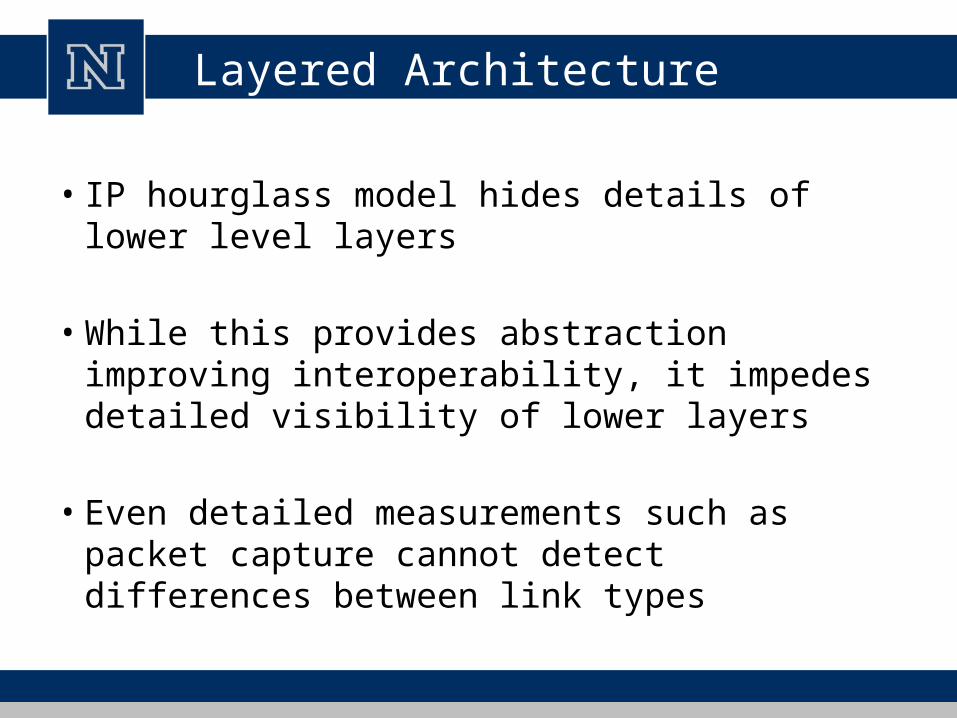
• IP hourglass model hides details of lower level layers
• While this provides abstraction improving interoperability, it impedes detailed visibility of lower layers
• Even detailed measurements such as packet capture cannot detect differences between link types
Hidden Pieces - Middleboxes
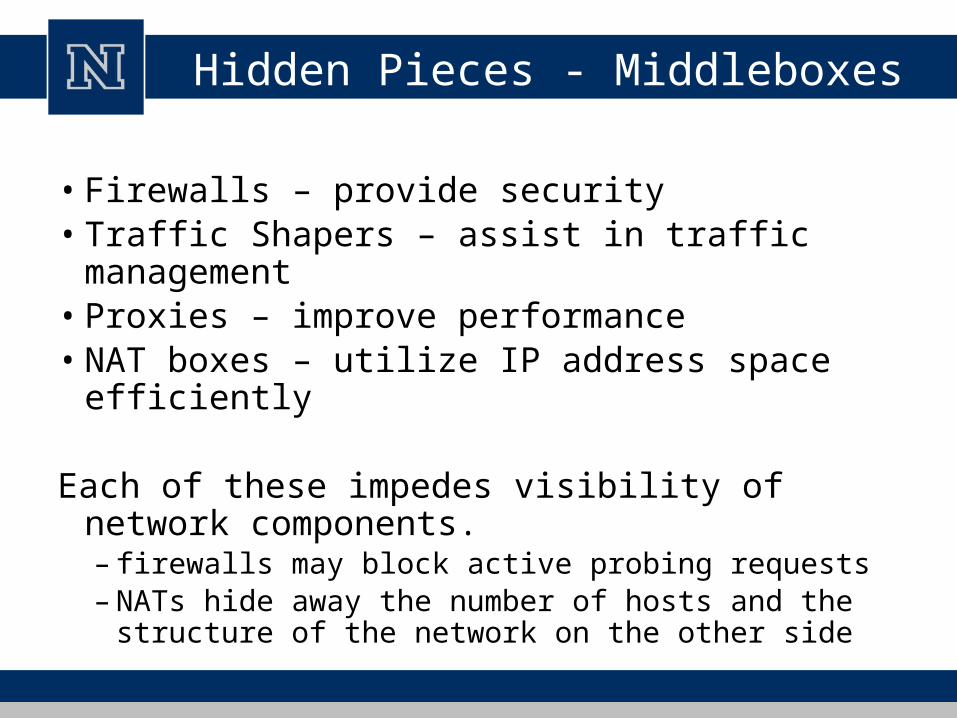
• Firewalls – provide security• Traffic Shapers – assist in traffic management• Proxies – improve performance• NAT boxes – utilize IP address space efficiently
Each of these impedes visibility of network components.– firewalls may block active probing requests – NATs hide away the number of hosts and the structure of the
network on the other side

Administrative Barriers
• ISPs actively seek to hide details from outside discovery owing to the competition-sensitive nature of the data required – topology, traffic etc.
• Information that they do provide are often simplified– No cross ISP SNMP– Instead of publishing router-level topologies, ISPs often publish PoP-
level topologies

Tools

Tools Classification
• Active Measurement• Passive Measurement• Fused/Combined Measurement• Bandwidth Measurement• Latency Measurement• Geolocation• Others

Active Measurement Tools
• Methods that involve adding traffic to the network for the purposes of measurement
Ping: Sends ICMP ECHO_REQUEST and captures ECHO_REPLY– Useful for measuring RTTs– Only sender needs to be under experiment control
OWAMP: A daemon running on the target which listens for and records probe packets sent by the sender– Useful for measuring one-way delay– Requires both sender and receiver to be under experiment control– Requires synchronized clocks or a method to remove clock offset

Traceroute
• Useful for determining path from a source to a destination
• Uses the TTL (Time To Live) field in the IP header in a clever but distorted way
• Large scale measurement systems use traceroute to discover network topology
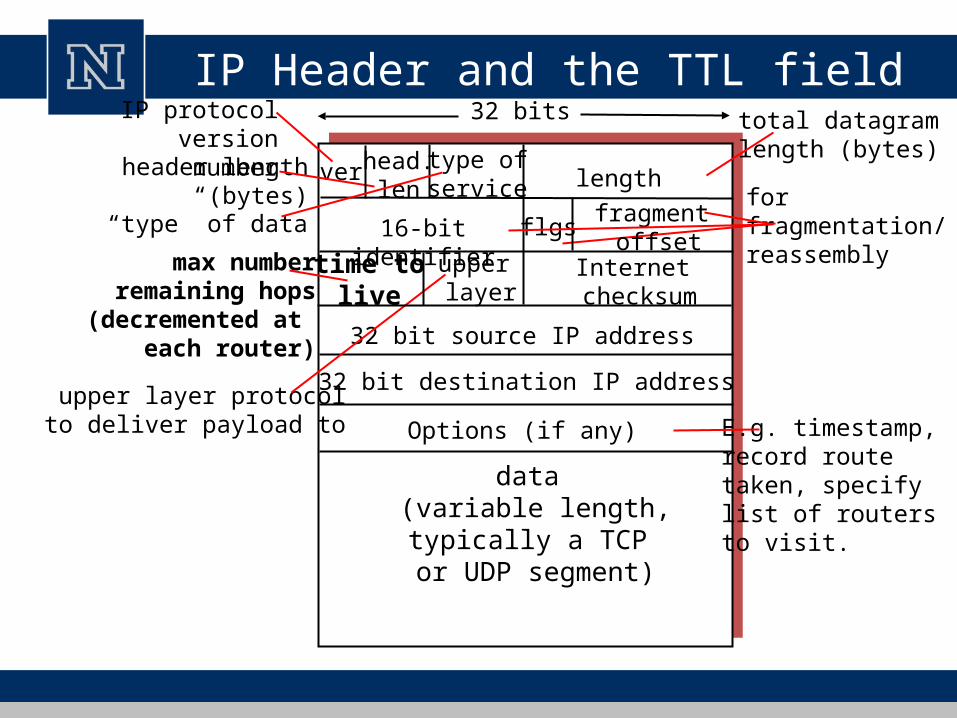
IP Header and the TTL field
ver length
32 bits
data (variable length,typically a TCP
or UDP segment)
16-bit identifier
Internet checksum
time tolive
32 bit source IP address
IP protocol version numberheader length
(bytes)
max numberremaining hops
(decremented at each router)
forfragmentation/reassembly
total datagramlength (bytes)
upper layer protocolto deliver payload to
head.len
type ofservice
“type” of data flgsfragment
offsetupper layer
32 bit destination IP address
Options (if any) E.g. timestamp,record routetaken, specifylist of routers to visit.

TTL normal usage
• TTL is initialized by the sender and decremented by one each time the packet passes through a router
• If it reaches zero before reaching the destination, IP protocol requires that the packet be discarded and an error message be sent back to the sender
• Error message is an ICMP “time exceeded” packet

Traceroute
• Probe packets are carefully constructed to elicit intended response from a probe destination
• traceroute probes all nodes on a path towards a given destination– TTL-scoped probes obtain ICMP error messages from routers on the
path– ICMP messages includes the IP address of intermediate routers as its
source
• Merging end-to-end path traces yields the network map
S DA B C
DestinationTTL=1
IPA
TTL=2
IPB
TTL=3
IPC
TTL=4
IPD
Vantage Point

Traceroute Problem
• Suppose the path between A and D is to be determined using traceroute
A
X Y
D
B C

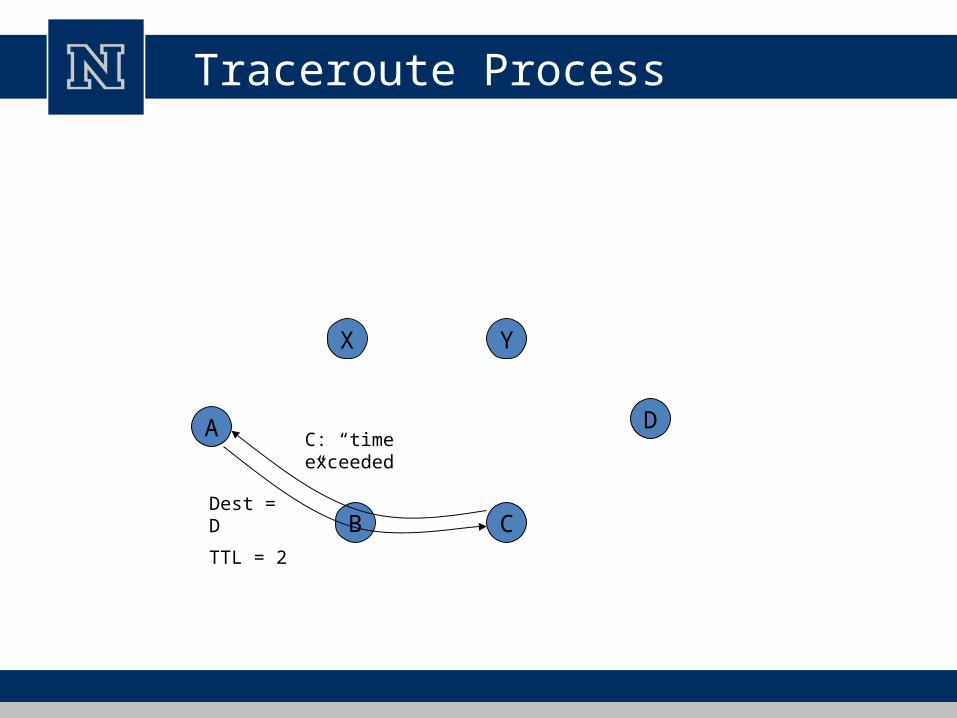
Traceroute Process
A
X Y
D
B C
Dest = D
TTL = 1
B: “time exceeded”
Traceroute Process
A
X Y
D
B CDest = D
TTL = 2
C: “time exceeded”

Traceroute Process
A
X Y
D
B C
Dest = D
TTL = 3
D: “echo reply”

Traceroute issues
• Path Asymmetry – Destination -> Source need not retrace Source -> Destination
• Unstable Paths and False Edges
• Aliases
• Measurement Load

Unstable Paths and False Edges
Inferred path: A -> B -> Y
A
X Y
D
B C
Dest = D
TTL = 1
B: “time exceeded”
Dest = D
TTL = 2
Y: “time exceeded”

Probing
• Direct probing
• Indirect probing
A DB CIPB TTL=64
IPB
IPD TTL=64
IPD
Vantage Point
A DB C
Vantage Point
IPB
IPD TTL=2IPD TTL=1
IPC

Aliases
• IP addresses are for interfaces and not routers• Routers typically have many interfaces, each with its own IP
address• IP addresses of all the router interfaces are aliases• Traceroute results require resolution of aliases if they are to be
used for topology building

Measurement Load
• Traceroute inserts considerable load on network links if attempting a large-scale topology discovery
• Optimizations reduce this load considerably– If single source is used, instead of going from source to
destination, a better approach is to retrace from destination to source
– If multiple sources and multiple destinations are used, sharing information among these would bring down load considerably

Other Methods
• Multicast– Replied by routers along the path
• Synchronize measurements– Packet loss– Queue size
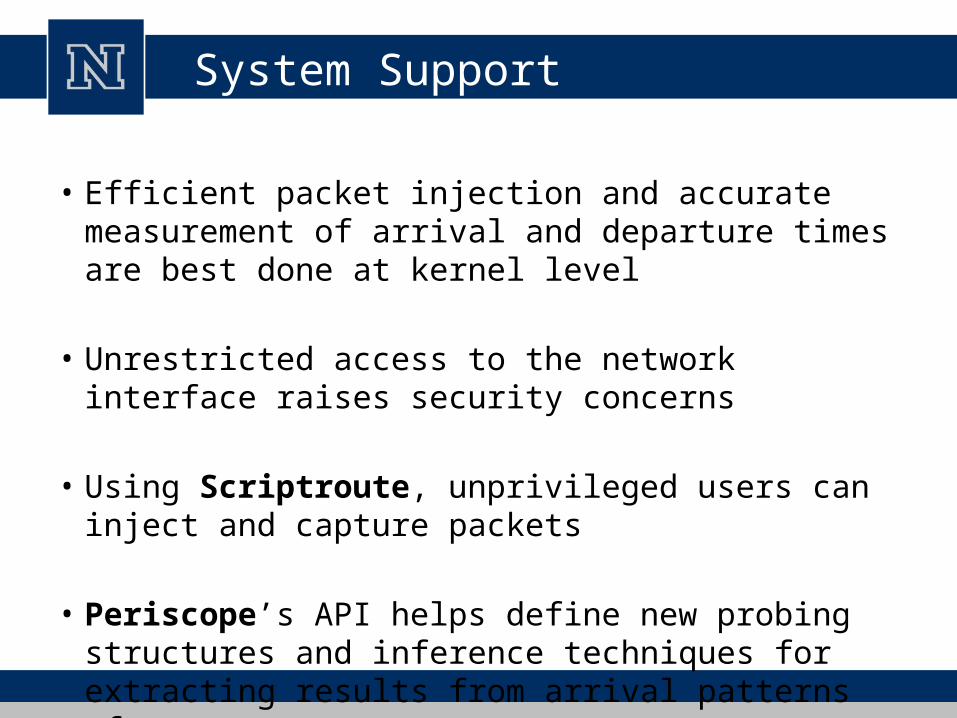
System Support
• Efficient packet injection and accurate measurement of arrival and departure times are best done at kernel level
• Unrestricted access to the network interface raises security concerns
• Using Scriptroute, unprivileged users can inject and capture packets
• Periscope’s API helps define new probing structures and inference techniques for extracting results from arrival patterns of responses

Passive Measurement
• Methods that capture traffic generated by other users and applications to build the topology
• Routeview repository collects BGP views (routing tables) from a large set of ASes
• Similarly, OSPF LSAs can be captured and processed to generate router graphs within an AS


Passive Measurement: Advantages and Disadvantages
• Large set of AS-AS, router-router connections can be learned by simply processing captured tables
• However, especially using BGP views, there could be potential loss of cross-connections between ASes which are along the path
• Secondly, route aggregation and filtering tends to hide some connections
• Also, multiple connections between ASes will be shown as a single connection in the graph
Internet Topology Mapping
33
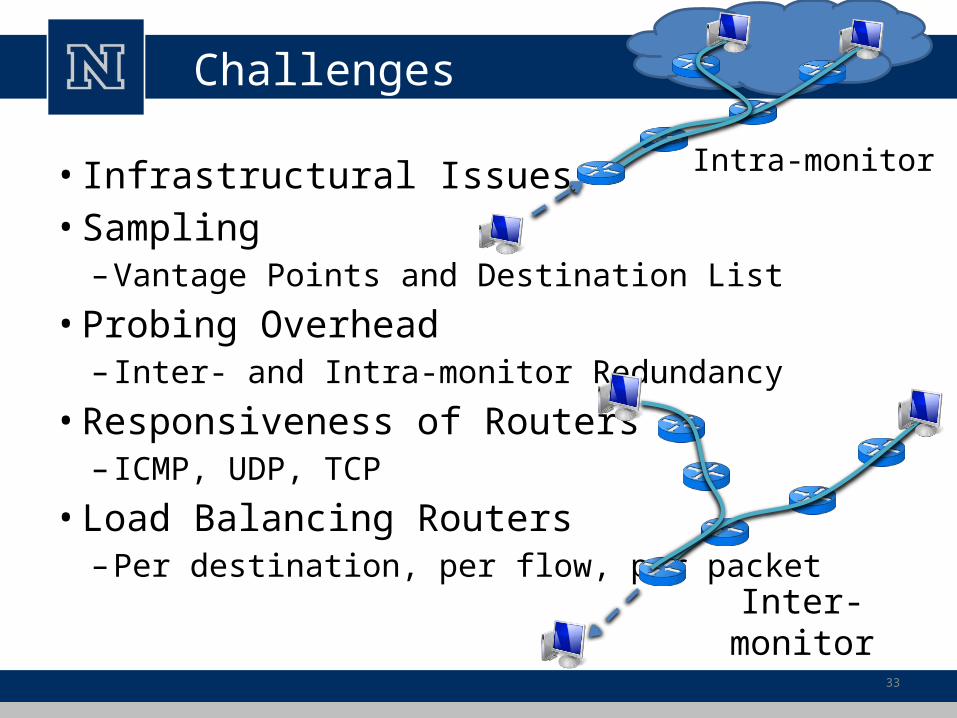
Challenges
• Infrastructural Issues• Sampling
– Vantage Points and Destination List
• Probing Overhead– Inter- and Intra-monitor Redundancy
• Responsiveness of Routers– ICMP, UDP, TCP
• Load Balancing Routers– Per destination, per flow, per packet
Intra-monitor
Inter-monitor

Topology Collection
Internet2 backbone
Traces• d - H - L - S - e• d - H - A - W - N - f• e - S - L - H - d• e - S - U - K - C - N - f• f - N - C - K- H - d• f - N - C - K - U - S - e
S
L
U
K
C
H
A
W
N
e
d
f

Topology Sampling: Issues
• Sampling to discover networks – Infer characteristics of the topology
• Different studies considered – Effect of sample size [Barford 01]– Sampling bias [Lakhina 03]– Path accuracy [Augustin 06] – Sampling approach [Gunes 07]– Utilized protocol [Gunes 08]
• ICMP echo request• TCP syn • UDP port unreachable• ~ 10% of routers are unresponsive
Protocol Responsiveness
ICMP 81.9 %
TCP 67.3 %
UDP 59.9 %
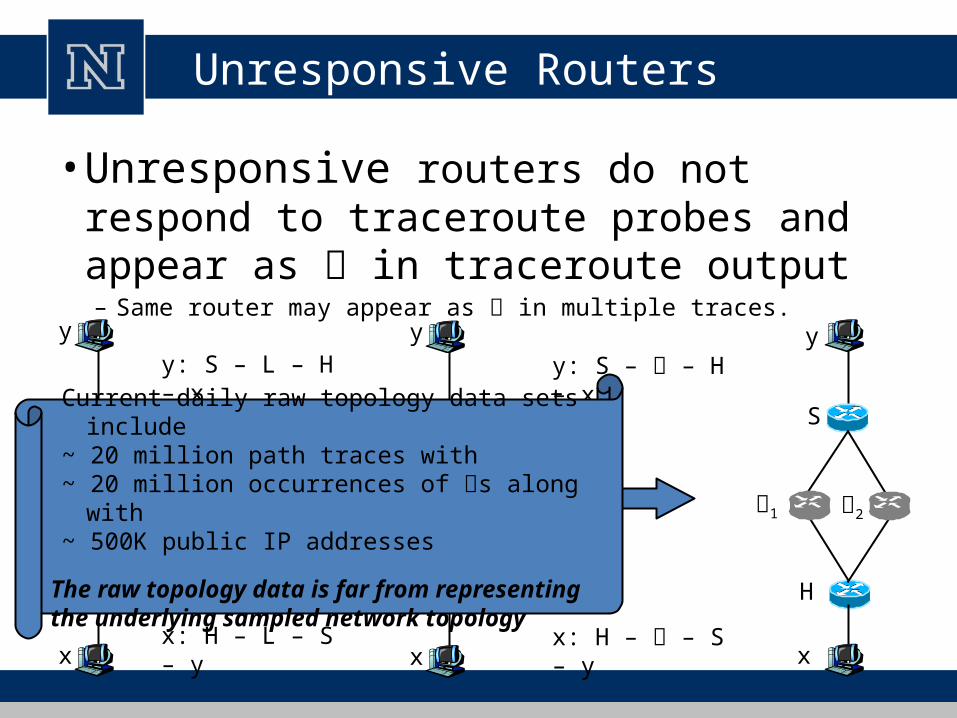
Unresponsive Routers
• Unresponsive routers do not respond to traceroute probes and appear as in traceroute output– Same router may appear as in multiple traces.
y: S – L – H – x
x: H – L – S – y
y: S – – H – x
x: H – – S – y
S
L
H
y
x
S
L
H
y
x
y
S
1 2
H
x
Current daily raw topology data sets include~ 20 million path traces with~ 20 million occurrences of s along with~ 500K public IP addresses
The raw topology data is far from representing the underlying sampled network topology

Unresponsive Router Resolution
Internet2 backboneS
L
U
K
C
H
A
W
N
e
d
Traces• d - - L - S - e• d - - A - W - - f• e - S - L - - d• e - S - U - - C - - f• f - - C - - - d• f - - C - - U - S - e
f

Unresponsive Router Resolution
U K C N
L H A W
S
d
e
f
Sampled network
d
e
fS U
L
C
AW
Resulting network
Traces• d - - L - S - e• d - - A - W - - f• e - S - L - - d• e - S - U - - C - - f• f - - C - - - d• f - - C - - U - S - e

Previous Approaches
• Basic heuristics– IP: Combine anonymous nodes between same known nodes [Bilir 05]
• Limited resolution
– NM: Combine all anonymous neighbors of a known node [Jin 06]• High false positives
U K C N
L H A W
S
xy
z
Sampled network
x
y
zS U
L
C
A W
After resolutionx
y
zS U
L
C
A
After resolution
WH
x
y
zS U
L
C
A
W
Resulting network

40
Previous Approaches
• More theoretic approaches– Graph minimization [Yao 03]
• Combine s as long as they do not violate two accuracy conditions:• (1) Trace preservation condition and (2) distance preservation condition• High complexity O(n5) – n is number of s
– ISOMAP based dimensionality reduction [Jin 06]• Build an nxn distance matrix then use ISOMAP to reduce it to a nx5 matrix
Distance: (1) hop count or (2) link delay• High complexity O(n3) – n is number of nodes
– Semisupervised Spectral Clustering [Shavitt 08]• A node will not be chosen to be an unknown root if it shares two or more neighbors
with an unknown root. • Nodes that share two or more neighbors are usually very close to each other, and it is
difficult to distinguish between them even manually. • After splitting them into unknowns, these nodes will have at least one common
unknown node. – This makes the task of cleanly separating the unknowns impossible

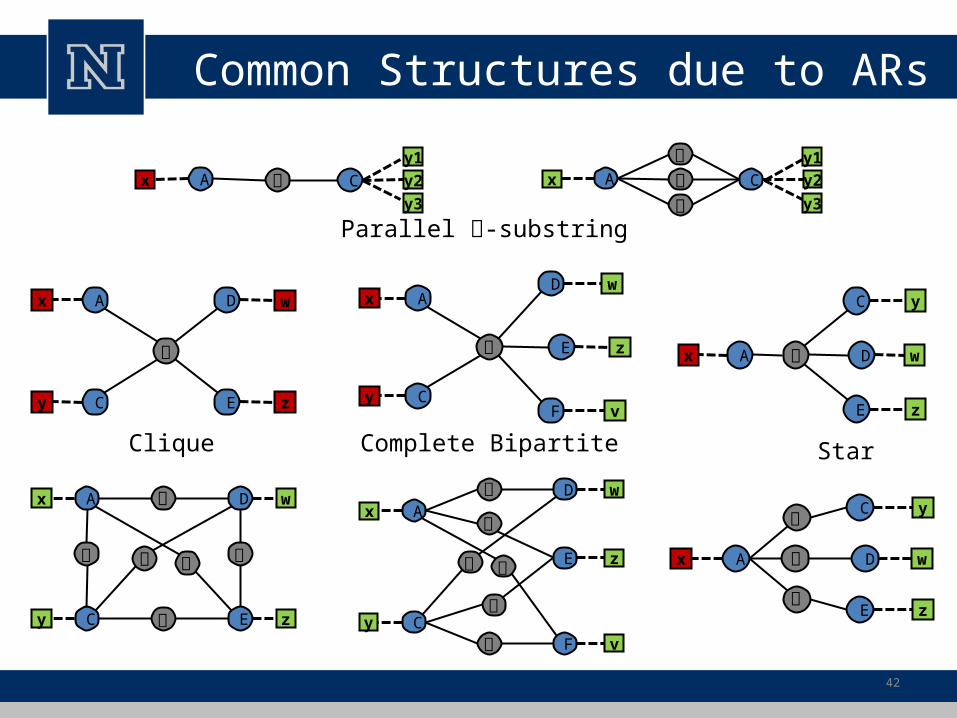
Structural Graph Indexing (SGI)
• Structural Graph Indexing– A graph data mining technique
• Index all pre-defined substructures in a graph data
• Use of SGI for anonymous router resolution– Apply SGI to collected path traces– Merge anonymous routers using identified structures
• Trace Preservation Condition– Don’t merge anonymous routers within the same trace
• Subnet distance as tie-breaker
41
42
Common Structures due to ARs
Ax C y2Ax C y2
Parallel -substring
y1
y3
y1
y3
DA wx
C y
E z
DA wx
C y
E z
Star
A
C
x
y
D w
F v
E z
A
C
x
y
D w
F v
E z
Complete Bipartite
A
C
x
y
D w
E z
A
C
x
y
D w
E z
Clique

Graph Indexing based Resolution
Indexing Phase
parallel
star
bipartite
clique
Resolution Phase
parallel
clique
bipartite
star

IP Alias Resolution
S
L
UC
N
W
A
s.2
l.1
s.3
u.1
l.3
u.3
h.1
k.3
h.2
a.3
u.2k.1 c.4
a.1 a.2
w.3c.3
w.1c.2
n.1n.3
w.2
l.2
K
c.1
k.2
h.3
d
h.4
s.1e f
n.2
HTraces
• d - h.4 - l.3 - s.2 - e• d - h.4 - a.3 - w.3 - n.3 - f• e - s.1 - l.1 - h.1 - d• e - s.1 - u.1 - k.1 - c.1 - n.1 - f• f - n.2 - c.2 - k.2 - h.2 - d• f - n.2 - c.2 - k.2 - u.2 - s.3 - e

IP Alias Resolution
U K C N
L H A W
S
d
e
fSampled network
Sample map without alias resolution
s.3
s.1
s.2
l.3
l.1
u.1
u.2
k.1 c.1 n.1
n.2k.2 c.2
w.3
a.3
h.2
h.4
h.1
e
d
f
n.3
Traces• d - h.4 - l.3 - s.2 - e• d - h.4 - a.3 - w.3 - n.3 - f• e - s.1 - l.1 - h.1 - d• e - s.1 - u.1 - k.1 - c.1 - n.1 - f• f - n.2 - c.2 - k.2 - h.2 - d• f - n.2 - c.2 - k.2 - u.2 - s.3 - e

Previous Approaches
Dest = A
B
Dest = A
Dest = B
A, ID=100
Dest = B
B, ID=99B, ID=103
AB
AB
• Source IP Address Based Method [Pansiot 98]– Relies on a particular implementation of ICMP error generation.
• IP Identification Based Method (ally) [Spring 03]– Relies on a particular implementation of IP identifier field,– Many routers ignore direct probes.
• DNS Based Method [Spring 04]– Relies on similarities in the host name structures
sl-bb21-lon-14-0.sprintlink.net sl-bb21-lon-8-0.sprintlink.net
– Works when a systematic naming is used.
• Record Route Based Method [Sherwood 06]– Depends on router support to IP route record processing

Analytical Alias Resolution
MIT
UTD
18.7.21.1
18.168.0.27
129.110.95.1129.110.5.1
206.223.141.73
192.5.89.89
206.223.141.70
192.5.89.10
198.32.8.34
198.32.8.85198.32.8.66
198.32.8.65
198.32.8.84
198.32.8.33
192.5.89.9
206.223.141.69
192.5.89.90
206.223.141.74
18.168.0.25
no response
18.7.21.84
no response
Aliases 129.110.5.1 - 206.223.141.74206.223.141.73 - 206.223.141.69 206.223.141.70 - 198.32.8.33
…

Analytical & Probe-based Alias Resolution
• There is possibility of– incorrect subnet assumption
• Two /30 subnets assumed as a /29
– incorrect alignment of path traces• IP4 and IP8 are thought of as aliases
• To prevent false positives, some conditions are defined– Trace preservation– Distance preservation (probing component of APAR)– Completeness– Common neighbor
a sample network
a
c d
b
e f
IP1
IP2
IP9
IP3
IP4
IP8
IP7
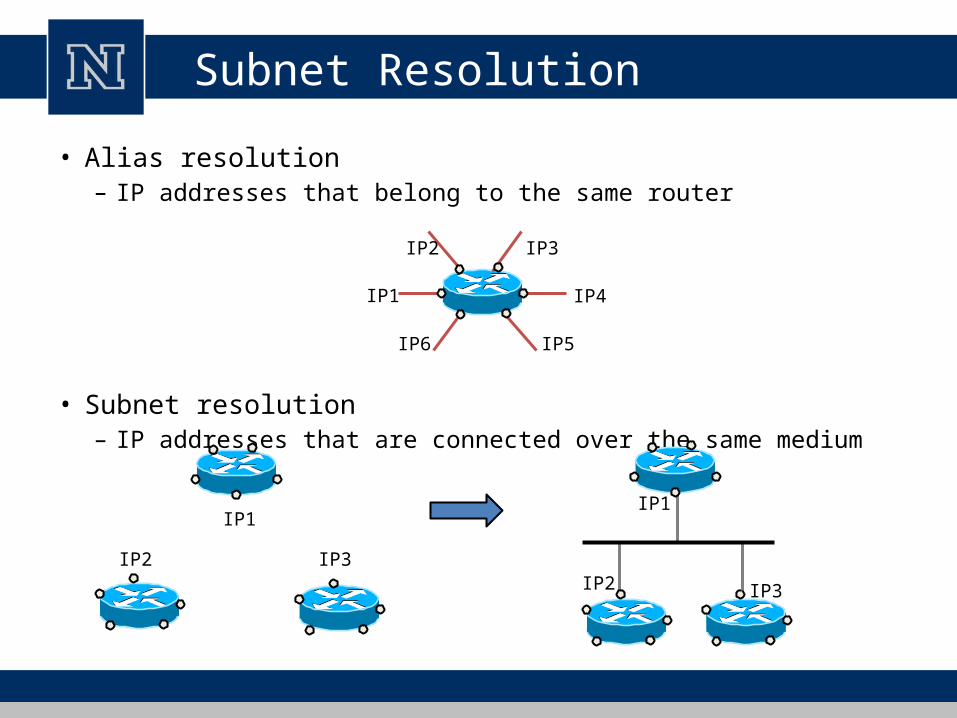
Subnet Resolution
• Alias resolution– IP addresses that belong to the same router
• Subnet resolution– IP addresses that are connected over the same medium
IP2 IP3
IP4IP1
IP6 IP5
IP2 IP3
IP1
IP2 IP3
IP1

Subnet Inference
IP2 IP3
IP1
IP2 IP3
IP1
(observed topology) (inferred topology) (underlying topology)
C D
A B
C D
A B
Subnet resolution• Identify IP addresses that are connected over the same medium
Improve the quality of resulting topology map
C D
A B
C D
A B

Subnet Inference Approach
51
129.110.1.1
129.110.1.2
129.110.2.0
129.110.2.1
129.110.4.1
129.110.4.83
129.110.4.217
129.110.12.1
129.110.12.2
129.110.12.6
129.110.17.1
129.110.17.135
129.110.219.1
V.P.
/30
/31
/24
/24
/24/28
/29
129.110.4.0/24
129.110.6.0/28129.110.17.0/24
129.110.12.0/29
129.110.219.0/24
129.110.1.0/30
129.110.2.0/31
2
3
3
4
2
1
2
4
5
5
4
5
3
129.110.2.0/30
129.110.4.0/24
129.110.12.0/29
129.110.17.0/24
129.110.0.0/16129.110.1.0/31

Subnet Inference Approach
Inferring Subnets• Cluster IP addresses into maximal subnets up to a given size (e.g. /22)• Distance analysis on candidate subnets to break them down as necessary
IP1
IP2
IP3
IP4
IP5
IP6
IP7
IP8
IP9Completeness: Ignore candidate subnets that have less than one quarter of their
IP addresses present after additional probing
/25
/29
/26
/30
/31
/27A /27 subnet can have up to 25 IP addresses./22
52

Inference with Distance Matrix• Obtain distance of each IP from multiple vantage points (VP)
• Only one IP at a subnet might be at a distance ‘hop-1’ per VP
• IPs after per-destination and per-packet load-balancers– Get minimum hop (seen at any Paris Traceroute) of an IP per VP– IP hops after a LB has lower trust
• Two rounds of computations• Compensate for diamond asymmetry if per-destination LB
VP: 1 2 3 4 5 … 672
IP1 0 5 4 0 0 … 7
IP2 0 0 3 5 0 … 7
IP3 2 5 0 4 0 … 6
…
Geolocation
• Given the network address of a target host, what is the host’s geographic location ?
• The answer to this is useful for a wide variety of social, economic and engineering purposes
• The actual location of network infrastructure sheds light on how it relates to population, social organization and economic activity

Geolocation methods
• Name Based Geolocation–Extracting location details from ISPs domain names
• Location Databases
• Delay Based Geolocation –Best Landmark –Constraint-based

Landmark based geolocation
• In best landmark approach, minRTT between each of the identified landmarks is measured and stored.
• Then the same metric is calculated between the node in question and each of the landmarks.
• The landmark with the best matching values of minRTT is the closest to the node

Constraint based geolocation
• The distances of target location from sufficient number of fixed points are calculated and using multilateration– Used in GPS– However, Internet delay is affected by many factors

Network Traffic Measurements

Bandwidth Measurement
• Bandwidth – amount of data the network can transmit per unit time
• Streaming media applications, server selection, overlay networks etc. require ways to measure bandwidth
• Three kinds of bandwidth – – capacity: max throughput a link can sustain– available bandwidth: residual capacity– bulk transfer capacity: rate that a new single long-lived TCP
connection would obtain over a path

Bandwidth Measurement Methods
• These focus on observing how packet delay (especially queuing and transmission) is affected by link properties
Four types:• Packet-pair Methods• Size-delay Methods• Self-induced Congestion• Bulk Transfer Capacity Measurement

Packet-Pair Methods
• Methods to measure capacity and available bandwidth
• Involve sending probe packets with known inter-packet gaps and measuring the same gap downstream
• Capacity is calculated using the eqn:
C = L / max delta,
where C is the capacity, L is the length of probe packets, max delta is the maximum inter-packet gap measured downstream

Packet-Pair Methods
Assumes there is no cross-traffic
Ensure packets queue for service at bottleneck link
Similar approach to measure available bandwidth

Size Delay Methods
• Useful for measuring link capacities on each link along a path
• Based on the observation that transmission delay is affected by link capacity and packet size
• The idea is to send many different sized packets and measure the difference in delays affected by packet size.
• Then the capacity of each link will be a function of these differences
• Method assumes there is no cross-traffic, no queuing delays, no variation in packet size
• Measurements become less accurate if the length of the path grows
Self-induced Congestion
• Find minimum probe rate that creates congestion on the path
• Use packet trains at different rates to observe delay increases
• Assumes cross traffic has fixed rate– yet Internet traffic is bursty
• Probing traffic is large enough to affect cross-traffic– Change the measured quantity

Bulk Transfer Capacity Measurement
• Transfer as much data as possible
• Need to ensure destination does not affect results– buffer capacity
• Cross traffic affects the results– TCP backoff– UDP ???

Caveats in Bandwidth Measurements
• High rate links like OC-192 make it difficult to measure bandwidth accurately because of small delays
• Wireless links affect rate dramatically on fine timescales
• FIFO order is not guaranteed in wireless links
• Layer 2 devices can cause underestimation of a IP hop’s capacity by introducing additional transmission delays– Not all links are point-to-point

Latency Estimation

Network Tomography
• A process of inferring network topology, delays, packet losses etc. using only end-to-end measurements
• One needs to make many assumptions about the behavior of the underlying network

Network Tomography: Multicast based
• Multicast based method e.g. to figure out the loss rates

Internet Measurements are anything but straightforward…
• Internet Measurement is key to designing the next generation communication network
• Fundamental design principles of the current internet make it harder for measuring various aspects of it
• Preliminary research has resulted in a set of basic tools and methods to measure aspects like topology, traffic etc.
• Accuracy of such methods is still an open question
• There is still a lot of ground to cover in this direction and this is where researchers like you come into the equation!