Embed Size (px)
Citation preview
m The Journal of Physical Chemistry, 1995, 99.Copyright © 1995 by the American Chemical Society and reprinted by permission of the copyright owner. 3033
Infrared Spectroscopy of Matrix-Isolated Polycyclic Aromatic Hydrocarbon Cations. 2.
The Members of the Thermodynamically Most Favorable Series through Coronene
D. M. Hudgins t and L. J. Allamandola*
NASA Ames Research Center, MS 245-6, Moffett Field, California 94035
Received: August 30, 1994; In Final Form: November 21, 1994 ®
..
/ V
Gaseous, ionized polycyclic aromatic hydrocarbons (PAHs) are thought to be responsible for a very common
family of interstellar infrared emission bands. Here the near- and mid-infrared spectra of the cations of the
five most thermodynamically favored PAHs up to coronene:phenanthrene, pyrene, benzo[e]pyrene, benzo-
[ghi]perylene, and coronene, are presented to test this hypothesis. For those molecules that have been studied
previously (pyrene, pyrene-dt0, and coronene), band positions and relative intensities are in agreement. In all
of these cases we report additional features. Absolute integrated absorbance values are given for the
phenanthrene, perdeuteriophenanthrene, pyrene, benzo[ghi]perylene, and coronene cations. With the exception
of coronene, the cation bands corresponding to the CC modes are typically 2-5 times more intense than
those of the CH out-of-plane bending vibrations. For the cations, the CC stretching and CH in-plane bending
modes give rise to bands that are an order of magnitude stronger than those of the neutral species, and the
CH out-of-plane bends produce bands that are 5-20 times weaker than those of the neutral species. This
behavior is similar to that found in most other PAH cations studied to date. The astronomical implications
of these PAH cation spectra are also discussed.
I. Introduction
Polycyclic aromatic hydrocarbons (PAHs) form an importantclass of organic molecules, having long been known to play
prominent roles as environmental toxins,t and in soot formation. 2
During the past decade, evidence has been mounting that they
are important components of the interstellar medium as well)
Under the harsh conditions of many interstellar environments,
PAHs are expected to be predominandy ionized. For this reason
we have undertaken a study of the infrared spectroscopic
properties of matrix-isolated PAH cations. While the primary
goal of this research is to investigate the role of PAHs in the
interstellar medium, the results are of general interest. PAIlcations are considered to be important intermediates in combus-
tion, 2 and PAH intermediates and primary reaction products are
directly related to the carcinogenicity of some members of this
hydrocarbon family. I
Ionized 4 and neutral s PAH molecules have been proposed as
the carriers of a very common family of interstellar infrared
fluorescence bands at 3050, 1615, 1310, 1150, and 885 cm -1
(3.3, 6.2, 7.7, 8.7, and 11.3/tin). The ubiquity of this spectrum
suggests that free molecular PAl-Is are common throughout
interstellar space, and the intensity of the bands indicates that
they are as abundant as the most abundant polyatomic interstellar
molecules known. As much as 30--40% of the radiant energy
from some of these sources is emitted in this family of bands.
Reviews of this field can be found in ref 3.
While the interstellar PAIl hypothesis rests on the general
resemblance of the interstellar emission spectra to the absorption
spectra of aromatic hy_ons, the available data are mainly
for neutral PAHs suspended in salt pellets 6 or organic solvents. 7
Under such conditions, interactions with the surrounding
medium and with other PAH molecules (clusters) strongly
perturb the transitions, s While this body of information has
* Author to whom correspondence should be addressed.*Current address: Department of Chemistry, Adrian College, Adrian,
MI 49221.®Abstract published in Advance ACS Abstracts, February 1, 1995.
0022-3654/95/2099-3033509.00/0
been invaluable in establishing the interstellar PAIl hypothesis,
there are important differences in details between the laboratory
and interstellar spectra. Differences in band position and relative
band intensifies, as well as the fact that most interstellar PAl-Is
are expected to be isolated and ionized in the regions where
they emit, have hindered the verification of the hypothesis and
the exploitation of PAils as probes of the interstellar medium.
Thus, the infrared spectra of neutral, isolated PAl-Is and of
ionized, isolated PAHs are of fundamental importance to further
progress in this field.
There has been substantial progress recently in experimentally
measuring the emission spectra of vibrationally excited, gas
phase aromatic molecules. Elegant UV-pumped IR emission
experiments on gas phase neutral PAHs have been carried
out. 9-_3 The results of these experiments, in conjunction with
absorption studies of PAHs in the gaseous state at various
temperatures, t*-ls show that (i) the emission peak frequency
of the aromatic CH stretch in gas phase PAHs shifts as a
function of internal energy content and matches that of the
interstellar band at 3050 cm-t at reasonable levels of excitation;
(ii) the bandwidth increases with energy and matches that of
the interstellar band at similarly appropriate internal energies;
and (iii) the plateau that underlies the interstellar feature, and
extends out to about 2740 cm -_, is reproduced as well.
Schlemmer et al.,12 in reporting the gas phase emission from
naphthalene and pyrene, show that the relative intensities of
the emission bands differ in absorption from those for the same
species and from the relative intensities of the interstellar
emission features. Thus, they conclude that small neutral PAilscannot be the carriers of the interstellar bands. This is, of course,
consistent with PAHs being ionized in the emission zones. These
emission experiments on neutral PAl-Is are inherently very
difficult, and it will likely be some time before this type of
measurement will be carried out on ionized PAHs. These results
raise important, fundamental questions regarding the molecular
physics of the infrared emission process from vibrationallyexcited molecules.
© 1995 American Chemical Society
https://ntrs.nasa.gov/search.jsp?R=19970001824 2018-05-01T18:21:41+00:00Z

3034J. Phys. Chem., Vol. 99, No. 10, 1995
Naphthalene Phenanthrene Pyrene
Coronene Benzo[ghi]perylene Benzo(e)pyrene
Figure 1. First six members of the most thermodynamically favorable,high-temperature PAIl polymerization route, adapted from Stein. e°Successive members of this series are formed by adding two or fourcarbon atoms at a time, the number required to complete an additionalfused aromatic ring. Note that the C2 and C_H2 groups needed to gofrom one species to the next refer only to the number and type of atoms
added in each step and do not refer to specific chemical species ormechanisms. Similarly, the circles here indicate planarity and overallelectron delocalization, not superaromaticity.
There is also a need for reliable, quantitative infrared
absorption data on neutral and ionized PAils at the low
temperatttres characteristic of the interstellar medium. We have
initiated a systematic program to obtain this information. In
the first paper in this series, we reported our experimental
approach to the problem and presented results from 4000 to
200 cm -I on the smallest PAH, naphthalene (Cl0Hs), and its
fully deuterated analog, (C10Ds). 19 We now have the infrared
spectra for a number of neutral PAHs and their cations. Here
the spectroscopic properties of the members of the thermody-
namically most favored PAIl species containing between 6 and
24 carbon atoms are presented. Stein and co-workers 2° have
extensively investigated the thermodynamic properties of aro-
matic species, showing that, of the hundreds of PAH isomers
possible in this size range, those in Figure 1 are thermodynarni-
cally most favored under high-temperature PAH growth condi-
tions. Thus, these are likely to be important in the circumstellar
environments in which PAHs are produced and able to survivethe harsh conditions of many of the interstellar emission regions.
In subsequent papers in this series, different aspects of PAIl
cation structure, including tetracyclic PAHs, polyacenes, and
PAils incorporating 5-membered rings, will be explored. The
neutral spectra of these PAHs will be presented elsewhere. 2t'z2Our motivation is to understand how structure and size influence
the infrared spectra of small PAl-Is in their neutral and cationicforms.
Efforts to provide this type of information are also underway
at several other institutions. Defrees and Miller carried out
theoretical calculations on the expected inflated spectral proper-
ties of the naphthalene and anthracene cations and predicted
surprising relative band strength differences between the neutral
and ionized forms of these PAHs. TM Subsequently, Defr_s etal.13b and Pauzat et al._ have greatly expanded this work.
Professor Vala and co-workers at the University of Florida have
published the infrared spectroscopic properties for cations of
the PAils naphthalene, anthracene, pyrene, perylene, and
coronene, _-28 and d'Hendecourt et al. have reported the
spectrum of the coronene cation. 29
This paper is laid out as follows. The experimental tech-
niques are summarized in section H. In section FH are presented
the near- and mid-infrared spectra of the phenanthrene, phenan-
threne-dt0, pyrene, pyrene-dl0, benzo[e]pyrene, benzo[ghi]-
perylene, and coronene cations. These results are discussed in
PAH Sample
It2" SS Cajon
Fitting
112" PyrexTest Tnbe
Hudgins and AUamandola
To Variac
Heating Wire
Argon DepositionLine
Infrared
Beam Axis
Csl VacuumWindows
/Lamp
Mount
M_z or CaF2Window
Out To
RonghingPump
GnsInlet
Figure 2. Schematic cross section of the matrix isolation samplechamber.
section IV, where trends and implications regarding the
interstellar question are pointed out.
H. Experimental Section
The matrix isolation technique is employed to isolate
individualpolycyclicaromatic hydrocarbon (PAH) moleculesin an argon matrix, where they are photoionized and probed
spectroscopically. Argon matrices are known to be suitable for
vibrational studies, typically causing small shifts in the 0-15
cm -t range. For electronic transitions, a neon matrix is required
to avoid serious perturbations. With the exception of the sample
deposition procedure, our experimental procedure has been
described in detail previously. 19 A schematic cross section of
the sample chamber is shown in Figure 2. Briefly, an infrared-
transmitting substrate (CsI) is suspended inside an ultra-high
vacuum chamber and cooled by a closed-cycle helium refrigera-
tor. The ultra-high vacuum chamber (p -,_ 10 -s mTorr) is
equipped with multiple inlet ports, and the cooler is mounted
in such a way that the infrared window can be rotated to face
any of these ports without breaking the vacuum. Typically,
the CsI window was cooled to 10 K and positioned to face the
sample deposition inlets. Samples were prepared by co-
deposition of a gaseous PAH with a large overabundance of
argon to a thickness appropriate for generation of the cation
and measurement of its infrared spectrum. After sample
deposition was complete, the cold head was rotated to face the
beam of an infrared spectrometer so that a prephotolysis
spectrum could be recorded. The sample was then rotated to
face a vacuum ultraviolet lamp for photolysis. The sample was
finally returned to the scanning position where the postphotolysis
spectrum was recorded. Comparison of this spectrum with the
neutral spectrum permitted identification of the ion features that
appeared upon photolysis.
A. Sample Preparation. PAl-Is containing three or more
rings do not have sufficient vapor pressure at room temperature
to permit their preparation as a gaseous mixture with argon, as
InfraredSpectroscopyof PAH Cations
was the case in our previous study involving naphthalene. This
necessitated the vaporization of the PAH of interest and
subsequent co-deposition of the gaseous PAH molecules with
excess argon. To this end, PAH samples were placed in
resistively heated Pyrex tubes (1/2 in. diameter) and mounted
on the sample chamber through a stainless steel Cajon Ultra-
tort fitting. The temperature of the PAH was monitored using
a chromel/alumel thermocouple mounted on the exterior of the
tube with aluminum tape. Such an arrangement should poten-
tially be useful at temperatures as high as 316 °C (the failure
temperature of the Viton O-ring) and with samples as small as
a few milligrams. Argon was admitted through a second port
at a position 45 ° from the first in such a way that the two streams
coalesced before the surface of the cold window. The deposition
tubes ended between 2 and 4 cm from the cold window. During
deposition, this window was maintained at a position intermedi-
ate between the two deposition ports (Figure 2). The argon
deposition line was liquid nitrogen trapped to minimize con-tamination.
Sample quality was found to be optimal for PAH vapor
pressures in the range 10-30 reTort. Higher vapor pressures
required higher argon deposition rates that exceeded the thermal
conductivity of the CsI window, warming the matrix. The
annealing that resulted produced a matrix that was highly
scattering at short wavelengths, crippling the Lyman-a photo-
ionization efficiency and the signal-to-noise ratio of the near-
IR spectrum. Conversely, lower vapor pressures required longer
deposition times, which necessarily increased the contaminants
in the matrix and, in turn, reduced the ionization efficiency.
Thermochemical data 3° were used to establish the approximate
temperature necessary for each PAH investigated. Optimum
tube temperatures were as follows: phenanthrene, 10 °C, pyrene,
60 °C; benzo[e]pyrene, 97 °C; benzo[ghz_]perylene, 137 °C; and
coronene, 158 °C. The optimal argon flow rate was estimated
to be between 0.5 and 1.0 mmol/h.
As was the case in our earlier study of the naphthalene
cation, 19 photoionization of PAH/Ar matrices was accomplished
using the Lyman-o_ emission from a microwave-powered
discharge lamp optimized by the use of a 10% H2 in He gas
mixture at _75 mTorr. A MgF2 vacuum window allowed
transmission of this radiation to the sample. For those experi-
ments incorporating the electron acceptor CCh in the matrix,
lower energy photolysis was necessary. Lyman-0_ photons
(10.35 eV) are sufficiently energetic to ionize matrix-isolated
CCh (IEsas = 11.28 eV) 31 molecules, negating their usefulness
as electron acceptors. For those experiments, UV radiation was
generated by a discharge in pure H2 gas at _150 mTorr. This
optimized the broad molecular hydrogen emission band centered
around 160 nm (7.77 eV) with respect to the Lyman-ct line. A
CaF2 vacuum window (cutoff2 _ 150 rim) served as a filter to
exclude the residual Lyman-ct radiation.
This technique results in ion yields ranging from 5 to 10%.
Specifically, the yields for the spectra presented here were as
follows: phenanthrene, 9 + 4%; phenanthrene-dl0, 7 + 4%;
pyrene, 10 + 5%; benzo[e]pyrene, 6 + 3%; benzo[ghi]perylene,10 :k 5%; and coronene, 11 + 6%. These yields were
determined as previously described, t9
Pure argon samples having pressures in the range 75-225
Tort were prepared as described previously} 9
The PAHs used in this investigation include phenanthrene
(Aldrich Chemical Co., 98+% purity), phenanthrene-dl0 (Al-
drich, 97% purity), pyrene (Aldrich, 99% purity), pyrene-dl0
(Cambridge Isotope Laboratories, 98% purity), benzo[e]pyrene
(Aldrich, 99% purity), benzo[gh0perylene (Aldrich, 98% purity),
and coronene (Pfaltz and Bauer, Inc., 97% purity). All samples
J. Phys. Chem., Vol. 99, No. 10, 1995 3035
"a° i r r , • r , i r , , r , .b
Z
1455 ' 1435 ' 1415 1395 13'75' ' '1355
Fn_lt_m_ey (car x)
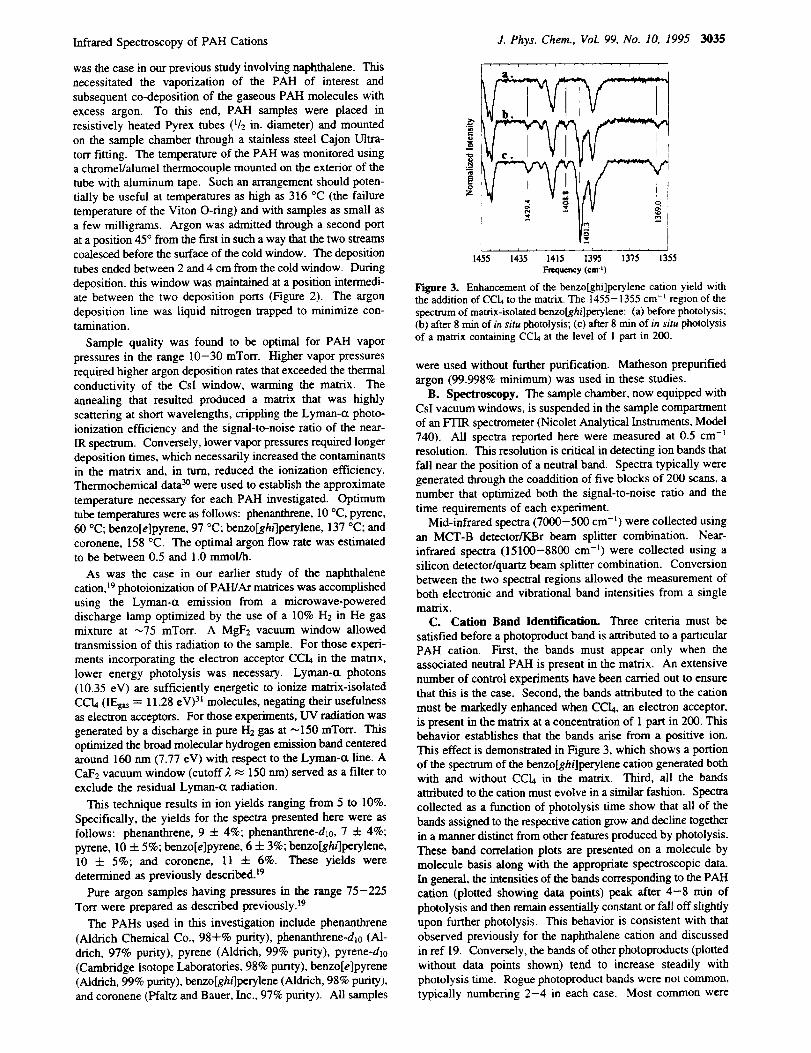
Figure 3. Enhancement of the benzo[ghi]perylene cation yield withthe addition of CCh to the matrix. The 1455-1355 cm-t region of the
spectrum of matrix-isolated benzo[ghi]perylene: (a) before photolysis;(b) after 8 rain of in situ photolysis; (c) after 8 min of in situ photolysisof a matrix containing CCh at the level of 1 part in 200.
were used without further purification. Matheson prepurified
argon (99.998% minimum) was used in these studies.
B. Spectroscopy. The sample chamber, now equipped with
CsI vacuum windows, is suspended in the sample compartment
of an FTIR spectrometer (Nicolet Analytical Instruments, Model
740). All spectra reported here were measured at 0.5 cm -I
resolution. This resolution is critical in detecting ion bands that
fall near the position of a neutral band. Spectra typically were
generated through the coaddition of five blocks of 200 scans, a
number that optimized both the signal-to-noise ratio and the
time requirements of each experiment.
Mid-infrared spectra (7000-500 cm -l) were collected using
an MCT-B detector/KBr beam splitter combination. Near-
infrared spectra (15100-8800 cm -t) were collected using a
silicon detector/quartz beam splitter combination. Conversion
between the two spectral regions allowed the measurement of
both electronic and vibrational band intensities from a single
matrix.
C. Cation Band Identification. Three criteria must be
satisfied before a photoproduct band is attributed to a particular
PAH cation. First, the bands must appear only when the
associated neutral PAH is present in the matrix. An extensive
number of control experiments have been carried out to ensure
that this is the case. Second, the bands attributed to the cation
must be markedly enhanced when CCh, an electron acceptor,
is present in the matrix at a concentration of I part in 200. This
behavior establishes that the bands arise from a positive ion.
This effect is demonstrated in Figure 3, which shows a portion
of the spectrum of the benzo[ghflperylene cation generated both
with and without CCh in the matrix. Third, all the bands
attributed to the cation must evolve in a similar fashion. Spectra
collected as a function of photolysis time show that all of the
bands assigned to the respective cation grow and decline together
in a manner distinct from other features produced by photolysis.
These band correlation plots are presented on a molecule by
molecule basis along with the appropriate spectroscopic data.
In general, the intensifies of the bands corresponding to the PAH
cation (plotted showing data points) peak after 4-8 rain of
photolysis and then remain essentially constant or fall off slightly
upon further photolysis. This behavior is consistent with that
observed previously for the naphthalene cation and discussed
in ref 19. Conversely, the bands of other photoproducts (plotted
without data points shown) tend to increase steadily with
photolysis time. Rogue photoproduct bands were not common,
typically numbering 2-4 in each case. Most common were
3036 J. Phys. Chem., Vol. 99, No. 10, 1995 Hudgins and Allamandola
TABLE 1: Infrared Freqnendes and Relative Intensities for the Cations of the Most Thermodynamically Favorable PAlls
naphthalene phenanthrene pyrene benzo[e]pyrene benzo[gh/]perylene coronene
v (cm -I ) l_l v (cm -l) l=l v (cm -I ) l=l v (cm -l ) l=l v (cm -i ) l_l v (cm -I ) I_1
758.7 0.27 582.0 0.220 690.1 0.228 685.7 0.150 639.6 0.218 874.5 1.001023.2 0.054 694.5 0.0944 861.0 0.270 848.0 0.218 863.6 0.445 1378.6 0.174
1214.9 0.2 756.2 0.0731 867.0 0.0353 873.3 0.131 1216.7 0.0317 1579.0 0.8251218.0 1.0 836.0 0.0557 953.8 0.0665 1193.9 0.214 1223.4 0.2951400.9 0.044 1258.7 0.0414 976.5 0.0904 1264.3 0.138 1311.9 0.1341518.8 0.1 1264.7 0.0142 1102.0' 0.0793 1308.2 0.186 1324.4 0.7371525.7 0.29 1267.0 0.142 1188.7 0.0364 1336.0 0.806 1331.9 0.168
1277.5/1282.5 0.836 1216.0 0.121 1349.2 1.00 1343.2 0.3211299.0 0.0884 1245.1 0.343 1357.0 0.154 1350.2 0.1431513.0 0.0424 1253.7/1255.7 0.0425 1368.2 0.129 1369.0 0.6251551.0 0.0625 1356.111358.4 1.00 1410.5 0.407 1401.3 0.833 _1558.2 0.0211 1361.8 0.158 1435.6 0.0957 1408.8 0.0472
1565 complex 1.00 1421.1 0.158 1467.0 0.0969 1429.4 0.09701440.3 0.101 1556.8 0.878 1538.6 0.01851550.911553.4/1556.0 0.891 1550.1 0.220
1578.2 1.00
° Due to its low intensity and separation from other features, this band is not shown in Figure 8.
TABLE 2: Comparison of the Infrared Frequencies and Relative Intensifies for Isotopomeric Forms of theNaphthalene, Phenanthrene, and Pyrene
Cations of
naphthalene phenanthrene pyrene
Cl0I-h+ CtoD, + Cld-It0 + C,d),0 + Cld-It0 + C16D10+
v (cm -j) l_t v (cm -I) l_z v (cm -I) l_l v (cm -t) IN v (cm -t) l,_l v (era -a 1,_
758.7 0.27 1063.1 0.161023.2 0.054 1075.4 1.01214.9 0.2 1077.3 0.0681218.0 1.0 1373.8 0.14
1400.9 0.044 1379.4 0.101518.8 0.1 1463.8 0.421525.7 0.29 1466.2 0.28
582.0 0.220 566.7 0.101 690.1 0.228 952.5 0.0385694.5 0.0944 856.2 0.187 861.0 0.270 961.9 0.0783756.2 0.0731 958.5 0.0183 867.0 0.0353 1288.0 0.720836.0 0.0557 1013.4" 0.0214 953.8 0.0665 1317.8 0.0882
1258.7 0.0414 1114.8 0.0274 976.5 0.0904 1362.2 1.00
1264.7 0.0142 1176.6 0.0161 1102.IY 0.0793 1366.4 0.009071267.0 0.142 1194.1 0.0309 1188.7 0.0364 1391.5 0.463
1277.5/1282.5 0.836 1201.6 0.349 1216.0 0.121 1511.8 0.8891299.0 0.0884 1207.2 0.116 1245.1 0.343 1517.0 0.174
1513.0 0.0424 1213.5 0.0186 1253.7/1255.7 0.0425 1521.1 0.08241551.0 0.0625 1221.5 0.0530 1356.1/1358.4 1.00 1540.1 0.05321558.2 0.0211 1230.4 0.0721 1361.8 0.1581565.0 1.00 1296.5 0.0336 1421.1 0.158
1344.2 0.0234 1440.3 0.1011400.3 0.0309 1550.9/1553.4/1556.0 0.8911459.5 0.1891507.0 0.1051525.0/1528.0 1.001547.4 0.0485
° Due to its low intensity and separation from other features, the Ci4I)10+ band at 1013.4 crn -t is not shown in Figure 6. b Due to its tow intensity
and separation from other features, the Clc,l-lto+ band at 1102.0 cm -t is not shown in Figure 8.
the 904 cm -1 (HAr2 +) and 1589 cm -1 bands. These appeared
moderately strong in a number of experiments. Other weak
photoproduct bands at 1388 and 1104 cm -1 (HO2 +) and at 1039
cm -1 (03) appeared in several experiments, as did bands
attributable to CO2 and possibly CO.
HI. Results
There are many PAHs that one can study. Those studied atthe NASA Ames Research Center have been selected for the
following reasons. First, as little is known about the infrared
properties of PAH cations, the smallest members of the PAH
family were chosen to minimize the number of fundamental
vibrations and spectral complexity. Second, as this work is
motivated by the astrophysical question, the PAHs most likely
to be important in this context were given first preference. Thus,
the thermodynamically most favorable members of the high-
temperature PAH formation route containing 6-24 carbon atoms
were studied (Figure 1). 19 These spectra axe presented here in
the second paper of the series. Third, as the effects of structure
and size on the infrared spectra of simple PAH cations are not
known, related PAHs with limited, well-defined structural
differences have been studied together. Finally, as size in-
creases, PAH samples tend to become increasingly refractory
and increasingly difficult and expensive to obtain. Thus, in the
interest of experimental practicality, smaller PAHs were the
logical starting point. Small PAHs are also relevant from the
astrophysical point of view. Indeed, a QRRKM analysis of the
interstellar spectra indicates that molecules containing 20-30carbon atoms dominate the fluorescence at the shortest
wavelengths. 3a-4
The positions and relative intensities of the mid-infrared
cation bands for the thermodynamically most favorable series
of PAHs up to coronene are shown in Table 1. In addition, the
spectra of the perdeuterated phenanthrene (C14D10 +) and pyrene
(CltDl0 +) cations have also been measured. Band positions and
relative intensities are compared with those of the fully
hydrogenated cations and with those of naphthalene (C1oHs +
and Cl0Ds +) in Table 2. The infrared spectra of the cations of
the thermodynamically most favorable series of PAils are
presented in the order of increasing molecular size. Only those
regions of the spectrum where cation bands appear are shown.
The complete spectra of the neutral isolated PAHs will be given

InfraredSpectroscopyof PAH Cations J. Phys. Chem., Vol. 99, No. 10, 1995 3037
Phenanthrene Cation Spec_ m Evolution of Phenanthreue Photoproducts
....:O.OI J
." " °O " " " .¢1_ . ° . . . . . "O
.r _.. _ ----_
1
.... , .... , .... , ,, I 0 5 10 15 20 25 30 35
g$0 g00 750 700 650 600 580 560 Photolysl¢ Time (rain)Feeq_mey (cnrz) Frequency (cnO)
1565 cm "l
_1._ 1283 cm "!
- "¢'" " 582 cra "1
1267 cm "1
--_ 695 cm "1
- -I- - 1299 cm "1
"--'¢"-- 756 cm "_
--a-- 1551 cm "l
. -0- - g36cm-I
+ 1259 cm -I
--_-- t558 cm-_
" "&" " 1265 cm "t
Figure 4. Mid-infrared spectra of the phenanthrene cation isolated inan argon mat_ at 10 K: (a) before photolysis; Co) after 8 rain of in
situ photolysis. The cation bands are labeled with their positions.
later. El The spectrum of the naphthalene cation, the first
multiring aromatic of the series, has been presented else-
where.lg.25 Additional discussions of the pyrene and coronene
cations can be found elsewhere. 27.29
A. Mid-Infrared Spectroscopy. Screening by the CH
stretching bands due to the much more abundant neutral
molecules prevents detection of any of the PAH cation bandsin the 3200-2900 cm -I region. The difficulty inherent in
detecting the infrared active CH stretching modes of the PAHcations studied to date is consistent with theoretical calculations
that have predicted that the CH stretching bands of the cation
are suppressed relative to the analogous bands of the neutral
counteipar_s. 23a.b-24
The Phenanthrene Cation, C _I jo+. The mid-infrared spec-
trum of the phenanthrene cation is shown in Figure 4. The band
frequencies and relative intensities are listed in Table 1. The
evolution of the bands assigned to the cation with Lyman-ct
photolysis is plotted in Figure 5. This band correlation, one ofthe criteria of ion assignment, is looser for the weaker bands
whose signal-to-noise ratios lie in the 2-3 range. Nonetheless,
their overall behavior of a sharp rise and leveling off warrants
their assignment to the cation.
Only weak new bands appear in the normally very strong
CH out-of-plane bending region between about 900 and 600cm -1. Most of the detectable new bands fall between 1570 and
1250 cm -] and, thus, are assigned principally to the CC
stretching and CH in-plane bending modes of the phenanthrenecation. There undoubtedly are other cation bands that are
screened by neutral features. Due to unavoidable confusion
from HEO contamination in the matrix, it is difficult to establish
the presence or absence of ion peaks in the 1600 cm -1 region
from this data.
The cation frequency spectrum, with bands between 1570
and 580 cm -1, resembles that of the neuu, al species in that the
spectrum of neutral phenanthrene is richest between 1600 and700 cm -]. However, the intensity pattern is remarkably
different, a characteristic of all PAH cations studied to date.
While neutral phenanthrene has moderate to strong bands
between 1600 and 850 cm -l and two very strong bands at about
813 and 735 cm -l (out-of-plane CH bends), the cation band
Figure 5. Growth of phenanthrene integrated photoproduct band areasas a function of photolysis time.
intensity pattern is just the opposite, with the bands in the CC
stretching and CH in-plane bending region being stronger than
those in the CH out-of-plane bending region. Interestingly, the
strongest cation bands fall at 1565 and 1277 cm -1, frequencies
within the envelopes of the strongest interstellar emissionfeatures.
Two cation bands are discernible in the normal CH out-of-
plane bending region between 900 and 680 crn -[, namely, those
at 836.0 and 756.2 cm -1. They fall close to the regions expected
for two and four adjacent hydrogen atoms per aromatic ring,
respectively, the types of peripheral H atoms on phenanthrene.
Note that both bands (836.0 and 756.2 cm -1) are shifted to
higher frequencies by 15-20 cm -l from the very intense bands
corresponding to the CH out-of-plane bending vibrations in the
neutral molecule (813 and 735 cm-1). Furthermore, one can
estimate the intensity of these features relative to those of the
neutral molecule. Let n o be the number of neutral molecules
in the (prephotolysis) sample, n + is the number of ions
produced by photolysis. The ionization fraction, I (=n+/n°),
has been measured directly as 0.09 4- 0.04 (9 4- 4%) by the
fractional decrease in the neutral band areas with photolysis
for this experiment. The integrated intensities (fr dv -- a) of
the bands from the CH out-of-plane bending modes of the n o
neutral phenanthrene molecules are (ast3) ° = 0.165 cm -I and
(a_35) ° = 0.249 cm-L If the absorption strengths of the CH
out-of-plane bends in the ion were the same as those of the
neutral molecule, we would expect to see the growth of ion
bands with integrated intensities 9 :t: 4% those of the prepho-
tolysis neutral bands or (as36) + = (0.09)(0.1647) = 1.5 x 10 -2
cm -t and (a756) + = (0.09)(0.2493) = 2.2 x 10 -2 cm -l. In
reality, the intensities of the 836 and 756 cm -1 ion bands are
measured to be (as36) + = 1.123 x 10 -3 cm -l and (a756) + =
1.406 x 10 -3 cm -l, respectively, or 13x and 16x weaker, on
average, than those in the neutral molecule. This is in general
agreement with our previous results for the naphthalenemolecule, where the CH out-of-plane mode was found to be
suppressed by a factor of 18 in the cation.
The two bands at 694.5 and 582 cm -t probably arise from
CCC plane bending motions.
The Perdeuterated Phenanthrene Cation, C14D;o +. The mid-
infrared spectrum of the fully deuterated phenanthrene cation
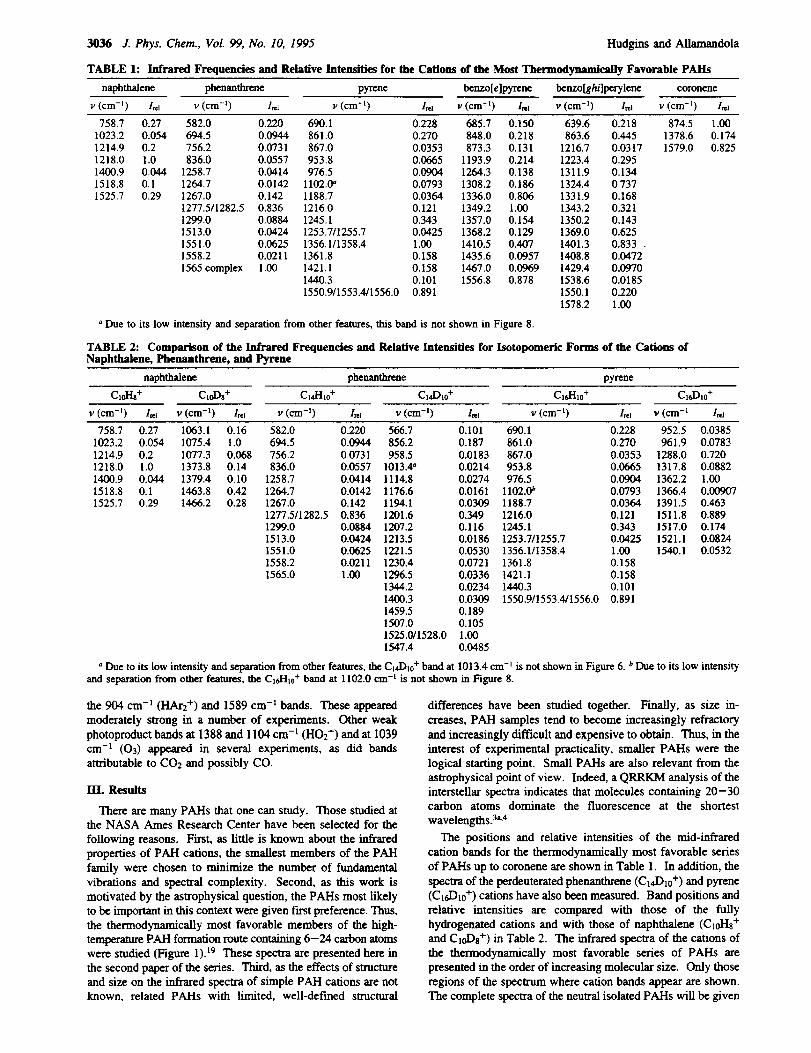
3038 J. Phys. Chem., VoL 99, No. 10, 1995 Hudgins and Allamandola
The Spectrum of the dt j-Phenanthrene Cation
J
1550 1J00 1(50 1400 1350
sa°
b 1
_0.5%
I
= _ --_o
1300 1250 1200 1150 11(30
0.5%
1 .... i ........... i ..........
_(_o) FveoD_cy(cm'b
Figure 6. Mid-infrared bands of the pcrdcuterated phcnanthrene cahonisolated in an argon matrix at 1O K: (a) before photolysis; (b) after 8rain of in situ photolysis. The cation bands are labeled with their
positions. Due to its low intensity and separation from other features,the cation band at 1013.4 cm -1 is not shown.
is shown in Figure 6. The evolution of the bands assigned to
the cation with Lyman-ct photolysis is plotted in Figure 7. These
bands, together with the corresponding hydrogenated ion bands,are listed in Table 2.
Comparisons between the spectra of the hydrogenated and
deuterated PAHs have been used to shed light on the nature of
a particular band. tg.27,3L33 For phenanthrene, however, without
the benefit of calculations that take molecular symmetry into
account, this technique alone is of rather limited use. The 1565,
1558.2, 1551, and 1513 em -_ bands all fall in the CC stretching
region, with a vcca/vcc ° ratio of 1.01-1.03 to their presumed
deuterated counterparts at 1547.4, 1528/1525, 1507, and 1459.5
cm-t. This assignment to CC stretching modes does not requiredeuteration.
While the positions of the bands in the 1300-1260 cm -_
region of perhydropbenathrene are suggestive of CC stretching
vibrations, it is conceivable that they might have some CH in-
plane bend character as well. Simply taking the bands between
1300 and 1250 cm -t and comparing them to the frequencies of
the perdeuterated molecule between 1296.5 and 1201 cm -1, one
obtains va/v D ratios in the 1-1.05 range, again consistent with
modes that are primarily CC stretching in nature. The difficulty
here is that bands also appear upon deuteration between 1194.1
and 856.2 cm -1, suggesting that there are active modes in the
hydrogenated species corresponding to CH in-plane bends. By
Evolutio• of dl0-Phenanthrene Photoproducts• , , r , , ' ' I '
_ 15_iI15"2g ¢m "I
--O-- 12ff2 cm -I
: _ - 856 cm "1
i -.-a--- 1460 m -t
---0--- 1207 cm "]
_,1,-- 1507 eta "10.01
.--..-.:.-.=.:
- 1230 cm "1
"--'_" " 1222 cm "1
""-1--- 1547 cm "t
1400 cm "1
--t-- 1194 cm "1
---&-- - 1297 em "l
---'0" - I115 ¢m "1
- ]3_ em "1
---.I---- 1013 ¢m "1
--&-- 959om "1
--"O- "" 1214 era "|
----41- - 1177 cm "1
0.001 t_ °'° "........ .-4""
0 4 8 12 16
Fno_olysis T_me (rain)
Figure 7. Growth of per_uterated phenanthrene integrated photo-product band areas as a function of photolysis time.
assuming a I_H/v D ratio of 1.15, this would predict CH in-plane
bands between about 1370 and 980 em -t, encompassing the
bands between 1300 and 1250 cm -l. As the spectrum of neutral
phenanthrene has several absorptions in this region, it is
plausible that the corresponding cation bands are screened. It
has also been demonstrated that surprisingly large changes in
intensity in a given vibrational mode can result from deutera-
tion. ]9,27.32.33 Thus, it may also be that the features observed in
this region for the perdeuterated cation are too weak to be visible
in the fully hydrogenated cation. It is clear that deuterationalone is not sufficient to make band assignments in the largerPAH molecules.
The Pyrene Cation, C161-Ito+. The mid-infrared absorption
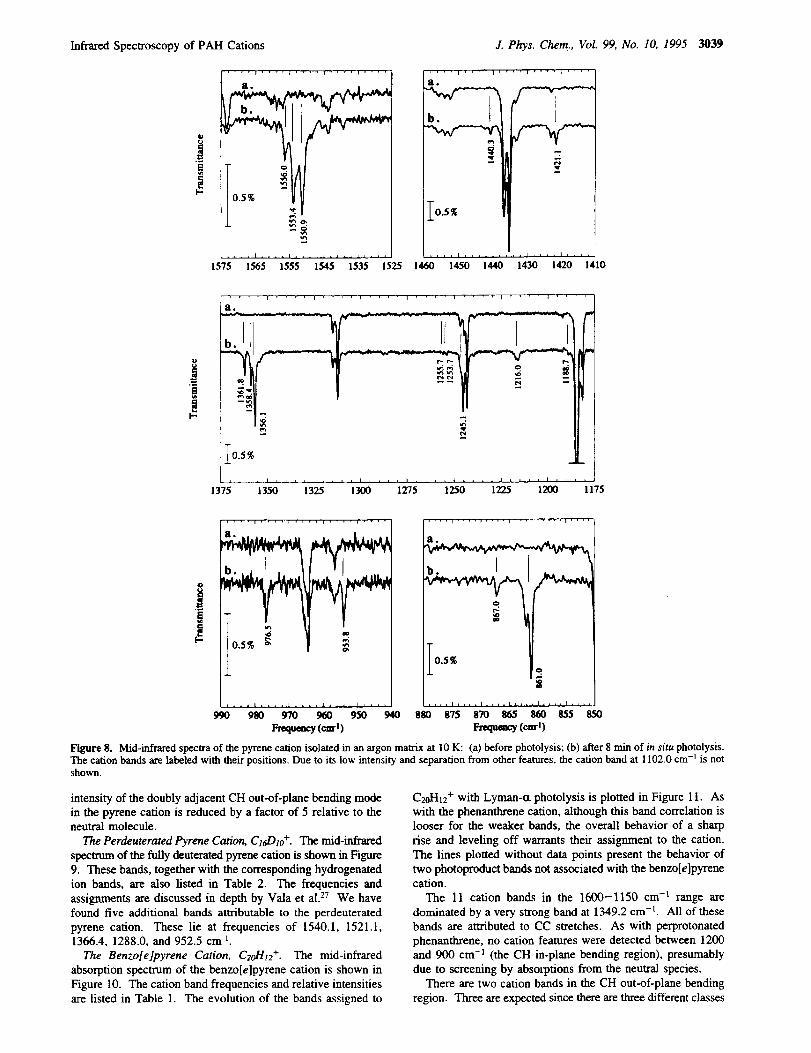
bands of the pyrene cation are shown in Figure 8. The cation
band frequencies and relative intensities are listed in Table 1.
These compare favorably with those reported by Vala et al. for
this species. 27 We have also observed seven additional bands
attributable to the pyrene cation. These bands lie at frequencies
of 1556.0, 1356.1, 1255.7, 1253.7, 1188.7, 953.8, and 867.0
cm -l. The bands at 1255.7/1253.7, 1188.7, 953.8, and 867.0
cm -L are weaker than those previously reported, while the bands
at 1556.0, and 1356.1 cm -1 overlap with previously reported
bands and may arise through site effects.
The mid-infrared spectrum is characterized by moderate to
strong bands that are rather evenly distributed between 1600and 600 cm-L Of the twelve bands between 1600 and 1200
cm -1, the CC stretching region, three are very strong. We have
detected two bands in the CH in-plane bend region, at 1102
and 976 cm -l.
The 861 cm -I frequency of the detected out-of-plane CH bend
is interesting. Pyrene has two rings with three adjacent H atomsand two rings with two adjacent H atoms. The 861 cm -_ band
falls at the high limit of the normal range expected for two
adjacent H atoms. As the 690 cm -1 band falls nearly 60 cm -_
below the range for neutral PAHs with three adjacent H atoms
on a ring, it is attributed to a CCC bend. Apparently, due to
either screening or the inherent weakness of the feature, the
absorption corresponding to the triply adjacent CH out-of-planebend remains undetected. Using an analysis similar to that
presented for the phenanthrene cation, we find that the integrated
Infrared Spectroscopy of PAH Cations J. Phys. Chem., Vol. 99, No. 10, 1995 3039
.... i .... + .... i .... i ....
i °0.5%
, t _ _ i , i _ x i i , , L t .... I , , , I
1575 1565 1555 1545 1535 1525
a°
]'0.5%
+ , j i i i i _ i , i i , i .... I . , + _1460 1450 1440 1430 1420 410
.... + .... i .... i .... I .... i .... + .... i ....
a.
_0.5%
137i 1350 1325 1300 1275 1250 1225 1200 i 175
o
J,q.
0.5% _
990, , .1980 .... 9701 .... 9_l .... 950_ *' '_40
r-requa_ (cml)
ao
0.5%
i
Frequency (cml)
Figure 8. Mid-infrared spectra of the pyrene cation isolated in an argon matrix at 10 K: (a) before photolysis; (b) after 8 rain of in situ photolysis.
The cation bands are labeled with their positions. Due to its low intensity and separation from other features, the cation band at 1102.0 cm -j is notshown.
intensity of the doubly adjacent CH out-of-plane bending mode
in the pyrene cation is reduced by a factor of 5 relative to the
neutral molecule.
The Perdeuterated Pyrene Cation, C ;d)zo +. The mid-infrared
spectnun of the fully deuterated pyrene cation is shown in Figure
9. These bands, together with the corresponding hydrogenated
ion bands, are also listed in Table 2. The frequencies and
assignments are discussed in depth by Vala et al. 27 We have
found five additional bands attributable to the perdeuterated
pyrene cation. These lie at frequencies of 1540.1, 1521.1,1366.4, 1288.0, and 952.5 cm -1.
The Benzo[e]pyrene Cation, C2oH12 +. The mid-infrared
absorption spectrum of the benzo[e]pyrene cation is shown in
Figure 10. The cation band frequencies and relative intensities
are listed in Table 1. The evolution of the bands assigned to
C20H12 + with Lyman-0t photolysis is plotted in Figure 11. As
with the phenanthrene cation, although this band correlation is
looser for the weaker bands, the overall behavior of a sharp
rise and leveling off warrants their assignment to the cation.
The lines plotted without data points present the behavior of
two photoproduct bands not associated with the benzo[e]pyrenecation.
The 11 cation bands in the 1600-1150 cm -l range are
dominated by a very strong band at 1349.2 cm -1. All of these
bands are attributed to CC stretches. As with perprotonated
phenanthrene, no cation features were detected between 1200
and 900 cm -] (the CH in-plane bending region), presumably
due to screening by absozlations from the neutral species.
There are two cation bands in the CH out-of-plane bending
region. Three are expected since there are three different classes

3040 J.Phys. Chem., Vol.99, No. I0, 1995
X 0.2'n'¢,,
1550 1540
a.
b.
1325
The Spectrum d lbe dto-I_rme Cttiou
.... , .... r .... , .........
&.
J HI
PIA' _'
F
1530"" i520 _ * i510" ' 1500 1_g]_' 'i390 Li_10*' i3'_)"' i_0*" i350
0.2% Z
L
1300 1275
_(cmq)
0.2%
Figure 9. Mid-infrared bands of the perdeuterated pyrene cationisolated m an argon matrix at 10 K: (a) before photolysis; (b) after 8rain of in situ photolysis. The cation bands arc labeled with theirpositions.
o.,,' iIo., i
is_" _" iss* i_ i53o14_s i.o
. r * , . , r , * r I '
O
'm :
I'12._ 14_1
If°,,I
1375 1350 1325 1300 12'75 890 880 870 _ 850 840
F_ (cu, f t ) F_z_-y (_ 1)
Figure 10. Mid-infrared spec_a of the benzo[e]pyrene cation isolatedin an argon matrix at 10 K: (a) before photolysis; (b) a_er 8 rain of insitu photolysis. The cation bands axe labeled with their positions. Bandsat 685.7, 1193.9, and 1264.3 cm -I are not shown.
of adjacent hydrogen atoms in this molecule. Benzo[e]pyrene
contains one ring with four adjacent H atoms, one ring with
two adjacent H's, and two rings with three adjacent H's. The
frequencies of the cation bands detected do not fall in the ranges
normally attributed to these types of adjacent hydrogen atoms.
That at 873.3 cm -_ falls several cm -l beyond the high-frequency
limit of the range normally attributed to aromatic rings contain-
ing two adjacent H atoms, and that at 848.0 cm-1 fails within
the range for two adjacent H atoms but more than 40 cm -1
above that for three. Unless there are important bands in this
Hudgins and Allamandola
r Evolutio n, of, _Beuzo(e)pyrene.,.,..,,r Photoproduets
_em-t
Be-- 1349 _-I
---¢1.--- 1557 ¢m "1
1336 ¢m "1
--_'- 1411 em "1
....... 12_6 ¢m "1
114g em'l
--_-- 1194 ¢m "1
---41--- 131_ _-I
+ 1357 ¢m "1
"--"*'-'- 13_ an "1
--,t,-- 686 c_-I
+ 14.36 ¢nl "1
---e-- - 1467 _-I
0.01 _-
._ _ _ _--.:-- -o
O001 L
0 4 8 12 16
Time (m_a)
Figure 11, Growth of benzo[e]pyrene integrated photoproduct bandareas as a function of photolysis time. Lines with data points indicatebands attributed to the benzo[e]pyrene cation. For comparison, theevolutionary behavior of two photoproduct bands not associated withthe PAIl cation are also shown (without data points). To avoid confusionamong the lowest intensity bands, cation bands at 873.3 and 1264.3cm -1 are not shown.
region screened by the stronger neutral absorptions, these results
indicate that the force field for the cation is sufficiently different
that these out-of-plane motions not only are reduced dramatically
in intensity but that the bond strengths and interactions arealtered as well. If the 873.3 cm -t band does indeed arise from
the doubly adjacent CH out-of-plane bending vibration, its
intensity is suppressed by a factor of 9 from that of the neutral
molecule. Furthermore, if the 848 cm -] band arises from the
triply adjacent mode, it is remarkable both for its large blue
shift from the neutral position (v = 772 cm -_, Av = 76 cm -_)
and for the fact that it is only suppressed by a factor of 2 relative
to the neutral, much less than the 10-20x reduction typically
observed in other PAl-Is.
The band at 685.7 cm -I is assigned to a CCC out-of-plane
bend since, in contrast to the other ion CH out-of-plane bending
bands, it fails 62 cm -_ lower in frequency than the lowest
frequency, strong neutral band and about 40 cm -_ below the
region normally associated with four adjacent H atoms, in the
range normally associated with five adjacent H atoms.
The Benzo[ghi]perylene Cation, CzzH_2 +. The mid-infrared
absorption bands of the benzo[ghi]perylene cation are shown
in Figure 12. The cation band frequencies and relative
intensifies are listed in Table 1. The evolution of the bands
assigned to C22H_2 + with Lyman-ct photolysis is plotted in
Figure 13. The two lines plotted without data points present
the behavior of two photoproduct bands not associated with the
benzo[ghi]perylene cation.
Although the benzo[ghi]perylene cation spectrum is similarto that of the benzo[e]pyrene cation in that it is rich in the 1600-
1200 cln -1 range, it has a very different intensity pattern. This
spectrum is dominated by four strong bands in a grouping, which
is similar to that found for the interstellar emission spectrum,
rather than by one strong band. The strongest band falls at 1578
cm -t, followed by a gap of nearly 200 cm -], at which point
three bands become important, namely, those at 1401.3, 1369,and 1324.4 cm-k As with phenanthrene and benzo[e]pyrene,

InfraredSpectroscopyof PAH Cations
The Spectrum of the Benzo[g phi] erylene........ Cation
I .
1600 1550 1500 1450 1400 1350 1300 1250 1200
.... _ _
b.
I-
I
1
Frequeacy (cm-t) Frequency(cm"t)
Figure 12. Mid-infrared spectra of the benzo[gbJ]perylene cationisolated in an argon matrix at l0 K: (a) before photolysis; (b) after 8rmn of in sit,+ photolysis. The cation bands are labeled with their
positions.
Evolution of Benzo[ghi]perylene Photoproducts
......._ _._o -" "9_"" " 1578 om "|
_- _ ---.0 _ _ --U---- 1401 ¢m "1
0.01 _ --O-- 1324 ¢m "1
--&-- 1369 ¢m-I
[t64 ¢m -I
---41.-- 1223 Cm "1
----.1--- 639 cm-I
- - "A"" - 1550 cm "1
--O---- 1332 em "1
+ 1312 em -1
- - -41.- - - 1429 cm -t
= -- -- 1388 cm "1
0.001 --&-- 1350 cm "1
" ''O-" " 1409 cm "1
1217 cm "1
---O-- - 1539 cm "1
0 4 8 12 16
latu_lolysis Time (rain)
Figure 13. Growth of benzo[ghi]perylene integrated photoproduct bandareas as a function of photolysis time. Lines with data points indicatebands attributed to the benzo[gh,]perylene cation. For comparison, theevolutionary behavior of two photoproduct bands not associated withthe PAH cation are also shown (without data points).
no cation features were detected between 1200 and 900 cm -z,
the CH in-plane bending region. This is puzzling as the
spectrum of neutral benzo[ghi]perylene is quite simple in this
region, and screening by neutral PAH bands is unlikely.
Only one band, that at 863.6 cm -1, has been detected in the
CH out-of-plane bending region of benzo[ghi]perylene. This
molecule has two tings with three adjacent H atoms and three
rings with two adjacent H's. This band does not fall in the
range attributed to doubly adjacent hydrogen, but falls several
J. Phys. Chem., Vol. 99, No. 10, 1995 3041
,a
7
] - 0"5% i
Coroneae Cation Spectrum
FI, , ....
- 0.5%
,i 05%
i
1600 1580 1560 1400 1380 1360 _ g70 850
}:r_q aency (crtr i ) Frequency (¢rrrl) Frequency (CaT t )
Figure 14. Mid-infrared spectra of the coronene cation isolated in anargon matrix at l0 K: (a) before photolysis; (b) after 8 min of in situphotolysis. The cation bands are labeled with theft positions.
cm -] beyond the high-frequency limit. Thus, as with the benzo-
[e]pyrene case, unless there are important bands in this region
screened by the stronger neutral absorptions, these results
indicate that the force field for the cation is quite different from
that of the neutral molecule. As a doubly adjacent CH out-of-
plane bend, the intensity of this band is suppressed by a factorof 4 from that of the 846 cm-1 band of the neutral molecule.
The band at 639.6 cm -z is assigned to a CCC out-of-plane
bend as it is more than 100 cm -1 below the region normally
associated with three adjacent H atoms, and is even well out of
the range associated with five adjacent H atoms.
The Coronene Cation, C24.H12 +. The mid-infrared absorption
bands of the comnene cation are shown in Figure 14. The cation
band frequencies and relative intensities are listed in Table 1.
The positions and relative intensities of the bands at 1378.6
and 874.5 cm -1 agree well with those previously published. 28b'29
The band at 1579 cm -1 has not been reported.
The coronene cation spectrum is remarkable for its simplicity
and unusual intensity pattern. Only three cation bands have
been reported, and the intensity pattern is opposite those of all
other PAH cations studied to date, with the CH out-of-plane
bend producing a band slightly stronger than that arising from
the CC stretching modes. It should be pointed out that the
ionization percentage calculated for this experiment is 11%,
comparable to that obtained for the other PAl-Is in the series.
Furthermore, the intensity of the detected CH out-of-plane
bending feature is also comparable to that measured for the other
cations. Thus, we conclude that the CC stretching modes in
the coronene cation are anomalously weak, giving rise to the
atypical intensity pattern.
Two bands fall in the CC stretching range (1579 and 1378.6
cm-L), none are in the CH in-plane bend region, and one falls
in the CH out-of-plane bend region (874.5 cm-l). These three
bands fall at frequencies very close to those of prominent bands
in the interstellar emission spectrum. As with benzo[ghi]-
perylene, it seems odd that no bands were detectable in the CH
in-plane bend region, as the spectrum of the neutral species is
extremely simple in this area and screening is not a reasonable
explanation for the absence of cation bands. High symmetry
seems plausible to account for the overall simplicity of the
spectrum, the weakness of the CC stretching bands, and the
absence of detectable bands in the CH in-plane bend region.
The position of the out-of-plane CH bend of the cation is
interesting in this regard in that, as with the other PAH cations
in this series, it falls on the high side of the normal range
expected for two adjacent H atoms and is reduced in intensity
by a factor of 5 from that of the 857 cm-] band of neutral
coronene.
B. Near-Infrared Spectroscopy. Band frequencies, areas,and relative intensities listed in Table 3 for the near-IR spectra

3042 J. Phys. Chem., Vol. 99, No. 10, 1995 Hudgins and Allamandola
TABLE 3: Near-Infrared Frequencies and Relative Intensities of Several Cations from the Thermodynamically Meet FavoredPAils
naphthalene phenanthrene
v (cm-b 1_ v (cm-') l_a
phenanthrene-dlo pyrene benzo[e]pyrene benzoLghi]perylene coronene
v (cm -l ) 1_ v (cm -l) Ira v (cm -l ) l_a v (cm -1 ) l_a v (cm -I ) l,_l
14805 1.00 11105 1.00 11145 1.00 12760 1.00 10373 0.258 12185 0.25111650 0.175 11669 0.185 10687 0.255 12481 0.22512600 0.376 12647 0.436 10892 1.00 13049 1.00
12166 0.500 13284 0.113
13444 0.275
10409 1.0010677 0.17010886 0.32411170 0.090711340 0.023911417 0.152
11610 0.14911845 0.100
11990 0.071912471 0.14212766 0.0273
8
I5%
Fmqueacy (car l)
Figure 15, Near-infrared spectrum of the naphthalene cation isolatedin an argon matrix at 10 K. This is the 0-0 band of the I:)2 _ Dotransition.
The Phenantltreae Catioe
8J
..... ....i 00 .....ii 0 .....i000oF_eq_ecy(car')
Figure 16. Near-infrared spectrum of the phenanthrene cation isolated
in an argon matrix at 10 K. This is the I:)2_ Do transition. The strongestband corresponds to the 0-0 transition. The mid-infrared spectrum ofthe same sample is shown m Figure 4.
were measured on the same matrices for which the mid-IR bands
listed in Table 1 were measured.
The Naphthalene Cation, C IoHs+. The near-infrared speelram
of the naphthalene cation is shown in Figure 15. The eleelromc
spectrum of this cation has been described m detail previ-
ously.ZS, 34
The Phenanthrene Cation, C14I"Ito+. The near-infrared spec-
trum of the phenanthrene cation is shown in Figure 16, with
frequencies and relative intensities listed in Table 3. The near-
infrared spectrum of the phenanthrene cation isolated in an argon
matrix has been discussed by Andrews et al. 35 and that in a
neon matrix by Salama et al. 36 The near-infrared spectrum of
the phenanthrene-dlo cation is not shown since it resembles that
..... .....
J0.1%
13200 12800 12400 12000Freqe_'y (cart)
Figure 17. Near-infrared spectrum of the pyrene cation isolated in anargon matrix at 10 K This is the 0-0 band of the De _ Do transition.The mid-infrared spectrmn of the same sample is shown in Figure 8(argon matrix, 10 K).
The eenzo!e)p_,ren,e Cation
liI
Frequency (cm't)
Figure 18. Near-infrared spectrum of the benzo[e]pyrene cationisolated in an argon mamx at 10 K. Tl_s is the D2 -- Do transition.The strongest band corresponds to the 0-0 transition. The mid-infraredspectrum of the same sample is shown in Figure 10.
of perhydrophenanthrene. The frequencies of phenanthrene-
dl0 are listed in Table 2.
The Pyrene Cation, C le,H to +. The near-infrared spectrum of
the pyrene cation is shown in Figure 17, with frequencies and
relative intensities listed in Table 3. The near-infrared spectra
of the pyrene cation isolated in argon and neon matrices have
been described previously. 27.37
The Benzo[e]pyrene Cation, C20H12 +. The near-infrared
spectrum of the benzo[e]pyrene cation is shown in Figure 18,with frequencies and relative intensities listed in Table 3.
The Benzo[ghi]perylene Cation, C22H12+. The near-infrared
spectrum of the benzo[gh/]perylene cation is shown in Figure
19, with frequencies and relative intensities listed in Table 3.

InfraredSpectroscopyofPAHCations
The Benzo[ghilperylene Cation
c
, _ , , , i k b
i_X_'l'360b i320b'12g00 12400 i2000
Frequency (cm'l )
Figure 19. Near-infrared spectrum of the benzo[ghi]perylene cationisolated in an argon matrix at 10 K. This is the D2 -- Do transition.The strongest band corresponds to the 0-0 transition. The mid-infrared
spectrum of the same sample is shown in Figure 12.
The Coronene Cation.... i .... _,, , .... t .... i ,r,q .... I ....
!
1%
M
F_qu_cy(cnT1)
Figure 20. Near-infrared spectrum of the coronene cation isolated inan argon matrix at 10 K. This is the Dt -- Do transition. The strongest
band corresponds to the 0-0 transition. The mid-infrared spectrum ofthe same sample is shown in Figure 14.
The Coronene Cation, Czj-I je +. The near-infrared spectrum
of the coronene cation is shown in Figure 20, with frequenciesand relative intensities listed in Table 3. The near-infrared
spectrum of the coronene cation isolated in an argon matrix
has been reported by d'Hendecourt et al. 29
C. Integrated Absorbance Values. Integrated absorbance
values [A (kilometers/mole)] for the mid-infrared cation bands
of the PAHs phenanthrene, pyrene, benzo[ghi]perylene, andcoronene are listed in Table 4. These A-values were determined
using the near-infrared spectra presented earlier in the following
way.
The integrated absorbance value, A, is given by the relation
A = fr dv/_r (1)
where N + is the number density of absorbers, in this case PAH
cations, and fr dv is the integrated area of the strongest near-
infrared band (in centimeters-l). N + (in moles centimeters -2)
is related to the area of this band by the equation
N + = _Av/E+n_Av (2)
+where Er_xAV is the integrated molar absorption coefficient inliters mole -1. Combination of eqs 1 and 2 gives
+
ANm = Ema_Av (3)
where Av is the measured full width at half-height (FWHH) of
J. Phys. Chem., Vol. 99, No. I0, 1995 3043
the near-infrared band, and the value of the molar absorption+
coefficient _m,_ was determined from the oscillator strength (])
using 38
+
n f = 4.32 x 10 -9 EmaxAv (/'lAx = 1.29) (4)
A straightforward unitary conversion gives the integratedabsorbance value in units of kilometers/mole. The ratio of the
integrated area of the mid-infrared bands to that of the near-infrared band in the same matrix could then be used to scale
ANm, giving the integrated absorbance values presented in Table
4. All integrated band areas were calculated in base 10 with
software provided by Nicolet. The specific oscillator strengths,
molar absorption coefficients, and near-lR/mid-IR band ratios
used for our calculations are given in the following.
It should also be emphasized that our experiments indicate
that the presence of CCh significantly enhances the near-infrared
band intensities with respect to the mid-infrared band intensities.
For example, without CC14 in the matrix, the ratio of the
integrated intensity of the 9005 A phenanthrene electronic band
to the 1565 cm -l vibrational band is 66. With CCh, the ratio
is 139. The presence of CC14 enhances the ratio by about 2
times. For benzo[e]pyrene, without CCh in the matrix, the ratio
of the integrated intensity of the 9181/_ electronic band to the
1349.2 cm -] vibrational band is 43. With CCh, the ratio is
59, an enhancement of about 40%. For the 7663 ,A and 1401.3
cm -1 bands of benzo[ghi]perylene, the enhancement is about 6
times (fz dvrag/fr dVMm = 9 without CCI4 and 55 with CCh).
In ref 19, we showed that CCh did not influence the absolute
strength of naphthalene's mid-infrared bands, but did not
investigate its influence on any electronic transitions.
In view of the near- to mid-infrared intensity ratio alterations
induced by CCh, A-values were determined for matrices without
CCh present. Ultimately, the accuracy of these values rests on
the molar absorption coefficient used to determine the number
of neutral PAll molecules lost upon photolysis, the technique
generally used to determine the molar absorption coefficients
and oscillator strengths of the near-infrared cation bands. 36 As
this information is not available for all of the PAHs studied
here, we have been unable to determine A-values for all the
cations reported. The integrated A-values for the other PAHcation bands will be evaluated as this information becomes
available.
This is an extremely important issue as there is wide variance
in the literature on this subject. As with the naphthalene cation,
and as discussed at length in ref 19, while the relative intensities
of the cation bands reported here agree well in those cases where
independently measured data are available (pyrene and coro-
nene), there are discrepancies between the reported absolute
intensities. However, while discrepancies still exist between
our results and those from Professor Vala's group at the
University of Florida, they are much more modest than was
the case for the naphthalene cation (2-4x as compared to 50x).
Such variances may well be within the experimental uncertain-
ties associated with the measurements, conservatively estimated
to be less than a factor of 2. By far the largest source of errorin these measurements stems from the lack of accurate molar
absorbances for the near-IR bands. In order to reduce the
relative uncertainty in these values, and to eliminate the
possibility of matrix effects influencing the electronic transitions
differently from the vibrational transitions, we are developingan alternative method to determine A-values. In view of the
fundamental importance of these values, we present the detailsof our A-value calculations.
Naphthalene Integrated A-Values. The analysis described
earlier was applied to the naphthalene cation in order to check

3044 J. Phys. Chem., Vol. 99, No. 10, 1995
TABLE 4: Integrated Absorbance Values for the Mid-Infrared Bands of Several PAIl Cations •
Hudgins and Allamandola
phenanthrene
C1,1"Iio+ Cx4D10+ pyrone Clt, I-Ito+
v (cm-L) A (kin/tool) v (cra-') A (km/mol)
benzo[gh0peryleneC22Ht2+
w (cm-') A (ka'n/mol)v (cm-I) A (kin/tool)
coroneneC2fflt2 +
v (cm-l) A (kra/mol)
582.00 0.594 566.70 0.424694.50 0.255 856.20 0.785756.20 0.197 958.50 0.0769836.00 0.150 1013.4 0.08991258.7 0.112 II14.8 0.1151264.7 0.0383 1176.6 0.06761267.0 0.383 1194.1 0.130
1277.5/1282.5 2.26 1201.6 1.471299.0 0.239 1207.2 0.4871513.0 0.114 1213.5 0.07811551.0 0.169 1221.5 0.2231558.2 0.0570 1230.4 0.3031565.0 2.70 1296.5 0.141
1344.2 0.09831400.3 0.1301459.5 0.7941507.0 0.4411525.0/1528.0 4.201547.4 0.204
a Experimental uncertainties
690.10 64.3 639.60 81.5861.00 76.1 863.60 166867.00 9.95 1216.7 11.9953.80 18.8 1223.4 110976.50 25.5 1311.9 50.1
1102.0 22.4 1324.4 276
1188.7 10.3 1331.9 62.81216.0 34.1 1343.2 1201245.1 96.7 1350.2 53.51253.7/1255.7 12.0 1369.0 2341356.1/1358.4 282 1401.3 3121361.8 44.6 1408.8 17.71421.1 44.6 1429.4 36.31440.3 28.5 1538.6 6.921550.9/1553.4/1556.0 251 1550.1 82.3
1578.2 374
of the integrated absorbance values are less than a factor of 2.
874.50 1791378.6 31.11579.0 148
the technique. We had previously derived the naphthalene
cation A-values using an entirely independent analysis, t9 Use
of the amended molar absorption coefficient for the 6754 A+
band of the naphthalene cation, 19 6max = 565 L tool -1 cm -t,
and FWHH = 45 cm -l in eq 3 gives Arcm = 254 k_m/mol. The
ratio of the 1218 cm -1 band of the naphthalene cation, the
strongest mid-infrared feature, to the 6750 A band measured
for this experiment is 1/65, giving an A-value for this band of
AlzlS = 3.9 km/mol. This is in excellent agreement with the
value of 4.1 kin/tool presented in ref 19, supporting the validity
of this technique.
Phenanthrene Integrated A-Values. The oscillator strength
for the 9005/_ band of phenanthrene is 6 x 10⁻⁵. 36 Use of eq
4 and a 53 cm -x FWI-IH gives _max+---- 338 L mol -t cm -1.
Equation 3 gives A_ag = 1.79 x 10³ kndmol. Finally, the ratio
of the strongest mid-infrared band, 1565 cm -l, to the 9005 A
near-infrared band is 1/66, giving A1565 = 2.7 kin/tool. The
other mid-infrared A-values were scaled using the relative
intensities shown in Table 1.
Phenanthrene-dw Integrated A-Values. The oscillator strength
for the 8973 A band of phenanthrene-dl0 is assumed equal to
that for pbenanthrene, i.e., 6 x 10-s: 6 This gives E+am= 188 L
tool -1 cm -1 (WHH = 95 em -l) and AmR = 179 km/mol. The
ratio of the 1528 cm -1 mid-infrared band to the 8973 A band
in phenanthrene-dl0 is 1/42, giving A152s = 4.2 km/mol. The
other mid-infrared A-values were scaled using the relative
intensities shown in Table 2.
Pyrene Integrated A-Values. The oscillator strength for the
7837 A band of pyrene is assumed to be about 1 x 10⁻³. 39
This gives _m__- = 1420 L tool -l cm -1 (FWHH = 210 cm -t)
and Arcm = 2.99 x 10³ kra/mol. The ratio of the 1356.1 cm -1
mid-infrared band to the 7837/_ band of pyrene is 1/11, giving
A1356 = 282 km/mol. The other mid-infrared A-values were
scaled using the relative intensities shown in Table 1.
Benzo[ghi]perylene Integrated A-Values. The oscillator
strength for the 7663 A band of benzo[ghi]perylene is also taken+
as 1 x 10⁻³. 39 This corresponds to 6max ---" 3830 L tool -1
cm -_, based on a 78 cm -_ FWHH. The integrated absorbance
value is Ahag = 2.99 x 10³ kin/tool. The ratio of the 1578.2
cm -l mid-infrared band to the 7663 A band of benzo[gh/]-
perylene is 1/8, giving At57s = 374 km/mol. The other mid-
infrared A-values were scaled using the relative intensities shown
in Table 1.
Coronene Integrated A-Values. The oscillator strength for
the 9607 A band of coronene is 1.8 x 10⁻³. 40 This corresponds+
tOem_ = 5.84 x 10³ L tool -_ cm -l,based on a92 cm -l
FWHH. This, in turn, gives Ar,_ = 5.38 x 10³ kin/tool. Theratio of the 874.5 cm -1 mid-infrared band to the 9607 ,_ band
of coronene is 1/30, giving Agr5 = 179 kin/tool. The other mid-
infrared A-values were scaled using the relative intensities shownin Table I.
IV. Astrophysical Impficatlons
Comparisons between the interstellar emission spectra and
the absorption spectra of PAHs in KBr pellets have shown
important differences, which are used by some to drawconclusions about the nature of interstellar PAHs and by others
to raise doubts as to the validity of the PAIl hypothesis. One
important difference concerns relative baad intensifies. Asshown in Figure 21, which presents the IR emission spectrumfrom the Great Nebula in Orion, 41 the interstellar 1610 cm -1
(6.2 #m) feature and broad emission envelope centered near1300 cm -_ (7.7 #m), which are assigned to PAII CC stretchingmodes, are much more intense than the interstellar feature near
885 cm -l (11.3/zm), which is attributed to the CH out-of-plane
bending mode. This behavior is just the opposite that of PAils
in KBr pellets and in solvents where the strongest absorptionsby far are those due to the out-of-plane CH bending vibrations
[often 5-8 times greater than the average band strength in the
CC stretch and CH in-plane bending region between about 1650
and 1100 cm -1 (6 and 9 #m)]. The relative intensifies of the
interstellar features have been taken by some as evidence that
interstellar PAils are severely dehydrogenated, in spite of the
fact that atomic hydrogen is on the order of 10 000 times moreabundant in most of the emission zones than the PAHs. 42 To
invoke such a high degree of dehydrogenation under theseconditions seems unreasonable.
This difficulty is removed if the PAHs in space are largelyionized. With the exception of coronene, we have shown the
following: First, the intensities of the bands in the 1650 -1100
cm -1 range, the CC stretching and CH in-plane bending region

Infrared Spectroscopy of PAH Cations J. Phys. Chem., Vol. 99, No. I0, 1995 3045
THE INFRARED EMISSION SPECTRUM OF THE ORION BAR
:lO
FmW_ (cm-_)3100 3000 2900 21100 1500 1000
l I I I J _ _ ! _ _ ' _ I J '
]
A -=- t =
3.2 3.3 3.4 3.5 3.6 6 7 II 9 10 11 12
wm,kmgm (p,.)
Figure 21. Infrared emission spectrum from the Orion nebula. 4_
of PAH cations, are typically 2-5 times greater than those of
the CH out-of-plane bending modes, which fall between 900
and 550 cm -t. Second, the CH out-of-plane bending modes
of the cations are typically 5-20 times weaker than the out-
of-plane bending modes of the neutral molecules, and third, the
bands in the the CC stretching and CH in-plane bending regions
are generally an order of magnitude stronger than those for the
corresponding transitions in neutral PAHs. The coronene
exception is notable. The 874.5 cm -l CH out-of-plane bend
of the coronene cation is slightly stronger than the strongest
CC stretch at 1579 cm -I.
This work and work presented by the University of Florida
group on other PAH cations _-2s confLrm the behavior predicted
theoretically by Defrees et al. 23 and Pauzat et al. 24 and resolve
one of the more troubling aspects of the interstellar PAH model.
Other impediments to the full exploitation of the interstellar
PAH hypothesis raised by comparing KBr pellet spectra to the
interstellar spectra are addressed by the results of a study of
the spectroscopic properties of a number of neutral, matrix-isolated PAHs found elsewhere. 21.22
It is important to realize that the most intense bands of all
PAH cations studied to date fall within the envelopes of the
most intense interstellar features, namely, those at 6.2 and 7.7
/xm. As illustrated by Figure 21, these are consistently thebroadest and most intense members of the interstellar emission
band family. The observation that the most intense interstellar
emission features fall in the PAH CC stretching and CH in-
plane bending regions is completely consistent with the com-
posite emission spectrum expected from a mixture dominated
by free, ionized, small PAHs.
V. Conclusions
The near- and mid-infrared spectra of the phenanthrene,
pyrene, benzo[e]pyrene, benzo[ghi]perylene, and coronene
cations, isolated in argon matrices, are reported. Ions were
generated by in situ photolysis.
With the exception of coronene, the strongest mid-infrared
absorption bands of these PAH cations fall between 1600 and
1200 cm -_, the CC stretching and CH in-plane bending region.These tend to be 2-5 times more intense than the bands due to
the CH out-of-plane bending modes. The strongest bands tend
to fall in groupings between 1600 and 1550 cm -l and between
1400 and 1200 cm-L
On the other hand, integrated absorbance values for the CH
modes in the cation are strongly depressed with respect to the
neutral molecules. Only weak new bands grow in the normally
very strong CH out-of-plane bending region between about 900
and 600 cm -l. The extent to which these out-of-plane motions
are reduced in intensity and the bond strengths and interactions
are altered is fax more than would be expected on first principles
by the removal of one electron from the :r system. Similarly,
as has been the case with previous PAH cations studied, no
new features were found in the CH stretching region between
3200 and 2900 cm -l, implying that the CH stretching modes
of the cation are comparable to or weaker than those for the
neutral species. Theory predicts them to be weaker. 24Most of the detectable new bands fall between 1570 and 1250
cm -_ and, thus, are assigned principally to the CC stretching
modes. Those at the lower frequencies in this range may have
some in-plane CH bending character as well.
The observation that the strongest cation bands coincide with
CC stretching modes, behavior just the opposite that of the
neutral species, has important ramifications on the interpretation
of the observed astronomical emission spectrum, which is
dominated by very broad features in this region at 1310 and
1620 cm -_. Since this seems to be a general characteristic of
PAH cations, it resolves one of the greatest discrepancies with
the interstellar PAH hypothesis.
Acknowledgment. The authors acknowledge the expert
technical support of Bob Walker and valuable scientific dis-cussions with Farid Salama, Scott Sandford, and Christine
Joblin. This work was fully supported by NASA's Laboratory
Astrophysics and Long Term Space Astrophysics programsunder Grants 188-44-57-01 and 399-20-01-05.
Note Added in Proof: Recent unpublished calculations on
PAH cation integrated absorbance values (A-values) by Langhoff
show considerable PAH to PAH variation when compared to
the values in Table 4. The experimental values tend to be no
more than a factor of 2 greater than the theoretical values for
pyrene, but they are 2-3 orders of magnitude smaller for
phenanthrene. This points out the need for a better understand-
ing of A-values in PAH cations.
References and Notes
(1) Harvey, R. G., Ed. Polycyclic Hydrocarbons and Carcinogenesis;
American Chemical Society: Washington, DC, 1985.
(2) (a) Harris, S. J.; Weiner, A. M. Combust. Sci. Technol. 1983, 31,155. (b) Frenldach, M.; Warnatz, J. Combust. Sci. Technol. 1987, 51, 265.
(3) (a) Allamandola, L. J.; "Vlelens,A. G. G. M.; Barker, J. R. Astrophys.J. Suppl. Ser. 1989, 71, 733. (b) Allamandola, L. I. In Topics in CurrentChemist_'; Cyvin, S., Gutrnan, J., Eds.; Springer Verlag: Berlin, 1990; p1. (c) Puget, J. L.; Leger, A. Annu. Rev. Astron. Astrophys. 1989, 27, 161.
(4) Allamandol& L. J.; Tielens, A. G. G. M.; Barker. J. R. Astrophys.J. Leu. 1985, 290, L25.
(5) Leger, A.; Puget, J. L. Astron. Astrophys. 1984, 137, L5.(6) (a) Cyvin, B. N.; Klaeboe, P.; Whitmer, J. C.; Cyvin. S. J. Z.
Naturforschung 1982, 37a, 251. (b) Cyvin, S. J.; Cyvin, B. N.; Brunvoll,J.; Whitmer, J. C.; Klaeboe, P.; Gustavsen. J. E. Z. Namrforschung 1979,34a, 876.
3046 J. Phys. Chem., Vol. 99, No. 10, 1995
(7) Sadtler Atlas of Infrared Spectra; Sadtler Research Laboratories:Philadelplfla, P A, 1990.
(8) Wittebom, F. C.; Sandford, S. A.; Bregman, J. D.; Allamandola,
L. J.; Cohen, M.; Wooden, D. H.; Graps, A. L. Astrophys. J. 1989, 341,270.
(9) Cherchneff, I.; Barker, J. R. Astrophys. J. Left. 1989, 341, L21.
(10) Shah, J.; Suto, M.; It.e, L. C. Astrophys. J. 1991, 383, 459.(11) Brenner, J. D.; Barker, J. R. Astrophys. J. Left. 1992, 388, L39.
(12) Schlemmer, S.; Cook, D. J.; Harrison, J. A.; Wurfel, B.; Chapman,W.; Saykally, R. J. Science 1994, 265, 1686.
(13) Williams, R. M.; Leone, S. R. In The Diffuse Interstellar Bands:Contributed Papers; Tielens, A. G. G. M., Ed.; NASA: Washington, DC,
1994; CP 10144, p 59.(14) Flickinger, G. C.; Wdowiak, T. J.; Gomez, P. L. Astrophys. J. Left.
1991, 380, LA3.
(15) Colangeli, L.; Mennella, V.; Bus._letti, E. Astrophys. J. 1992, 385,577.
(16) Kurtz, J. Astron. Astrophys. 1992, 255, L1.(17) Joblin, C.; Boissel, P.; Leger, A.; d'Hendecourl, L. B.; Defournean,
D. Astron. Astrophys. J. 1994, in press.(18) Wdowiak, T. J., 1994, private communication.
(19) Hudgins, D. M.; Sandford, S. A.; Allamandola, L. J. J. Phys. Chert1994, 98, 4243.
(20) Stein, S. E. J. Phys. Chert 1978, 82, 270.
(21) Hudgins, D. M., Sandford, S. A. manuscript in preparation.(22) Hudgins, D. M., SandforcL S. A., manuscript in preparation.(23) (a) DeFrec*, D. J.; Miller, M. D. In Interstellar Dust: Contributed
Papers; Allamandola, L. l., Tielens, A. G. G. M., Eds.; NASA: Washington,DC, 1989; CP 3036, p 173. (b) DcFrees, D. J.; Miller, M. D.; Talbi, D.;Pauzat, F.; Ellinger, Y. Astrophys. J. 1993, 408, 530.
(24) Pauzat, F.; Talbi, D.; Miller, M. D.; DeFrees, D. J.; Ellinger, Y. J.Phys. Chert 1992, 96, 7882.
(25) Szczepansld, J.; Roser, D.; Personette, W.; Eyring, M.; Pellow, R.;Vala, M. J. Phys. Chem. 1992, 96, 7876.
Hudgins and Allamandola
(26) Szczepa.nski, J.; Vala, M.; Talbi, D.; Parisel, 04 Ellinger, Y. J.
Chert Phys. 1993, 98, 4494.
(27) Va.la, M.; Szczepanski, J.; PanzaL F.; Parisel, O.; Talbi, D.; Ellmger,Y. J. Phys. Chert 1994, 98, 9187-9196.
(28) Szczepanski, J.; Chapo, C.; and Vala, M. Chent Phys. 1993, 205,
434. Co) Szczepanski, J.; Vala, M. Astrophys. J. 1993, 414, 179.
(29) d'Hende, court, L. B.; 12ger, A. In The First Symposium on theInfrared Cirrus and D_Cfuse Interstellar Clouds, ASP Conference SeriesVol. 58; Culri, R. M., Latter, W. B., Eds.; Astronomical Society of thePacific: San Francisco, 1994.
(30) Wlftte, C. M. J. Chefs. Eng. Data 1986, 31, 198.
(31) Wemer, A. S.; Tsai, B. P.; Baer, T. J. Chem. Phys. 1974, 60, 3650.
(32) Lippincott, E. R.; O'Reilly, E. J. Z Chem. Phys. 1955, 23, 238.
(33) McClellan, A. L.; Pimentel, G. C. J. Chem. Phys. 1955, 23, 245.
(34) Salama, F.; Allamandola, L. J. J. Chem. Phys. 1991, 94, 6964.
(35) Andrews, L.; Friedman, S.; Kelsall, J. J. Phys. Chem. 1985, 89,4016.
(36) Salama, F.; Joblin, C.; Allamandola, L. J. J. Chem. Phys. 1994,101, 10252.
(37) Salama, F.; Allamandola, L. J. Nature 1992, 358, 42.
(38) Okabe, I-LPhotochemistry of Small Molecules;, Wiley & Sons: New
York, 1978; p 41
(39) Salama, F., private communication.
(40) _und, P.; d'Hendecourt, L.; Verstraete, L.; Leger, A.;
Schmidt, W.; Defournean, D. Asrron. Astrophys. 1992, 259, 257.
(41) Bregman, J. D.; Allamandola, L. J.; Tinlens, A. G. G. M.; Geballe,
T. R.; Witteborn, F. C. Astrophys. J. 1989, 344, 791.
(42) Jourdam de Muizon, M., d'HendecourL L. B., and _e, T. R.,
Astron. Aatrophys., 1990, 227, 526.
JP942323L


![Polycyclic aromatic hydrocarbons (PAH) guidance · Polycyclic aromatic hydrocarbons (Benzo[a]pyrene) General Information Key Points Identity The term polycyclic aromatic hydrocarbons](https://img.dokumen.tips/doc/110x75/5af498db7f8b9a8d1c8c6b2b/polycyclic-aromatic-hydrocarbons-pah-guidance-aromatic-hydrocarbons-benzoapyrene.jpg)