Embed Size (px)
Citation preview

2332-30
School on Synchrotron and FEL Based Methods and their Multi-Disciplinary Applications
Lisa Vaccari
19 - 30 March 2012
ELETTRA Sincrotrone Trieste
Infrared spectroscopy and microscopy

Infrared spectroscopy and microscopy
SR & FEL School 19-30 March 2012
Lisa Vaccari SISSI beamline @ Elettra Laboratory
Talk outline The infrared spectral region Basics on vibrational spectroscopy Instrumentation
FTIR spectrometer Vis-IR microscope
InfraRed Synchrotron Radiation (IRSR) IRSR Sources IRSR Advantages IR Beamline design
SR-IRMS applications in the MIR domain Space science Earth science Cultural Heritage Biological and biomedical applications of SR-IRMS: from archeology to living cell analysis
Biology and biochemistry: the spectroscopic point of view Microspectroscopic Evidence of Cretaceous Bone Proteins Prion disorders SR-IRMS of living cells: toward a label free single-cell based assay
» SR-IRMS of living versus fixed single-cells » Real-time chemical imaging of bacterial activity in biofilms » Dual element ATR mapping
Summary and conclusions

The infrared spectral region
NIR MIR FIR ( m) 0.74 3 30 300 (THz) 400 100 10 1 (cm-1) ~13000 ~3333 ~333 ~33
E (eV) 1.65 0.413 0.041 0.004 E (Kcal/mol) 37 10 1 0.1
The infrared spectral region_1
The IR spectral range is a wide region of long wavelengths

Basics on vibrational spectroscopy IR spectroscopy is an absorption spectroscopy
Direct resonance between vibrational transition frequency and photon frequency
I
I/I0
wavelength
I0
Vibrational (stretching) frequencies For a diatomic molecule or molecular fragment
ntDisplaceme constant Spring
mass Reduced21
21
Kmm
mm
kv21
Basics on vibrational spectroscopy_1 x1 x2
F = -k. r r0
k
+
m1
- - +
m2

kvnhvEvib 21frequency lvibrationa fudamental 00 ),21(
Harmonic approximation
Anharmonicity
constant anharmonic]terms higher)21()21[(
0
20
xnxnhvE ovib
Vibrational energies
Re
Dissociation
n = 0 n = 1 n = 2 n = 3
Ener
gy
Displacement
Fundamental frequency First overtone Second overtone
Harmonic oscillator
Anharmonic oscillator
Basics on vibrational spectroscopy_2
1n
integern

Linear N-atom molecule: 3N-5 modes of vibration Non linear N-atom molecule: 3N-6 modes of vibration
Fundamental modes of vibrations for polyatomic molecules
Symmetric Stretching
Scissoring Rocking Wagging Twisting
Only the vibrational modes that produce a change of the molecular dipole moment are IR active
Basics on vibrational spectroscopy_3
Antisymmetric Stretching

MIR
wat
er s
pect
rum
1 = 3280 cm-1
Sym Stretching
3 = 3490 cm-1
Asym Stretching
2 = 1645 cm-1
Bending
Basics on vibrational spectroscopy_4
The liquid water absorption spectrum
Overtones and
combination bands
Water librations, L
2 + L
Intermolecular bend = 50 cm-1
Intermolecular stretch = 183 cm-1 L1 librations = 395 cm-1 L2 librations = 687 cm-1
Animation by Jens Dreyer, MBI

From peak position, intensity and width Atoms involved in the vibration Strength of the atomic bond(s) : single, double, triple bond Bond(s) conformation: cis Chemical environment Atomic bond orientation
Basics on vibrational spectroscopy_5
Spectral information
Drude term (FIR) Semiconductor gaps (NIR-Vis) Excitons Polarons

Spectral Resolution ~1/ x(cm-1) ~ 0.001 cm-1 ~ 1meV
Source
Mobile mirror M2
Fixed mirror M1
Beamsplitter x=0
d
Instrumentation FTIR spectrometerrometer
Instrumentation: FTIR spectrometer_1
Conventional sources NIR: Tungsten lamp MIR: Glow bar (SiC) FIR: Hg-Arc
Beamsplitters NIR: CaF2 MIR: KBr FIR: Mylar, Silicon
Detectors NIR InGaAs, InSb, Ge, Si room temperature detectors MIR: Room temperature DLaTGS Nitrogen cooled MCT FIR He Cooled Silicon Bolometer Room temperature DLaTGS
L, 2L
L, 2(L+ x)
Sample Detector
2 x

Mon
ocro
mat
ic
sour
ce
Polic
rom
atic
so
urce
Co
ntin
uum
so
urce
Fourier
Transform
Interferogram
Spectrum
x
Interferogram
Spectrum
x
n0
Interferogram
Spectrum
x
n1 nn
Instrumentation: FTIR ispectrometer_2
Fourier Transform
Fourier Transform

Instrumentation: FTIR spectrometer_3
Advantages of FTIR interferometers throughput advantage
All source wavelengths are measured simultaneously in an interferometer, whereas in a dispersive spectrometer they are measured successively. A complete spectrum can be collected very rapidly and many scans can be averaged in the time taken for a single scan of a dispersive spectrometer.
advantage (Multiplex advantage) For the same resolution, the energy throughput in an interferometer can be higher than in a dispersive spectrometer, where it is restricted by the slits.
Connes accuracy advantage The wavenumber scale of an interferometer is derived from a HeNe laser that acts as an internal reference for each scan. The wavenumber of this laser is known very accurately (632.8 nm) and is very stable. As a result, the wavenumber calibration of interferometers is much more accurate and has much better long term stability than the calibration of dispersive instruments.
As a result, a FTIR spectrum can be measured with the same signal-to-noise ratio than a dispersive spectrum in a
much shorter time (seconds rather than minutes) and spectral subtractions can be carried out without
frequency errors

0 4 8 12 16 20 24 28 32 36
Sing
le B
eam
1000 1500 2000 2500 3000 3500 Wavenumbers (cm-1)
Without sample
0 4
8
12
16
20
24
28
32 36
Sing
le B
eam
1000 1500 2000 2500 3000 3500
Wavenumbers (cm-1)
With sample
Resulting spectrum
-0.04 -0.02 0.00 0.02 0.04 0.06 0.08 0.10 0.12 0.14 0.16 0.18 0.20 0.22
Abs
orba
nce
1000 1500 2000 2500 3000 3500 Wavenumbers (cm-1)
Fast Fourier Transform
interferogram
Spectral acquisition
Instrumentation: FTIR spectrometer_4

TRANSMISSION REFLECTION
SPECULAR
DIFFUSE
ATR
(Attenuated Total Reflection)
GRAZING INCIDENCE Instrumentation: FTIR spectrometer_5
Sampling techniques
cmdLmolccmmolL)(I/IA
,,log
111010
Lambert-Beer Law
221
21 sin2
depth) npenetratio( nn
dp
Typical angle of incidence = 50-85° The surface properties of the sample are investigated
Typical angle of incidence = 10-30° The refraction behavior of the bulk sample is investigated
The diffusive-reflection spectrum is defined by the absorption-scattering behavior of the sample
1 = crystal, 2 = sample

Instrumentation Vis-IR microscopes
Spatially resolved chemical information on heterogeneous samples are obtained by coupling FTIR spectrometers with specially designed Vis-IR microscopes
Objective NA Wavelength
0.4 10 m (1000cm-1) 15 m
2.5 m (4000cm-1) 4 m
0.65 10 m (1000cm-1) 9,5 m
2.5 m (4000cm-1) 2,5 m
The highest achievable lateral resolution, , is diffraction limited
Instrumentation: Vis-IR microscopes_1
0.61 / NA
Schwarzschild objective

Instrumentation: Vis-IR microscopes_2 Adapted from: L.Miller, P. Dumas, BBA 1758:846, 2006
FTIR mapping versus FTIR imaging M
appi
ng la
yout
Im
agin
g la
yout
Single point detector
Detector array at focal plane
The image pixel size is provided by the individual pixel of the detector Parallel acquisition: Fast imaging of large sample areas High detector noise, low SNR
The map pixel size is provided by the aperture settings Sequential acquisition: Slow imaging of large sample areas Low detector noise, high SNR
Optical sample image
Optical sample image
Chemical sample image

IBI
0 Constant Field Emission
BM
Standard Bending radiation Emitted during the circular trajectory in the bending magnet (BM) due to
the constant magnetic field, B
InfRared Synchrotron Radiation (IRSR) _ Sources
Natural opening angle
V-NAT (rad) = 1.66 ( / )1/3
P ( = 4.4 1014 x I x H x bw x ( / )1/3 photons s-1 I is the current in amperes,
H (rads) the horizontal collection angle, bw the bandwidth in per cent, the wavelength, and the radius of the bending
IRSR sources_1

IBI
0
IBI
0
Straight section
Edge Emission Emitted at the entrance (exit) of a bending magnet due to the rapid variation
of the B field
BM
BM
In the Far-Field approximation:
P = x I x 4 2/(1+ 2 2)2 photons s-1
I is the current in amperes, (rads) the emission angle
(concentrated in max ~ 1/ ~10 mrads)
IRSR sources_2

IRSR: Advantages_1
100 1000
1E-6
1E-5
1E-4
Pho
ton
Flu
x (
Wat
ts/c
m-1
)
Wavenumbers ( cm-1)
BB temperature= 2000K
Synchrotron Flux @ SOLEIL
SOLEIL Synchrotron 500 mA
100 1000
1E-6
1E-5
1E-4
Pho
ton
Flu
x (
Wat
ts/c
m-1
)
Wavenumbers ( cm-1)
BB temperature= 2000K
Synchrotron Flux @ SOLEIL
SOLEIL Synchrotron 500 mA
The IRSR Flux and Brilliance depend on: -beam current -source size/emittance -extraction aperture -transmission optics Instead scarcely depend on the machine energy
Elettra I= 300 mA
~( c/ )1/3
InfRared Synchrotron Radiation (IRSR) _ Advantages

InfRared Synchrotron Radiation (IRSR) Advantages
LINEAR & CIRCULAR POLARIZATION
Diffraction limited spatial resolution
Better Signal-to-Noise
Faster Data Collection
BRIGHTNESS
PULSED EMISSION
BROADBAND
IRSR: Advantages_2
Time resolved studies
Microscopy
Spectroscopy
Polarized (micro)spectroscopy of oriented substrates

M1 Plane mirror M2 Ellipsoidal mirror M3 Plane mirror M4 Ellipsoidal mirror
Radiation is collected over a solid angle of 65 mrad (H) x 25 mrad (V)
M1 Plane mirror M2 Ellipsoidal mirror M3 Plane mirror M4 Ellipsoidal mirror
a
a = 3.5 m
b
b = 1.0 m
c
c = 11.5 m
d
d = 1.5 m
e
e = 1.0 m
f
f = 2.5 m
IR beamline design Conventional IR beamline layout: SISSI@Elettra
IR beamline design_1

SISSI first chamber The water-cooled
extraction mirror (M1)
The focusing Ellipsoidal mirror (M2)
IR beamline design_2
108
109
108
109
1010
108
109
1010
1011
108
109
1010
1011
10 meV ~ 80 cm-1
100 meV ~ 805 cm-1
500 meV ~ 4000 cm-1
1 eV ~ 8000 cm-1
Intensity distribution on the extraction mirror
(photons*0.1%bw/mm2)

MIR performances of SISSI@Elettra
Diffraction-limited lateral resolution is practically achievable only by exploiting the brightness advantage of SR
N2 cooled MCT detector, 128 scans, 4 cm-1 spectral resolution
IR beamline design_3

SISSI MIR beam profile imaged with FPA detector IR beamline design_4
Figure of merit of SISSI@Elettra
MIR MCT detector, 128 scans, 4 cm-1
FIR Si bolometer, 128 scans,
4 cm-1

Beamline branches simultaneously working
Microscope 1 Branche BM
Microscope 2 Branche ER
BM
« ER »
At SISSI beamline, the two branches can not operate simultaneously
More recent beamlines in newer III generation SR facilities split BM and ER radiation contributions for the simultaneous operation of two branches
SMIS @
Soleil
IR beamline design_5

More recent IR beamline layout: IRENI@Synchrotron Radiation Center, Wisconsin-Madison
From M.J. Nasse et al., Nature methods, 8:413 (2011)
The FTIR imaging approach: high SNR and fast acquisition speed
IR beamline design_6
320 mrad x 27mrad

SRC ( Madison)
CLS ( Saskatoon)
ALS ( Berkeley)
NSLS ( Brookhaven)
CAMD ( Baton Rouge)
DIAMOND ( Oxford)
ALBA ( Barcelone)
SOLEIL ( Paris)
ESRF ( Grenoble)
MAX II ( Gotheborg) BESSY
II ( Berlin)
ANKA Karshurhe
) SLS
( Villigen) ELETTRA ( Trieste)
DAPHNE ( Rome)
INDUS ( Mumbay)
SRLI ( Thailand)
SSLS ( Singapore)
Australian Synchrotro
n (
Melbourne)
SRRC ( Beijinq)
UVSOR ( Japan)
SPRING-8 ( Japan)
Operational In construction
SESAME ( Jordan)
In design
IRSR Beamlines in the World

Syncrotron Radiation applications in the MIR domain
Space science Earth science Cultural Heritage Biological and biomedical applications of SR-IRMS: from archeology to living cell analysis Biology and biochemistry: the spectroscopic point of view
Microspectroscopic Evidence of Cretaceous Bone Proteins Prion disorders
SR-IRMS of living cells: toward a label free single-cell based assay
Living versus fixed single cell SR-IRMS Real-time chemical imaging of bacterial activity in biofilms Dual-element ATR microscopy

Synchrotron infrared microscopy of micron-sized extraterrestrial grains
The study of extraterrestrial micronsized particles is a topic of major interest in astrophysics and planetology. Among the various microanalysis tools available, SR Infrared Microspectrometry is of particular interest, as it is a non-destructive technique, well suited to provide mineralogical and chemical information on micrometer scales.
4000 3500 3000 2500 2000 1500 1000
-0,5
0,0
0,5
Blackbody- 6x6 m2
Blackbody- 12x12 m 2
Synchrotron- 3x3 m 2
Abs
orba
nce
Frequency ( cm-1)
Olivine ( crystallized)
Aliphatic CH
OH- silicates
Molecular water
Orgueil particle sample prepared by crushing the material between two glass slide and following transfer on a KBr window
Caractherization of Orgueil chondrite A large stony carbonaceous meteorite that disintegrated and fell in fragments near the French town of Orgueil on May 14, 1864
Space Science_1

Chemical image of OH water distribution inside Orgueill particles, 3X3 m lateral resolution
Optical snapshot Integrated absorbance [3800-3000 cm-1]
From P.I. Raynala;;E. Quiricoa, J. Borga, et al., Planetary and Space Science 48 (2000) 1329 Space Science_2
Silicate Bonded and free H2O and/or OH
modes Aliphatic-type
organic material
Higher levels of aliphatic materials, simpler water
structure

primary goal of the Stardust mission was to collect samples of a comet (81P/Wild2) and return them to Earth for laboratory analysis. Comets are ancient bodies of frozen ice and dust that formed beyond the orbit of the most distant planet. They were expected to contain materials that the solar system formed from, preserved in ice for billions of years. Before the mission, there were very good reasons to believe that we knew what comets would be made of and there was a general expectation was that the particles collected from comet Wild 2 would be mainly be dust that formed around other stars, dust that was older than the Sun. Such particles are called stardust or pre-solar grains and this was the main reason why the mission was named Stardust.
The STARDUST MISSION
[from: http://stardust.jpl.nasa.gov/news/news116.html]
Optical snapshot of the original aerogel surface exposed to the comet
Space Science_3
January 2004- January 2006)

C2009,7,62
C2009,4,59
CH2
CH3
C=O
CH2
It is clear that the population of cometary particles impacting the Stardust aerogel collectors also include
grains that contained little or none of this volatile organic component. This observation is consistent
with the highly heterogeneous nature of the collected grains, as seen by a multitude of other
analytical techniques.
Infrared spectroscopy maps of some tracks, made by cometary dust from 81P/Wild 2 impacting Stardust aerogel, reveal an interesting distribution of volatile organic material [-CH2- rich].
S. Bajt, S. A. Sandford, G. J. Flynn et al., 2009 MAPS 44, 471
Space Science_3

Earth science: mimicking extreme conditions
750 km 25 GPa, 2700 °C
3200 km 150 GPa, 3700 °C
mantle
core
120 km 4 GPa, 2500 °C
DAC Diamond Anvil cell
Earth Science_1
Force
Diamond
Gasket
Sample
Pressure range: 0.1 Gpa 30 Gpa Temperature range: from 4.3K

Effect of H2O on upper mantle phase transition in MgSiO3
A short introduction The X discontinuity is an intermittently observed upper mantle discontinuity, that lies at a depth of 250-350 km. This boundary is most typically observed in regions of active mantle dynamics, including subduction zones and volcanic hotspots. The X-discontinuity is not a global feature, but it is geologically widespread beneath stable continents. Upper mantle and transition zone seismic discontinuities are among the most important physical observable of the mantle for remotely interpreting temperature, compositions and mineralogy of the interior. Whereas depths and topography of the global discontinuities correspond to well-characterized phase transformations in (Mg,Fe)2SiO4 polymorphs, the X-discontinuity has eluded obvious explanations. It is difficult to explain its behavior in terms of a single mineralogical phase transition in part because of its depth variability.
Jacobsen, SD, Liu Z, Ballaran TB, Littlefield EF, Ehm L, and Hemley RJ (2010) Physics of the Earth and Planetary Interiors 183:234-244.
The pressure variation alone at the X discontinuity can not exhaustively explain its properties
The effects of water content in clinoenstatite (a monoclinic magnesium-iron pyroxene with Mg substantially in excess of iron) was studied by infrared spectroscopy on enstatite, MgSiO3-pyroxene.
Earth Science_2

LPCen
Main results
A decrease in the transition pressure on compression by about 1.3GPa for 900ppm H2O was observed. Whereas most hydrogen bonds in the structure become shorter (stronger) on compression, a few exceptions occur. The dominant band at 3602 cm-1 decrease to background absorbance up to 8,3GPa for 450ppm weight H2O, and a new OH-stretching band at 3480 cm-1 appears above 4.8GPa for 900ppm weight H2O.
Earth Science_3
Room pressure OH-bearing clinoenstatite OH stretching bands: 3688, 3676, 3602, 3555, and 3491 cm

Current trends in Cultural Heritage Science using synchrotron-based FTIR micro-spectroscopy
BMM35 Fragment of a wall painting in cave, in the Bamiyan site, Afghanistan. Buddhist painting techniques, around 5th-9th centuries
Protein-based (Amide band 1650 cm-1) Use of egg white or animal glue
Hydrocerussite (Pb3(CO3)2(OH)2) (OH stretching 3524 cm-1) Lead carbonates entering into lead white composition
Carboxylates (C=O stretching 1550 cm-1) reaction of oil esters with some inorganic compounds;; mix of lead and copper soaps
1 yellowish transparent layer 2 green layer 3 black layer 4 white ground 5 transparent brownish layer
From Cotte M, Dumas P, Taniguchi Y, Checroun E, et.al., C.R. Physique 10 (2009)
Experimental conclusions are supported by micro-Xray diffraction and fluorescence for elemental analysis
Cultural Heritage_1

Biology is the branch of natural science that studies life and living organisms.
The building blocks of life are the cells
Cell
Tissue
Organ
Organism
The study of the chemical processes in living organisms is the subject of
Biochemistry It deals with the structures and functions of cellular components such as proteins, carbohydrates, lipids,
nucleic acids and other biomolecules Biological an biomedical applications of SR-IRMS_1

1705-1690 : C=O RNA
1660-1650 : C=O DNA
1700-1600
1660-1650 : C=O RNA
1700-1600: Amide I
80% C=O + 10% C-N +10% N-H
1600-1500 1600-1500: Amide II
40% C-N + 60% N-H
Adapted from: L. M. Miller, G.D. Smith and G. L. Carr, Journal of Biological Physics, 29 (2-3), 219-230, 2003
50%
10%
15%
15%
Dry mass
content
The eukaryotic cell spectrum
Biological an biomedical applications of SR-IRMS_2

2950-2960 : as (CH3)
2915-2925 : as (CH2)
2867-1877 : s (CH3)
2845-2855 : s (CH2)
Saturated Acyl chains
> 3000 : (=CH)
Unsaturated Acyl chains
1700-1750 : (C=O)
Ester Band
50%
10%
15%
15%
Dry mass
content
The eukaryotic cell spectrum
Biological an biomedical applications of SR-IRMS_3

1244 : as PO2- RNA
1230 : as PO2- DNA
1250-1200
1100-1050 1089 : s PO2- DNA
1084 : s PO2- RNA
1100-1000 DNA and RNA ribose
C-O
Complex network of carbohydrate bands
50%
10%
15%
15%
Dry mass
content
The eukaryotic cell spectrum
Biological an biomedical applications of SR-IRMS_4

Band intensity, position, width and shape (band components) are sensitive to subtle biochemical changes of bio-specimens.
The eukaryotic cell spectrum
Biological an biomedical applications of SR-IRMS_5

Water: ~ 70% of the cell weight Dry mass: ~ 50% of proteins ~ 15% of carbohydrates ~ 15% of nucleic acids ~ 10% of lipids ~ 15% other molecules
For the sampled volume: ~ 48% extra cellular water ~ 36% intra cellular water ~84% of water
water ~ 20 L·∙mol-1·∙cm-1
Amide I water [C] water [C] protein
H-O-H Bending
O-H Stretching
Combination Band H2O
Air background
The water absorption barrier
Biological an biomedical applications of SR-IRMS_6
Dried cell spectrum
Living cell spectrum

Sample preparation Bio-samples
Living
Microfluidic devices
Open Channel
Close Channel
ATR geometry
Dual Element
Fixed
Thin tissue slides Single cells
Microspectroscopic Evidence of Cretaceous Bone Proteins Prion Disorders
IRMS of living versus fixed cells Real-time chemical imaging of bacterial activity in biofilms Dual element ATR
Biological an biomedical applications of SR-IRMS_7

Late Cretaceous mosasaur: Prognathodon
Existing monitor lizard: Varanus exanthematicus
Globar 140x140 µm
SR 10x10 µm
Microscopic Evidence of Cretaceous Bone Proteins
Bact
eria
Gra
m-p
osit
ive
From Lindgren J, Uvdal P, Engdahl A, Lee AH, Alwmark C, et.al. (2011) PLoS ONE 6(4)
Demineralized bone sample Transmission measurement
Biological an biomedical applications of SR-IRMS_8

Aberrant metabolism of the Prion Protein (PrP)
PrPC
Alpha-helical Protease sensitive
PrPSC PrPCJD
beta- plated sheet Protease resistant
Prion rods
PNAS
199
9 vo
l. 96
no.
26
1513
7-15
142
PrP amyloid plaques
PNAS
1998
vol
. 95
no. 2
3 13
363-
1338
3
Biological an biomedical applications of SR-IRMS_9

A. Kretlow wt al., FTIR-microspectroscopy of prion-infected nervous tissue, Biochimica et Biophysica Acata (BBA) Biomembranes (2006), 7:948-959
M. Beekes et al., Analytical applications of Fourirer transform-infrared (FT-IR) spectroscopy in microbiology and Prion research, Veterinary microbiology (2007), 123:305-319
SR-IRMS and prion research FTIR spectroscopy has been largely employed for studying the conformational changes associated to the conversion of PrPC into PrPSc
PrPC 42% -helix;; 3% -sheet // PrPSc < -helix;; > -sheet Phenotype dependent
IRMS is able to distinguish between scrapie (S) and normal (N) brain tissues but the spectroscopic differences between different cerebellar substructures are much pronounced than disease alterations.
Differentiation is based on the superimposition of multiple contribution more than on the identification of structural protein alteration, evidenced only but not always in terminally ill animals (Dilution effect)
Tissue architecture complexity is limiting the understanding of cellular bases of disease
Biological an biomedical applications of SR-IRMS_10

IRMS is a sensitive single-cell diagnostic tool for testing prion infection, faster than conventional Western blot PK digestion assay
A. Didonna, L. Vaccari, et al., ACS Chemical Neuroscience 2011 2 (3), 160-174
Sing
le c
ell s
ensi
tivi
ty
Exec
utio
n ti
me:
few
min
utes
Mul
tipl
e ce
ll se
nsit
ivit
y Ex
ecut
ion
tim
e: m
any
hour
s
Western blot
IRMS
SR-IRMS and prion research: a cellular study
Biological an biomedical applications of SR-IRMS_11

IRMS revealed the biochemical reasons of classification
Increase Glu and Asp protonated aminoacid 1425-1357 cm-1
GT1
ScGT1
Down-regulation in protein and lipid synthesis upon prion infection was elicited by semi-quantitative analysis
GT1 ScGT1
AFM: GT1 and Sc-GT1 have comparable pyramid like shape and effective cell
height
Proteins Nucleic ac.
Lipids
~ -27%
~ -26%
~ -31%
Biological an biomedical applications of SR-IRMS_12

IRMS revealed an increase in both number and dimension of lysosomal compartments upon prion infection
Proteins Lipids Phospholipids
GT1
ScGT1
The synergic matching of IRMS with complementary investigation tools is a winning strategy for shining a light on cellular phenomena behind prion
infection Biological an biomedical applications of SR-IRMS_13

SR-IRMS of living cells: toward label-free single-cell based assay
Label-free analytical methods that monitor living cells under physiological conditions for tracking the biochemical modification they undergo during their
life cycle, both naturally occurring or once perturbed by external stimuli. Single-cell or better sub-cellular resolution is desirable.
Intra and inter cellular
dynamics
Label free
technique
Physiological conditions
Cellular and sub-cellular resolution
Probes can tune the cellular response
Fixation affects cellular morphology and
biochemistry, allowing
Biological an biomedical applications of SR-IRMS_14

Strategies for living cell sampling For disclosing cellular IR features, and in particular protein Amide I band, the spectral contribution of water has to be limited:
By reducing the sampling depth within the cell: ATR sampling Suitable for prokaryotic cells , very thin adherent cells or special applications where the outermost cell layers are investigated
By recording transmission or transflection spectra of living cells in liquid devices thinner than 9 microns for avoiding bending water band saturation and allowing water subtraction. A microfabrication approach is needed for controlling the water layer thickness and microchannel geometry.
Materials conventionally employed for IR transmission measurements are not standard for microfabrication
I0 I
I0
I
Substrate
Water layer
I0 I
The IR spectral shape of both transmission and transflection single cell spectra are affected by Resonant Mie scattering effects. Standing waves artifacts further complicate the interpretation of transflectance measurements.
Biological an biomedical applications of SR-IRMS_15

Resonant Mie scattering The anomalous modulation of the baseline of single cell spectra both in absorbance and transflection mode relates to the fact that the Mie scattering efficiency is dependent upon the refractive index of the sample (or better is ratio with the surrounding environment) and it changes on passing through an absorption resonance.
Thanks to the closer matching between the cell-water refractive indexes in the MIR, Mie scattering effects are minimal for living cell spectroscopy. RMieS algorithm has been developed for minimizing the Resonant Mie Scattering
Transflectance spectra are further complicated by the electric field standing wave effect and in these cases the change in absorbance with thickness does not follow the BeerLambert relationship.
Electrical field standing waves
Jacob Filik , Mark D. Frogley , et al., Analyst, 2012, 137, 853-861
Paul Bassan, Achim Kohler, et al., Analyst, 2010, 135, 268-277
Biological an biomedical applications of SR-IRMS_16

Sampling technique
Material Vis-Transparent
MIR- Transparent
MIR-Reflective
Biocompa-tibility
Other
Transflection MirrIR-slides No No Totally Yes Cheap
Both Si, Ge No Partially Partially Yes Cheap
Transmission
Diamond Yes Partially No Yes Expensive +
BaF2 Yes Totally No No Expensive
CaF2 Yes Partially No Possibly Expensive
ZnSe Slightly Partially No No Expensive
Si3N4 Slightly Partially No Yes Fragile
TEM grids Yes Totally No Yes Fragile
The optimal IR substrate
Biocompatible, for performing cell culture on it IR transparent/reflective in the MIR
Vis transparent/reflective, to easily match Vis and IR data Cheap and/or recyclable Exploitable also for other investigation techniques
The microfluidic approach
Biological an biomedical applications of SR-IRMS_17

The design flexibility is superior to any other manufacturing approach The lateral resolution fits with the SR-
IRMS spatial resolution A nanometric control of the chip vertical
dimension is guaranteed It offers the possibility to integrate
many functionalities all together sorting, filtering, mixing capabilities A complete laboratory under your
Vis-IR microscope
Microfabrication Bio-MEMS for single cell analysis with SR-IRMS
Tissues molecules
1 Å 1 nm 1 µm 1 mm 1 m
1 aL 1 fL 1 pL 1 nL 1 µL 1 mL 1 L 1000 L
virus
Bacteria Cells Human Body
Nano techonogies Micro technologies
Biological an biomedical applications of SR-IRMS_16

UV-lithography
Sealing
Connection with Outer world
Made on CaF2 (raw or silicon coated) window using a positive tone photoresist X-ARP using a negative tone SU8 photoresist
Thermo-mechanical bonding Chemical bonding
Fully sealed microfluidic device for transmission measurements
Raw CaF2
CaF2 Silicon coated
Biological an biomedical applications of SR-IRMS_19 G. Birarda, et al., MNE (2010) Volume: 87,Pages: 806-809 G. Grenci, et al., MNE (2012) Accepted for publication

SR-IRMS of living versus fixed single-cells The cellular model U937
Circulating white blood cells Round shaped Average diameter 8-10 m
Formaline
Ethanol
Measured within fully sealed microfluidic CaF2 devices, NaCl 0.9% buffer and complete medium
Living
Biological an biomedical applications of SR-IRMS_20
H-O-H Bending
O-H Stretching
Combination Band H2O
Air background

Lipid region Nucleic acid region
Protein region Ethanol is dramatically altering both membrane order (increased disorder) and composition. It induces also protein aggregation and precipitation. Formalin is well preserving both cellular membranes and protein secondary structure, similarly to unfixed air-dried cells. However, unfixed cells are not stable in time Nucleic acid structure, and DNA especially, is affected by both formalin and ethanol as well as by air-drying
Biological an biomedical applications of SR-IRMS_21 Formalin Ethanol Living

Real time monitoring of cellular adaptive response U937 fMLP stimulation
0 20 40 60 80 100 120 1400,4
0,6
0,8
1,0
1,2
1,4
1,6
1,8
2,0
2,2
2,4
Amide I Amide II Lipids RNA A form
Abs
(a.u
.)
Time (Minutes)
U937 monocytes (average diameter 8-10 microns) D- Undeformed cells ( ) [9 m device] D Deformed cells ( ) [5 m device] D+ Extremely deformed ( ) [3 m device]
Mechanical deformation of U937 monocytes
Cellular behavior of compressed cells greatly differ from undeformed conditions
Protein expression and membrane extrusion have been monitored
Biological an biomedical applications of SR-IRMS_22
G. Birarda, L. Vaccari et al., Vibrational Spectroscopy (2010) Volume: 53,Pages: 6-11

Real-time Chemical imaging of bacterial activity in biofilms
Open channel geometry for transflectance measurements
Uptake of mitomycin-C (MMC) by Escherichia coli within a biofilm
Diversification processes in response to MCC toxicity have been revealed
From H-Y H. Holman et al., Analytical Chemistry, 81:8564 (2009)
Biological an biomedical applications of SR-IRMS_23
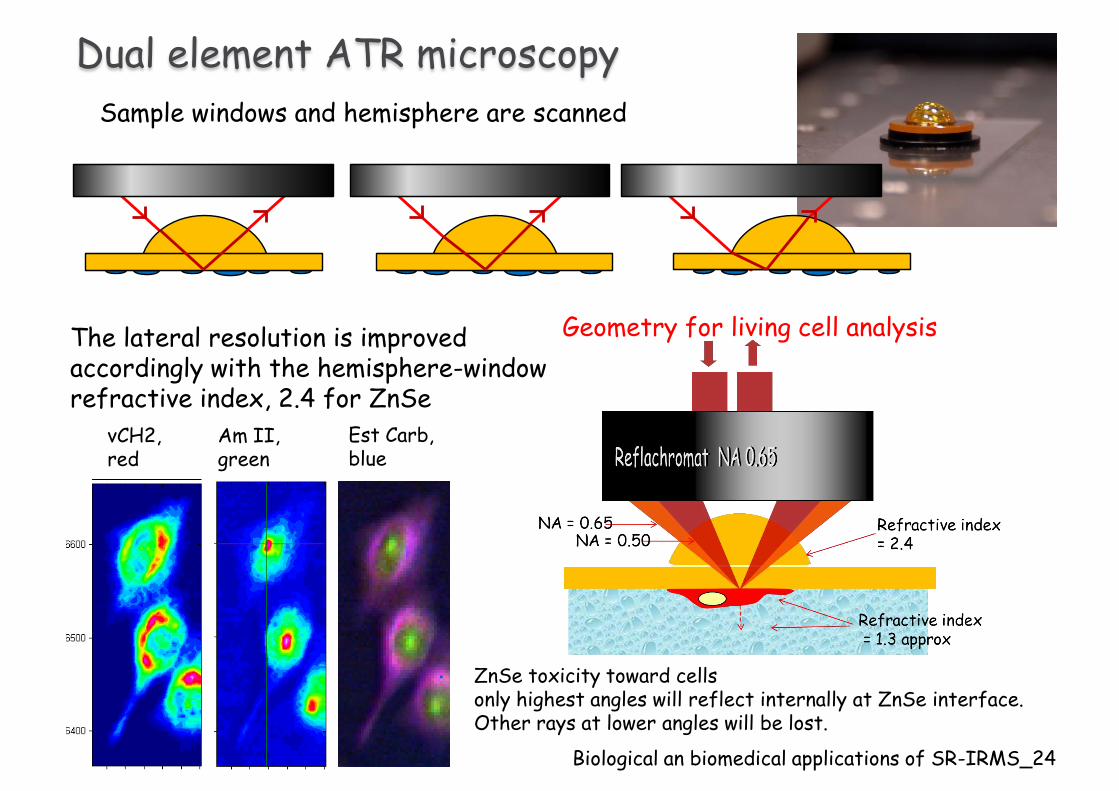
Dual element ATR microscopy
The lateral resolution is improved accordingly with the hemisphere-window refractive index, 2.4 for ZnSe
vCH2, red
Am II, green
Sample windows and hemisphere are scanned
Est Carb, blue
Geometry for living cell analysis
ZnSe toxicity toward cells only highest angles will reflect internally at ZnSe interface. Other rays at lower angles will be lost.
Biological an biomedical applications of SR-IRMS_24

Summary and conclusions FTIR spectroscopy and microspectroscopy are quite versatile tools for probing chemo-physical properties of matter Chemo-physical features of a sample can be resolved at diffraction limited spatial resolution by exploiting the brightness advantage of SR sources The SR brilliance is fundamental for the full exploitation of microspectroscopic capabilities in the MIR, where vibrational features of a sample are investigated Samples with different size, morphology, composition, origin and nature can be investigated by using the appropriate sample preparation and sampling technique The complementation of SR-IRMS with other investigation tools allows to shed some light on many field of science, such as space science, earth science, cultural heritage, life sciences and many others