Embed Size (px)
Citation preview

Electronic signature of the authorized signatories:
FECHA DE RECEPCIÓN / RECEPTION DATE: 12/12/2013 FECHA DE INICIO DE ENSAYO / STARTING DATE: 22/01/2014 FECHA DE FINALIZACIÓN DE ENSAYO / FINISHING DATE: 21/03/2014
ORGANISMO NOTIFICADO Nº / NOTIFIED BODY: No 1842 Reglamento/ Regulation (UE) no 305/2011
02/04/14
S-13-09174
INFORME/REPORT AT-0339/14 NV-12-2472
Nº DE HOJAS/ Nº of PAGES: 9 + ANEXO/ANNEX INFORME/REPORT UPV
EVROBION GROUP,S.L. ANTONIO SEQUEROS, Nº 83, PLANTA 3 03160 ALMORADI ALICANTE
EMPRESA/ COMPANY
D. / Mr. JORGE RODRIGUEZ CUNEO
PETICIONARIO/ PETITIONER

Nº DE PÁGINA Nº of page 2 of 10
INFORME/ REPORT AT-0339/14 NV-13-2472
Caracterización de planta de depuración de aguas residuales domésticas prefabricada según la norma UNE-EN 12566-3 (Marzo 2006): “Pequeñas instalaciones de depuración de aguas residuales para poblaciones de hasta 50 habitantes equivalentes. Parte 3: Plantas de depuración de aguas residuales domésticas prefabricadas y/o montadas en su destino” para cumplimiento del Reglamento (UE) nº 305/2011. Characterization of domestic wastewater according to standard UNE-EN 12566-3 (March 2006): “"Small wastewater treatment systems up to 50 PT. Part 3: Packaged and/or site assembled domestic wastewater treatment plants”, for compliance of Regulation (UE) no 305/2011.
.
A.- Determinación de la estanqueidad al agua según apartado 6.4.
B.- Determinación del comportamiento estructural según apartado 6.2.(*).
B.1. Propiedades en tracción según norma UNE EN ISO 527-2 (Noviembre 2012). A. - Watertightness according to section 6.4. B. - Structural behavior according to section 6.2. (*)
B.1. Tensile properties according to standard UNE-EN ISO 527-2 (November 2012).
(*)Ensayos no incluidos en el Alcance de la Acreditación Tests not included in the Scope of the Accreditation.
ENSAYOS
TESTS
OBJECTO
OBJECT

Nº DE PÁGINA Nº of page 3 of 10
INFORME/ REPORT AT-0339/14 NV-13-2472
Tests 1. - EVROBION 411, 511,811,1011,1511,2011,3011,4011,5011, 7511,10011,15011 A and B - Code: 13/2472/1
2.- MATERIAL SHEET B - Code: 13/2472/2
A.-Estanqueidad al agua.
(1) Ensayo/s:
- Método: ensayo del agua: se llena completamente la planta de depuración, con las conexiones cerradas herméticamente.
- Tiempo estabilización: 30 minutos (2) Probeta/s:
- Tipo: depuradora - Número de probetas: 1 A.- Watertightness.
(1) Test:
- Method: water test. - Stabilization time: 30 minutes
(2) Specimens:
- Type: small wastewater - Number: 1
METODOS DE ENSAYO TEST PROCEDURES
MUESTRAS
SAMPLES

Nº DE PÁGINA Nº of page 4 of 10
INFORME/ REPORT AT-0339/14 NV-13-2472 B.- Determinación del comportamiento estructural.
B.1. Propiedades en tracción.
(1) Ensayo/s:
- Velocidad de ensayo: 50 mm/min (1 mm/min para Módulo y Poisson) - Distancia entre mordazas: 115 mm - Célula de carga: 50 kN y 250 kN (Módulo y Poisson) - Tipo de mordazas: mecánicas - Exactitud de la máquina de ensayo (según ISO 7500): - Fuerza: Clase 0,5 - Indicador de desplazamiento: Clase 0,5
- Tipo de indicador de desplazamiento: extensómetro de pinzas (para Módulo y Poisson) y extensómetro óptico (para el resto de propiedades)
(2) Probeta/s:
- Naturaleza y forma del material: plancha - Tipo de probeta: tipo 1B - Preparación de probetas: mecanizado en máquina de control numérico - Dimensiones: se indican en las tablas de resultados - Nº de probetas: 5
- Acondicionamiento previo: 16 horas a (23 2) ºC y (50 10) % HR
(3) Condiciones ambientales:
T = (23 2) ºC
HR = (50 10) %
B.- Structural behavior.
B.1. Tensile properties.
(1) Test/s:
- Speed of test: 50 mm/min (1 mm/min for Modulus and Poisson) - Distance between grips: 115 mm - Gauge length: 50 mm - Load cell: 50 kN and 250 kN (Modulus and Poisson) - Grips: mechanical - Class machine (according to ISO 7500): - Force: Class 0,5 - Displacement indicator: Class 0,5
- Extensometer: optical extensometer and clip-on for Modulus and Poisson
(2) Specimen/s:
- Material: laminated - Type: type 1B
- Preparation: prepared by control numerical machine - Dimensions: are indicated in tables of results - Number of specimens: 5
- Conditioning: 16 hours at (23 2) ºC and (50 10) % RH
(3) Environment conditions:
T = (23 2) ºC
RH = (50 10) %
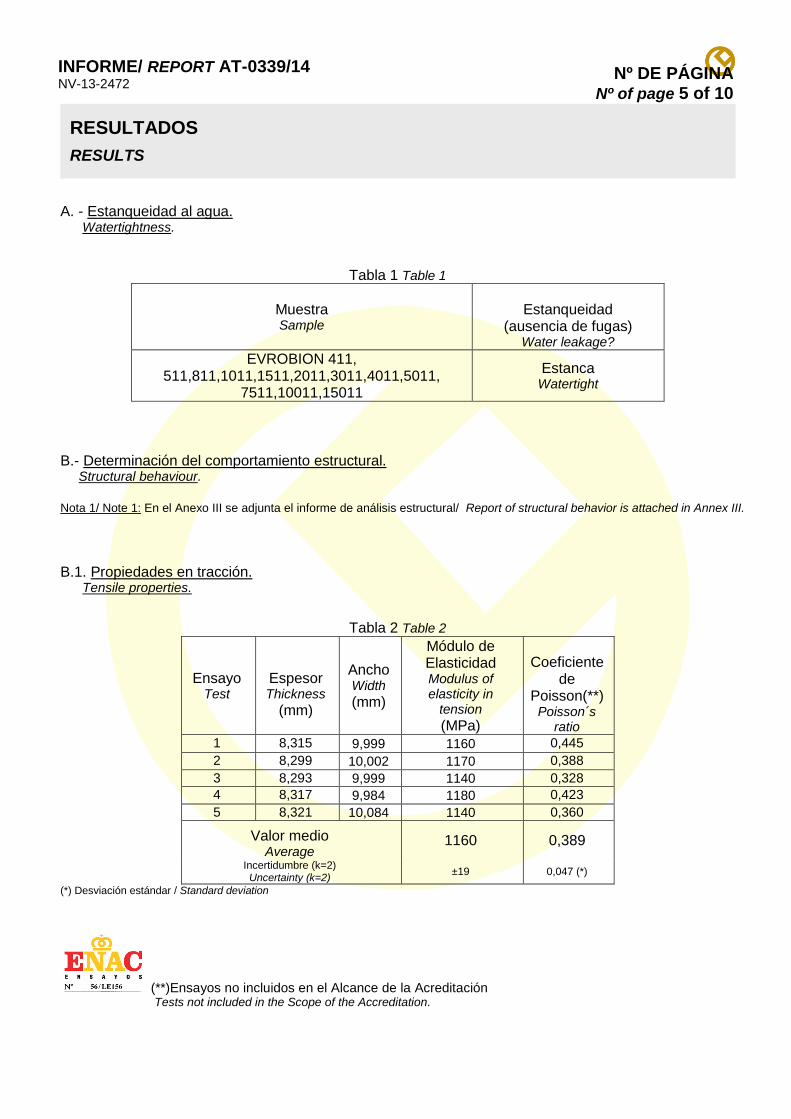
Nº DE PÁGINA Nº of page 5 of 10
INFORME/ REPORT AT-0339/14 NV-13-2472
A. - Estanqueidad al agua. Watertightness.
Tabla 1 Table 1
Muestra Sample
Estanqueidad
(ausencia de fugas) Water leakage?
EVROBION 411, 511,811,1011,1511,2011,3011,4011,5011,
7511,10011,15011
Estanca Watertight
B.- Determinación del comportamiento estructural. Structural behaviour.
Nota 1/ Note 1: En el Anexo III se adjunta el informe de análisis estructural/ Report of structural behavior is attached in Annex III.
B.1. Propiedades en tracción. Tensile properties.
Tabla 2 Table 2
Ensayo Test
Espesor Thickness
(mm)
Ancho Width
(mm)
Módulo de Elasticidad Modulus of elasticity in
tension
(MPa)
Coeficiente
de Poisson(**) Poisson´s
ratio 1 8,315 9,999 1160 0,445
2 8,299 10,002 1170 0,388
3 8,293 9,999 1140 0,328
4 8,317 9,984 1180 0,423
5 8,321 10,084 1140 0,360
Valor medio Average
1160 0,389
Incertidumbre (k=2) Uncertainty (k=2)
±19 0,047 (*)
(*) Desviación estándar / Standard deviation
(**)Ensayos no incluidos en el Alcance de la Acreditación Tests not included in the Scope of the Accreditation.
RESULTADOS
RESULTS
Nº DE PÁGINA Nº of page 6 of 10
INFORME/ REPORT AT-0339/14 NV-13-2472
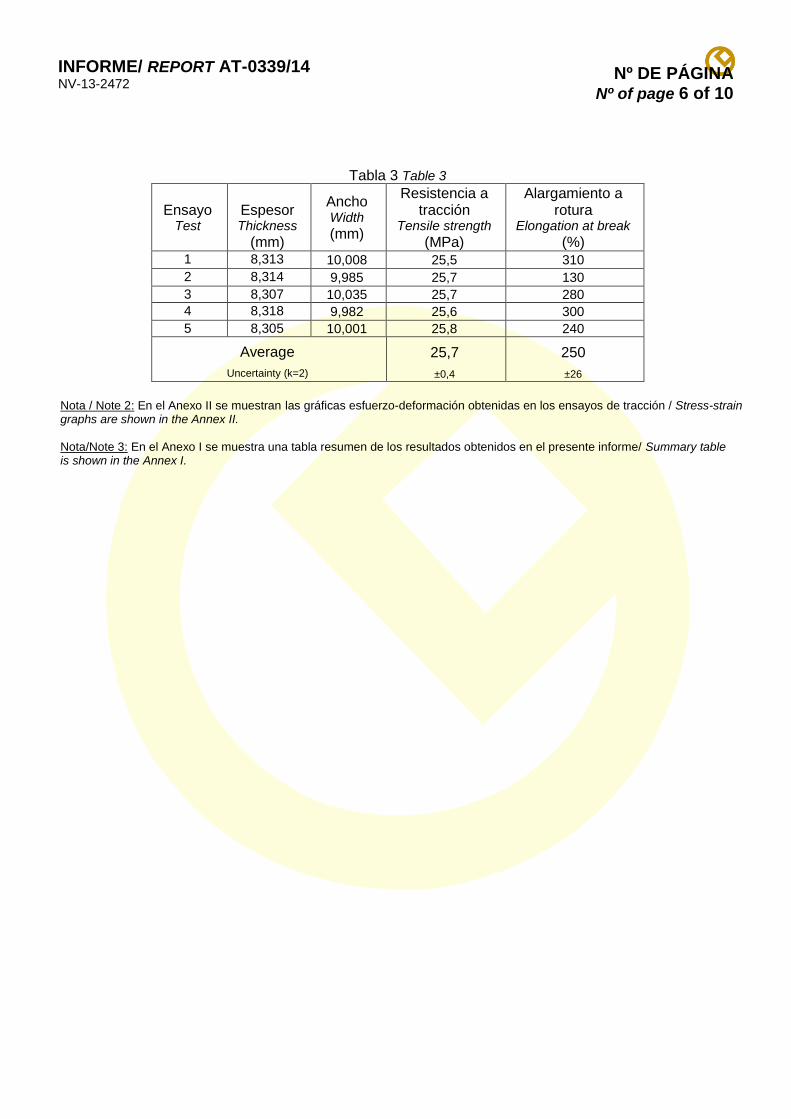
Tabla 3 Table 3
Ensayo Test
Espesor Thickness
(mm)
Ancho Width
(mm)
Resistencia a tracción
Tensile strength
(MPa)
Alargamiento a rotura
Elongation at break
(%) 1 8,313 10,008 25,5 310
2 8,314 9,985 25,7 130
3 8,307 10,035 25,7 280
4 8,318 9,982 25,6 300
5 8,305 10,001 25,8 240
Average 25,7 250
Uncertainty (k=2) ±0,4 ±26
Nota / Note 2: En el Anexo II se muestran las gráficas esfuerzo-deformación obtenidas en los ensayos de tracción / Stress-strain graphs are shown in the Annex II.
Nota/Note 3: En el Anexo I se muestra una tabla resumen de los resultados obtenidos en el presente informe/ Summary table is shown in the Annex I.

Nº DE PÁGINA Nº of page 7 of 10
INFORME/ REPORT AT-0339/14 NV-13-2472
TABLA RESUMEN SUMMARY TABLE
Ensayo Test
Muestra Sample
Resultado
Result
Estanqueidad al agua
Watertightness EVROBION 411,
511,811,1011,1511,2011,3011,4011,5011, 7511,10011,15011
Estanca Watertight
Comportamiento structural
Structural behaviour
Ver Anexo III See Annex III
ANEXO I ANNEX I

Nº DE PÁGINA Nº of page 8 of 10
INFORME/ REPORT AT-0339/14 NV-13-2472
Fig. 1: Stress-strain graph of tensile test
Fig. 2: Stress-strain graph of Modulus tensile test and Poisson´s ratio
0 100 200 300
0
10
20
30
Def ormación en %
Tensió
n e
n M
Pa
0 1 2 3 4 5
0
5
10
15
20
Deformación en %
Esfu
erz
o e
n M
Pa
ANEXO II ANNEX II

Nº DE PÁGINA Nº of page 9 of 10
INFORME/ REPORT AT-0339/14 NV-13-2472
1.- AIMPLAS responde únicamente de los resultados sobre los métodos de análisis consignados en el informe y referidos exclusivamente a los materiales o muestras que se indican en el mismo, limitando a éstos la responsabilidad profesional y jurídica del Centro. Salvo mención expresa, las muestras han sido libremente elegidas, referenciadas y enviadas por el solicitante.
2.- Este Instituto no se hace responsable en ningún caso de la interpretación o uso indebido que pueda hacerse de este documento, cuya reproducción total o parcial sin la autorización de AIMPLAS está totalmente prohibida.
3.- Los resultados se consideran como propiedad del solicitante y, sin autorización previa, AIMPLAS se abstendrá de comunicarlos a un tercero.
4.- Ninguna de las indicaciones formuladas en este informe puede tener el carácter de garantía para las marcas comerciales que en su caso se citen.
5.- Ante posibles discrepancias entre informes, se procederá a una comprobación dirimente en la sede central del Instituto. Así mismo, el solicitante se obliga a notificar a este Centro cualquier reclamación que reciba, con causa en el informe, eximiendo a este Centro de toda responsabilidad caso de no hacerlo así.
1.- AIMPLAS is responsible only for results obtained from the analytical methods cited in this report. Results exclusively refer to the materials and samples mentioned herein, the legal and professional responsibility of the Institute will be restricted to said materials and samples. Unless otherwise stated, the samples have been freely selected, indexed and provided by the client.
2.- The Institute assumes no responsibility for any misinterpretation or misuse of this document. Partial or total reproduction of this document without prior authorisation by AIMPLAS is strictly forbidden.
3.- The results are considered the property of the client. Without prior authorisation, AIMPLAS will not disclose them with any third party. However, one month after the results are delivered, they may be published by AIMPLAS for scientific or statistical purposes.
4.- No information contained in this report constitutes a guarantee for the trademarks cited, if any.
5.- In the event of any discrepances within reports, a final verification will be carried out at the Institute’s head office. The client undertakes to inform the Institute of any complaint it may receive regarding this report. Failure to do so exempts the Institute from any responsibility. To this effect, the period stated below must be taken into account.
PRESCRIPCIONES CONDITIONS
Departament of Mechanical Engineering and Materials
Technical University of Valencia, Spain
Camino de Vera, s/n Apto. correos 22012
46022 Valencia (Spain) Teléfono 34-6-3877620
Fax 34-6-3877629
R E P O R T
Requested by: AIMPLAS
Valencia, March 2014
STRUCTURAL ANALYSIS OF TANK EUROBION USING FINITE ELEMENTS

Departament of Mechanical Engineering and Materials
Technical University of Valencia, Spain
Camino de Vera, s/n Apto. correos 22012
46022 Valencia (Spain) Teléfono 34-6-3877620
Fax 34-6-3877629
C O N T E N T S
1. PURPOSE OF THE REPORT.............................................................................. 1 2. DESCRIPTION OF THE GEOMETRICAL MODEL............................................. 1 2.1. Import and adaptation of the geometrical model......................................... 1 2.2. Material properties and wall thickness ......................................................... 2 3. FINITE ELEMENT MODEL.................................................................................. 3 3.1. Displacement boundary conditions .............................................................. 4 3.2. Applied loads and units .................................................................................. 5
3.2.1. Hydrostatic load ................................................................................... 6 3.2.2. Terrain load.......................................................................................... 7
3.2.2.1. Terrain load. Vertical component. ............................................... 7 3.2.2.2. Terrain load. Horizontal component............................................ 9
3.2.3. Terrain load combined with hydrostatic pressure due to high water table ............................................................................................................. 11 3.2.4. Dynamic loads ................................................................................... 14
4. RESULTS ........................................................................................................... 14 4.1. Hydrostatic pressure due to water contained in the tank......................... 14 4.2. Terrain load .................................................................................................... 16 4.3. Terrain load combined with hydrostatic pressure due to high water table........................................................................................................................ 18 5. SUMMARY AND CONCLUSIONS .................................................................... 20

1
1. PURPOSE OF THE REPORT The purpose of this report elaborated by CITV is to present the results obtained after performing a finite element structural analysis of the sewage plant EUROBION. The finite element code used for the analysis is ANSYS 13. The study has been carried out on the geometrical model of the EUROBION provided by AIMPLAS. Some of the mechanical properties of the material have been supplied by AIMPLAS after experimental testing. Other properties have not been determined experimentally and have been ascertained by CITV. The main objective of this analysis is to assess whether or not the EUROBION tank can withstand the structural loads in accordance with the standards AENOR UNE-EN 12566-1:2000 and 12566-3.
2. DESCRIPTION OF THE GEOMETRICAL MODEL 2.1. Import and adaptation of the geometrical model AIMPLAS provided the geometrical model to the CITV by means of an exchange file type Parasolid, extension .X_T. Some modifications have been introduced regarding areas and volumes so as to ease the subsequent mesh operations. The main dimensions of the tank are given in Table 2.1.:
Table 2.1. Main dimensions of the tank.
Certain modifications have been introduced in order to ease the mesh operation. These include:
• Deletion of redundant points, lines and areas. • Partition into areas that enable mesh generation. • Joining of adjacent areas to build up a seamless model. • Deletion and merging of small lines and areas, which can pose difficulties to the
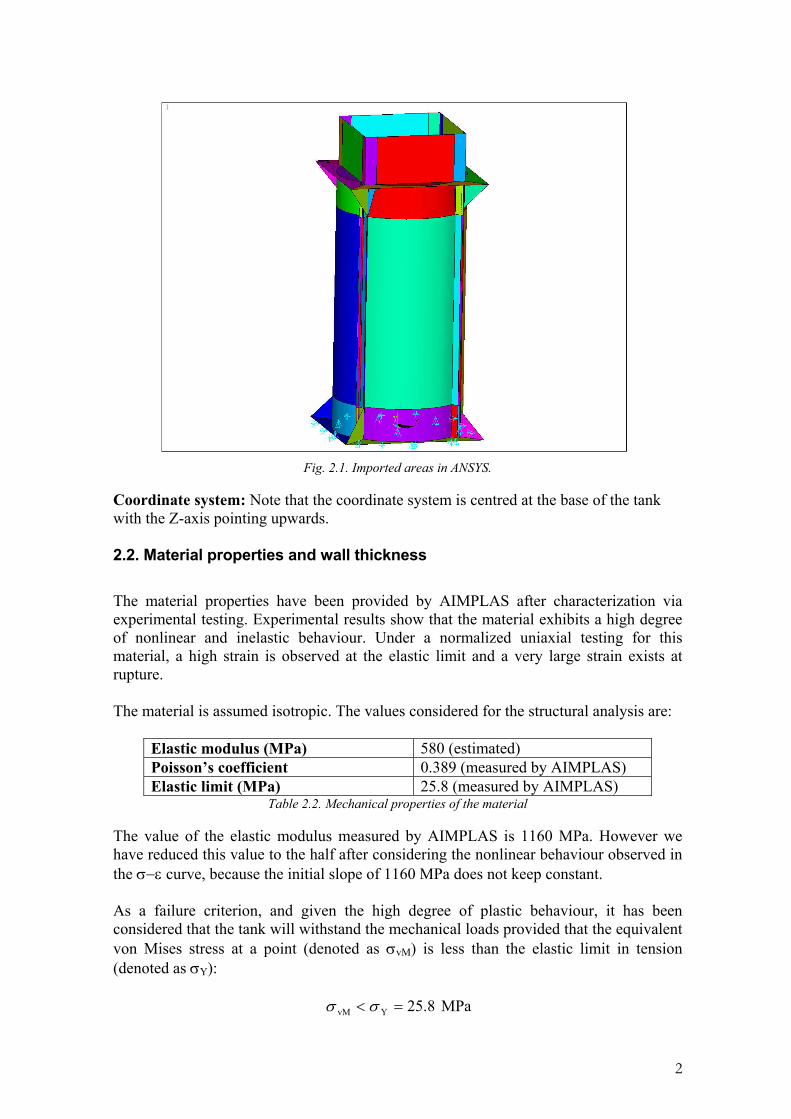
mesh generation. After importing the CAD .X_T file into ANSYS and performing the above geometric model operations, the resulting areas are shown in Fig. 2.1.:
Max. width 1080 mm Height 2405 mm
2
Fig. 2.1. Imported areas in ANSYS.
Coordinate system: Note that the coordinate system is centred at the base of the tank with the Z-axis pointing upwards. 2.2. Material properties and wall thickness The material properties have been provided by AIMPLAS after characterization via experimental testing. Experimental results show that the material exhibits a high degree of nonlinear and inelastic behaviour. Under a normalized uniaxial testing for this material, a high strain is observed at the elastic limit and a very large strain exists at rupture. The material is assumed isotropic. The values considered for the structural analysis are:
Elastic modulus (MPa) 580 (estimated) Poisson’s coefficient 0.389 (measured by AIMPLAS) Elastic limit (MPa) 25.8 (measured by AIMPLAS)
Table 2.2. Mechanical properties of the material
The value of the elastic modulus measured by AIMPLAS is 1160 MPa. However we have reduced this value to the half after considering the nonlinear behaviour observed in the σ−ε curve, because the initial slope of 1160 MPa does not keep constant. As a failure criterion, and given the high degree of plastic behaviour, it has been considered that the tank will withstand the mechanical loads provided that the equivalent von Mises stress at a point (denoted as σvM) is less than the elastic limit in tension (denoted as σY):
8.25YvM =< σσ MPa

3
After reaching the elastic limit, the material still withstands a large amount of plastic strain at a high load. Therefore, setting the maximum allowable stress as the elastic limit gives an additional safety margin and the analysis results will be clearly conservative. AIMPLAS has provided the average wall thickness in the range 8.01 and 8.24 mm. In the analysis, we have considered the lower bound of these values (thickness = 8 mm) in order to be on the conservative side. The wall thickness has been considered constant all over the tank elements.
3. FINITE ELEMENT MODEL Two finite element types have been used in the numerical model:
• Eight-node shell element, SHELL281. These elements constitute the basic mesh of the finite element model. SHELL281 is particularly well suited to model curved shells. The element has six degrees of freedom at each node: translations in the nodal x, y, and z directions and rotations about the nodal x, y, and z-axes. The deformation shapes are quadratic in both in-plane directions. The thickness is constant throughout the whole element and has a value of 8.0 mm. The average element size is about 20 - 30 mm, depending on the tank zone.
• Surface effect element SURF154. These elements are overlaid on the previous
SHELL281 elements in order to apply surface loads in a given specific direction (such as in the case of terrain loads). They have no structural purpose. A very low thickness has been assigned to them (10-6 mm).
Fig. 3.1. Finite element mesh showing SHELL281 elements.

4
Fig. 3.2. Detail showing the true thickness considered for elements SHELL281 (thickness = 8 mm).
Figures 3.1 and 3.2 show the finite element mesh. The computational cost of this model is not high. The mesh has 51375 nodes and 17323 SHELL281 elements. The total number of elements including SURF154 elements is 41976. 3.1. Displacement boundary conditions For the displacement boundary conditions, it is assumed that the tank is simply supported on the ground. Vertical displacements are constrained for all nodes on the base (no displacement in the Z-direction of the model reference coordinate system is allowed). Other constraints in the X and Y direction have been included to avoid rigid solid motions. The displacement constraints are shown in Figs. 2.1 and 3.3.

5
Fig. 3.3. FE mesh showing displacement boundary condtions.
3.2. Applied loads and units We have followed the standard AENOR UNE-EN 12566-1:2000 entitled “Small wastewater treatment systems for up to 50 PT. Part 1: prefabricated septic tanks” (in Spanish). This standard includes the consideration of the following mechanical loads:
a) Hydrostatic load. b) Terrain load.
c) Combined terrain load and hydrostatic load due to eventual high water table.
d) Dynamic load.
In what follows, details regarding these loads are given. The results will be reported in Section 4. UNITS: In the finite element model, the length unit is meter (m) and the force unit is N. Reported units of pressure and stresses are N/m2, which are equivalent to Pa.

6
3.2.1. Hydrostatic load
The first load considered is the hydrostatic load due to the inner contained water. The hydrostatic pressure on the tank walls is given by the law:
Pwater = ρ ·g ·h where
ρ is the water density, 1000 kg/m3
g is the gravity acceleration, 9.81 m/s2
h is the water column height above the considered point. Therefore, the highest water pressure will occur at the bottom of the tank. The hydrostatic pressure increases gradually from the free surface to the bottom. Assuming the tank is totally full up to the beginning of the manhole neck (h=2.030 m), the hydrostatic pressure is distributed linearly on the inner surface of the model between the following extreme values:
POSITION (measured from tank bottom)
HYDROSTATIC PRESSURE
z = 2.030 m 0 Pa z = 0 m 19914 Pa
Table 3.1. Hydrostatic pressure due to contained water.
This linear distribution has been introduced in the finite element model by means of the appropriate commands. Fig. 3.4. shows the distributed hydrostatic pressure within the range shown in Table 3.1.
Fig. 3.4. Distributed hydrostatic pressure (in Pa) due to contained water.
7
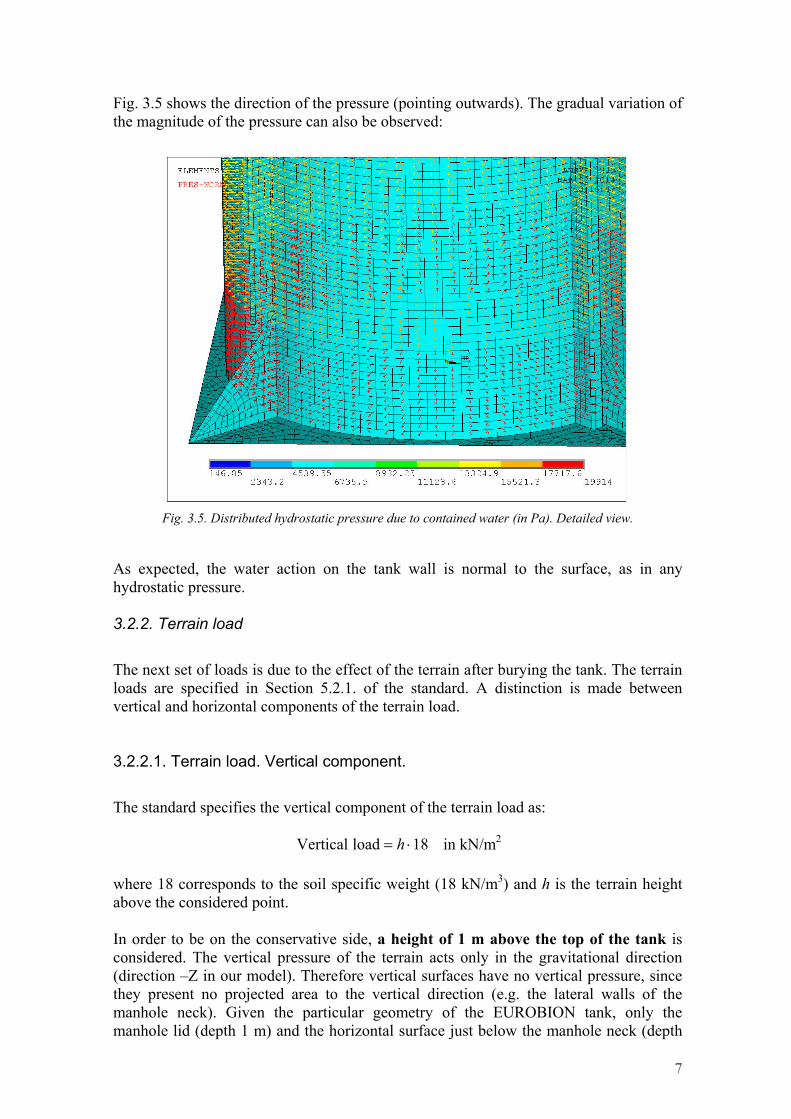
Fig. 3.5 shows the direction of the pressure (pointing outwards). The gradual variation of the magnitude of the pressure can also be observed:
Fig. 3.5. Distributed hydrostatic pressure due to contained water (in Pa). Detailed view.
As expected, the water action on the tank wall is normal to the surface, as in any hydrostatic pressure. 3.2.2. Terrain load
The next set of loads is due to the effect of the terrain after burying the tank. The terrain loads are specified in Section 5.2.1. of the standard. A distinction is made between vertical and horizontal components of the terrain load. 3.2.2.1. Terrain load. Vertical component.
The standard specifies the vertical component of the terrain load as:
18loadVertical ⋅= h in kN/m2 where 18 corresponds to the soil specific weight (18 kN/m3) and h is the terrain height above the considered point. In order to be on the conservative side, a height of 1 m above the top of the tank is considered. The vertical pressure of the terrain acts only in the gravitational direction (direction –Z in our model). Therefore vertical surfaces have no vertical pressure, since they present no projected area to the vertical direction (e.g. the lateral walls of the manhole neck). Given the particular geometry of the EUROBION tank, only the manhole lid (depth 1 m) and the horizontal surface just below the manhole neck (depth
8
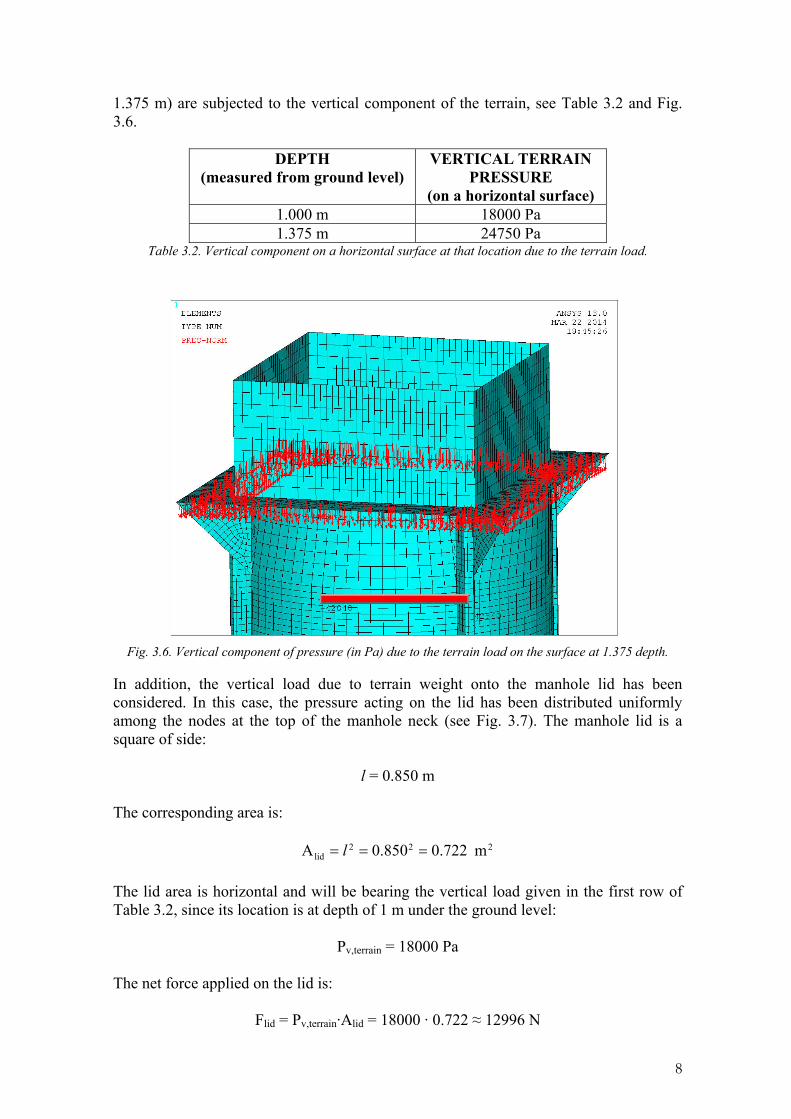
1.375 m) are subjected to the vertical component of the terrain, see Table 3.2 and Fig. 3.6.
DEPTH (measured from ground level)
VERTICAL TERRAIN PRESSURE
(on a horizontal surface) 1.000 m 18000 Pa 1.375 m 24750 Pa
Table 3.2. Vertical component on a horizontal surface at that location due to the terrain load.
Fig. 3.6. Vertical component of pressure (in Pa) due to the terrain load on the surface at 1.375 depth.
In addition, the vertical load due to terrain weight onto the manhole lid has been considered. In this case, the pressure acting on the lid has been distributed uniformly among the nodes at the top of the manhole neck (see Fig. 3.7). The manhole lid is a square of side:
l = 0.850 m The corresponding area is:
222lid m 0.722850.0A === l
The lid area is horizontal and will be bearing the vertical load given in the first row of Table 3.2, since its location is at depth of 1 m under the ground level:
Pv,terrain = 18000 Pa The net force applied on the lid is:
Flid = Pv,terrain·Alid = 18000 · 0.722 ≈ 12996 N

9
This total force is distributed among the nodes loacated on the rim of the manhole:
n = 296 nodes Therefore
fnode = Flid / n = 12996 / 296 ≈ 43.905 N per node Fig. 3.7 shows the distribution of nodal forces on the manhole rim. NOTE: Since the finite elements used in the analysis are quadratic (SHELL281), this distribution is not consistent with the finite element formulation. However, the net effect of the forces is the same at a small distance from the top.
Fig. 3.7. Distributed nodal forces due to the vertical load of the terrain on the manhole lid.
3.2.2.2. Terrain load. Horizontal component.
In Section 5.2.1. of the above mentioned standard, there are three different values of the terrain coefficient related to the internal angle of friction K, that depends on the filling material. We have used the most critical value (K = 0.5, corresponding to “any other filling material”), such that the horizontal component of the terrain load is given by the following expression:
185.018_loadHorizontal ⋅⋅=⋅⋅= DDK in kN/m2 where D is the distance from the ground level to the point considered, and 18 corresponds to the soil specific weight (18 kN/m3).
10
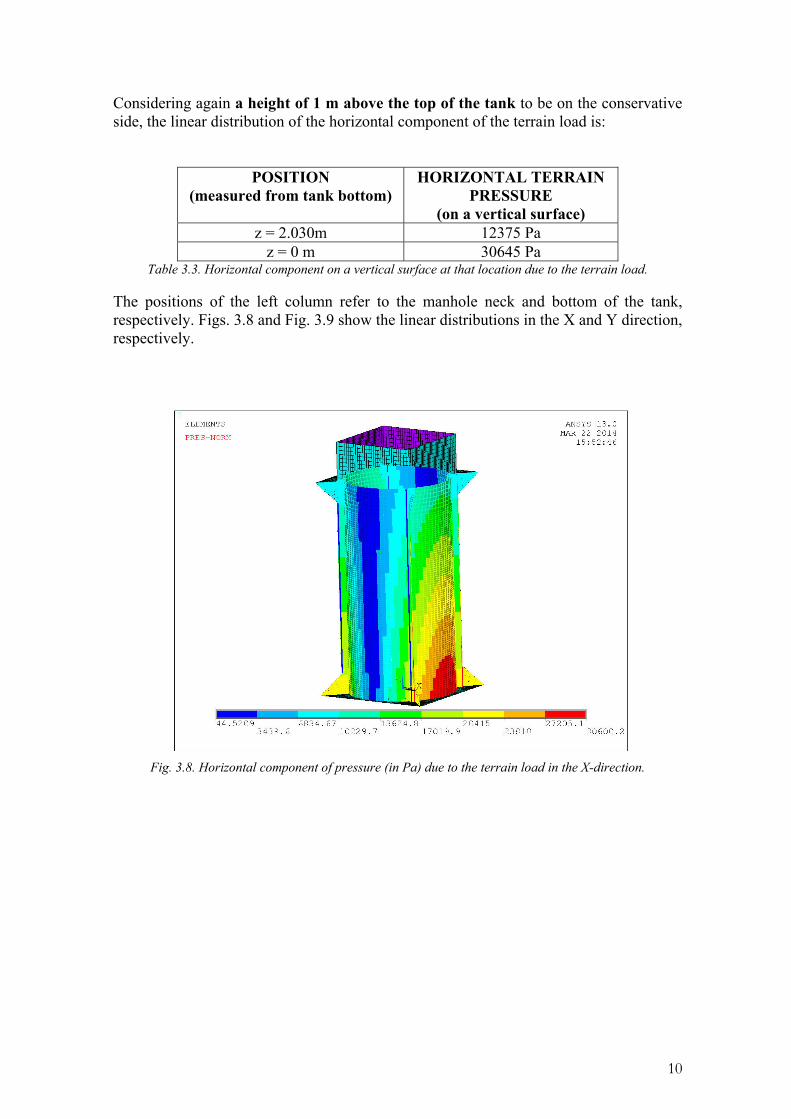
Considering again a height of 1 m above the top of the tank to be on the conservative side, the linear distribution of the horizontal component of the terrain load is:
POSITION (measured from tank bottom)
HORIZONTAL TERRAIN PRESSURE
(on a vertical surface) z = 2.030m 12375 Pa
z = 0 m 30645 Pa Table 3.3. Horizontal component on a vertical surface at that location due to the terrain load.
The positions of the left column refer to the manhole neck and bottom of the tank, respectively. Figs. 3.8 and Fig. 3.9 show the linear distributions in the X and Y direction, respectively.
Fig. 3.8. Horizontal component of pressure (in Pa) due to the terrain load in the X-direction.

11
Fig. 3.9. Horizontal component of pressure (in Pa) due to the terrain load in the Y-direction.
The pressure of the terrain acts mainly in the gravitational direction (direction –Z in our model) and only partially in the horizontal direction (hence the reduction factor K proposed by the norm for the horizontal component). As for the vertical component, the horizontal component at each finite element is multiplied by the projected area presented in the X or Y direction, respectively. For example, a vertical surface normal to the X direction will bear 100% of the horizontal load in the X-direction, but 0% of the horizontal load in the Y-direction. Since the horizontal load is not normal to the elements, special elements SURF154 have been used to apply this load. 3.2.3. Terrain load combined with hydrostatic pressure due to high water table
One critical case in the structural analysis arises when the tank is empty, and there is external pressure due to the concurrent action of the terrain and the hydrostatic pressure due to high water table. This loading case has been considered as follows:
- The water table height is assumed at the manhole neck level. This gives the same hydrostatic pressure distribution as in Section 3.2.1, although acting externally and pointing inwards (see Fig. 3.10).
- The vertical terrain load is exactly the same as in Section 3.2.2.1. - The horizontal terrain load is similar to the one described in Section 3.2.2.2.
although the soil specific weight is reduced from 18 kN/m3 to 10 kN/m3 as indicated in the standard for the horizontal component in presence of wet soil due to water table. The standard indicates that this reduction is applied to the

12
horizontal component only (see Figs. 3.11 and 3.12 showing the new values of the horizontal component of the terrain load in presence of water table).
Fig. 3.10. External hydrostatic pressure (in Pa) due to water table up to the manhole neck. Bottom:
enlarged view showing the external pressure vectors pointing inwards.

13
Fig. 3.11. Horizontal component of pressure (in Pa) due to the terrain load with water table
in the X-direction.
Fig. 3.12. Horizontal component of pressure (in Pa) due to the terrain load with water table
in the Y-direction. Regarding stability due to floating under the action of high water table, this must be guaranteed by the manufacturer. For the EUROBION tank this is not specially critical, since the projected surface on the horizontal direction is small (only the horizontal surface at the manhole neck).
14
3.2.4. Dynamic loads
In Section 5.2.3. of the above mentioned standard the eventual dynamic loads are considered. In subsection a), the standard states: “If the height of the terrain above the tank top is at least 1,00 m, any load due to pedestrians can be neglected in comparison to the rest of loads”. Since we have assumed that the terrain height above the tank is 1 m, we have neglected dynamic loads due to pedestrians. In the case of dynamic loads due to vehicles, the standard indicates that a specific design of a concrete basement must be carried out, including a concrete slab.
4. RESULTS This section presents the results for the different loading cases referred in Section 3. Special attention is paid to:
1. Maximum deflection. 2. Maximum principal stress.
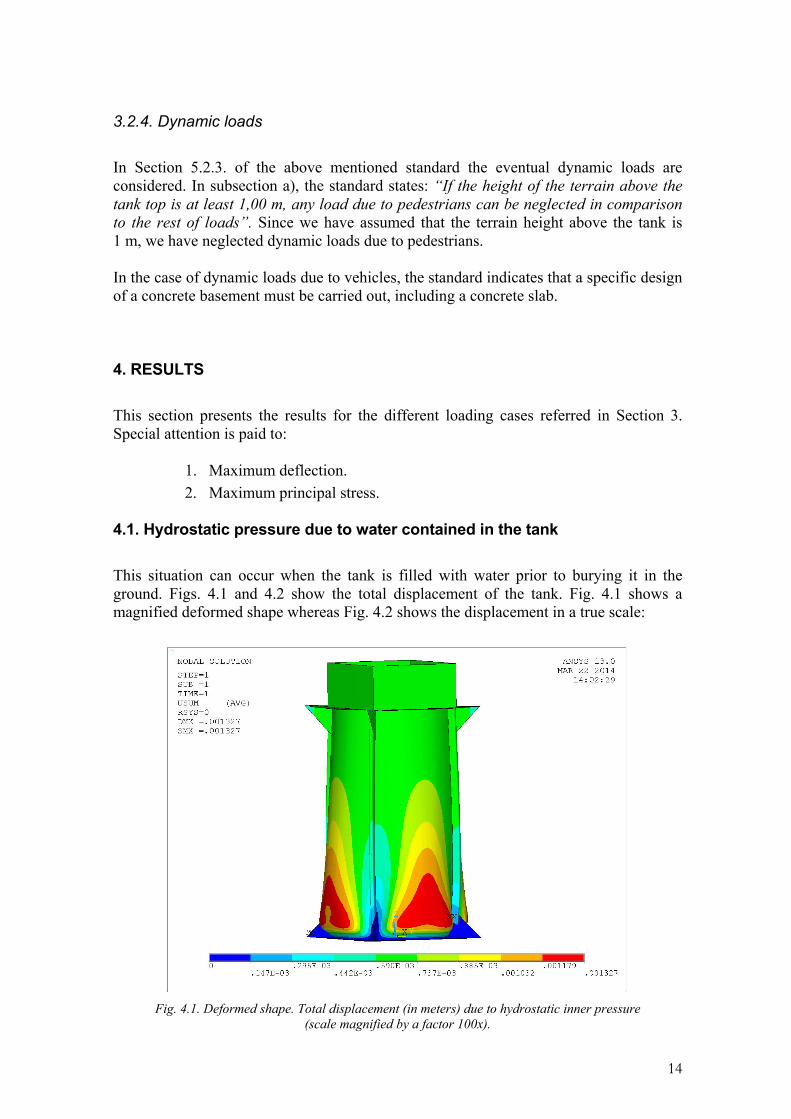
4.1. Hydrostatic pressure due to water contained in the tank This situation can occur when the tank is filled with water prior to burying it in the ground. Figs. 4.1 and 4.2 show the total displacement of the tank. Fig. 4.1 shows a magnified deformed shape whereas Fig. 4.2 shows the displacement in a true scale:
Fig. 4.1. Deformed shape. Total displacement (in meters) due to hydrostatic inner pressure
(scale magnified by a factor 100x).

15
Fig. 4.2. Deformed shape. Total displacement (in meters) due to hydrostatic inner pressure (true scale).
The predicted maximum displacement is 1.3 mm which is clearly acceptable when compared to the global dimensions of the tank. The maximum displacement occurs in the walls near the base.
Fig. 4.3. Von Mises equivalent stress (in Pa) due to hydrostatic inner pressure.
Fig. 4.3. shows the von Mises equivalent stress for this loading case. The maximum von Mises stress is 1.98 MPa, which is clearly less than the elastic limit of the material

16
(25.8 MPa as determined experimentally). The maximum values tend to occur at abrupt changes in geometry, which behave as localized stress raisers. In practice, stresses in these regions would be less than predicted, provided the finite element model is sufficiently discretized. This is because there are rounding and fillet radii in the real tank that have not been considered in the geometrical model. We can conclude that the tank withstands the hydrostatic load due to contained water. 4.2. Terrain load This loading case arises when the tank is empty and it is buried in the ground considering all components of the terrain loads (vertical, horizontal in X-direction and horizontal in the Y-direction). The maximum displacement (true scale) under this load is represented in Fig. 4.4 and the von Mises equivalent stress in Fig. 4.5.
Fig. 4.4. Deformed shape. Total displacement (in meters) due to terrain load (true scale).
The predicted maximum displacement is 42.7 mm and occurs at the horizontal surface at the manhole neck due to the vertical terrain load. This load has been taken as the one corresponding at a depth of 1.375 m, see Section 3.2.2.1, which is clearly a worst case scenario to be on the conservative side. The displacements obtained are considered acceptable when compared to the global dimensions of the tank and occur in a non critical region from the structural point of view. This region is not very stiff in the vertical direction, and hence the maximum displacement occurs in this zone. As a suggestion, this horizontal surface could be stiffened if the tank is going to be buried at a depth of 1 m under the ground level in service.

17
Fig. 4.5. Von Mises equivalent stress (in Pa) due to terrain load. Bottom, enlarged view.
Fig. 4.5. shows the von Mises equivalent stress for this loading case. The maximum stress is 15.7 MPa, which is less than the elastic limit of the material (25.8 MPa as determined experimentally). The maximum von Mises stress after considering the error bound is SMXB=26.4 MPa, which is also acceptable given the localized nature of the stress raisers. The highly localized maximum von Mises stresses occur at abrupt changes in geometry, which behave as stress raisers. In fact, the maximum in this tank occurs at the intersection of the horizontal surface and the manhole neck. In practice, stresses in these regions would be less than predicted, provided the finite element model is sufficiently discretized. This is because there are rounding and fillet radii in reality that have not been considered in the geometrical model. Local yield of this material will also exist and will redistribute the stress in the region. The rest of the tank is loaded at a very low stress level. We can conclude that the tank withstands the terrain load even when it is empty.

18
4.3. Terrain load combined with hydrostatic pressure due to high water table This loading case arises when the tank is empty and it is buried in the ground considering all components of the terrain loads (vertical, horizontal in X-direction and horizontal in the Y-direction) in presence of high water table (assuming up to the manhole neck level). The maximum displacement (true scale) under this load is represented in Fig. 4.6 and the von Mises equivalent stress in Fig. 4.7.
Fig. 4.6. Deformed shape. Total displacement (in meters) due to terrain load
in presence of high water table (true scale).
The predicted maximum displacement is 40.3 mm which again occurs at the horizontal surface at the manhole neck, due to the vertical load of the terrain. As commented for the previous load case, this region is not very stiff in the vertical direction, and hence the maximum displacement occurs in this zone under a worst case scenario of the tank being buried at 1 m depth under the ground level.

19
Fig. 4.7. Von Mises equivalent stress (in Pa) due to terrain load in presence of high water table.
Fig. 4.7. shows the von Mises equivalent stress for this loading case. The maximum von Mises stress is 22.2 MPa, which is less than the elastic limit of the material (25.8 MPa as determined experimentally). This value tends to occur at abrupt changes in geometry, which behave as stress raisers. In fact, it occurs at the intersection of the horizontal surface and the manhole neck. In practice, stresses in these regions would be less than predicted, provided the finite element model is sufficiently discretized. This is because there are rounding and fillet radii in reality that have not been considered in the geometrical model. Local yield of this material will also exist and will redistribute the stress in the region. The rest of the tank is loaded at a very low stress level. We can conclude that the tank withstands the terrain load even when it is empty and in the presence of high water table. The results for this load case are very similar to the terrain load only. This is because the hydrostatic external pressure due to the water table is combined with a horizontal component of the terrain load which is reduced in comparison with the terrain load only. The reduction of the soil specific weight is from 18 kN/m3 to 10 kN/m3 in presence of water table.

20
5. SUMMARY AND CONCLUSIONS The following Table 5.1 summarizes the results obtained for the different load cases:
Wall
thickness (mm)
Maximum displacement
(mm)
Strength failure*
Hydrostatic load due to contained water 8.0 1.3 NO
Terrain load with empty tank 8.0 42.7# NO
Terrain load with empty tank and hydrostatic load due to high water table
8.0 40.3# NO
Table 5.1. Summary of results for the different load cases
# The maximum displacement occurs at the horizontal surface at the manhole neck under the worst case scenario of the tank being buried at a 1 m depth. The displacement at this horizontal surface is not critical from the structural point of view and could be reduced by conveniently stiffening this region. * Localized very high stresses due to geometrical stress raisers are ignored. Stresses in abrupt changes of geometry are less than those predicted by a linear elastic finite element model provided this is sufficiently discretized. In reality, there are rounding and fillet radii that have not been considered in the geometrical model.
According to the above results, the following conclusions are drawn:
1) The CAD model supplied by AIMPLAS has been imported in ANSYS and it has been conveniently modified for meshing purposes and finite element model generation.
2) The finite elements used from the ANSYS library are SHELL281 and
SURF154. The degree of refinement guarantees sufficiently accurate results.
3) The material properties have been provided by AIMPLAS from experimental results. No available properties have been estimated. The appropriate displacement boundary conditions have been imposed.
4) The structural loads follow the indication of the standard AENOR UNE-EN
12566-1:2000, “Small wastewater treatment systems for up to 50 PT. Part 1: prefabricated septic tanks” (in Spanish). Three different load cases have been analyzed, that correspond to potentially critical situations. A failure criterion based on the maximum equivalent von Mises stress has been considered given the nonlinear plastic behaviour of the material.
5) The existence of singular points in certain corners and abrupt changes in
geometry is due to the geometrical idealization together with the consideration of a linear elastic material behaviour. These regions with very high stresses occur in very small extension zones (compared to the rest of the

21
model). Actually, the severity of this prediction of localized high stresses is reduced because of:
a) Rounding and fillet radii not introduced in the simplified geometrical
model. b) Stress redistribution. Certain amount of plastic deformation can
accomodate the localized high stresses. This effect cannot be predicted by the finite element model used in this analysis.
6) The terrain load has been applied considering a height of 1 m above the top
of the tank to be on the conservative side. The coefficient K related to the internal friction angle has been assumed as the worst case scenario in the standard (K = 0.5, corresponding to “any other filling material”).
7) For a wall thickness of 8.0 mm and for the terrain loading case with empty
tank, the maximum displacement is 42.7 mm (which is the maximum obtained for all load cases). This value is acceptable because it occurs at the rim of the horizontal surface at the manhole neck and has not critical consequences from the structural point of view.
8) As a final conclusion, the tank with a uniform thickness wall of 8.0 mm
withstands all the structural load cases considered with a great margin of safety, proving the good structural design of the tank EUROBION.
Valencia, 24th March 2014