Embed Size (px)
Citation preview
Informed Options Trading prior to M&A Announcements:
Insider Trading?∗
Patrick Augustin† Menachem Brenner‡ Marti G. Subrahmanyam§
McGill University, Desautels New York University, Stern New York University, Stern
February 18, 2014
Abstract
We investigate the possibility of informed trading in equity options prior to the announcement
of corporate mergers and acquisitions (M&A) for a sample of 1,859 US events, during the period
January 1, 1996 to December 31, 2012, focusing on the target firms. Our goal is to quantify
the likelihood of informed trading and information leakage, based on option trading volume and
implied volatility attributes. In particular, we focus our attention on option strategies which,
in anticipation of public news announcements and the presence of private information, should
result in abnormal returns to insiders. We find highly positive abnormal trading volume and
excess implied volatility in anticipation of M&A announcements, with stronger effects for OTM
call options on the target company. We further document a decrease in the slope of the term
structure of implied volatility and an average rise in percentage bid-ask spreads, prior to the
announcements. We also provide a summary analysis of SEC cases involving options trading
ahead of M&A announcements, and present preliminary results of informed trading in options
of the acquirer firms.
Keywords: Asymmetric Information, Insider Trading, Mergers and Acquisitions, Market Mi-
crostructure, Equity Options
JEL Classification: G13, G14, G34, G38
∗We thank participants in the OptionMetrics Research Conference, New York, and a seminar at NYU Stern forcomments on a prior draft. We are also grateful to Yinglu Fu for outstanding research assistance.†McGill University - Desautels Faculty of Management, 1001 Sherbrooke St. West, Montreal, Quebec H3A 1G5,
Canada. Email: [email protected].‡New York University - Leonard N. Stern School of Business, 44 West 4th St., NY 10012-1126 New York, USA.
Email: [email protected].§New York University - Leonard N. Stern School of Business, 44 West 4th St., NY 10012-1126 New York, USA.
Email: [email protected].
1 Introduction
The recent announcement of the leveraged buyout of H.J. Heinz Inc. by an investor group consisting
of Berkshire Hathaway Inc., controlled by Warren Buffett, and 3G Capital, a Brazilian private-
equity firm, has sparked concerns about unusual option activity prior to the deal announcement.
Was this abnormal volume in the options of Heinz Inc. an indication of trading based on insider
information? Apparently, the Securities and Exchange Commission (SEC) thought so, alleging that
a brokerage account in Switzerland was used for illegal insider trading. Another noteworthy case
from an earlier period was the merger of Bank One with JP Morgan (JPM) Chase in July of 2004,
where one investor was alleged to have bought deep out-of-the-money (DOTM) calls just (hours)
before the announcement. While these cases received considerable publicity, they are by no means
isolated cases of such activity. Indeed, while the SEC has taken action in several cases where the
evidence was overwhelming, one can assume that there are many more cases that go undetected,
or where the evidence is not as clear-cut, in a legal/regulatory sense.1,2 Academic research on
the role of informed trading in equity options around major news events, and in particular, the
announcements of mergers and acquisitions (M&A), has been scanty.3 We aim to fill this gap in
the research presented in this paper.
The objective of our study is to investigate the pervasiveness of trading on inside information
in the context of M&A activity. To this end, we conduct a forensic analysis of volume and implied
volatility of options over the 30 days preceding a formal announcement. In addition, we examine
alternative strategies that may yield abnormal returns to informed traders. The focus is on option
strategies, although some of these may also involve trading in the underlying stocks. We focus on
the target companies in M&A transactions, but also provide some preliminary evidence pertaining
to the acquirer. More specifically, we examine option trading volume (and prices) prior to M&A
announcements in the U.S. from January 1 1996 through December 31 2012. We attempt to
quantify the likelihood that a sudden and significant spike in put or call trading volume prior to
1Although the JPM/Bank One case received a lot of attention in the press, we are puzzled as to why this casedoes not appear in the SEC investigation/litigation files. However, we do document a large number of SEC casesduring our sample period.
2See, for example, Options Activity Questioned Again in the Wall Street Journal, 18 February 2013.3Related cases of insider trading activity prior to earnings announcements and other important corporate an-
nouncement have received somewhat greater attention.
1
a major informational event is based on informed trading activity, rather than being random. We
also analyze the liquidity effects in the equity options market arising from the arrival of informed
traders prior to M&A announcements.
We document evidence of statistically significant average abnormal trading volume in equity
options written on the target firm over the 30 days preceding M&A announcements. Approximately
26% of all the cases in our sample have abnormal volumes that are significant at the 5% level. The
proportion of cases with abnormal volume is relatively higher for call options (25%) than for put
options (15%). Stratifying the results by moneyness, we find that there is significantly higher
abnormal trading volume (both in levels and frequencies) in OTM call options compared to ATM
and ITM calls. We also find that ITM puts, as well as OTM puts, trade in larger volumes than
ATM puts. This is preliminary evidence that informed traders may not only engage in OTM call
transactions, but potentially also deal in ITM put options.4 In addition to evidence of abnormal
trading volume in anticipation of M&A announcements, we provide statistical evidence that the
two-dimensional volume-moneyness distribution significantly shifts, to options with higher strike
prices, over the 30 days prior to the announcement day.
We further provide statistical tests of positive excess implied volatility for target firms in the
pre-event window. Thus, informed trading has an impact on equity option prices and leads to
an attenuation of the term structure of implied volatility for target firms. Similarly, the relative
higher abnormal volume in OTM call options for targets translates, on average, into an increase in
implied volatility prior to the announcement day. We also find that the percentage bid-ask spread
for options on target firms rises from an average of 35% to 55%, over the 30 days preceding the
announcement. This effect is significant for DOTM and OTM call options, as well as short- to
medium-dated options.
This paper provides a preliminary forensic analysis of trading volume and implied volatility for
equity options, focusing on target firms involved in M&A announcements. It suggests a natural
classification scheme based on volume and price attributes that may be useful for regulators and
prosecutors to detect insider trading activity. Our preliminary evidence suggest that informed
trading is more pervasive than what one would expect based on the modest number of cases
4As discussed later, it is not clear whether informed traders would take long or short positions in call and putoptions, since replication involving the underlying stock as well, can change the directional benefit from such trades.
2
prosecuted by the Securities and Exchange Commission (SEC). We also provide an analysis of
comparable SEC cases and a preliminary analysis of informed trading in options of the acquirer.
The outline of the paper is as follows. In Section 2, we provide a review of the relevant literature.
We describe the data selection process and review the basic summary statistics in Section 3. The
main hypotheses and methodology are presented in Section 4. We analyze the results in the
subsections of Section 5. Section 5.4 deals with the acquirer sample. In Section 6 we provide an
analysis of the SEC sample. We end with a summary and preliminary conclusions in Section 7.
2 Literature Review
Our work relates generally to the theoretical literature studying when and how informed agents
choose to trade in the option market in the presence of, for instance, asymmetric information (Easley
et al. 1998), differences in opinion (Cao and Ou-Yang 2009), or margin requirements and wealth
constraints (John et al. 2003). More specifically, our objective is to identify informed, or even insider
trading in the option market ahead of unexpected public announcements, such as mergers and
acquisitions. In this spirit, Poteshman (2006) concludes that informed investors traded put options
ahead of the 9/11 terrorist attack. Keown and Pinkerton (1981) confirm leakage of information and
excess stock returns earned by insider trading in the presence of merger announcements, but they
do not investigate equity option activity. Meulbroek (1992) studies the characteristics of a sample
of illegal insider trading cases detected and prosecuted by the SEC from 1980 to 1989, but likewise
does not focus on option trading. Acharya and Johnson (2010) show that, for leveraged buyouts,
the presence of more insiders leads to greater levels of insider activity, in the sense that a larger
number of equity participants in the syndicate is associated with greater levels of suspicious stock
and option activity. Chesney et al. (2011) develop statistical methods with ex-ante and ex-post
information to detect informed option trades in selected industries and companies, confirming that
informed trading clusters before major informational events.
Our research relates more closely to Wang (2013), who investigates unusual option volume
and price activity ahead of M&A announcements and questions how it predicts SEC litigations.
However, we study unusual option activity in much greater depth, use more sophisticated statistical
3
techniques and formulate more detailed and precisely stated hypotheses involving option strategies.
We are also more exhaustive in our analysis of information obtained from hand-collected SEC
litigation filings. While Frino et al. (2013) also hand collect SEC litigation reports and study the
determinants of illegal insider trading, they focus on stocks, not options as we do.
Our paper also speaks to the literature that investigates the informational content of option trad-
ing volume ahead of M&As for post-announcement abnormal stock returns. Cao et al. (2005), for
example, find evidence that, for target companies in M&A transactions, the option market displaces
the stock market for information-based trading during periods immediately preceding takeover an-
nouncements, but not in normal times.5 Focusing on the acquirer firms, Chan et al. (2013) provide
evidence that the one-day pre-event implied volatility spread and the implied volatility skew, two
proxies for informed option trading, are, respectively, positively and negatively associated with
acquirer cumulative abnormal returns.6 The predictive power of both measures increases if the
liquidity of options is high relative to that of the underlying stocks. Barraclough et al. (2012)
exploit the joint information set of stock and option prices to disentangle true synergies from news
in merger and acquisition transaction announcements. They also document that the increase in
trading volume from the pre-announcement period to the announcement day is most dramatic for
call options with an increase of 212.3% for bidder call options, and an increase of 1,619.8% for target
call options. We provide more granular evidence on the changes in the distribution of volume for
different levels of option moneyness, ahead of announcements, which is worth examining in greater
detail, since the results presented in the literature are inconsistent across studies.7 Podolski et al.
(2013) also provide some indirect evidence that the option-to-stock volume ratio increases in the
pre-takeover period, and increases relatively more for small deals that are less likely to be detected.
Evidence of informed trading and the role of option markets in information revelation around M&A
5More specifically, the authors study a sample of 78 U.S. merger or takeover firms between 1986 and 1994.Buyer-seller initiated call-volume imbalances, but not stock imbalances, are associated with higher stock returns thefollowing day. However, during periods of normal trading activity, only buyer-seller initiated stock-volume imbalancesexhibit predictability, while option volume is uninformative. Option volume imbalances before M&A transactions areconcentrated in firms that eventually have successful takeovers and cannot be explained by target firm characteristics.
6Chan et al. (2013) use a sample of 5,099 events for 1,754 acquirers, over the period 1996 to 2010. The impliedvolatility spread is calculated as the average difference between implied volatilities of options on the same security,but different strike/maturity calls and puts. The implied volatility skew is calculated as the difference between theimplied volatilities of OTM puts and ATM calls.
7Poteshman (2006) focuses only on put options, Chesney et al. (2011) argue that there is more informed tradingin put options, while Wang (2013) argues that there is higher abnormal volume for ATM call options.
4
announcements from the UK equity and option market is provided by Spyrou et al. (2011). Fi-
nally, Nicolau (2010) studies the behavior of implied volatility around merger announcements, and
interprets positive abnormal changes in implied volatility prior to the announcement as evidence
of information leakage.
In our research, we are particularly interested in informed trading that may be generated by
corporate outsiders. In that sense, we clearly differ from the large literature that attempts to
decode informed trading by corporate insiders in stocks based on the Thomson Reuters insider
filings database. For example, Cohen et al. (2012) separate trades into informed opportunistic and
routine traders to show that only the former has predictive content from stock prices. Tamersoy
et al. (2013) apply network analysis to identify temporal patterns in inside trades. In general,
these studies focus on stock trades only, and provide no evidence on option activity. Whether
informed trading by corporate outsiders is illegal or not is outside the scope of this paper, as we
can only confirm evidence of statistical anomalies, rather than the legality of the transactions. A
parallel literature has developed in law, which discusses the fine line between legal and illegal insider
trading. We refer to Crimmins (2013) for a discussion of these legal subtleties.
Several other papers are peripherally related to the specific issue studied in this paper. Roll
et al. (2010) study the relationship between the option-to-stock trading volume and post-earnings
announcement returns. Bester et al. (2011) and Subramanian (2004) develop theoretical option
pricing models for the target in the case of cash and stock-for-stock mergers respectively. Dubinsky
and Johannes (2006) develop estimators of the anticipated uncertainty of fundamental information
released on earnings announcement dates using equity option prices. Easley et al. (1998), Pan and
Poteshman (2006), Xing et al. (2010), Cremers and Weinbaum (2010), Johnson and So (2011),
Driessen et al. (2012), Jin et al. (2012) and Hu (2013) relate, more generally, various information-
based measures derived from option trading volume and prices to the predictability of stock returns.
Finally, Bollen and Whaley (2004) and Garleanu et al. (2009) show how demand-based price pres-
sure affects option prices.
While the bulk of the empirical research on option markets focuses on index options, there are
fewer studies using equity options (i.e., options on individual stocks), although they were trading for
5
almost a decade prior to the introduction of index options in the U.S.8 There are even fewer studies
relating to informed trading around major informational events, such as mergers and acquisitions,
using option strategies, and these are typically based on relatively small data sets. The above
studies tend to focus on either the target or the acquirer. We study the trading patterns of equity
options of both the target and acquirer, using data on both trading volume and prices, highlighting
the fundamental differences between directional and non-directional strategies for insiders. More
specifically, we focus on the behavior of the entire volume distribution and option-implied volatility
across the depth-in-the-money dimension, prior to takeover announcements. Importantly, while
some papers in the previous literature have investigated the informational content of option trading
volumes for post-announcement stock returns, none of them have focused on the role of option
strategies in illegal insider trading. Moreover, in contrast to the above studies, which focus on
various aspects of the M&A announcements using option data, our study focuses on the extent to
which informed trading, some of it illegal, can be detected by analyzing various option strategies,
using both puts and calls, of the target company and the acquirer. The likelihood of informed
trading in these cases will be quantified in our analysis. Our study is also more comprehensive in
scope than the above prior studies, based on a much larger sample, with more rigorous statistical
tests. Also, we provide a complete summary of all the cases prosecuted by the SEC relating to
insider trading in options prior to the M&A announcements during the period of our study.
3 Data Selection and Summary Statistics
The data for our study are obtained from three primary sources: the Thomson Reuters SDC
Platinum Database, the Center for Research in Securities Prices (CRSP) and OptionMetrics. The
start date of our sample period is dictated by the availability of option information in OptionMetrics,
which initiated its reporting on 1 January 1996. Our final sample consists of 1,859 corporate
transactions, for which we could identify matching stock and option information for the target.
These deals are undertaken by 1,279 unique acquirers on 1,669 unique targets.9 For a sub-sample
8The main constraint in the earlier period was the availability of reliable data, which has changed dramaticallywith the advent of OptionMetrics as a reliable source for academic research in this area.
9Thus, 190 of the targets were involved in an unsuccessful merger or acquisition that was ultimately withdrawn.However, we include these cases in our sample, since the withdrawal occurred after the takeover announcement.
6
of 792 transactions, option information is available for both the target and the acquirer. The
starting point of our sample selection is the full domestic Mergers and Acquisitions sample for US
targets from the Securities Data Company Platinum database over the time period January 1996
through December 2012.
We restrict our sample to deals with the intent of effecting change of control, i.e., to be included
in our sample, the acquirer needs to own less than 50% of the target’s stock before the transaction,
and is seeking to own more than 50% post transaction. Hence, we include only mergers, acquisitions
and acquisitions of majority interest in our sample, thereby excluding all deals that are acquisi-
tions of partial interest/minority stake purchases, acquisitions of remaining interest, acquisitions of
assets, acquisitions of certain assets, recapitalizations, buybacks/repurchases/self-tender offers and
exchange offers. In addition, we exclude deals for which the status is pending or unknown, i.e., we
only include completed, tentative or withdrawn deals. Next, we require available information on
the deal value and eliminate all deals with a transaction value below 1 million USD. Finally, we
match the information from SDC Platinum with price and volume information for the target in
both CRSP and OptionMetrics. We require a minimum of 90 days of valid stock and option price
and volume information on the target prior to and including the announcement date. We further
retain short-dated options expiring before the announcement date, as long as they are at-the-money.
All matches between SDC and CRSP/OptionMetrics are manually checked for consistency based
on the company name.10
Panel A in Table 1 reports the basic characteristics for the full sample, in which we require option
information availability only for the target. Pure cash offers make up 48.6% of the sample, followed
by hybrid financing offers with 22.3% and share offers with 21.7%. 82.9% of all transactions are
completed, and mergers are mostly cross-industry with 89.2% of all deals being undertaken with a
company not in the same industry based on the 4-digit SIC code. 90.2% of all deals are considered
to be friendly and only 3.4% are hostile, while 11.6% of all transactions are challenged. For a
small sub-sample of 6.5%, the contracts contain a collar structure, 76.5% of all deals contain a
termination fee, and in only 3.5% of the transactions did the bidder already have a toehold in the
10Overall, we extract up to a maximum of one year of stock and option price information before and after theannouncement date. The cut-off of one year is arbitrary, but follows from the trade-off of the following two objectives:having a sufficiently long time series before the announcement day to conduct an event study analysis, and keepingthe size of the dataset manageable to minimize computational complexity.
7
target company. Panel B shows that the average deal size is 3.8 billion USD, with cash-only deals
being, on average, smaller (2.2 billion USD), in comparison to stock-only transactions (5.4 billion
USD). The average one-day offer premium, defined as the excess of the offer price relatively to
the target’s closing stock price, one day before the announcement date, is 31%. Statistics for the
sub-sample for which we have option information on both the target and acquirer are qualitatively
similar.
In Figure 1, we plot the average option trading volume in calls and puts for both the target
and acquirer, 60 days before, and after the announcement date. The run-up in volumes is a first
indication of information leakage prior to the public news announcements. There are two prelim-
inary observations that can be made based on this cursory analysis. First, the unusual activity,
in options of the target firm, is concentrated in a very narrow window around the announcement
day, and occurs in both calls and puts. Second, the trading activity in the options of the acquirer
firm is more dispersed, though most of it is close to the announcement day. However, these simple
averages mask significant cross-sectional differences across firms and options in abnormal trading
volumes. A more detailed analysis is provided in Section 5, the empirical section that follows the
discussion of our hypotheses.
4 Research Questions and Hypotheses
We attempt to quantify the likelihood of informed trading by focusing on the trading activity in the
options of both the target and the acquirer. Our analysis is on three different aspects of this broad
issue: information obtained from the trading volume of options, information obtained from option
prices of these companies, and market microstructure data. We investigate several hypotheses to
test for such informed trading activity, mainly pertaining to the target firm.11 Unlike the target
firm, where the stock price almost always goes up after the announcement, there is generally more
uncertainty associated with the post-announcement direction of the stock price of the acquiring
firm. While deals involving an exchange of stocks result in a decline of about 3% of the acquirer’s
stock price, cash deals (48% of our sample) do not result, on the average, in the decline of the
11We write these hypotheses as statements of what we expect to find in the data, rather than as null hypothesesthat would be rejected.
8
acquirer’s stock price, with considerable cross-sectional variation around these numbers.12 Thus,
an informed trader would pursue directional strategies for the target firm, whereas for the acquirer
he is more likely, especially in cash deals, to pursue “volatility” trading strategies (see hypothesis 7
below). The underlying assumption for all these hypotheses is that insiders are capital constrained
and also would like to ensure that their private information is not revealed to the market prior to
the trades, to minimize market impact. Also, in our analysis of potential strategies used by the
insider, we do not explicitly consider the concern that this trading activity may be detected by the
regulators, and how it may affect the traders choice of strategies. We first state and justify our
hypotheses regarding the target firms and then discuss the hypothesis pertaining to the acquiring
firms.
4.1 Target firms
• H1: There is evidence of positive abnormal trading volume in equity options, written on the
target firms, prior to M&A announcements.
If informed trading is present, without leakage of information, informed traders should benefit
relatively more from strategies that use options due to the leverage they obtain, if they are
capital constrained. A takeover announcement tends to be generally associated with a stock
price increase for the target, mostly a significant one (for a recent survey, see Andrade et al.
(2001), for example). A trader who obtains prior knowledge of an upcoming deal and intends
to use the information to trade is likely, given his capital constraints, to engage in leveraged
trading strategies that maximize his profits. The obvious venue for such activity is the
option market where we would expect to see significant abnormal trading volume in options
for the target firms, in anticipation of major corporate takeover announcements. Given the
importance of leverage, we can sharpen the above hypothesis as follows in Hypothesis H2.
• H2: There is a higher ratio of the abnormal trading volume in (a) OTM call options compared
to ATM and ITM call options, and (b) ITM put options compared to ATM and OTM put
options, written on the target firms, prior to M&A announcements.
In the presence of superior information, a trading strategy involving the purchase of OTM
12See Savor and Lu (2009), for example.
9
call options should generate significantly higher abnormal returns, as a consequence of the
higher leverage (“more bang for the buck”). Hence, we expect a relatively larger increase
in abnormal trading volume for OTM calls relative to ATM and ITM calls, in the presence
of such activity.13 Moreover, an insider taking advantage of his privileged knowledge of the
direction of the target’s stock price evolution is also likely to increase the trading volume
through the sale of ITM puts, which would become less valuable when the announcement is
made, followed by an upward move in the stock price of the target. An alternative strategy,
arising from put-call-parity, would be to buy ITM puts coupled with the underlying stock
and financed by borrowing (mimicking the strategy of buying OTM calls). A possible reason
for engaging in such a strategy rather than the more obvious one of buying OTM calls, could
be the lack of liquidity in OTM calls: a large order may have a significant market impact and
even reveal the information to the market. Thus, an abnormally high volume in ITM puts
may result from either the strategy of mimicking the purchase of OTM calls or the strategy
of taking a synthetic long position in the stock.
• H3: There is positive excess implied volatility for equity options, written on the target firm,
prior to M&A announcements.
Informed traders who have accurate information about the timing of the announcement and
the offer price will tend to buy OTM calls just prior to the announcement (for example, as
in the JPM-Bank One case). They will buy OTM calls, those that will just become ITM,
when the stock price reaches or exceeds the takeover offer price. They would be willing to
pay the offer price of the option market maker, typically the seller of such options. Informed
traders who anticipate a deal but are uncertain of the offer price and the timing will typically
buy options which are closer to the money and would also be willing to pay the offer price.
Assuming that the options equilibrium price is, on the average, between the bid and ask
prices, buying at the ask price will result in higher excess volatility.14 The wider is the bid-
ask spread, the greater will be the measured excess volatility, due to the convexity of option
prices. Thus, we anticipate excess implied volatility, albeit not especially large, for all options
13This case corresponds to the case study of JPM-Chase merging with Bank One, which exhibits such a pattern.14This argument can be related to prior work on the inelasticity of the option supply curve, along the lines analyzed
theoretically by Garleanu et al. (2009) and empirically by Bollen and Whaley (2004) and Deuskar et al. (2011).
10
on the target.
• H4 : The percentage bid-ask spread for options written on target firms should widen, prior to
M&A announcements.
Similar to the rationale behind Hypothesis H3, there should be no pattern in the bid-ask
spread in the options on the target firms as the announcement date approaches, absent insider
activity. An increase in the percentage bid-ask spread conditional on abnormal trading volume
would be a natural response of market makers to such potential asymmetric information. This
is indirect evidence that there are informed traders in this market prior to the announcement
date, but not necessarily that the information about a potential merger has leaked to the
whole market.
• H5: The (right) skewness of the option smile/skew, for target firms, should increase prior to
M&A announcements.
Considering Hypotheses H2, H3, H4, we expect that the demand for OTM call options,
especially where the buyers pay the offer price, could increase the price of OTM call options
relative to the price of OTM puts.15 If the implied volatility/strike price graph is initially a
“smirk”, it becomes “flatter” due to the actions of the informed trader. On the other hand,
if the graph is more like a “smile”, we should observe a steeper smile due to these trades.
• H6: The term structure of implied volatility should decrease for options on the target firms
before takeover announcements.
Informed traders obtain the highest leverage by buying short-dated OTM call options, which
expire soon after the announcement date. Given this preference, demand pressure on short-
dated options should lead to a relative price increase (or a tendency to buy at the offer price)
in options with a shorter time to expiration compared to long-dated options. Thus, the term
structure of implied volatility should decrease for call options written on target firms.
15The change in the skewness of the option smile/skew would also depend on the extent to which ITM puts aredominated by buyers or sellers, as argued in H2.
11
4.2 Acquirer firms
• H7: In anticipation of major news events, there should be a volume increase in long-gamma
trading strategies for the acquirer firm, prior to M&A announcements.
As explained above, since in the case of the acquirer there is general uncertainty regarding the
direction of the change in the price of the stock after the announcement, an informed trader
will not make a directional trade, using OTM options. Rather, he will trade on the possibility
of a jump in the stock price of the acquirer, in either direction. The obvious strategy to take
advantage of this information would be to use a high gamma strategy, e.g. by buying ATM
straddles. Thus, we anticipate an increase in the volume of ATM straddles. As stated above,
this is particularly true for cash deals which are about half of our sample. In exchange of
stocks deals, on the average, there is a decline of 3% in the acquirers stock price. Though
there are a number of such cases where there is no decline or even an increase, the insider
may employ a directional strategy or a mixed one (directional/volatility), due to the negative
average.
5 Empirical Analysis
5.1 Target Firms
We investigate the first six hypotheses along three dimensions identified above: trading volume,
price and liquidity (bid-ask spread) of options traded on target firms. We begin by looking into
the behavior of volume, prior to the M&A announcement dates.
5.2 Abnormal Volume
In order to address Hypotheses H1 and H2, we conduct a forensic analysis of trading volume in
equity options during the 30 days preceding takeover announcements. We first summarize the
descriptive statistics of the option trading volume in our sample. We next look at specific trades
that are most susceptible to insider trading and compare them to a matched random sample. We
then test for the presence of positive abnormal volume in call and put options across moneyness
categories, using a variation of the conventional event study methodology. Next, we formally test,
12
using an approximation to the bivariate Kolmogorov-Smirnov test, whether the entire volume-
moneyness distribution shifts in anticipation of takeover news releases. i.e. an increase in the OTM
call volume relative to ATM and ITM, as we approach the event day. Finally, we present some
evidence on the behavior of conditional trading volume.
5.2.1 Statistics on Equity Option Trading Volume
We start by reporting basic summary statistics on option trading volume of target firms, stratified
by time to expiration and moneyness in Table 2.16 We classify our sample into three groups in
terms of time to expiration: less than or equal to 30 days, greater than 30 days but less or equal to
60 days and more than 60 days. In addition, we sort the observations into five groups of moneyness,
where moneyness is defined as S/K, the ratio of the stock price S over the strike price K. DOTM
corresponds to S/K ∈ [0, 0.80] for calls ([1.20,∞] for puts), OTM corresponds to S/K ∈ ]0.80, 0.95]
for calls ([1.05, 1.20[ for puts), ATM corresponds to S/K ∈ ]0.95, 1.05[ for calls (]0.95, 1.05[ for puts),
ITM corresponds to S/K ∈ [1.05, 1.20[ for calls (]0.80, 0.95] for puts), and DITM corresponds to
S/K ∈ [1.20,∞[ for calls ([0, 0.80] for puts). Panels A to C report summary statistics for all options
in the sample, while Panels D to F and G to I report the numbers separately for calls and puts,
respectively.
First, regardless of moneyness, the level of trading volume, as indicated by the mean volume
statistics, is significantly higher for short and medium-dated options compared to long-dated op-
tions. For example, the average number of traded contracts in OTM options for target firms is 370
and 285 contracts for maturities of less than 30 and 60 days respectively, while it is 130 contracts
for options with more than 60 days to maturity. This difference is more pronounced for call options
than for put options.17 Second, the highest average trading volume tends to be associated with
OTM options. Last, we observe that the standard deviation of trading volume decreases with time
to expiration.
16Since equity option markets are fairly illiquid, the trading volume data are characterized by numerous zero-volumeobservations. These data points are omitted for the purpose of presenting the basic summary statistics.
17Note that in the entire sample, including both targets and acquirers, the average trading volume is 1,084 contractsfor ATM options, and 497 and 398 contracts respectively, for OTM and ITM options, and 127 and 214 contractsrespectively, for DOTM and DITM options.
13
5.2.2 Strongly Unusual Trading Volume and Matched Random Sample
Our primary goal is to distinguish informed trading from random speculative bets. Hence, we are
looking for unusual trading patterns that are clearly different from patterns exhibited by randomly
selected samples, since evidence of non-random trading would point to the existence of informed
trading. Thus, we start with extreme cases that are potentially the most likely ones to reflect
informed trading. In this spirit, we define as strongly unusual trading (SUT), observations (defined
as the trading volume for an option-day pair, i.e., the end-of-day volume for a given option on the
target) corresponding to the following four criteria for individual options: (1) the daily best recorded
bid is zero. This corresponds normally to DOTM options where the market maker, through his
zero bid, signals his unwillingness to buy, but is willing to sell at a non-zero ask price. (2) The
option should expire on or after the announcement day, but is the first one to expire thereafter
(the so-called front month option). Obviously, an insider would buy options that expire soon after
the announcement: in order to get the biggest bang for the buck, he would try to buy the cheapest
ones that are most likely to end up in the money. Short-dated OTM options tend to be cheaper
and provide the greatest leverage. (3) The option must have strictly positive trading volume. Since
many individual equity options, especially those that are OTM, have zero trading volume (although
all options have quotes in the market-making system), we focus on those that have positive volume,
assuming that the insiders pick those OTM options that are the most likely to be ITM, after the
price jump consequent upon the announcement. (4) Finally, the transaction must take place within
30 days of the event-date, defined as the 0 date (i.e., from event date -29 to 0). An informed
trader faces the tradeoff of leveraging on his private information prior to the event, while likely not
trading too close to the event, which may entail a higher risk of alerting other market participants
or triggering an investigation by the regulators.18
Table 3 presents the sample statistics for the SUT sample. From the entire dataset, we identify
2,042 option-day observations for the target firms, which meet our SUT selection criteria.19 The
share of calls is slightly more than half, with a total of 1,106 observations for target firms. The
18An additional aspect that we do not explicitly consider is the number of traders involved and their connectionswith each other. Such information may reveal whether the information was shared by many players and potentiallyleaked to them. We presently do not have data on individual trades in this period, but we hope to obtain them.
19Note that the full sample has approximately 12,000,000 observations. For each event, the event time spans from1 year before to 1 year after the announcement date.
14
average trading volume is 124 option contracts, and the average trading volume for calls and puts
is, respectively, 137 and 108.20 The median trading volume is somewhat more stable, with a value
of 20 contracts for options written on the target.
We compare the statistics from the SUT sample with those from a randomly selected sample.
The sampling procedure to create the random sample is as follows: For each of the 1,859 events
with options traded on the target firms, we randomly select a “pseudo-event” date. We treat the
pseudo-event date as a hypothetical announcement date, chosen at random, and then apply the
SUT selection criteria to it, i.e., we keep option-day observations with a zero bid price, non-zero
trading volume, that are within 30 days of the pseudo-event date, and which have an expiry date
after the pseudo-event date.
The SUT sample statistics are compared to the Random Sample Trading (RST) statistics in
Panel B of Table 3.21 The number of observations, deals and options are somewhat higher in the
RST sample than in the SUT sample. The ratios of the number of observations, deals and options
in the RST sample to those in the SUT sample range approximately between 1.4 and 1.8. However,
the average and median trading volume in the SUT sample are more than double that of the
RST sample. The maximum observed trading volumes are significantly higher in the SUT sample
than in the RST sample. However, the distributional statistics illustrate that this effect does not
arise because of outliers. In the RST sample, around the 50th percentile of the distribution and
upwards, volumes are consistently less than half the trading volumes observed in the SUT sample
at comparable cut-offs of the volume distribution. Another interesting feature is that the distance
between the median and the mean is roughly constant around 100 traded contracts in the SUT
sample. In particular, statistics for put options are statistically similar across both samples. For the
entire sample, the difference between the average volume (124) before the deal announcement, in the
SUT sample, and the average volume (57) on a random date, in the RST sample, is significantly
different from zero. The one-sided t-statistics is -6.90, implying a probability of 3 in a trillion
that the observed trading volume before the announcement happened by chance. Moreover, the
percentiles of the SUT sample are overwhelmingly higher for the percentiles over 30% and about
20The average is taken across all observations satisfying the SUT selection criteria.21As we have confined our study to a limited period and due to the fact that the variance may be large, we have
double checked our results using 100 random samples of 1,859 pseudo-events for the target firms, in order to minimizethe standard error of our estimates. The results from this robustness check were very similar.
15

the same for the lower ones, less than 30%.
We point out that the difference between the two samples is likely to be understated in our
procedure, compared to one where the random sample is chosen from the entire sample period.
Specifically, for each event, we have a maximum of 1 year of data before and after the event, in
our case, rather than the whole time-span of traded options, going as far back as January 1996
until today. In such a situation, the difference is likely to be even stronger. Hence, our statistical
procedure is biased against failing to reject the null hypotheses stated in the previous section.
To summarize, the entire distribution in trading volume differs significantly between the SUT
and RST samples for target firms. In particular, we observe that an average trading volume above
100 contracts, with the mean to median distance of 100 contracts, can be considered strongly
unusual and non-random, when the transactions occurs at a “zero-bid” within 30 days of the
announcement date on options expiring after the announcement. This first-pass test is preliminary
evidence in favor of the hypothesis H1 by showing that there is a non-random increase in trading
volume on target firms prior to a public M&A announcement.
5.2.3 Shifts in Option Trading Volume Density
The previous section illustrated that the 30 days prior to M&A announcement dates exhibit strongly
unusual trading patterns for target firms. The question is whether there is a monotonic shift in the
option trading volume distribution as the announcement date approaches. We formally test for a
shift in the bivariate volume-moneyness distribution over time, in anticipation of the announcement
dates.
Figure 2 visually illustrates the shift in the volume distribution for calls and puts written on the
target firms, as we approach the announcement date. Each individual line reflects a local polynomial
function fitted to the volume-moneyness pairs. It is striking to see how the volume distribution
for call options shifts to the tails and increases the weights of the DITM and DOTM categories,
as we approach the announcement date. In addition, the volume keeps increasing, in particular
in the event window [−4,−1]. The last event window [0, 0] incorporates the announcement effect,
whereby the overall average trading level is lifted upwards, and the distribution shifts to ITM call
options and OTM puts. Another way to visualize the change in the distribution is given in Figure
16
3, although this graph does not reflect the bivariate dimension of the distribution. The dashed blue
line and the solid green line in each plot represent the 90th and 95th percentile of the distribution,
whereas the dotted red lines reflect the interquartile range. It is evident from the figure that the
percentage increase in the percentiles of the volume distribution is very strong. For example, the
interquartile range for target call options increases from a level below 50 contracts to approximately
2000 contracts on the announcement day.
To summarize, there is a significant shift in both the mean and median trading volume, in
anticipation of M&A transactions for target firms. This shift is more pronounced for DOTM and
OTM call options, compared to ITM and DITM options. This confirms Hypothesis H2 that there
is a higher abnormal trading volume in deep OTM call options, compared to ATM and ITM call
options. In what follows, we apply a formal statistical test for the shift in the volume distribution.
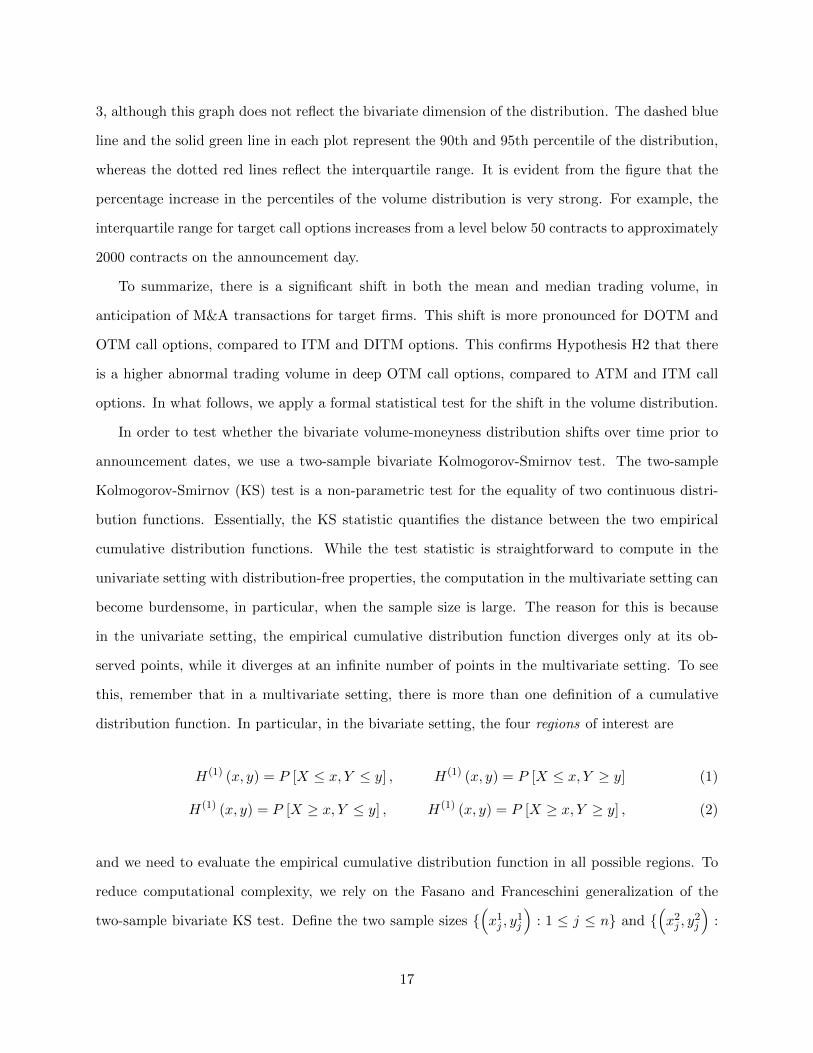
In order to test whether the bivariate volume-moneyness distribution shifts over time prior to
announcement dates, we use a two-sample bivariate Kolmogorov-Smirnov test. The two-sample
Kolmogorov-Smirnov (KS) test is a non-parametric test for the equality of two continuous distri-
bution functions. Essentially, the KS statistic quantifies the distance between the two empirical
cumulative distribution functions. While the test statistic is straightforward to compute in the
univariate setting with distribution-free properties, the computation in the multivariate setting can
become burdensome, in particular, when the sample size is large. The reason for this is because
in the univariate setting, the empirical cumulative distribution function diverges only at its ob-
served points, while it diverges at an infinite number of points in the multivariate setting. To see
this, remember that in a multivariate setting, there is more than one definition of a cumulative
distribution function. In particular, in the bivariate setting, the four regions of interest are
H(1) (x, y) = P [X ≤ x, Y ≤ y] , H(1) (x, y) = P [X ≤ x, Y ≥ y] (1)
H(1) (x, y) = P [X ≥ x, Y ≤ y] , H(1) (x, y) = P [X ≥ x, Y ≥ y] , (2)
and we need to evaluate the empirical cumulative distribution function in all possible regions. To
reduce computational complexity, we rely on the Fasano and Franceschini generalization of the
two-sample bivariate KS test. Define the two sample sizes {(x1j , y
1j
): 1 ≤ j ≤ n} and {
(x2j , y
2j
):
17
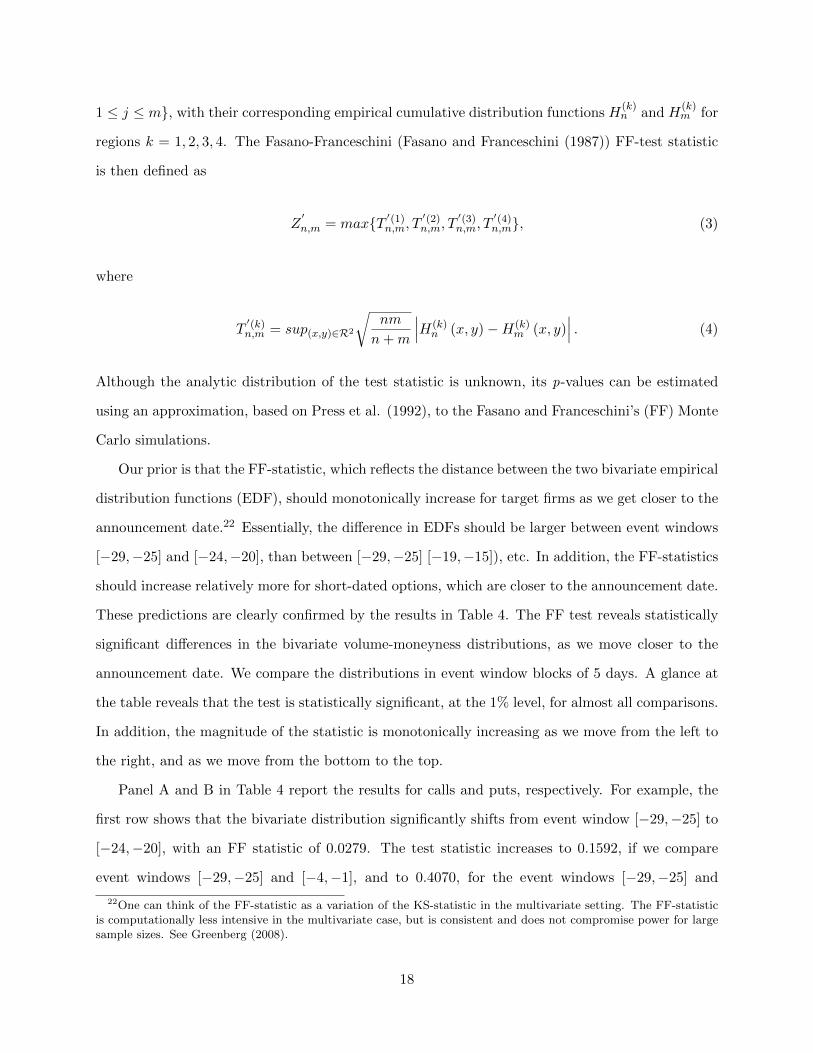
1 ≤ j ≤ m}, with their corresponding empirical cumulative distribution functions H(k)n and H
(k)m for
regions k = 1, 2, 3, 4. The Fasano-Franceschini (Fasano and Franceschini (1987)) FF-test statistic
is then defined as
Z′n,m = max{T ′(1)
n,m, T′(2)n,m, T
′(3)n,m, T
′(4)n,m}, (3)
where
T′(k)n,m = sup(x,y)∈R2
√nm
n+m
∣∣∣H(k)n (x, y)−H(k)
m (x, y)∣∣∣ . (4)
Although the analytic distribution of the test statistic is unknown, its p-values can be estimated
using an approximation, based on Press et al. (1992), to the Fasano and Franceschini’s (FF) Monte
Carlo simulations.
Our prior is that the FF-statistic, which reflects the distance between the two bivariate empirical
distribution functions (EDF), should monotonically increase for target firms as we get closer to the
announcement date.22 Essentially, the difference in EDFs should be larger between event windows
[−29,−25] and [−24,−20], than between [−29,−25] [−19,−15]), etc. In addition, the FF-statistics
should increase relatively more for short-dated options, which are closer to the announcement date.
These predictions are clearly confirmed by the results in Table 4. The FF test reveals statistically
significant differences in the bivariate volume-moneyness distributions, as we move closer to the
announcement date. We compare the distributions in event window blocks of 5 days. A glance at
the table reveals that the test is statistically significant, at the 1% level, for almost all comparisons.
In addition, the magnitude of the statistic is monotonically increasing as we move from the left to
the right, and as we move from the bottom to the top.
Panel A and B in Table 4 report the results for calls and puts, respectively. For example, the
first row shows that the bivariate distribution significantly shifts from event window [−29,−25] to
[−24,−20], with an FF statistic of 0.0279. The test statistic increases to 0.1592, if we compare
event windows [−29,−25] and [−4,−1], and to 0.4070, for the event windows [−29,−25] and
22One can think of the FF-statistic as a variation of the KS-statistic in the multivariate setting. The FF-statisticis computationally less intensive in the multivariate case, but is consistent and does not compromise power for largesample sizes. See Greenberg (2008).
18
[0, 0]. Overall, the largest test statistics seem to be associated with comparisons between the
announcement date ([0, 0]) and the event window immediately preceding it ([−4,−1]). However,
for short-dated options with time to expiration less than 30 days, the statistic for the difference in
distributions for the shift from event window [−29,−25] to [−4,−1], excluding the announcement
effect, is with a value of 0.3388 (0.34) for call (put) options higher than the announcement effect
from the event window [−4,−1] to the announcement date. Changes in the bivariate distributions
are statistically significant at the 1% level, for almost all event windows.
5.2.4 Abnormal Trading Volume - Event Study
Hypothesis H1 asserts that there is positive abnormal trading volume in call equity options written
on the target prior to a public M&A announcement. We test this formally by running a classical
event study. For each of the 1,859 deals in the sample, we obtain the aggregated total option
volume on the target’s stock, as well as the total aggregated volume traded in calls and puts. To
compute the abnormal trading volume, we use, as a benchmark, a constant-mean-trading-volume
model, as well as two different volume-based versions of the market models. We define the market
trading volume as the median (mean) total call and put trading volume across all options in the
OptionMetrics database. As we are interested in the abnormal trading volume in anticipation of
the event, we use as the estimation window the period starting 90 days before the announcement
date until 30 days before the event. The event window in our case stretches from 30 days before
until one day prior to the event. To account for the possibility of clustered event dates, we correct
all standard errors for cross-sectional dependence.
The results are reported in Table 5. The average cumulative abnormal trading volume is positive
and statistically significant for target firms, across all model specifications. The magnitude of the
average cumulative abnormal volume over the 30 pre-event days is also economically meaningful
with an estimate of 11,969 contracts, for call options using the median market model. For put
options on the target, average cumulative abnormal volume is also positive and highly statistically
significant, but the average cumulative abnormal volume over the 30 pre-event days at 3,471 con-
tracts is economically much smaller. The evolution of average abnormal and cumulative abnormal
trading volume for targets is illustrated in the two panels in Figure 4. It is apparent that the
19
average cumulative abnormal trading volume in put options is quantitatively less important than
the average cumulative abnormal trading volume in call options, which is primarily driving the
results for the overall sample. The daily average abnormal volume for call options is positive and
steadily increasing to a level of approximately 1,500 contracts, the day before the announcement.
Individually, the number of deals with positive abnormal trading volume at the 5% significance
level ranges from 472 to 492 for calls, and from 271 to 319 for puts, corresponding to 25% and
15% of the entire sample respectively.23 These results confirm the null Hypothesis H1, that there
is positive abnormal trading volume in call and put equity options written on the target, prior to
a public M&A announcement.
In addition to the aggregated results, we stratify our sample by moneyness, and conduct an
event study for each category. We find that there is significantly higher abnormal trading volume
for targets in OTM call options, compared to ATM and ITM calls, both in terms of volume levels
and frequencies. Using the median market model, for instance, the average cumulative abnormal
volume is 3,797 (1,860) contracts for OTM calls (puts) and 1,702 (1,110) contracts for ITM calls
(puts), while it is 1,059 (188) for ATM calls (puts). These values correspond to 383 (300, 448) deals,
or 21% (16%, 24%) for OTM (ATM, ITM) calls, and 387 (254, 316) deals or 21% (14%, 17%), for
OTM (ATM, ITM) puts, respectively. In addition, while we find that the average cumulative
abnormal volume is positive and statistically significant for both OTM and ITM calls and puts, it
is only statistically significant at the 5% level for ATM call options, but not for put options. Panel B
reports the results from paired t-tests for differences in means of the cumulative average abnormal
volumes across different depths. Consistent with our hypothesis H2, these results emphasize that
there is a higher ratio of abnormal trading volumes for OTM call options, compared to ATM and
ITM call options. The difference in means, using the median market model, for OTM calls relative
to ATM and ITM calls is 2,738 and 2,096 respectively, which is positive and statistically different
from zero. On the other hand, the difference in means between ATM and ITM calls is slightly
negative (-643), but not statistically different from zero. Even though we do confirm that the
ratio of the average cumulative abnormal volume for ITM put options is higher than for ATM put
23Unreported results indicate that, at the 1% significance level, the number of deals with positive abnormal tradingvolume for the entire sample range from 278 to 292 for calls, and from 138 to 195 for puts, corresponding to afrequency of 16% and 8%, respectively
20
options, we also find that there is a higher expected abnormal volume for OTM, compared to ITM
put options, even though the difference of 750 contracts is small in magnitude, given that it is a
cumulative measure over 30 days. This is some preliminary evidence that informed traders may
not only engage in OTM call transactions, but potentially also sell ITM puts.
To summarize, the event study further supports hypotheses H1 and H2. In other words, there
is ample evidence of positive abnormal volume in equity options for the target firms in M&A
transactions, prior to the announcement date. In addition, we document that, for the targets,
there is a significantly larger amount of abnormal trading volume in OTM call options, compared
to ATM and ITM call options. However, the evidence that informed traders may also engage in
writing ITM put options is not as strong.24 The results of the event study are supported by formal
statistical evidence that the two-dimensional volume-moneyness distribution significantly shifts,
over both time and moneyness, over the 30 days preceding the announcement day. Hence, the level
of the volume distribution increases with a higher frequency of trades occurring in both OTM calls
and ITM puts. Moreover, this shift in the bivariate distribution is not random, as we illustrate by
comparing the volume distribution from the SUT sample to that of a randomly matched sample.
5.2.5 Non-parametric Volume at Risk.
To supplement our forensic analysis on the behavior of option volume before takeover announce-
ments, we analyze trading volume patterns conditional on no trading volume for one to five earlier
days. This analysis may be insightful, given the significant number of zero volume observations that
characterize the data for equity options. To do so, we calculate, non-parametrically, the probability
of spikes in trading volume, conditional on zero trading volume between one and five days prior to
the spike. We define as the conditionalVolume-at-risk (VolaR), at a confidence level α ∈ (0, 1), the
smallest trading volume ν, such that the probability of the volume V exceeding ν is less than or
24One reason for this discrepancy may be that writing naked puts is a risky position, especially ITM puts. Thereis always some probability that the deal may not go through, and the stock will tumble. Also, selling naked putsrequires a large margin, which may be a binding constraint.
21
equal to (1− α). Formally, V olaR is given by:
V olaRiα = inf{ν ∈ R : P (V > ν) ≤ 1− α,i∑
j=1
Vt−j = 0}, i = 1, 2, ...5 (5)
The statistics in Panel A of Table 7 show the VolaR statistics for the 30 days preceding the
announcement dates. We see that, for target companies, if there is a day with zero option trading
volume on a given company, the probability that the volume exceeds 100 (200; 1,000) contracts
during the next day is less than 10% (5%, 1%). The probability of observing more than 96 (191;
1,000) traded contracts on a company when there was no option trading volume on its stock during
the preceding day, is less than 10% (5%, 1%). Naturally, the V olaRiα levels decrease for the more
restrictive cases with several preceding days with zero trading volume (i > 1). However, the values
are close to the benchmark case (i = 1) of zero trading volume for one preceding day only. In the case
with five earlier days with no recorded option trading, the probabilities of exceeding respectively
more than 65, 126 or 710 traded contracts are less than 10%, 5% and 1%. We compare these critical
levels of trading volumes with the sample statistics from the SUT selection, which correspond to the
same 30 days before the announcement dates. We have argued that the unconditional probability of
exceeding more than 100 traded contracts on any given company, when there was no trading volume
on the preceding day, is less than 10%. This volume of 100 contracts seems small in comparison
to the average trading volume in call options, written on the target, from the SUT sample. The
average trading volume of option trades characterized as strongly unusual, which occurred during
the 30 days preceding a M&A announcement, is 124 contracts, with the volume for call options
being slightly higher (137 contracts). Thus, the VolaR statistics further emphasize the strongly
unusual trading patterns in anticipation of these publicly unexpected events.
In addition, we compare the VolaR statistics with those of a randomly matched sample. Similar
to the earlier exercise, we randomly choose 1,859 pseudo-event dates for the target companies, and
then investigate the VolaR statistics over the 30 days preceding the pseudo-event dates. Given
that trading picks up during the pre-announcement period, one would expect to observe fewer days
with zero trading volume for individual equity options, and as a consequence, the VolaR statistics
should be lower in sample. Panel B in Figure 7 compares our prior. The VolaR levels are indeed
22
higher in the randomly matched sample. For instance, the 1% VolaR level for target companies is
1,525 option contracts in the random sample compared to 1,000 in the real sample.
The forensic analysis of the trading volume behavior in equity options confirms our priors stated
in Hypotheses H1 and H2. The next step is to investigate Hypotheses H3 to H6 by focusing on the
information embedded in equity option prices, based on their implied volatilities.
5.3 Implied Volatiliy
The price behavior of options is embedded in the summary statistic of implied volatility. As a
complement to the volume results, we conduct a forensic analysis of the implied volatility over the
30 days preceding the announcement date. We first conduct an event study to test for the presence
of positive excess implied volatility relative to a market benchmark. Second, we study the behavior
of the convexity of the option smile, in anticipation of news releases, followed by investigations of
the bid-ask spread. Finally, we address the hypothesis related to the term structure of implied
volatility.
5.3.1 Excess Implied Volatility - Event Study
We use the interpolated volatility surface in the OptionMetrics database for this exercise. To
analyze the behavior of ATM implied volatility, we use the 50 delta (or 0.50) options in absolute
value (calls and puts), and we reference the 80 and 20 delta (or 0.80 and 0.20) options in absolute
value for ITM and OTM options respectively. We test two different model specifications for our
results: a simple constant mean volatility model and a market model, where we use the S&P 500
VIX index as the market’s benchmark for implied volatility. The estimation window runs from 90
to 31 days before the announcement date, while our event window relates to the 30 days before the
event, excluding the announcement day itself. All standard errors are clustered by time to account
for the clustering of events.
Panel A in Table 8 documents that excess implied volatility is quite pervasive in our sample.
At the 5% significance level, using the market model, there are about 812 cases (44% of the 1,859
deals) with positive excess implied volatility for call options, and about 798 cases (43% of the 1,859
deals) with positive excess implied volatility for put options. The frequencies are similar for OTM
23
implied volatilities, and slightly lower for ITM implied volatilities, where positive excess implied
volatility is documented for 39% (calls) and 41% (puts) of all cases.
To summarize, the event study confirms our Hypothesis H3, which asserts that there should,
on average, be positive cumulative excess implied volatility for the target companies. These results
are graphically presented in Figure 5 for ATM implied volatilities for target companies. For tar-
gets, the daily average excess ATM implied volatility starts increasing about 18 days before the
announcement date and rises up to an excess of 5% the day before the announcement.
5.3.2 Information Dispersion and Bid-Ask Spreads
To address hypothesis H4, we study the evolution of the bid-ask spread in anticipation of the
M&A announcement. The prediction of the null hypothesis H4 is that the percentage bid-ask
spread in option premia should widen prior to the announcement. Strong evidence in favor of this
hypothesis would indicate that the market (i.e., the market maker) is reacting to a substantial
increase in demand for options, in particular OTM calls. Figure 6a plots the evolution of the
average percentage bid-ask spread from 90 days before the announcement date to 90 days after
the event. The figure shows that the average percentage bid-ask spread on target options rises
from about 35% to 55%, and then jumps up to approximately 80%, following the announcement.
Interestingly, this rise in bid-ask spreads is restricted to DOTM and OTM options, as is illustrated
in Figure 6b. It seems that our hypothesis regarding the pre-announcement period is confirmed,
based on a quick glance at the graph. A rise of 20 percent in the bid-ask spread is substantial.25
To summarize, although we find that the percentage bid-ask spread in targets’ option premia
increases prior to the announcement, it could be arguably used as evidence that the market reacts
to a potential news release, possibly triggered by a large option order.
25In general, when we compare the B-A spread across companies with different stock prices or over time whenthere are significant changes in the stock price, we should use a leverage adjusted B-A spread. However, in our case,we look at a short period of time before the announcement where the stock price does not change that much and weobserve that the B-A spread increases irrespective of the price of the stock of different targets.
24
5.3.3 Volatility Smile and the Term Structure of Implied Volatility
Hypotheses H5 predicts that the convexity of the option smile, for target firms, should increase
for call options and decrease for put options, prior to M&A announcements.26 We investigate this
question by plotting in Table 7 various measures relating to the convexity of the option smile.
Graphs 7a and 7b illustrate several documented measures of the implied volatility (IV) skewness.
The first measure in Figure 7a is computed separately for calls and for puts. For call (put) options,
it is defined as the difference between the OTM and ATM IV. For call options, it is the difference
between OTM IV with a delta of 20 and ATM IV with a delta of 50 (left axis). For puts, it is
defined as the difference between ITM IV for puts with a delta of -80 and ATM IV for puts with a
delta of -50 (right axis). In Figure 7b, the IV skewness on the left scale is measured as the difference
between OTM call and put IV, standardized by ATM IV. The second measure, on the right axis, is
measured as the difference between OTM implied put and ATM implied IV. To our surprise, both
measures seem to remain flat prior to the announcement date. We cannot reject the hypothesis
that prior to the announcement there is not a change in the “skew” of the options on the target
firms. In addition, we plot two versions of the IV Spread in Figure 7c: the difference between the
ATM call and put options, with deltas of 50 and -50 respectively (left axis); the difference between
OTM call options with a delta of 25 and ITM put options with a delta of -80 (right axis). The
increasing IV Spread prior to the announcement date is evidence suggestive of price pressure in the
option market.
Hypothesis H6 states that the term structure of implied volatility should decrease for options
on the target firms before takeover announcements. The justification for this hypothesis is that
informed traders obtain the highest leverage by investing in short-dated OTM call options. Hence,
demand pressure for short-dated options should lead to a relative price increase in options with a
short time to expiration compared to long-dated options. Thus, a confirmation of our hypothesis
would be supportive of the fact that, on average, activity in the option market before major takeover
announcements is partially influenced by informed traders. Figure 7d documents that the slope of
the average term structure of implied volatility, calculated by the difference between the implied
volatility of 3-month and 1-month options, is decreasing from -1.8% by about 2.5 percentage points
26In case the IV/strike price curve exhibits a “skew”, the change in convexity should “flatten” the curve.
25
to approximately -4.3% over the 30 days before the announcement date. This result obtains for
both call and put options.
In a nutshell, we find supportive evidence of the fact that the average implied volatility spread
significantly increase for target firms, prior to M&A announcements. In addition, the term structure
of implied volatility becomes more negative for targets and remains roughly flat for acquirers, as
we approach the announcement.
5.4 Acquirer Firms
We have documented strongly unsual trading activity in options written on target companies. We
also suspect to observe unusual trading activity for the acquiring firms. Chan et al. (2013), for
instance, document the predictive ability of option volume for ex-post announcements returns for
the acquirer. However, the question of how an insider would trade in equity options on the acquirer
and what strategy he would use, is somewhat more subtle. The consistent empirical evidence of
positive cumulative abnormal returns for the targets implies that the insider benefits most from
directional strategies. In contrast, given the uncertainty of the stock price evolution of the acquirer
around the announcement date, an insider would benefit most by engaging in strategies that benefit
from higher volatility (i.e. a jump in stock prices). More specifically, the optimal strategy would
be a zero-delta and long gamma trade. This corresponds to hypothesis H7. As stated above, this is
particularly true for cash deals and in some cases true for stock exchange and hybrid deals. In our
sample, this will mean that in the majority of deals there is uncertainty regarding the acquirer’s
stock price. We therefore concentrate on the “volatility” strategies.
We first provide a quick overview of the summary statistics on option trading volume, stratified
by time to expiration and moneyness in Table 9. Panels A to C report statistics for all options in the
sample, while Panels D to F and G to I report the numbers separately for calls and puts. Similar to
the properties of the target firms, the mean trading volume is higher for short and medium-dated
options compared to long-dated options.27 On the other hand, the average trading volume is higher
for options on the acquirer firms (547 contracts) than on targets (283 contracts). Importantly, the
27For example, the average number of traded contracts in OTM options, for the acquirer, is 497 and 384 contractsfor maturities of respectively less than 30 and 60 days, while it is 193 contracts for options with more than 60 daysto maturity. This difference is more pronounced for call options than for put options.
26
distribution of volume as a function of depth-in-moneyness exhibits a hump-shaped pattern for
acquirers, irrespective of whether the options are short- or long-dated. Hence, trading volume
tends to be highest for ATM options and decreases as S/K moves further ITM or OTM. In the
entire universe, for instance, the average volume is 1,084 contracts ATM, 497 and 398 contracts
respectively OTM and ITM, and 127 and 214 contracts respectively for DOTM and DITM options.
This contrasts with the distribution for the targets, where the highest average trading volume tends
to be associated with OTM options.
According to hypothesis H7, we anticipate an increase in trading volume of option pairs which
have high gamma (convexity), such as ATM straddle strategies, for example. In order to test
this hypothesis, we match on each day all call-put pairs (CP pairs) that are written on the same
underlying stock and that have identical strike prices and time to expiration. OptionMetrics only
provides information on the total trading volume associated with a specific option, and there is no
disclosure on the total number of trades. Thus, the lower of the call and put trading volume in a CP
pair represents an upper bound on the total volume of straddle trading strategies implemented in a
given day. Even though this number does not capture the exact amount of the straddle volume, a
change in its upper bound across event times can be informative about potential trading strategies
undertaken by insiders, as a proxy.
Figure 8 illustrates how the upper bound on the volume of straddle trading strategies changes
from 30 days before the announcement day to 20 days after the first takeover attempt has been
publicly announced. In addition, we report the average and total number of CP pairs identifed
on each event day. According to our hypothesis, the straddle trading volume should increase for
acquirer firms prior to the announcement. The upward trend is visually confirmed in the graphical
illustrations.
We have documented that there is on average more trading volume in ATM options for acquiring
companies, and that prior to announcements, the trading volume of strike-matched put-call pairs
increases. We therefore evaluate whether an increase in ATM trading volume in the pre-event
window is random. For this purpose, we present a modified strongly unusual trading sample
for the acquirer (SUT-A). We select all options that are (1) ATM, (2) that expire on or after
the announcement day (the so-called front month option), (3) that have strictly positive trading
27
volume, (4) and that trade within 30 days of the event-date.
Table 10 presents the sample statistics for the SUT-A sample. From the entire dataset, we
identify 5,343 option-day observations for the acquirer firms, which meet our SUT-A selection
criteria. The share of calls is slightly more than half, with a total of 2,860 observations. The
average trading volume is 1,046 option contracts, and the average trading volume for calls and puts
is, respectively, 1,257 and 803. The median trading volume for all options is 202, and the median
call (put) trade is 244 (163).
We compare the statistics from the SUT-A sample with those from a randomly selected sample.
For each deal, we randomly select a “pseudo-event” date and apply the SUT-A selection criteria.
Panel B illustrates that in the random sample, there are fewer ATM trades (about half). For the
entire sample, the difference between the average volume (1,046) before the deal announcement,
in the SUT-A sample, and the average volume (658) on a random date, in the RST sample, is
significantly different from zero. The one-sided t-statistics is -5.72, implying a probability of 6 in a
billion that the observed trading volume before the announcement happened by chance.
To summarize, our evidence suggests that there is a non-random increase in ATM trading
volume on aquirer options ahead of M&A announcements. We also document an increase in the
number of ATM strike-matched put-call pairs, suggesting that there is an increase in long-gamma
strategies. This evidence is consistent with hypothesis H7.
6 SEC Litigation Reports
Up to this stage, we have only presented statistical evidence of unusual option trading activity
ahead of M&A announcements. We now verify whether there is any relationship between the
unusual activity and insider trading cases that we know, with hindsight, have been prosecuted. To
do so, we use the actual litigation releases concerning civil lawsuits brought by the Securities and
Exchange Commission in federal court. The litigation reports are publicly available on the SEC’s
website.28 We extract all cases that encompass trading in stock options around M&A and takeover
announcements, during the period January 1, 1990 to December 31, 2013. Table 11 provides the
characteristics.
28https://www.sec.gov/litigation/litreleases.shtml
28
In total, we find 83 unique cases during this period, with an average of about four cases per
year. Out of these 83 cases, 69 correspond to our sample period, which stretches from January 1,
1996 to December 31, 2012. Again, during this period, there are, on average, four cases per year.
The average yearly number of announcements in our sample is 109.29 According to these statistics,
and assuming that the publicly disclosed deals represent all litigated cases, we conclude that the
SEC litigates on average about 3.7% of the 1,859 M&A deals included in our sample. Several of
these cases are not covered by our sample because of the aforementioned restriction criteria for our
selection. However, 49 of the SEC litigation cases are covered in our sample. In other words, we
cover 71% of the litigated cases in our sample, with the Type II error rate being 30%.30
We next describe the characteristics of the option trades that we are able to extract from
the information in the SEC litigation reports. To the best of our knowledge, we are the first to
report descriptive statistics of the SEC-litigated option trades, prior to M&A announcements.31
The average profit reaped through “rogue trades” in our sample period is 1.366 million USD. As
conjectured by us, this profit arises from deals that are almost exclusively purchases of OTM call
options, at a single strike price or multiple strike prices. Also, as expected, the average ratio of
stock to strike price is 91%. Furthermore, the insider trades are primarily executed in the so-called
front-month options, with an average option time to expiration of 2 months. It is also interesting
to note that there is large variation in the timing of trades. The average inside trader transacts
15 days before the announcement date. However, the majority of trades occur within 20 days
of the announcement. Finally, it takes the SEC, on average, 740 days to publicly announce its
first litigation action, but for the prosecuted cases relating to transactions announced in 1995, the
average time to litigation was as high as 2,090 days. Thus, assuming that the litigation releases
coincide approximately with the actual initiation of investigations, then it takes the SEC on average
about 2 years to prosecute a rogue trade.
29Note that, while we also include incomplete and rumored deals, we only include transactions that imply a changein corporate control, and that we exclude small deals with rank values below $ 1 million.
30To be precise about the definition of Type I and Type II errors, we start with the null hypothesis that our samplecovers all the cases litigated by the SEC. Thus, we define the Type I error to include cases that we identify to haveoriginated from an insider, but that were not litigated by the SEC. Similarly, we define the Type II error to includecases litigated by the SEC that we fail to identify. By definition, these cases are not in our sample.
31Admittedly, the SEC has much more granular and detailed information on these cases, but we are not aware ofany study that systematically analyzes this information, other than the early study by Meulbroek (1992) which isfocused on stock trading.
29
To summarize the SEC litigation files that contain information about option trades ahead of
M&A announcements, we conclude that the bulk of the prosecuted trades are purchases of plain-
vanilla short-dated OTM call options, that are approximately 9% OTM, and occur within 20 days
prior to the announcement. These findings are consistent with the statistical analysis performed in
the previous section.
7 Conclusion
Research on trading in individual equity options has been scanty, and even more so, centered on
major informational events, such as M&As. In light of recent investigations into insider trading
based on unusual abnormal trading volume in anticipation of major corporate acquisitions, we
investigate the presence of informed option trading around such unexpected public announcements.
We focus on equity options written on target and acquirer firms. Our goal is to quantify the
likelihood of informed trading by investigating various options trading strategies, which should a
priori lead to unusual abnormal trading volume and returns in the presence of private information.
Our analysis of trading volume and implied volatility over the 30 days preceding formal takeover
announcements suggests that that informed trading, whether based on inside information or leakage,
is more pervasive than what would be expected based on the actual number of prosecuted cases.
We find that there is statistically significant abnormal trading volume in call options written on
the target, prior to M&A announcements, with particular pronounced effects for OTM calls. We
provide formal tests of shifts in the bivariate volume-moneyness distribution and illustrate that the
levels of unusual volume in options trading cannot be replicated in a randomly matched sample.
We further find strong support for positive excess implied volatility for the target companies. In
addition, for targets, the term structure of implied volatility becomes more negative and the implied
volatility spread widens. The evidence from the bid-ask spread is more mixed.
Future analysis, based on the attributes of abnormal volume and excess implied volatility, will
lead to a classification that should ultimately be reflective of those cases that are most likely of
insider trading.
30
References
Acharya, V. V. and Johnson, T. C. (2010). More insiders, more insider trading: Evidence fromprivate-equity buyouts, Journal of Financial Economics 98(3): 500 – 523.
Andrade, G., Mitchell, M. and Stafford, E. (2001). New evidence and perspectives on mergers, TheJournal of Economic Perspectives 15(2): pp. 103–120.
Barraclough, K., Robinson, D. T., Smith, T. and Whaley, R. E. (2012). Using option prices to inferoverpayments and synergies in m&a transactions, Review of Financial Studies .
Bester, A., Martinez, V. H. and Rosu, I. (2011). Option pricing and the probability of success ofcash mergers, Working Paper .
Bollen, N. P. B. and Whaley, R. E. (2004). Does net buying pressure affect the shape of impliedvolatility functions?, The Journal of Finance 59(2): 711–753.
Cao, C., Chen, Z. and Griffin, J. M. (2005). Informational content of option volume prior totakeovers, The Journal of Business 78(3): pp. 1073–1109.
Cao, H. H. and Ou-Yang, H. (2009). Differences of opinion of public information and speculativetrading in stocks and options, Review of Financial Studies 22(1): 299–335.
Chan, K., Ge, L. and Lin, T.-C. (2013). Informational content of option trading on acquirerannouncement return, forthcoming in the Journal of Financial and Quantitative Analysis .
Chesney, M., Crameri, R. and Mancini, L. (2011). Detecting informed trading activities in theoptions markets, NCCR FINRISK Working Paper No. 560 .
Cohen, L., Malloy, C. and Pomorski, L. (2012). Decoding inside information, The Journal ofFinance 67(3): 1009–1043.
Cremers, M. and Weinbaum, D. (2010). Deviations from put-call parity and stock return pre-dictability, The Journal of Financial and Quantitative Analysis 45(2): pp. 335–367.
Crimmins, S. J. (2013). Insider trading: Where is the line?, Columbia Business Law Review 2: 330–368.
Deuskar, P., Gupta, A. and Subrahmanyam, M. G. (2011). Liquidity effect in {OTC} optionsmarkets: Premium or discount?, Journal of Financial Markets 14(1): 127 – 160.
Driessen, J., Tse-Chun, L. and Xiaolong, L. (2012). Why do option prices predict stock returns?,Working Paper .
Dubinsky, A. and Johannes, M. (2006). Fundamental uncertainty, earning announcements andequity options, Working Paper Columbia University .
Easley, D., O’Hara, M. and Srinivas, P. S. (1998). Option volume and stock prices: Evidence onwhere informed traders trade, The Journal of Finance 53(2): pp. 431–465.
Fasano, G. and Franceschini, A. (1987). A multidimensional version of the kolmorogov-smirnovtest., Monthly Notices of the Royal Astronomical Society 225: 155–170.
31

Frino, A., Satchell, S., Wong, B. and Zheng, H. (2013). How much does an illegal insider trade?,International Review of Finance 13(2): 241–263.
Garleanu, N., Pedersen, L. H. and Poteshman, A. M. (2009). Demand-based option pricing, Reviewof Financial Studies 22(10): 4259–4299.
Greenberg, S. L. (2008). Bivariate goodness-of-fit tests based on kolmogorov-smirnov type statistics,Dissertation for the fulfillment of the requirements for the degree Master of Science in Mathe-matical Statistics .
Hu, J. (2013). Does option trading convey stock price information?, Journal of Financial Eco-nomics, forthcoming .
Jin, W., Livnat, J. and Zhang, Y. (2012). Option prices leading equity prices: Do option tradershave an information advantage?., Journal of Accounting Research 50(2): 401 – 432.
John, K., Koticha, A., Narayanan, R. and Subrahmanyam, M. G. (2003). Margin rules, informedtrading in derivatives and price dynamics, Working Paper New York University, Stern School ofBusiness .
Johnson, T. L. and So, E. C. (2011). The option to stock volume ratio and future returns, forth-coming in the Journal of Financial Economics .
Keown, A. J. and Pinkerton, J. M. (1981). Merger announcements and insider trading activity: Anempirical investigation, The Journal of Finance 36(4): pp. 855–869.
Meulbroek, L. K. (1992). An empirical analysis of illegal insider trading, The Journal of Finance47(5): pp. 1661–1699.
Nicolau, A. A. (2010). An examination of the behavior of implied volatility around merger an-nouncements, Bachelor of Science Thesis, New York University, Leonard N. Stern School ofBusiness .
Pan, J. and Poteshman, A. M. (2006). The information in option volume for future stock prices,The Review of Financial Studies 19(3): pp. 871–908.
Podolski, E. J., Truong, C. and Veeraraghavan, M. (2013). Informed options trading prior totakeovers does the regulatory environment matter?, Journal of International Financial Markets,Institutions & Money .
Poteshman, A. M. (2006). Unusual option market activity and the terrorist attacks of september11, 2001, The Journal of Business 79(4): pp. 1703–1726.
Roll, R., Schwartz, E. and Subrahmanyam, A. (2010). O/s: The relative trading activity in optionsand stock, Journal of Financial Economics 96(1): 1 – 17.
Savor, P. G. and Lu, Q. (2009). Do stock mergers create value for acquirers?, The Journal ofFinance 64(3): pp. 1061–1097.
Spyrou, S., Tsekrekos, A. and Siougle, G. (2011). Informed trading around merger and acquisitionannouncements: Evidence from the uk equity and options markets, Journal of Futures Markets31(8): 703–726.
32
Subramanian, A. (2004). Option pricing on stocks in mergers and acquisitions, The Journal ofFinance 59(2): pp. 795–829.
Tamersoy, A., Xie, B., Lenkey, S. L., Routledge, B. R., Chau, D. H. and Navathe, S. B. (2013). Insideinsider trading: Patterns & discovery from a large scale exploratory analysis, 2013 IEEE/ACMInternational Conference on Advances in Social Networks Analysis and Mining .
Wang, X. (2013). What does the {SEC} choose to investigate?, Journal of Economics and Business65(0): 14 – 32.
Xing, Y., Zhang, X. and Zhao, R. (2010). What does the individual option volatility smirk tell usabout future equity returns?., Journal of Financial & Quantitative Analysis 45(3): 641 – 662.
33
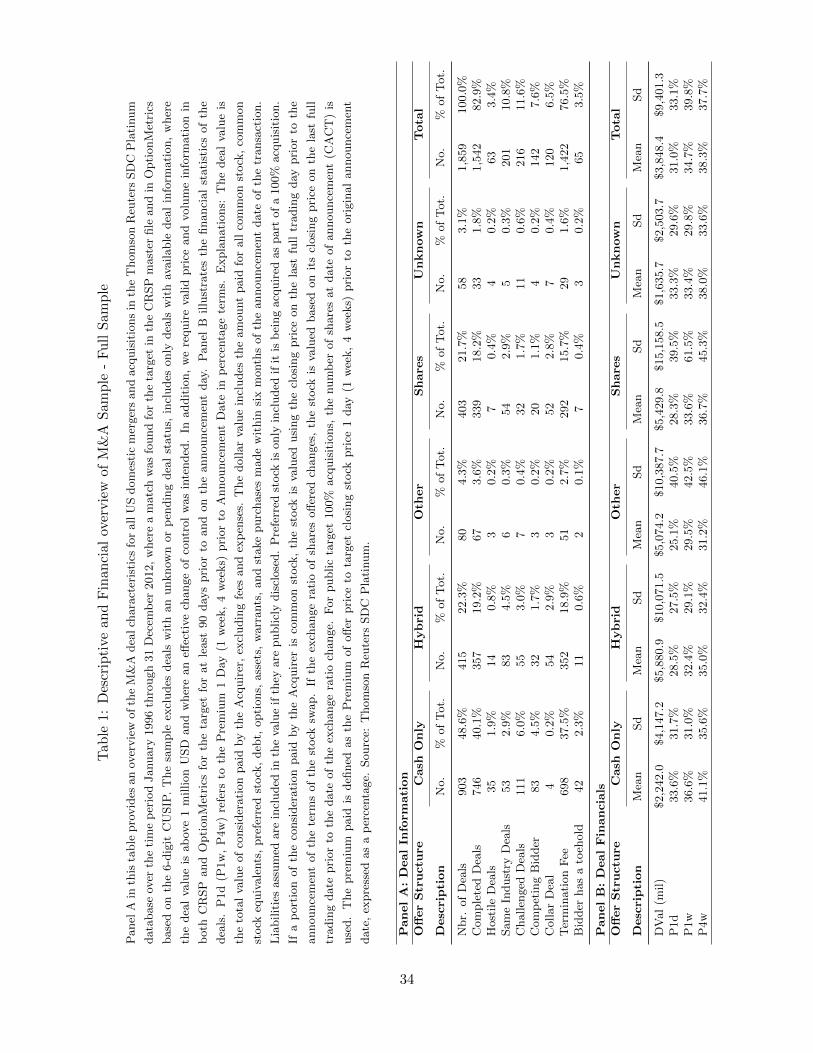
Tab
le1:
Des
crip
tive
and
Fin
anci
alov
ervie
wof
M&
AS
amp
le-
Fu
llS
amp
le
Panel
Ain
this
table
pro
vid
esan
over
vie
wof
the
M&
Adea
lch
ara
cter
isti
csfo
rall
US
dom
esti
cm
erger
sand
acq
uis
itio
ns
inth
eT
hom
son
Reu
ters
SD
CP
lati
num
data
base
over
the
tim
ep
erio
dJanuary
1996
thro
ugh
31
Dec
emb
er2012,
wher
ea
matc
hw
as
found
for
the
targ
etin
the
CR
SP
mast
erfile
and
inO
pti
onM
etri
cs
base
don
the
6-d
igit
CU
SIP
.T
he
sam
ple
excl
udes
dea
lsw
ith
an
unknow
nor
pen
din
gdea
lst
atu
s,in
cludes
only
dea
lsw
ith
available
dea
lin
form
ati
on,
wher
e
the
dea
lva
lue
isab
ove
1m
illion
USD
and
wher
ean
effec
tive
change
of
contr
ol
was
inte
nded
.In
addit
ion,
we
requir
eva
lid
pri
ceand
volu
me
info
rmati
on
in
both
CR
SP
and
Opti
onM
etri
csfo
rth
eta
rget
for
at
least
90
day
spri
or
toand
on
the
announce
men
tday
.P
anel
Billu
stra
tes
the
financi
al
stati
stic
sof
the
dea
ls.
P1d
(P1w
,P
4w
)re
fers
toth
eP
rem
ium
1D
ay(1
wee
k,
4w
eeks)
pri
or
toA
nnounce
men
tD
ate
inp
erce
nta
ge
term
s.E
xpla
nati
ons:
The
dea
lva
lue
is
the
tota
lva
lue
of
consi
der
ati
on
paid
by
the
Acq
uir
er,
excl
udin
gfe
esand
exp
ense
s.T
he
dollar
valu
ein
cludes
the
am
ount
paid
for
all
com
mon
stock
,co
mm
on
stock
equiv
ale
nts
,pre
ferr
edst
ock
,deb
t,opti
ons,
ass
ets,
warr
ants
,and
stake
purc
hase
sm
ade
wit
hin
six
month
sof
the
announce
men
tdate
of
the
transa
ctio
n.
Lia
bilit
ies
ass
um
edare
incl
uded
inth
eva
lue
ifth
eyare
publicl
ydis
close
d.
Pre
ferr
edst
ock
isonly
incl
uded
ifit
isb
eing
acq
uir
edas
part
of
a100%
acq
uis
itio
n.
Ifa
port
ion
of
the
consi
der
ati
on
paid
by
the
Acq
uir
eris
com
mon
stock
,th
est
ock
isva
lued
usi
ng
the
closi
ng
pri
ceon
the
last
full
tradin
gday
pri
or
toth
e
announce
men
tof
the
term
sof
the
stock
swap.
Ifth
eex
change
rati
oof
share
soff
ered
changes
,th
est
ock
isva
lued
base
don
its
closi
ng
pri
ceon
the
last
full
tradin
gdate
pri
or
toth
edate
of
the
exch
ange
rati
och
ange.
For
public
targ
et100%
acq
uis
itio
ns,
the
num
ber
of
share
sat
date
of
announce
men
t(C
AC
T)
is
use
d.
The
pre
miu
mpaid
isdefi
ned
as
the
Pre
miu
mof
off
erpri
ceto
targ
etcl
osi
ng
stock
pri
ce1
day
(1w
eek,
4w
eeks)
pri
or
toth
eori
gin
al
announce
men
t
date
,ex
pre
ssed
as
ap
erce
nta
ge.
Sourc
e:T
hom
son
Reu
ters
SD
CP
lati
num
.
Panel
A:
Deal
Info
rmati
on
Off
er
Str
uctu
reC
ash
Only
Hybri
dO
ther
Share
sU
nknow
nT
ota
l
Desc
ripti
on
No.
%of
Tot.
No.
%of
Tot.
No.
%of
Tot.
No.
%of
Tot.
No.
%of
Tot.
No.
%of
Tot.
Nbr.
of
Dea
ls903
48.6
%415
22.3
%80
4.3
%403
21.7
%58
3.1
%1,8
59
100.0
%C
om
ple
ted
Dea
ls746
40.1
%357
19.2
%67
3.6
%339
18.2
%33
1.8
%1,5
42
82.9
%H
ost
ile
Dea
ls35
1.9
%14
0.8
%3
0.2
%7
0.4
%4
0.2
%63
3.4
%Sam
eIn
dust
ryD
eals
53
2.9
%83
4.5
%6
0.3
%54
2.9
%5
0.3
%201
10.8
%C
hallen
ged
Dea
ls111
6.0
%55
3.0
%7
0.4
%32
1.7
%11
0.6
%216
11.6
%C
om
pet
ing
Bid
der
83
4.5
%32
1.7
%3
0.2
%20
1.1
%4
0.2
%142
7.6
%C
ollar
Dea
l4
0.2
%54
2.9
%3
0.2
%52
2.8
%7
0.4
%120
6.5
%T
erm
inati
on
Fee
698
37.5
%352
18.9
%51
2.7
%292
15.7
%29
1.6
%1,4
22
76.5
%B
idder
has
ato
ehold
42
2.3
%11
0.6
%2
0.1
%7
0.4
%3
0.2
%65
3.5
%
Panel
B:
Deal
Fin
ancia
ls
Off
er
Str
uctu
reC
ash
Only
Hybri
dO
ther
Share
sU
nknow
nT
ota
l
Desc
ripti
on
Mea
nSd
Mea
nSd
Mea
nSd
Mea
nSd
Mea
nSd
Mea
nSd
DV
al
(mil)
$2,2
42.0
$4,1
47.2
$5,8
80.9
$10,0
71.5
$5,0
74.2
$10,3
87.7
$5,4
29.8
$15,1
58.5
$1,6
35.7
$2,5
03.7
$3,8
48.4
$9,4
01.3
P1d
33.6
%31.7
%28.5
%27.5
%25.1
%40.5
%28.3
%39.5
%33.3
%29.6
%31.0
%33.1
%P
1w
36.6
%31.0
%32.4
%29.1
%29.5
%42.5
%33.6
%61.5
%33.4
%29.8
%34.7
%39.8
%P
4w
41.1
%35.6
%35.0
%32.4
%31.2
%46.1
%36.7
%45.3
%38.0
%33.6
%38.3
%37.7
%
34
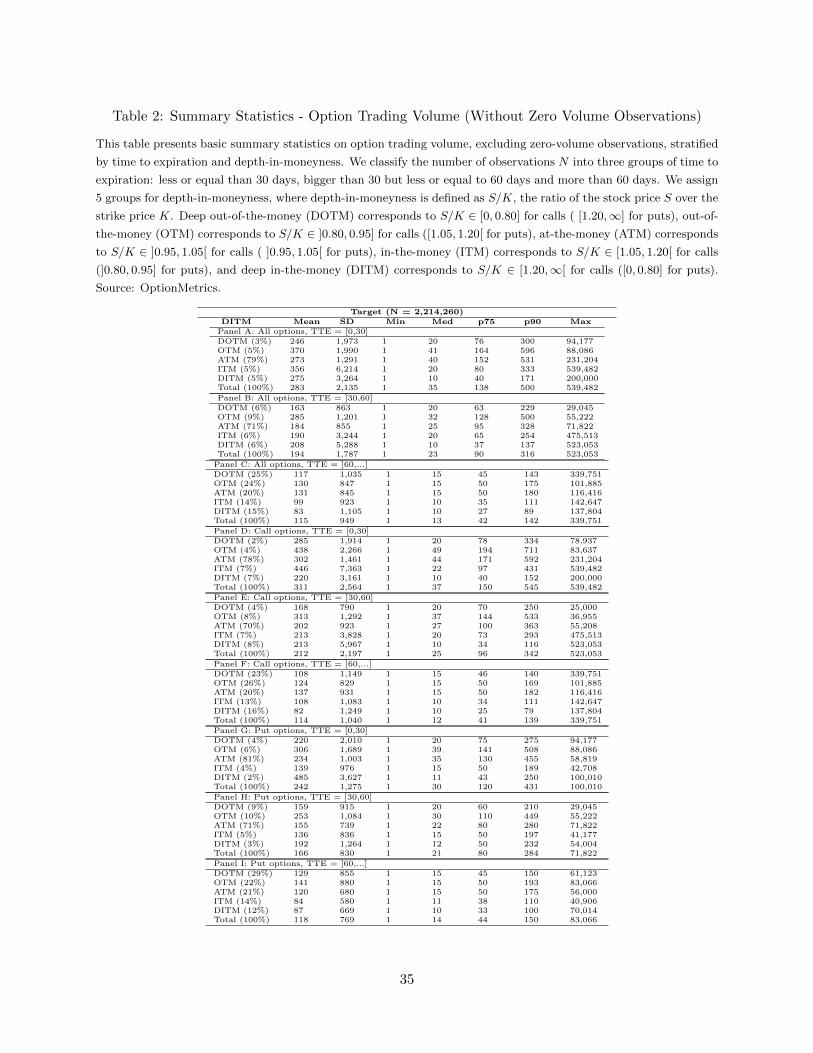
Table 2: Summary Statistics - Option Trading Volume (Without Zero Volume Observations)
This table presents basic summary statistics on option trading volume, excluding zero-volume observations, stratified
by time to expiration and depth-in-moneyness. We classify the number of observations N into three groups of time to
expiration: less or equal than 30 days, bigger than 30 but less or equal to 60 days and more than 60 days. We assign
5 groups for depth-in-moneyness, where depth-in-moneyness is defined as S/K, the ratio of the stock price S over the
strike price K. Deep out-of-the-money (DOTM) corresponds to S/K ∈ [0, 0.80] for calls ( [1.20,∞] for puts), out-of-
the-money (OTM) corresponds to S/K ∈ ]0.80, 0.95] for calls ([1.05, 1.20[ for puts), at-the-money (ATM) corresponds
to S/K ∈ ]0.95, 1.05[ for calls ( ]0.95, 1.05[ for puts), in-the-money (ITM) corresponds to S/K ∈ [1.05, 1.20[ for calls
(]0.80, 0.95] for puts), and deep in-the-money (DITM) corresponds to S/K ∈ [1.20,∞[ for calls ([0, 0.80] for puts).
Source: OptionMetrics.
Target (N = 2,214,260)DITM Mean SD Min Med p75 p90 Max
Panel A: All options, TTE = [0,30]DOTM (3%) 246 1,973 1 20 76 300 94,177OTM (5%) 370 1,990 1 41 164 596 88,086ATM (79%) 273 1,291 1 40 152 531 231,204ITM (5%) 356 6,214 1 20 80 333 539,482DITM (5%) 275 3,264 1 10 40 171 200,000Total (100%) 283 2,135 1 35 138 500 539,482
Panel B: All options, TTE = ]30,60]DOTM (6%) 163 863 1 20 63 229 29,045OTM (9%) 285 1,201 1 32 128 500 55,222ATM (71%) 184 855 1 25 95 328 71,822ITM (6%) 190 3,244 1 20 65 254 475,513DITM (6%) 208 5,288 1 10 37 137 523,053Total (100%) 194 1,787 1 23 90 316 523,053
Panel C: All options, TTE = ]60,...]DOTM (25%) 117 1,035 1 15 45 143 339,751OTM (24%) 130 847 1 15 50 175 101,885ATM (20%) 131 845 1 15 50 180 116,416ITM (14%) 99 923 1 10 35 111 142,647DITM (15%) 83 1,105 1 10 27 89 137,804Total (100%) 115 949 1 13 42 142 339,751
Panel D: Call options, TTE = [0,30]DOTM (2%) 285 1,914 1 20 78 334 78,937OTM (4%) 438 2,266 1 49 194 711 83,637ATM (78%) 302 1,461 1 44 171 592 231,204ITM (7%) 446 7,363 1 22 97 431 539,482DITM (7%) 220 3,161 1 10 40 152 200,000Total (100%) 311 2,564 1 37 150 545 539,482
Panel E: Call options, TTE = ]30,60]DOTM (4%) 168 790 1 20 70 250 25,000OTM (8%) 313 1,292 1 37 144 533 36,955ATM (70%) 202 923 1 27 100 363 55,208ITM (7%) 213 3,828 1 20 73 293 475,513DITM (8%) 213 5,967 1 10 34 116 523,053Total (100%) 212 2,197 1 25 96 342 523,053
Panel F: Call options, TTE = ]60,...]DOTM (23%) 108 1,149 1 15 46 140 339,751OTM (26%) 124 829 1 15 50 169 101,885ATM (20%) 137 931 1 15 50 182 116,416ITM (13%) 108 1,083 1 10 34 111 142,647DITM (16%) 82 1,249 1 10 25 79 137,804Total (100%) 114 1,040 1 12 41 139 339,751
Panel G: Put options, TTE = [0,30]DOTM (4%) 220 2,010 1 20 75 275 94,177OTM (6%) 306 1,689 1 39 141 508 88,086ATM (81%) 234 1,003 1 35 130 455 58,819ITM (4%) 139 976 1 15 50 189 42,708DITM (2%) 485 3,627 1 11 43 250 100,010Total (100%) 242 1,275 1 30 120 431 100,010
Panel H: Put options, TTE = ]30,60]DOTM (9%) 159 915 1 20 60 210 29,045OTM (10%) 253 1,084 1 30 110 449 55,222ATM (71%) 155 739 1 22 80 280 71,822ITM (5%) 136 836 1 15 50 197 41,177DITM (3%) 192 1,264 1 12 50 232 54,004Total (100%) 166 830 1 21 80 284 71,822
Panel I: Put options, TTE = ]60,...]DOTM (29%) 129 855 1 15 45 150 61,123OTM (22%) 141 880 1 15 50 193 83,066ATM (21%) 120 680 1 15 50 175 56,000ITM (14%) 84 580 1 11 38 110 40,906DITM (12%) 87 669 1 10 33 100 70,014Total (100%) 118 769 1 14 44 150 83,066
35
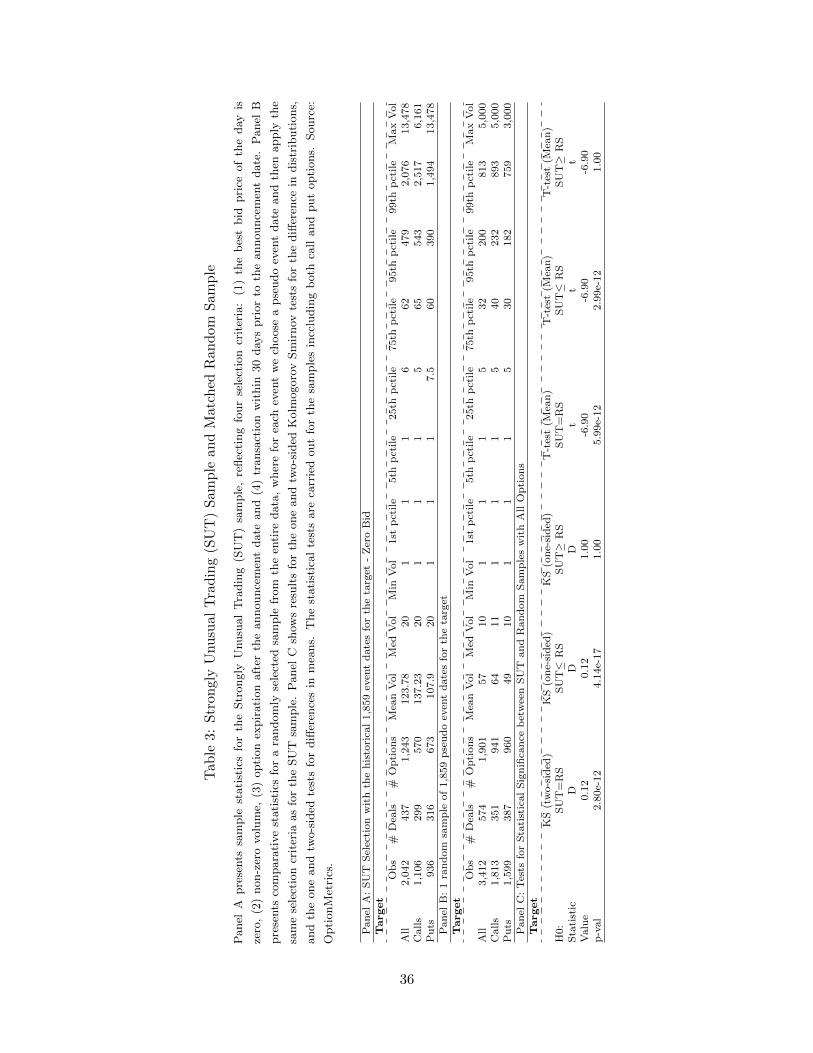
Tab
le3:
Str
on
gly
Unu
sual
Tra
din
g(S
UT
)S
amp
lean
dM
atch
edR
and
omS
amp
le
Panel
Apre
sents
sam
ple
stati
stic
sfo
rth
eStr
ongly
Unusu
al
Tra
din
g(S
UT
)sa
mple
,re
flec
ting
four
sele
ctio
ncr
iter
ia:
(1)
the
bes
tbid
pri
ceof
the
day
is
zero
,(2
)non-z
ero
volu
me,
(3)
opti
on
expir
ati
on
aft
erth
eannounce
men
tdate
and
(4)
transa
ctio
nw
ithin
30
day
spri
or
toth
eannounce
men
tdate
.P
anel
B
pre
sents
com
para
tive
stati
stic
sfo
ra
random
lyse
lect
edsa
mple
from
the
enti
redata
,w
her
efo
rea
chev
ent
we
choose
apse
udo
even
tdate
and
then
apply
the
sam
ese
lect
ion
crit
eria
as
for
the
SU
Tsa
mple
.P
anel
Csh
ows
resu
lts
for
the
one
and
two-s
ided
Kolm
ogoro
vSm
irnov
test
sfo
rth
ediff
eren
cein
dis
trib
uti
ons,
and
the
one
and
two-s
ided
test
sfo
rdiff
eren
ces
inm
eans.
The
stati
stic
al
test
sare
carr
ied
out
for
the
sam
ple
sin
cclu
din
gb
oth
call
and
put
opti
ons.
Sourc
e:
Opti
onM
etri
cs.
Pan
elA
:S
UT
Sel
ecti
on
wit
hth
eh
isto
rica
l1,8
59
even
td
ate
sfo
rth
eta
rget
-Z
ero
Bid
Target
Ob
s#
Dea
ls#
Op
tion
sM
ean
Vol
Med
Vol
Min
Vol
1st
pct
ile
5th
pct
ile
25th
pct
ile
75th
pct
ile
95th
pct
ile
99th
pct
ile
Max
Vol
All
2,0
42
437
1,2
43
123.7
820
11
16
62
479
2,0
76
13,4
78
Calls
1,1
06
299
570
137.2
320
11
15
65
543
2,5
17
6,1
61
Pu
ts936
316
673
107.9
20
11
17.5
60
390
1,4
94
13,4
78
Pan
elB
:1
ran
dom
sam
ple
of
1,8
59
pse
ud
oev
ent
date
sfo
rth
eta
rget
Target
Ob
s#
Dea
ls#
Op
tion
sM
ean
Vol
Med
Vol
Min
Vol
1st
pct
ile
5th
pct
ile
25th
pct
ile
75th
pct
ile
95th
pct
ile
99th
pct
ile
Max
Vol
All
3,4
12
574
1,9
01
57
10
11
15
32
200
813
5,0
00
Calls
1,8
13
351
941
64
11
11
15
40
232
893
5,0
00
Pu
ts1,5
99
387
960
49
10
11
15
30
182
759
3,0
00
Pan
elC
:T
ests
for
Sta
tist
ical
Sig
nifi
can
ceb
etw
een
SU
Tan
dR
an
dom
Sam
ple
sw
ith
All
Op
tion
sT
arget
KS
(tw
o-s
ided
)K
S(o
ne-
sid
ed)
KS
(on
e-si
ded
)T
-tes
t(M
ean
)T
-tes
t(M
ean
)T
-tes
t(M
ean
)H
0:
SU
T=
RS
SU
T≤
RS
SU
T≥
RS
SU
T=
RS
SU
T≤
RS
SU
T≥
RS
Sta
tist
icD
DD
tt
tV
alu
e0.1
20.1
21.0
0-6
.90
-6.9
0-6
.90
p-v
al
2.8
0e-
12
4.1
4e-
17
1.0
05.9
9e-
12
2.9
9e-
12
1.0
0
36
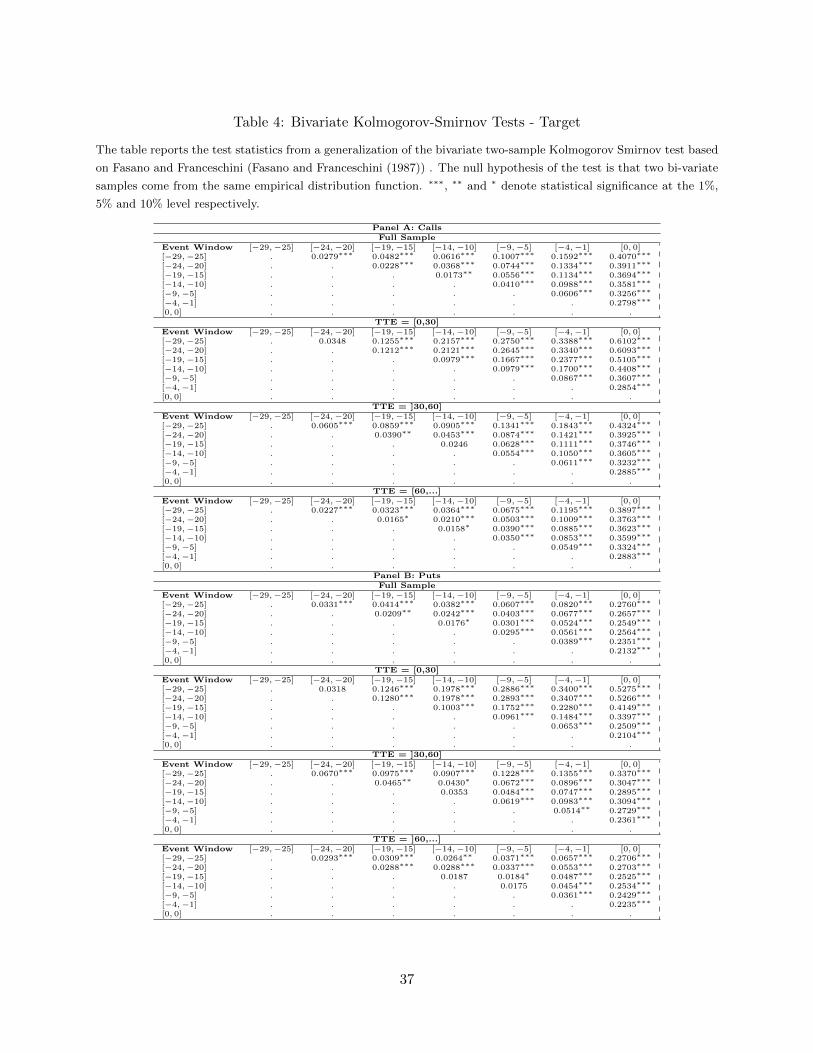
Table 4: Bivariate Kolmogorov-Smirnov Tests - Target
The table reports the test statistics from a generalization of the bivariate two-sample Kolmogorov Smirnov test based
on Fasano and Franceschini (Fasano and Franceschini (1987)) . The null hypothesis of the test is that two bi-variate
samples come from the same empirical distribution function. ∗∗∗, ∗∗ and ∗ denote statistical significance at the 1%,
5% and 10% level respectively.
Panel A: CallsFull Sample
Event Window [−29,−25] [−24,−20] [−19,−15] [−14,−10] [−9,−5] [−4,−1] [0, 0][−29,−25] . 0.0279∗∗∗ 0.0482∗∗∗ 0.0616∗∗∗ 0.1007∗∗∗ 0.1592∗∗∗ 0.4070∗∗∗
[−24,−20] . . 0.0228∗∗∗ 0.0368∗∗∗ 0.0744∗∗∗ 0.1334∗∗∗ 0.3911∗∗∗
[−19,−15] . . . 0.0173∗∗ 0.0556∗∗∗ 0.1134∗∗∗ 0.3694∗∗∗
[−14,−10] . . . . 0.0410∗∗∗ 0.0988∗∗∗ 0.3581∗∗∗
[−9,−5] . . . . . 0.0606∗∗∗ 0.3256∗∗∗
[−4,−1] . . . . . . 0.2798∗∗∗
[0, 0] . . . . . . .TTE = [0,30]
Event Window [−29,−25] [−24,−20] [−19,−15] [−14,−10] [−9,−5] [−4,−1] [0, 0][−29,−25] . 0.0348 0.1255∗∗∗ 0.2157∗∗∗ 0.2750∗∗∗ 0.3388∗∗∗ 0.6102∗∗∗
[−24,−20] . . 0.1212∗∗∗ 0.2121∗∗∗ 0.2645∗∗∗ 0.3340∗∗∗ 0.6093∗∗∗
[−19,−15] . . . 0.0979∗∗∗ 0.1667∗∗∗ 0.2377∗∗∗ 0.5105∗∗∗
[−14,−10] . . . . 0.0979∗∗∗ 0.1700∗∗∗ 0.4408∗∗∗
[−9,−5] . . . . . 0.0867∗∗∗ 0.3607∗∗∗
[−4,−1] . . . . . . 0.2854∗∗∗
[0, 0] . . . . . . .TTE = ]30,60]
Event Window [−29,−25] [−24,−20] [−19,−15] [−14,−10] [−9,−5] [−4,−1] [0, 0][−29,−25] . 0.0605∗∗∗ 0.0859∗∗∗ 0.0905∗∗∗ 0.1341∗∗∗ 0.1843∗∗∗ 0.4324∗∗∗
[−24,−20] . . 0.0390∗∗ 0.0453∗∗∗ 0.0874∗∗∗ 0.1421∗∗∗ 0.3925∗∗∗
[−19,−15] . . . 0.0246 0.0628∗∗∗ 0.1111∗∗∗ 0.3746∗∗∗
[−14,−10] . . . . 0.0554∗∗∗ 0.1050∗∗∗ 0.3605∗∗∗
[−9,−5] . . . . . 0.0611∗∗∗ 0.3232∗∗∗
[−4,−1] . . . . . . 0.2885∗∗∗
[0, 0] . . . . . . .TTE = [60,...]
Event Window [−29,−25] [−24,−20] [−19,−15] [−14,−10] [−9,−5] [−4,−1] [0, 0][−29,−25] . 0.0227∗∗∗ 0.0323∗∗∗ 0.0364∗∗∗ 0.0675∗∗∗ 0.1195∗∗∗ 0.3897∗∗∗
[−24,−20] . . 0.0165∗ 0.0210∗∗∗ 0.0503∗∗∗ 0.1009∗∗∗ 0.3763∗∗∗
[−19,−15] . . . 0.0158∗ 0.0390∗∗∗ 0.0885∗∗∗ 0.3623∗∗∗
[−14,−10] . . . . 0.0350∗∗∗ 0.0853∗∗∗ 0.3599∗∗∗
[−9,−5] . . . . . 0.0549∗∗∗ 0.3324∗∗∗
[−4,−1] . . . . . . 0.2883∗∗∗
[0, 0] . . . . . . .Panel B: PutsFull Sample
Event Window [−29,−25] [−24,−20] [−19,−15] [−14,−10] [−9,−5] [−4,−1] [0, 0][−29,−25] . 0.0331∗∗∗ 0.0414∗∗∗ 0.0382∗∗∗ 0.0607∗∗∗ 0.0820∗∗∗ 0.2760∗∗∗
[−24,−20] . . 0.0209∗∗ 0.0242∗∗∗ 0.0403∗∗∗ 0.0677∗∗∗ 0.2657∗∗∗
[−19,−15] . . . 0.0176∗ 0.0301∗∗∗ 0.0524∗∗∗ 0.2549∗∗∗
[−14,−10] . . . . 0.0295∗∗∗ 0.0561∗∗∗ 0.2564∗∗∗
[−9,−5] . . . . . 0.0389∗∗∗ 0.2351∗∗∗
[−4,−1] . . . . . . 0.2132∗∗∗
[0, 0] . . . . . . .TTE = [0,30]
Event Window [−29,−25] [−24,−20] [−19,−15] [−14,−10] [−9,−5] [−4,−1] [0, 0][−29,−25] . 0.0318 0.1246∗∗∗ 0.1978∗∗∗ 0.2886∗∗∗ 0.3400∗∗∗ 0.5275∗∗∗
[−24,−20] . . 0.1280∗∗∗ 0.1978∗∗∗ 0.2893∗∗∗ 0.3407∗∗∗ 0.5266∗∗∗
[−19,−15] . . . 0.1003∗∗∗ 0.1752∗∗∗ 0.2280∗∗∗ 0.4149∗∗∗
[−14,−10] . . . . 0.0961∗∗∗ 0.1484∗∗∗ 0.3397∗∗∗
[−9,−5] . . . . . 0.0653∗∗∗ 0.2509∗∗∗
[−4,−1] . . . . . . 0.2104∗∗∗
[0, 0] . . . . . . .TTE = ]30,60]
Event Window [−29,−25] [−24,−20] [−19,−15] [−14,−10] [−9,−5] [−4,−1] [0, 0][−29,−25] . 0.0670∗∗∗ 0.0975∗∗∗ 0.0907∗∗∗ 0.1228∗∗∗ 0.1355∗∗∗ 0.3370∗∗∗
[−24,−20] . . 0.0465∗∗ 0.0430∗ 0.0672∗∗∗ 0.0896∗∗∗ 0.3047∗∗∗
[−19,−15] . . . 0.0353 0.0484∗∗∗ 0.0747∗∗∗ 0.2895∗∗∗
[−14,−10] . . . . 0.0619∗∗∗ 0.0983∗∗∗ 0.3094∗∗∗
[−9,−5] . . . . . 0.0514∗∗ 0.2729∗∗∗
[−4,−1] . . . . . . 0.2361∗∗∗
[0, 0] . . . . . . .TTE = ]60,...]
Event Window [−29,−25] [−24,−20] [−19,−15] [−14,−10] [−9,−5] [−4,−1] [0, 0][−29,−25] . 0.0293∗∗∗ 0.0309∗∗∗ 0.0264∗∗ 0.0371∗∗∗ 0.0657∗∗∗ 0.2706∗∗∗
[−24,−20] . . 0.0288∗∗∗ 0.0288∗∗∗ 0.0337∗∗∗ 0.0553∗∗∗ 0.2703∗∗∗
[−19,−15] . . . 0.0187 0.0184∗ 0.0487∗∗∗ 0.2525∗∗∗
[−14,−10] . . . . 0.0175 0.0454∗∗∗ 0.2534∗∗∗
[−9,−5] . . . . . 0.0361∗∗∗ 0.2429∗∗∗
[−4,−1] . . . . . . 0.2235∗∗∗
[0, 0] . . . . . . .
37
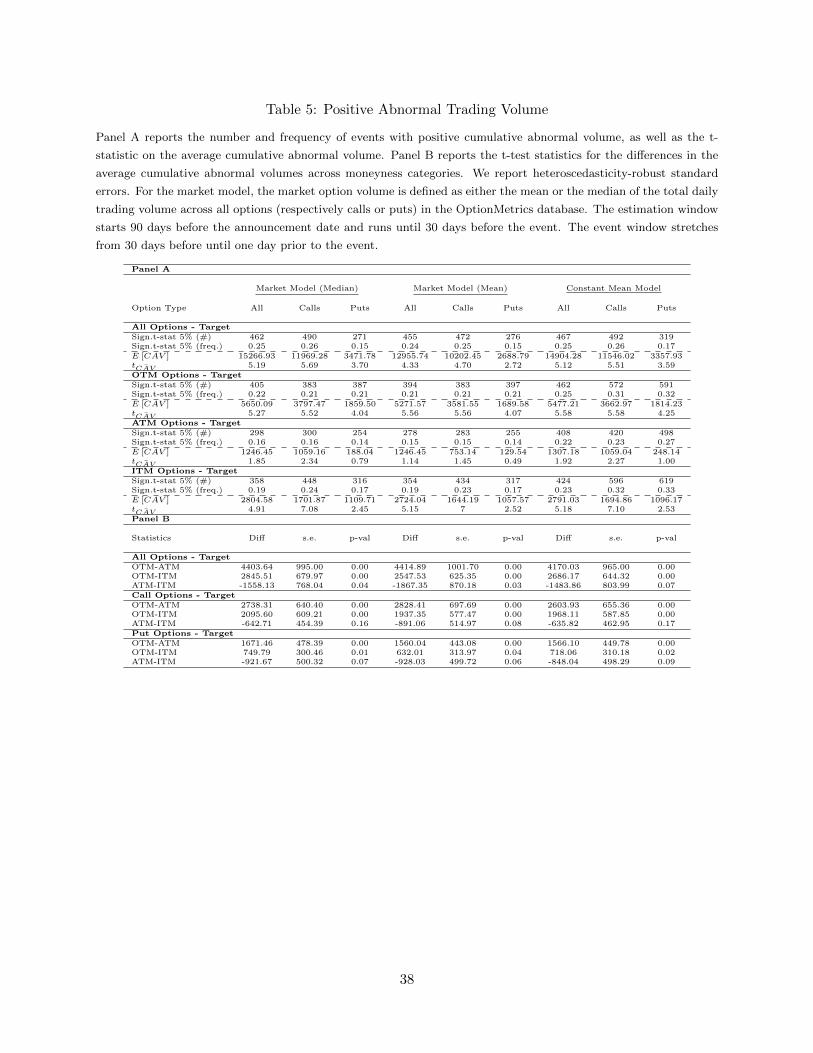
Table 5: Positive Abnormal Trading Volume
Panel A reports the number and frequency of events with positive cumulative abnormal volume, as well as the t-
statistic on the average cumulative abnormal volume. Panel B reports the t-test statistics for the differences in the
average cumulative abnormal volumes across moneyness categories. We report heteroscedasticity-robust standard
errors. For the market model, the market option volume is defined as either the mean or the median of the total daily
trading volume across all options (respectively calls or puts) in the OptionMetrics database. The estimation window
starts 90 days before the announcement date and runs until 30 days before the event. The event window stretches
from 30 days before until one day prior to the event.
Panel A
Market Model (Median) Market Model (Mean) Constant Mean Model
Option Type All Calls Puts All Calls Puts All Calls Puts
All Options - TargetSign.t-stat 5% (#) 462 490 271 455 472 276 467 492 319Sign.t-stat 5% (freq.) 0.25 0.26 0.15 0.24 0.25 0.15 0.25 0.26 0.17E [CAV ] 15266.93 11969.28 3471.78 12955.74 10202.45 2688.79 14904.28 11546.02 3357.93t ¯CAV 5.19 5.69 3.70 4.33 4.70 2.72 5.12 5.51 3.59OTM Options - TargetSign.t-stat 5% (#) 405 383 387 394 383 397 462 572 591Sign.t-stat 5% (freq.) 0.22 0.21 0.21 0.21 0.21 0.21 0.25 0.31 0.32E [CAV ] 5650.09 3797.47 1859.50 5271.57 3581.55 1689.58 5477.21 3662.97 1814.23t ¯CAV 5.27 5.52 4.04 5.56 5.56 4.07 5.58 5.58 4.25ATM Options - TargetSign.t-stat 5% (#) 298 300 254 278 283 255 408 420 498Sign.t-stat 5% (freq.) 0.16 0.16 0.14 0.15 0.15 0.14 0.22 0.23 0.27E [CAV ] 1246.45 1059.16 188.04 1246.45 753.14 129.54 1307.18 1059.04 248.14t ¯CAV 1.85 2.34 0.79 1.14 1.45 0.49 1.92 2.27 1.00ITM Options - TargetSign.t-stat 5% (#) 358 448 316 354 434 317 424 596 619Sign.t-stat 5% (freq.) 0.19 0.24 0.17 0.19 0.23 0.17 0.23 0.32 0.33E [CAV ] 2804.58 1701.87 1109.71 2724.04 1644.19 1057.57 2791.03 1694.86 1096.17t ¯CAV 4.91 7.08 2.45 5.15 7 2.52 5.18 7.10 2.53Panel B
Statistics Diff s.e. p-val Diff s.e. p-val Diff s.e. p-val
All Options - TargetOTM-ATM 4403.64 995.00 0.00 4414.89 1001.70 0.00 4170.03 965.00 0.00OTM-ITM 2845.51 679.97 0.00 2547.53 625.35 0.00 2686.17 644.32 0.00ATM-ITM -1558.13 768.04 0.04 -1867.35 870.18 0.03 -1483.86 803.99 0.07Call Options - TargetOTM-ATM 2738.31 640.40 0.00 2828.41 697.69 0.00 2603.93 655.36 0.00OTM-ITM 2095.60 609.21 0.00 1937.35 577.47 0.00 1968.11 587.85 0.00ATM-ITM -642.71 454.39 0.16 -891.06 514.97 0.08 -635.82 462.95 0.17Put Options - TargetOTM-ATM 1671.46 478.39 0.00 1560.04 443.08 0.00 1566.10 449.78 0.00OTM-ITM 749.79 300.46 0.01 632.01 313.97 0.04 718.06 310.18 0.02ATM-ITM -921.67 500.32 0.07 -928.03 499.72 0.06 -848.04 498.29 0.09
38
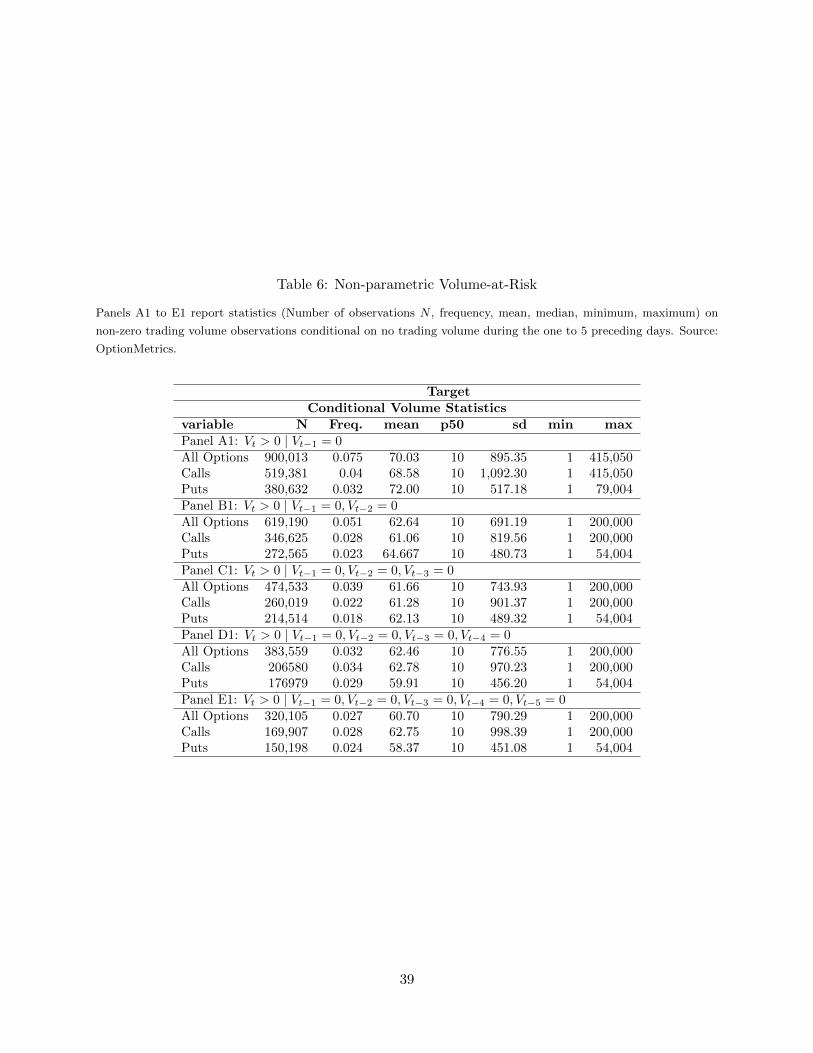
Table 6: Non-parametric Volume-at-Risk
Panels A1 to E1 report statistics (Number of observations N , frequency, mean, median, minimum, maximum) on
non-zero trading volume observations conditional on no trading volume during the one to 5 preceding days. Source:
OptionMetrics.
TargetConditional Volume Statistics
variable N Freq. mean p50 sd min maxPanel A1: Vt > 0 | Vt−1 = 0All Options 900,013 0.075 70.03 10 895.35 1 415,050Calls 519,381 0.04 68.58 10 1,092.30 1 415,050Puts 380,632 0.032 72.00 10 517.18 1 79,004Panel B1: Vt > 0 | Vt−1 = 0, Vt−2 = 0All Options 619,190 0.051 62.64 10 691.19 1 200,000Calls 346,625 0.028 61.06 10 819.56 1 200,000Puts 272,565 0.023 64.667 10 480.73 1 54,004Panel C1: Vt > 0 | Vt−1 = 0, Vt−2 = 0, Vt−3 = 0All Options 474,533 0.039 61.66 10 743.93 1 200,000Calls 260,019 0.022 61.28 10 901.37 1 200,000Puts 214,514 0.018 62.13 10 489.32 1 54,004Panel D1: Vt > 0 | Vt−1 = 0, Vt−2 = 0, Vt−3 = 0, Vt−4 = 0All Options 383,559 0.032 62.46 10 776.55 1 200,000Calls 206580 0.034 62.78 10 970.23 1 200,000Puts 176979 0.029 59.91 10 456.20 1 54,004Panel E1: Vt > 0 | Vt−1 = 0, Vt−2 = 0, Vt−3 = 0, Vt−4 = 0, Vt−5 = 0All Options 320,105 0.027 60.70 10 790.29 1 200,000Calls 169,907 0.028 62.75 10 998.39 1 200,000Puts 150,198 0.024 58.37 10 451.08 1 54,004
39
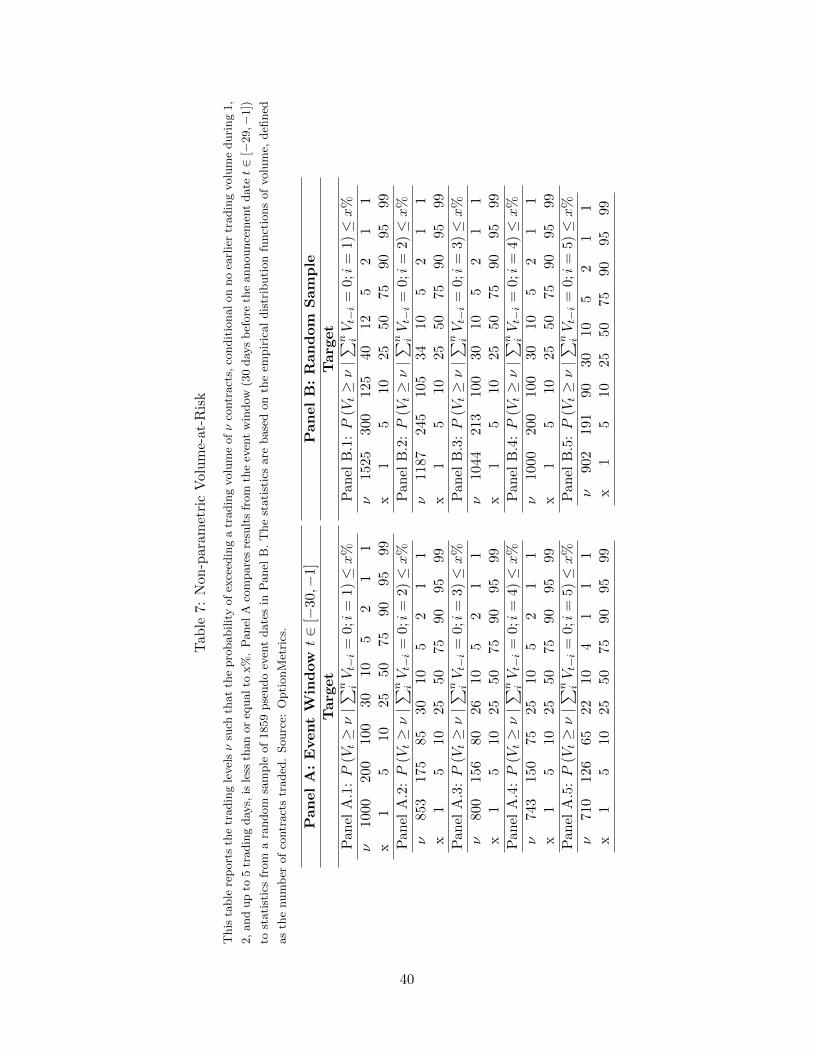
Tab
le7:
Non
-par
amet
ric
Vol
um
e-at
-Ris
k
This
table
rep
ort
sth
etr
adin
gle
vel
sν
such
that
the
pro
babilit
yof
exce
edin
ga
tradin
gvolu
me
ofν
contr
act
s,co
ndit
ionalon
no
earl
ier
tradin
gvolu
me
duri
ng
1,
2,
and
up
to5
tradin
gday
s,is
less
than
or
equalto
x%
.P
anel
Aco
mpare
sre
sult
sfr
om
the
even
tw
indow
(30
day
sb
efore
the
announce
men
tdatet∈
[−29,−
1])
tost
ati
stic
sfr
om
ara
ndom
sam
ple
of
1859
pse
udo
even
tdate
sin
Panel
B.
The
stati
stic
sare
base
don
the
empir
ical
dis
trib
uti
on
funct
ions
of
volu
me,
defi
ned
as
the
num
ber
of
contr
act
str
aded
.Sourc
e:O
pti
onM
etri
cs.
Pan
el
A:
Event
Win
dowt∈
[−30,−
1]
Targ
et
Pan
elA
.1:P
(Vt≥ν|∑ n i
Vt−i
=0;i
=1)≤x
%
ν10
0020
0100
3010
52
11
x1
510
2550
7590
9599
Pan
elA
.2:P
(Vt≥ν|∑ n i
Vt−i
=0;i
=2)≤x
%
ν85
3175
8530
105
21
1x
15
1025
50
7590
9599
Pan
elA
.3:P
(Vt≥ν|∑ n i
Vt−i
=0;i
=3)≤x
%
ν80
0156
8026
105
21
1x
15
1025
50
7590
9599
Pan
elA
.4:P
(Vt≥ν|∑ n i
Vt−i
=0;i
=4)≤x
%
ν74
3150
7525
105
21
1x
15
1025
50
7590
9599
Pan
elA
.5:P
(Vt≥ν|∑ n i
Vt−i
=0;i
=5)≤x
%
ν71
0126
6522
104
11
1x
15
1025
50
7590
9599
Pan
el
B:
Ran
dom
Sam
ple
Targ
et
Pan
elB
.1:P
(Vt≥ν|∑ n i
Vt−i
=0;i
=1)≤x
%
ν15
2530
012
540
125
21
1x
15
1025
5075
9095
99
Pan
elB
.2:P
(Vt≥ν|∑ n i
Vt−i
=0;i
=2)≤x
%
ν11
8724
510
534
105
21
1x
15
1025
5075
9095
99
Pan
elB
.3:P
(Vt≥ν|∑ n i
Vt−i
=0;i
=3)≤x
%
ν10
4421
310
030
105
21
1x
15
1025
5075
9095
99
Pan
elB
.4:P
(Vt≥ν|∑ n i
Vt−i
=0;i
=4)≤x
%
ν10
0020
010
030
105
21
1x
15
1025
5075
9095
99
Pan
elB
.5:P
(Vt≥ν|∑ n i
Vt−i
=0;i
=5)≤x
%
ν90
219
190
3010
52
11
x1
510
2550
7590
9599
40
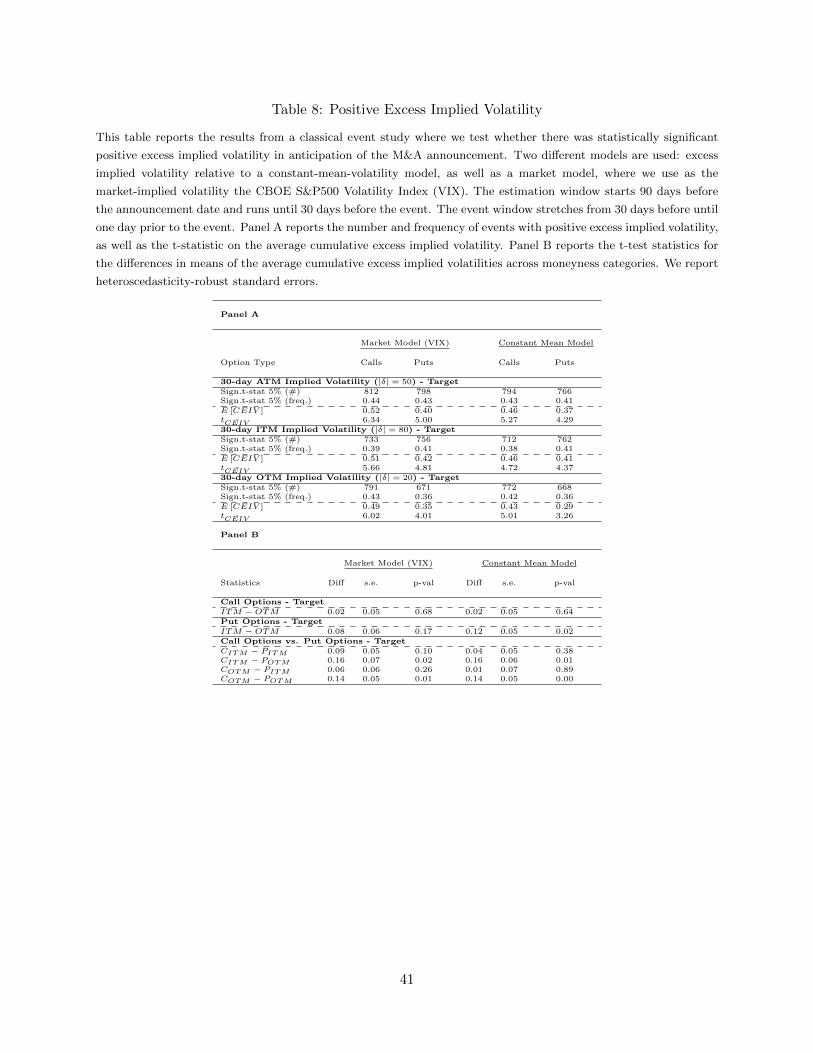
Table 8: Positive Excess Implied Volatility
This table reports the results from a classical event study where we test whether there was statistically significant
positive excess implied volatility in anticipation of the M&A announcement. Two different models are used: excess
implied volatility relative to a constant-mean-volatility model, as well as a market model, where we use as the
market-implied volatility the CBOE S&P500 Volatility Index (VIX). The estimation window starts 90 days before
the announcement date and runs until 30 days before the event. The event window stretches from 30 days before until
one day prior to the event. Panel A reports the number and frequency of events with positive excess implied volatility,
as well as the t-statistic on the average cumulative excess implied volatility. Panel B reports the t-test statistics for
the differences in means of the average cumulative excess implied volatilities across moneyness categories. We report
heteroscedasticity-robust standard errors.
Panel A
Market Model (VIX) Constant Mean Model
Option Type Calls Puts Calls Puts
30-day ATM Implied Volatility (|δ| = 50) - TargetSign.t-stat 5% (#) 812 798 794 766Sign.t-stat 5% (freq.) 0.44 0.43 0.43 0.41E [CEIV ] 0.52 0.40 0.46 0.37t ¯CEIV 6.34 5.00 5.27 4.2930-day ITM Implied Volatility (|δ| = 80) - TargetSign.t-stat 5% (#) 733 756 712 762Sign.t-stat 5% (freq.) 0.39 0.41 0.38 0.41E [CEIV ] 0.51 0.42 0.46 0.41t ¯CEIV 5.66 4.81 4.72 4.3730-day OTM Implied Volatility (|δ| = 20) - TargetSign.t-stat 5% (#) 791 671 772 668Sign.t-stat 5% (freq.) 0.43 0.36 0.42 0.36E [CEIV ] 0.49 0.35 0.43 0.29t ¯CEIV 6.02 4.01 5.01 3.26
Panel B
Market Model (VIX) Constant Mean Model
Statistics Diff s.e. p-val Diff s.e. p-val
Call Options - TargetITM − OTM 0.02 0.05 0.68 0.02 0.05 0.64Put Options - TargetITM − OTM 0.08 0.06 0.17 0.12 0.05 0.02Call Options vs. Put Options - TargetCITM − PITM 0.09 0.05 0.10 0.04 0.05 0.38CITM − POTM 0.16 0.07 0.02 0.16 0.06 0.01COTM − PITM 0.06 0.06 0.26 0.01 0.07 0.89COTM − POTM 0.14 0.05 0.01 0.14 0.05 0.00
41
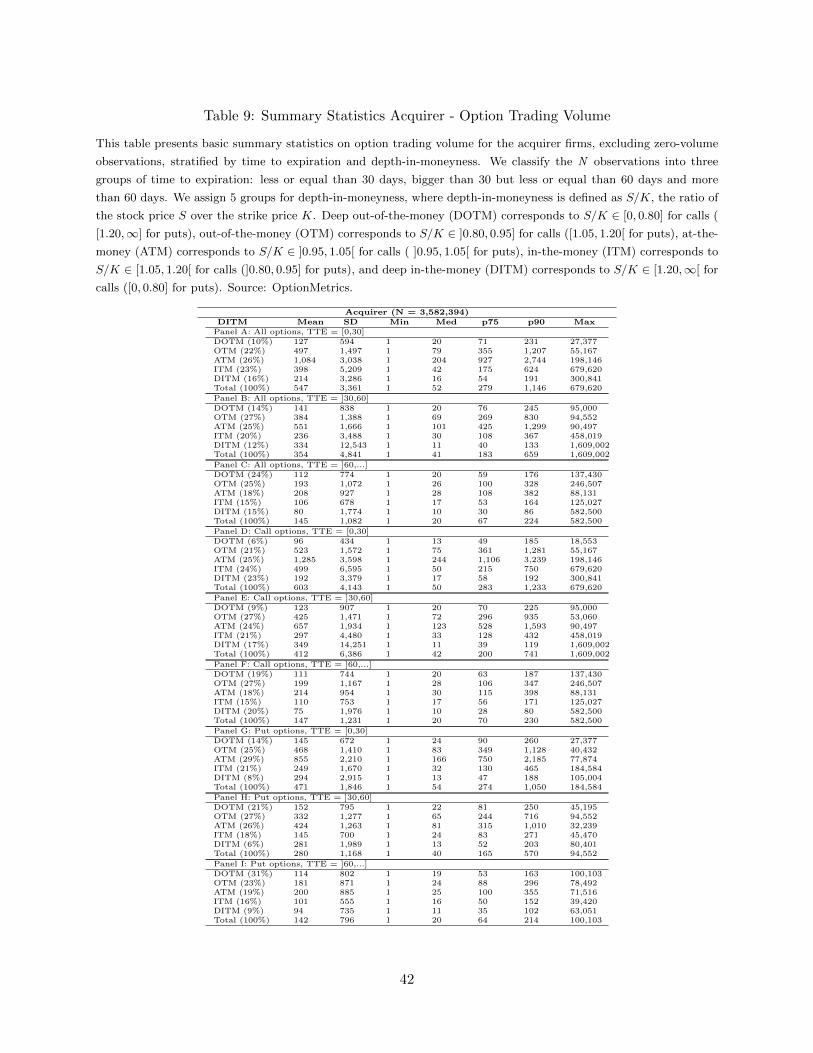
Table 9: Summary Statistics Acquirer - Option Trading Volume
This table presents basic summary statistics on option trading volume for the acquirer firms, excluding zero-volume
observations, stratified by time to expiration and depth-in-moneyness. We classify the N observations into three
groups of time to expiration: less or equal than 30 days, bigger than 30 but less or equal than 60 days and more
than 60 days. We assign 5 groups for depth-in-moneyness, where depth-in-moneyness is defined as S/K, the ratio of
the stock price S over the strike price K. Deep out-of-the-money (DOTM) corresponds to S/K ∈ [0, 0.80] for calls (
[1.20,∞] for puts), out-of-the-money (OTM) corresponds to S/K ∈ ]0.80, 0.95] for calls ([1.05, 1.20[ for puts), at-the-
money (ATM) corresponds to S/K ∈ ]0.95, 1.05[ for calls ( ]0.95, 1.05[ for puts), in-the-money (ITM) corresponds to
S/K ∈ [1.05, 1.20[ for calls (]0.80, 0.95] for puts), and deep in-the-money (DITM) corresponds to S/K ∈ [1.20,∞[ for
calls ([0, 0.80] for puts). Source: OptionMetrics.
Acquirer (N = 3,582,394)DITM Mean SD Min Med p75 p90 Max
Panel A: All options, TTE = [0,30]DOTM (10%) 127 594 1 20 71 231 27,377OTM (22%) 497 1,497 1 79 355 1,207 55,167ATM (26%) 1,084 3,038 1 204 927 2,744 198,146ITM (23%) 398 5,209 1 42 175 624 679,620DITM (16%) 214 3,286 1 16 54 191 300,841Total (100%) 547 3,361 1 52 279 1,146 679,620
Panel B: All options, TTE = ]30,60]DOTM (14%) 141 838 1 20 76 245 95,000OTM (27%) 384 1,388 1 69 269 830 94,552ATM (25%) 551 1,666 1 101 425 1,299 90,497ITM (20%) 236 3,488 1 30 108 367 458,019DITM (12%) 334 12,543 1 11 40 133 1,609,002Total (100%) 354 4,841 1 41 183 659 1,609,002
Panel C: All options, TTE = ]60,...]DOTM (24%) 112 774 1 20 59 176 137,430OTM (25%) 193 1,072 1 26 100 328 246,507ATM (18%) 208 927 1 28 108 382 88,131ITM (15%) 106 678 1 17 53 164 125,027DITM (15%) 80 1,774 1 10 30 86 582,500Total (100%) 145 1,082 1 20 67 224 582,500
Panel D: Call options, TTE = [0,30]DOTM (6%) 96 434 1 13 49 185 18,553OTM (21%) 523 1,572 1 75 361 1,281 55,167ATM (25%) 1,285 3,598 1 244 1,106 3,239 198,146ITM (24%) 499 6,595 1 50 215 750 679,620DITM (23%) 192 3,379 1 17 58 192 300,841Total (100%) 603 4,143 1 50 283 1,233 679,620
Panel E: Call options, TTE = ]30,60]DOTM (9%) 123 907 1 20 70 225 95,000OTM (27%) 425 1,471 1 72 296 935 53,060ATM (24%) 657 1,934 1 123 528 1,593 90,497ITM (21%) 297 4,480 1 33 128 432 458,019DITM (17%) 349 14,251 1 11 39 119 1,609,002Total (100%) 412 6,386 1 42 200 741 1,609,002
Panel F: Call options, TTE = ]60,...]DOTM (19%) 111 744 1 20 63 187 137,430OTM (27%) 199 1,167 1 28 106 347 246,507ATM (18%) 214 954 1 30 115 398 88,131ITM (15%) 110 753 1 17 56 171 125,027DITM (20%) 75 1,976 1 10 28 80 582,500Total (100%) 147 1,231 1 20 70 230 582,500
Panel G: Put options, TTE = [0,30]DOTM (14%) 145 672 1 24 90 260 27,377OTM (25%) 468 1,410 1 83 349 1,128 40,432ATM (29%) 855 2,210 1 166 750 2,185 77,874ITM (21%) 249 1,670 1 32 130 465 184,584DITM (8%) 294 2,915 1 13 47 188 105,004Total (100%) 471 1,846 1 54 274 1,050 184,584
Panel H: Put options, TTE = ]30,60]DOTM (21%) 152 795 1 22 81 250 45,195OTM (27%) 332 1,277 1 65 244 716 94,552ATM (26%) 424 1,263 1 81 315 1,010 32,239ITM (18%) 145 700 1 24 83 271 45,470DITM (6%) 281 1,989 1 13 52 203 80,401Total (100%) 280 1,168 1 40 165 570 94,552
Panel I: Put options, TTE = ]60,...]DOTM (31%) 114 802 1 19 53 163 100,103OTM (23%) 181 871 1 24 88 296 78,492ATM (19%) 200 885 1 25 100 355 71,516ITM (16%) 101 555 1 16 50 152 39,420DITM (9%) 94 735 1 11 35 102 63,051Total (100%) 142 796 1 20 64 214 100,103
42
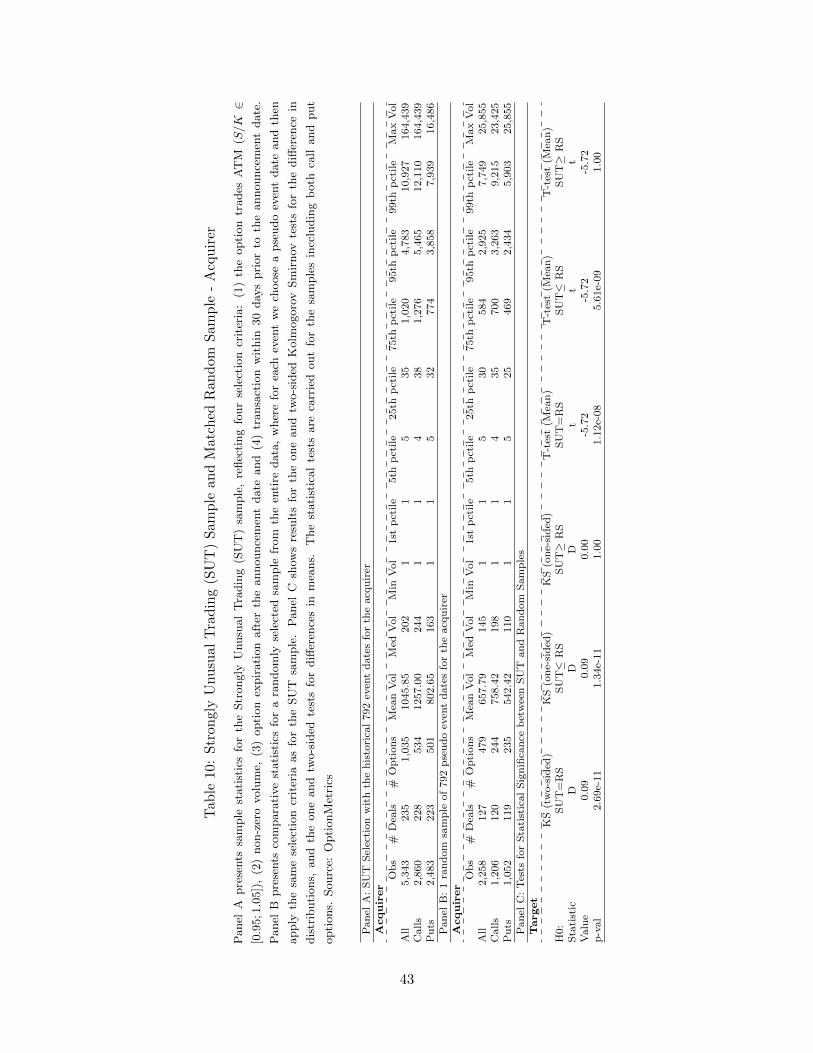
Tab
le10
:S
tron
gly
Unu
sual
Tra
din
g(S
UT
)S
amp
lean
dM
atch
edR
and
omS
amp
le-
Acq
uir
er
Panel
Apre
sents
sam
ple
stati
stic
sfo
rth
eStr
ongly
Unusu
al
Tra
din
g(S
UT
)sa
mple
,re
flec
ting
four
sele
ctio
ncr
iter
ia:
(1)
the
opti
on
trades
AT
M(S/K∈
[0.9
5;1.0
5])
,(2
)non-z
ero
volu
me,
(3)
opti
on
expir
ati
on
aft
erth
eannounce
men
tdate
and
(4)
transa
ctio
nw
ithin
30
day
spri
or
toth
eannounce
men
tdate
.
Panel
Bpre
sents
com
para
tive
stati
stic
sfo
ra
random
lyse
lect
edsa
mple
from
the
enti
redata
,w
her
efo
rea
chev
ent
we
choose
apse
udo
even
tdate
and
then
apply
the
sam
ese
lect
ion
crit
eria
as
for
the
SU
Tsa
mple
.P
anel
Csh
ows
resu
lts
for
the
one
and
two-s
ided
Kolm
ogoro
vSm
irnov
test
sfo
rth
ediff
eren
cein
dis
trib
uti
ons,
and
the
one
and
two-s
ided
test
sfo
rdiff
eren
ces
inm
eans.
The
stati
stic
al
test
sare
carr
ied
out
for
the
sam
ple
sin
cclu
din
gb
oth
call
and
put
opti
ons.
Sourc
e:O
pti
onM
etri
cs
Pan
elA
:S
UT
Sel
ecti
on
wit
hth
eh
isto
rica
l792
even
td
ate
sfo
rth
eacq
uir
erA
cqu
irer
Ob
s#
Dea
ls#
Op
tion
sM
ean
Vol
Med
Vol
Min
Vol
1st
pct
ile
5th
pct
ile
25th
pct
ile
75th
pct
ile
95th
pct
ile
99th
pct
ile
Max
Vol
All
5,3
43
235
1,0
35
1045.8
5202
11
535
1,0
20
4,7
83
10,9
27
164,4
39
Calls
2,8
60
228
534
1257.0
0244
11
438
1,2
76
5,4
65
12,1
10
164,4
39
Pu
ts2,4
83
223
501
802.6
5163
11
532
774
3,8
58
7,9
39
16,4
86
Pan
elB
:1
ran
dom
sam
ple
of
792
pse
ud
oev
ent
date
sfo
rth
eacq
uir
erA
cqu
irer
Ob
s#
Dea
ls#
Op
tion
sM
ean
Vol
Med
Vol
Min
Vol
1st
pct
ile
5th
pct
ile
25th
pct
ile
75th
pct
ile
95th
pct
ile
99th
pct
ile
Max
Vol
All
2,2
58
127
479
657.7
9145
11
530
584
2,9
25
7,7
49
25,8
55
Calls
1,2
06
120
244
758.4
2198
11
435
700
3,2
63
9,2
15
23,4
25
Pu
ts1,0
52
119
235
542.4
2110
11
525
469
2,4
34
5,9
03
25,8
55
Pan
elC
:T
ests
for
Sta
tist
ical
Sig
nifi
can
ceb
etw
een
SU
Tan
dR
an
dom
Sam
ple
sT
arget
KS
(tw
o-s
ided
)K
S(o
ne-
sid
ed)
KS
(on
e-si
ded
)T
-tes
t(M
ean
)T
-tes
t(M
ean
)T
-tes
t(M
ean
)H
0:
SU
T=
RS
SU
T≤
RS
SU
T≥
RS
SU
T=
RS
SU
T≤
RS
SU
T≥
RS
Sta
tist
icD
DD
tt
tV
alu
e0.0
90.0
90.0
0-5
.72
-5.7
2-5
.72
p-v
al
2.6
9e-
11
1.3
4e-
11
1.0
01.1
2e-
08
5.6
1e-
09
1.0
0
43
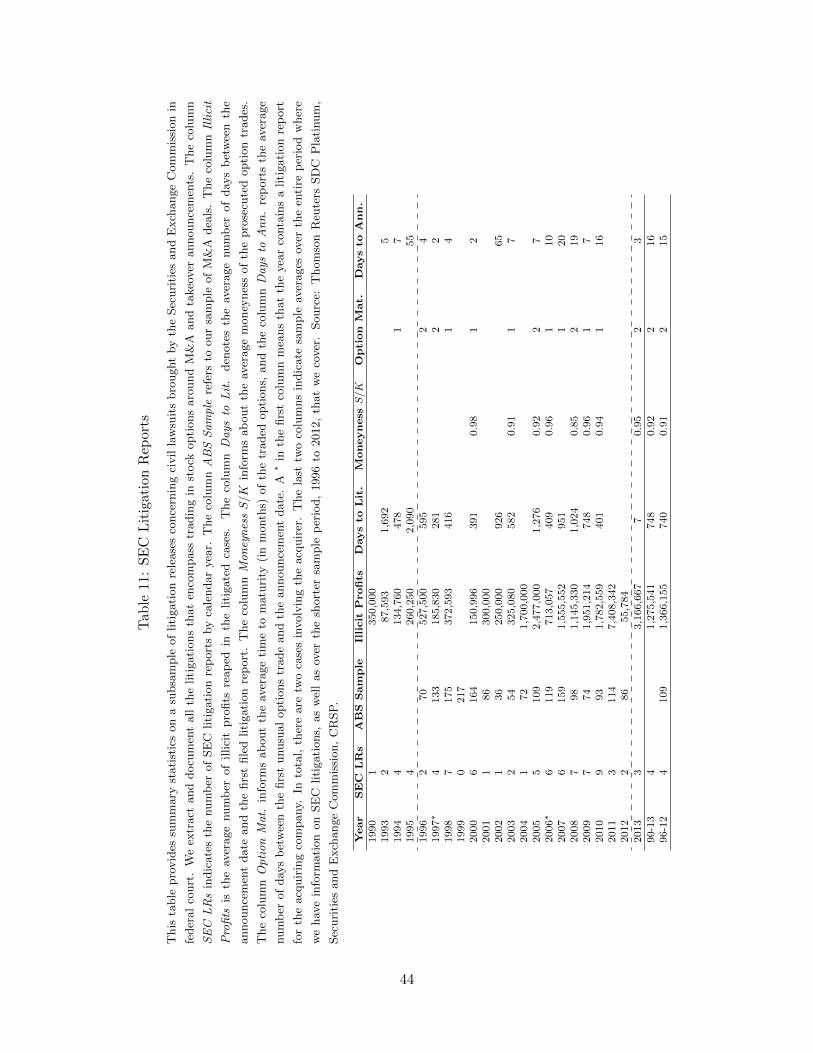
Tab
le11
:S
EC
Lit
igat
ion
Rep
orts
This
table
pro
vid
essu
mm
ary
stati
stic
son
asu
bsa
mple
of
liti
gati
on
rele
ase
sco
nce
rnin
gci
vil
law
suit
sbro
ught
by
the
Sec
uri
ties
and
Exch
ange
Com
mis
sion
in
feder
al
court
.W
eex
tract
and
docu
men
tall
the
liti
gati
ons
that
enco
mpass
tradin
gin
stock
opti
ons
aro
und
M&
Aand
takeo
ver
announce
men
ts.
The
colu
mn
SE
CL
Rs
indic
ate
sth
enum
ber
of
SE
Cliti
gati
on
rep
ort
sby
cale
ndar
yea
r.T
he
colu
mn
AB
SS
am
ple
refe
rsto
our
sam
ple
of
M&
Adea
ls.
The
colu
mn
Illi
cit
Pro
fits
isth
eav
erage
num
ber
of
illici
tpro
fits
reap
edin
the
liti
gate
dca
ses.
The
colu
mn
Da
ysto
Lit
.den
ote
sth
eav
erage
num
ber
of
day
sb
etw
een
the
announce
men
tdate
and
the
firs
tfile
dliti
gati
on
rep
ort
.T
he
colu
mn
Mo
ney
nes
sS/K
info
rms
ab
out
the
aver
age
money
nes
sof
the
pro
secu
ted
opti
on
trades
.
The
colu
mn
Op
tio
nM
at.
info
rms
ab
out
the
aver
age
tim
eto
matu
rity
(in
month
s)of
the
traded
opti
ons,
and
the
colu
mn
Da
ysto
An
n.
rep
ort
sth
eav
erage
num
ber
of
day
sb
etw
een
the
firs
tunusu
al
opti
ons
trade
and
the
announce
men
tdate
.A∗
inth
efirs
tco
lum
nm
eans
that
the
yea
rco
nta
ins
aliti
gati
on
rep
ort
for
the
acq
uir
ing
com
pany.
Into
tal,
ther
eare
two
case
sin
volv
ing
the
acq
uir
er.
The
last
two
colu
mns
indic
ate
sam
ple
aver
ages
over
the
enti
rep
erio
dw
her
e
we
hav
ein
form
ati
on
on
SE
Cliti
gati
ons,
as
wel
las
over
the
short
ersa
mple
per
iod,
1996
to2012,
that
we
cover
.Sourc
e:T
hom
son
Reu
ters
SD
CP
lati
num
,
Sec
uri
ties
and
Exch
ange
Com
mis
sion,
CR
SP
.
Year
SE
CL
Rs
AB
SS
am
ple
Illi
cit
Profi
tsD
ays
toL
it.
Mon
eyn
essS/K
Op
tion
Mat.
Days
toA
nn
.1990
1350,0
00
1993
287,5
93
1,6
92
51994
4134,7
60
478
17
1995
4260,2
50
2,0
90
55
1996
270
527,5
00
595
24
1997∗
4133
185,8
30
281
22
1998
7175
372,5
93
416
14
1999
0217
2000
6164
150,9
96
391
0.9
81
22001
186
300,0
00
2002
136
250,0
00
926
65
2003
254
325,0
80
582
0.9
11
72004
172
1,7
00,0
00
2005
5109
2,4
77,0
00
1,2
76
0.9
22
72006∗
6119
713,0
57
409
0.9
61
10
2007
6159
1,5
55,5
52
951
120
2008
798
1,1
45,3
30
1,0
24
0.8
52
19
2009
774
1,9
51,2
14
748
0.9
61
72010
993
1,7
82,5
59
401
0.9
41
16
2011
3114
7,4
08,3
42
2012
286
55,7
84
2013
33,1
66,6
67
70.9
52
390-1
34
1,2
75,5
41
748
0.9
22
16
96-1
24
109
1,3
66,1
55
740
0.9
12
15
44
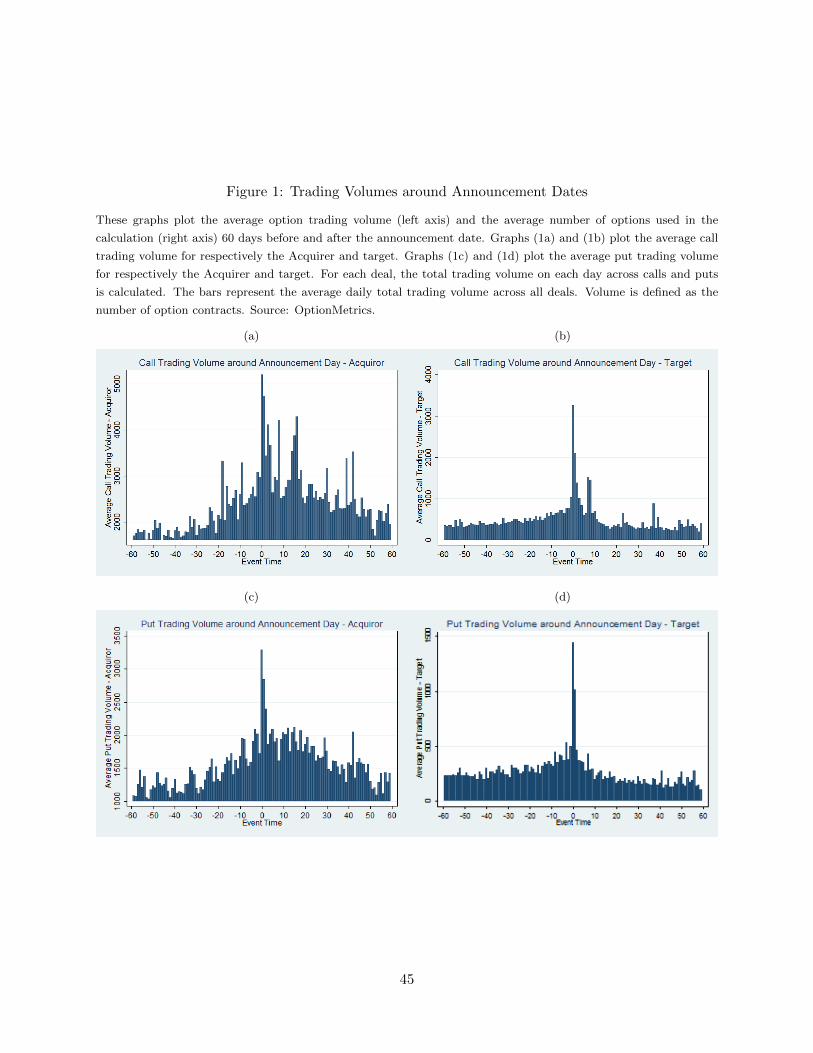
Figure 1: Trading Volumes around Announcement Dates
These graphs plot the average option trading volume (left axis) and the average number of options used in the
calculation (right axis) 60 days before and after the announcement date. Graphs (1a) and (1b) plot the average call
trading volume for respectively the Acquirer and target. Graphs (1c) and (1d) plot the average put trading volume
for respectively the Acquirer and target. For each deal, the total trading volume on each day across calls and puts
is calculated. The bars represent the average daily total trading volume across all deals. Volume is defined as the
number of option contracts. Source: OptionMetrics.
(a) (b)
(c) (d)
45
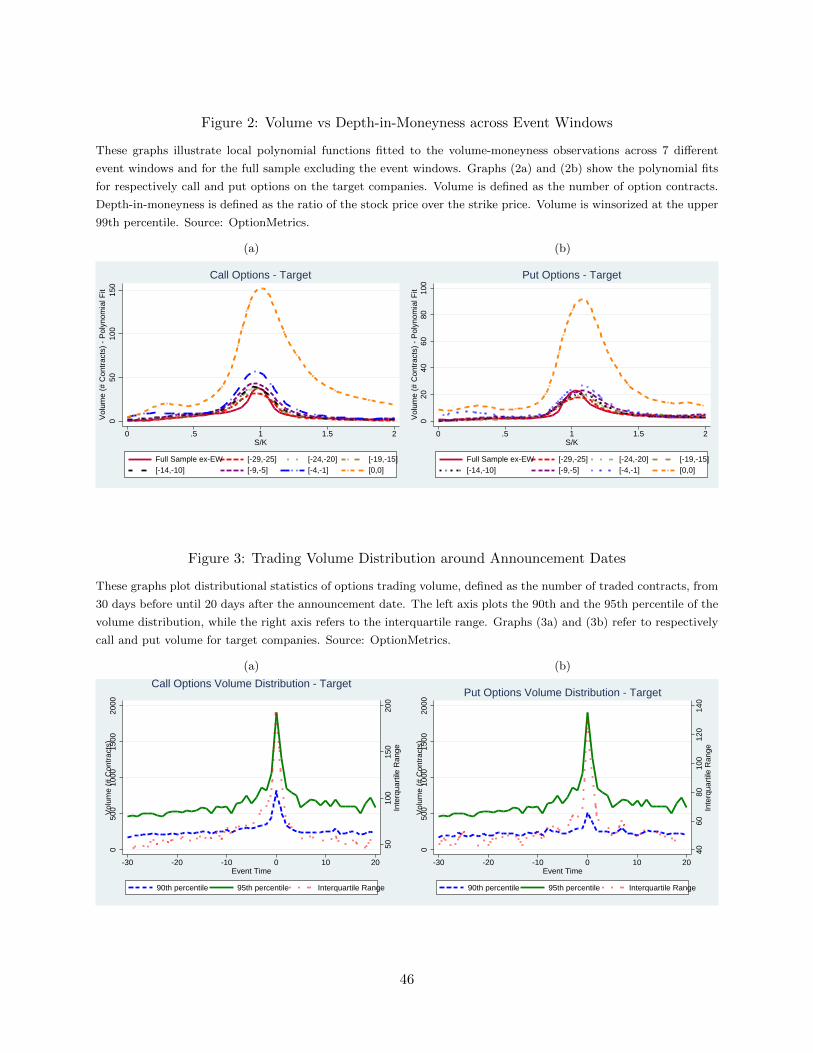
Figure 2: Volume vs Depth-in-Moneyness across Event Windows
These graphs illustrate local polynomial functions fitted to the volume-moneyness observations across 7 different
event windows and for the full sample excluding the event windows. Graphs (2a) and (2b) show the polynomial fits
for respectively call and put options on the target companies. Volume is defined as the number of option contracts.
Depth-in-moneyness is defined as the ratio of the stock price over the strike price. Volume is winsorized at the upper
99th percentile. Source: OptionMetrics.
(a)
050
100
150
Vol
ume
(# C
ontr
acts
) -
Pol
ynom
ial F
it
0 .5 1 1.5 2S/K
Full Sample ex-EW [-29,-25] [-24,-20] [-19,-15][-14,-10] [-9,-5] [-4,-1] [0,0]
Call Options - Target
(b)
020
4060
8010
0V
olum
e (#
Con
trac
ts)
- P
olyn
omia
l Fit
0 .5 1 1.5 2S/K
Full Sample ex-EW [-29,-25] [-24,-20] [-19,-15][-14,-10] [-9,-5] [-4,-1] [0,0]
Put Options - Target
Figure 3: Trading Volume Distribution around Announcement Dates
These graphs plot distributional statistics of options trading volume, defined as the number of traded contracts, from
30 days before until 20 days after the announcement date. The left axis plots the 90th and the 95th percentile of the
volume distribution, while the right axis refers to the interquartile range. Graphs (3a) and (3b) refer to respectively
call and put volume for target companies. Source: OptionMetrics.
(a)
5010
015
020
0In
terq
uart
ile R
ange
050
010
0015
0020
00V
olum
e (#
Con
trac
ts)
-30 -20 -10 0 10 20Event Time
90th percentile 95th percentile Interquartile Range
Call Options Volume Distribution - Target
(b)
4060
8010
012
014
0In
terq
uart
ile R
ange
050
010
0015
0020
00V
olum
e (#
Con
trac
ts)
-30 -20 -10 0 10 20Event Time
90th percentile 95th percentile Interquartile Range
Put Options Volume Distribution - Target
46
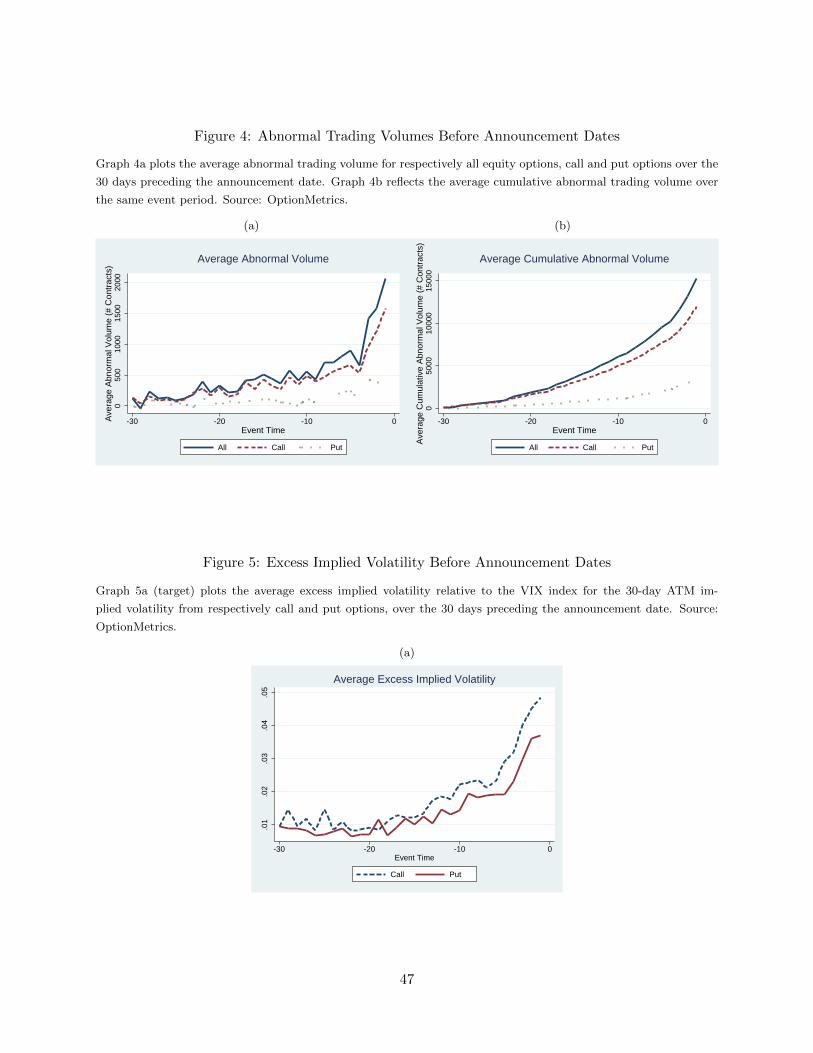
Figure 4: Abnormal Trading Volumes Before Announcement Dates
Graph 4a plots the average abnormal trading volume for respectively all equity options, call and put options over the
30 days preceding the announcement date. Graph 4b reflects the average cumulative abnormal trading volume over
the same event period. Source: OptionMetrics.
(a)
050
010
0015
0020
00A
vera
ge A
bnor
mal
Vol
ume
(# C
ontr
acts
)
-30 -20 -10 0Event Time
All Call Put
Average Abnormal Volume
(b)
050
0010
000
1500
0A
vera
ge C
umul
ativ
e A
bnor
mal
Vol
ume
(# C
ontr
acts
)-30 -20 -10 0
Event Time
All Call Put
Average Cumulative Abnormal Volume
Figure 5: Excess Implied Volatility Before Announcement Dates
Graph 5a (target) plots the average excess implied volatility relative to the VIX index for the 30-day ATM im-
plied volatility from respectively call and put options, over the 30 days preceding the announcement date. Source:
OptionMetrics.
(a)
.01
.02
.03
.04
.05
-30 -20 -10 0Event Time
Call Put
Average Excess Implied Volatility
47
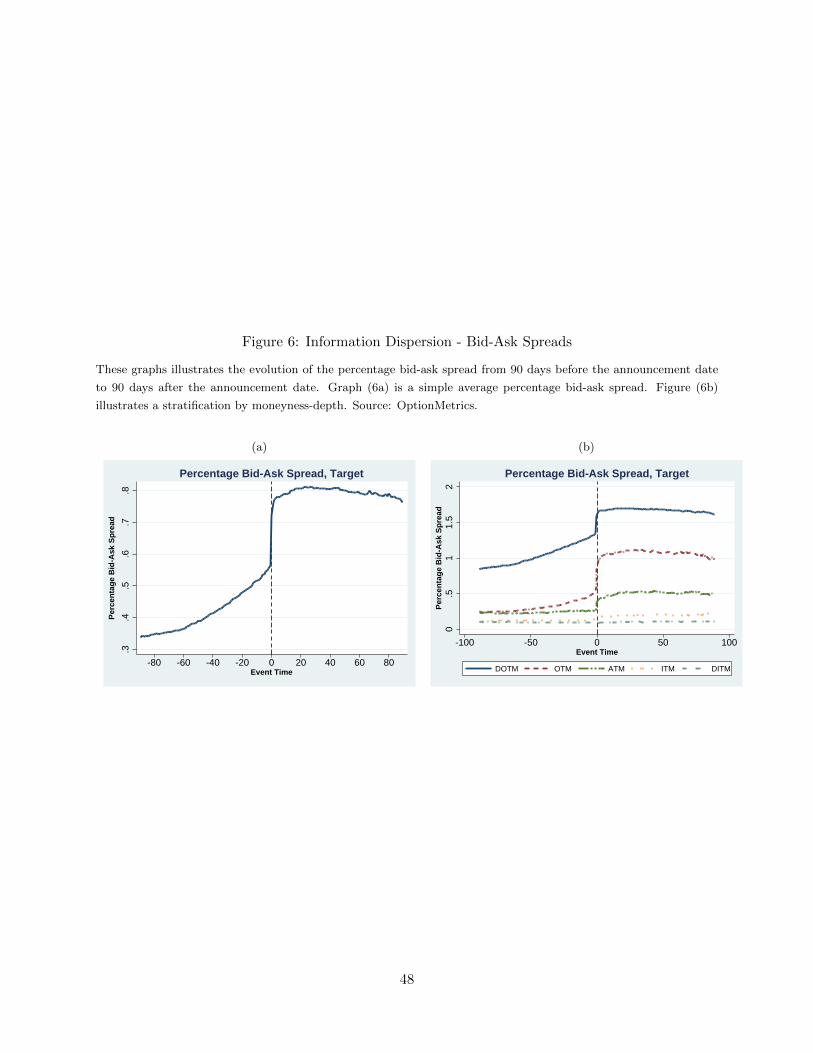
Figure 6: Information Dispersion - Bid-Ask Spreads
These graphs illustrates the evolution of the percentage bid-ask spread from 90 days before the announcement date
to 90 days after the announcement date. Graph (6a) is a simple average percentage bid-ask spread. Figure (6b)
illustrates a stratification by moneyness-depth. Source: OptionMetrics.
(a)
.3.4
.5.6
.7.8
Per
cen
tag
e B
id-A
sk S
pre
ad
-80 -60 -40 -20 0 20 40 60 80Event Time
Percentage Bid-Ask Spread, Target
(b)0
.51
1.5
2P
erce
nta
ge
Bid
-Ask
Sp
read
-100 -50 0 50 100Event Time
DOTM OTM ATM ITM DITM
Percentage Bid-Ask Spread, Target
48
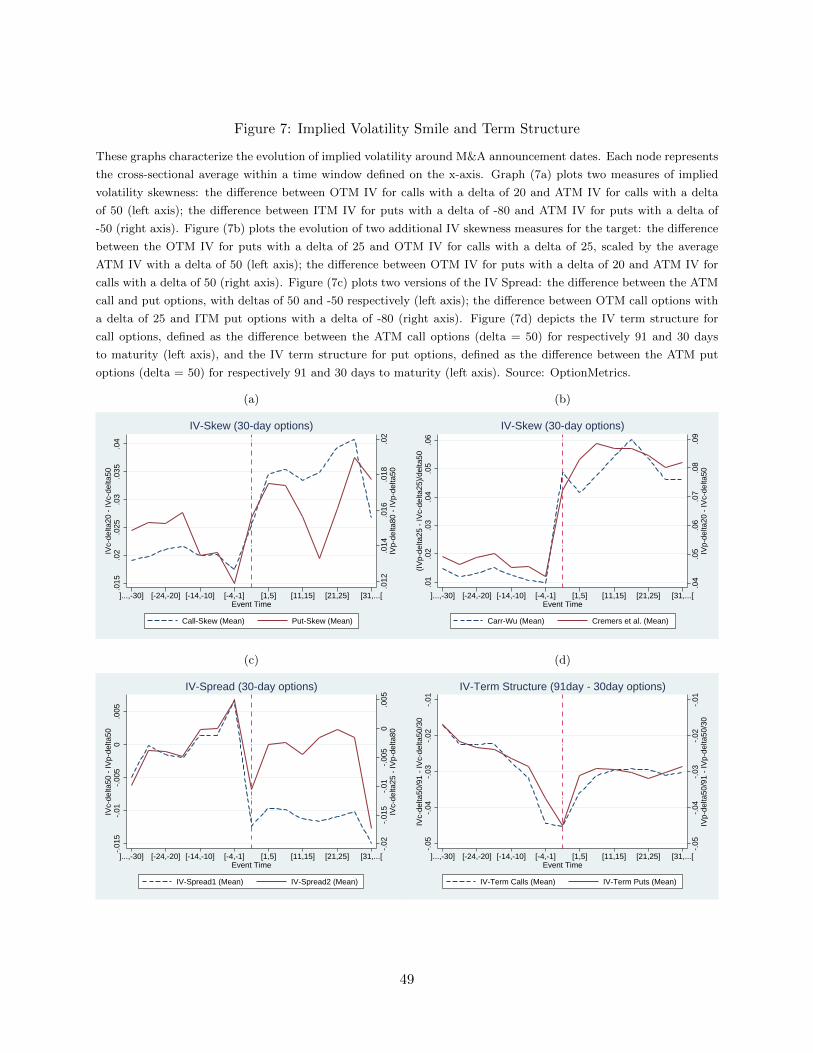
Figure 7: Implied Volatility Smile and Term Structure
These graphs characterize the evolution of implied volatility around M&A announcement dates. Each node represents
the cross-sectional average within a time window defined on the x-axis. Graph (7a) plots two measures of implied
volatility skewness: the difference between OTM IV for calls with a delta of 20 and ATM IV for calls with a delta
of 50 (left axis); the difference between ITM IV for puts with a delta of -80 and ATM IV for puts with a delta of
-50 (right axis). Figure (7b) plots the evolution of two additional IV skewness measures for the target: the difference
between the OTM IV for puts with a delta of 25 and OTM IV for calls with a delta of 25, scaled by the average
ATM IV with a delta of 50 (left axis); the difference between OTM IV for puts with a delta of 20 and ATM IV for
calls with a delta of 50 (right axis). Figure (7c) plots two versions of the IV Spread: the difference between the ATM
call and put options, with deltas of 50 and -50 respectively (left axis); the difference between OTM call options with
a delta of 25 and ITM put options with a delta of -80 (right axis). Figure (7d) depicts the IV term structure for
call options, defined as the difference between the ATM call options (delta = 50) for respectively 91 and 30 days
to maturity (left axis), and the IV term structure for put options, defined as the difference between the ATM put
options (delta = 50) for respectively 91 and 30 days to maturity (left axis). Source: OptionMetrics.
(a)
.012
.014
.016
.018
.02
IVp-
delta
80 -
IVp-
delta
50
.015
.02
.025
.03
.035
.04
IVc-
delta
20 -
IVc-
delta
50
]...,-30] [-24,-20] [-14,-10] [-4,-1] [1,5] [11,15] [21,25] [31,...[Event Time
Call-Skew (Mean) Put-Skew (Mean)
IV-Skew (30-day options)
(b)
.04
.05
.06
.07
.08
.09
IVp-
delta
20 -
IVc-
delta
50
.01
.02
.03
.04
.05
.06
(IV
p-de
lta25
- IV
c-de
lta25
)/de
lta50
]...,-30] [-24,-20] [-14,-10] [-4,-1] [1,5] [11,15] [21,25] [31,...[Event Time
Carr-Wu (Mean) Cremers et al. (Mean)
IV-Skew (30-day options)
(c)
-.02
-.01
5-.
01-.
005
0.0
05IV
c-de
lta25
- IV
p-de
lta80
-.01
5-.
01-.
005
0.0
05IV
c-de
lta50
- IV
p-de
lta50
]...,-30] [-24,-20] [-14,-10] [-4,-1] [1,5] [11,15] [21,25] [31,...[Event Time
IV-Spread1 (Mean) IV-Spread2 (Mean)
IV-Spread (30-day options)
(d)
-.05
-.04
-.03
-.02
-.01
IVp-
delta
50/9
1 -
IVp-
delta
50/3
0
-.05
-.04
-.03
-.02
-.01
IVc-
delta
50/9
1 -
IVc-
delta
50/3
0
]...,-30] [-24,-20] [-14,-10] [-4,-1] [1,5] [11,15] [21,25] [31,...[Event Time
IV-Term Calls (Mean) IV-Term Puts (Mean)
IV-Term Structure (91day - 30day options)
49
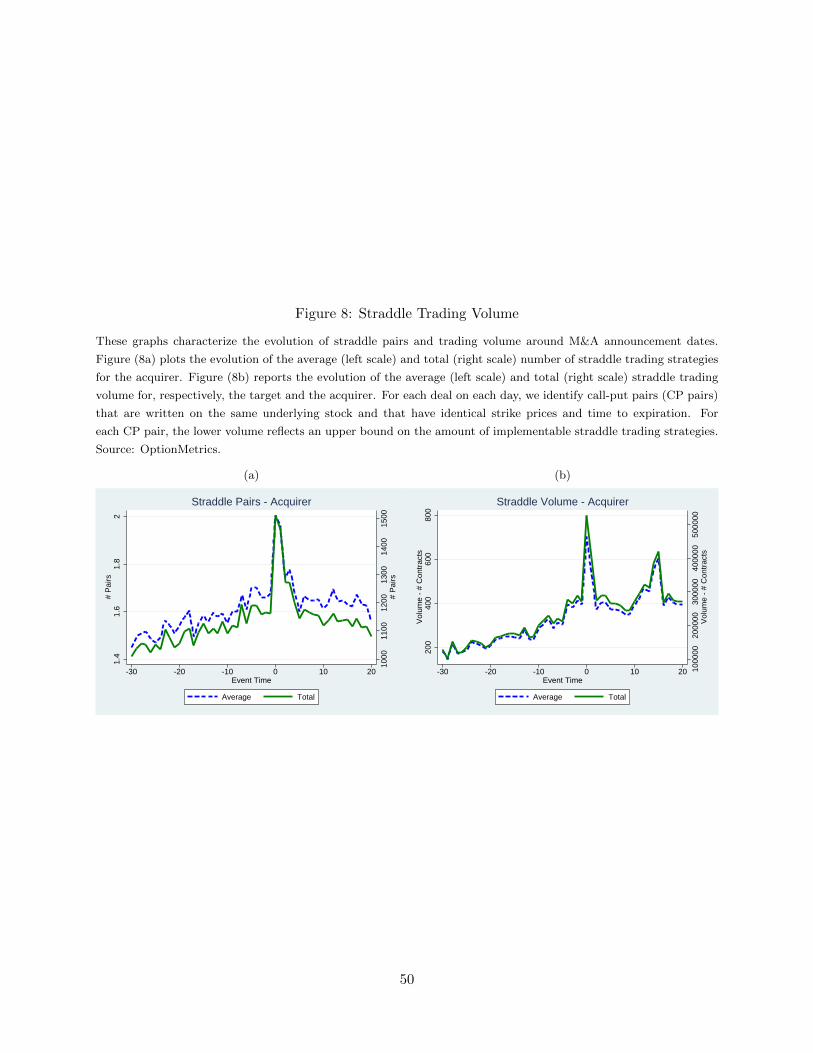
Figure 8: Straddle Trading Volume
These graphs characterize the evolution of straddle pairs and trading volume around M&A announcement dates.
Figure (8a) plots the evolution of the average (left scale) and total (right scale) number of straddle trading strategies
for the acquirer. Figure (8b) reports the evolution of the average (left scale) and total (right scale) straddle trading
volume for, respectively, the target and the acquirer. For each deal on each day, we identify call-put pairs (CP pairs)
that are written on the same underlying stock and that have identical strike prices and time to expiration. For
each CP pair, the lower volume reflects an upper bound on the amount of implementable straddle trading strategies.
Source: OptionMetrics.
(a)
1000
1100
1200
1300
1400
1500
# P
airs
1.4
1.6
1.8
2#
Pai
rs
-30 -20 -10 0 10 20Event Time
Average Total
Straddle Pairs - Acquirer
(b)
1000
0020
0000
3000
0040
0000
5000
00V
olum
e -
# C
ontr
acts
200
400
600
800
Vol
ume
- #
Con
trac
ts
-30 -20 -10 0 10 20Event Time
Average Total
Straddle Volume - Acquirer
50
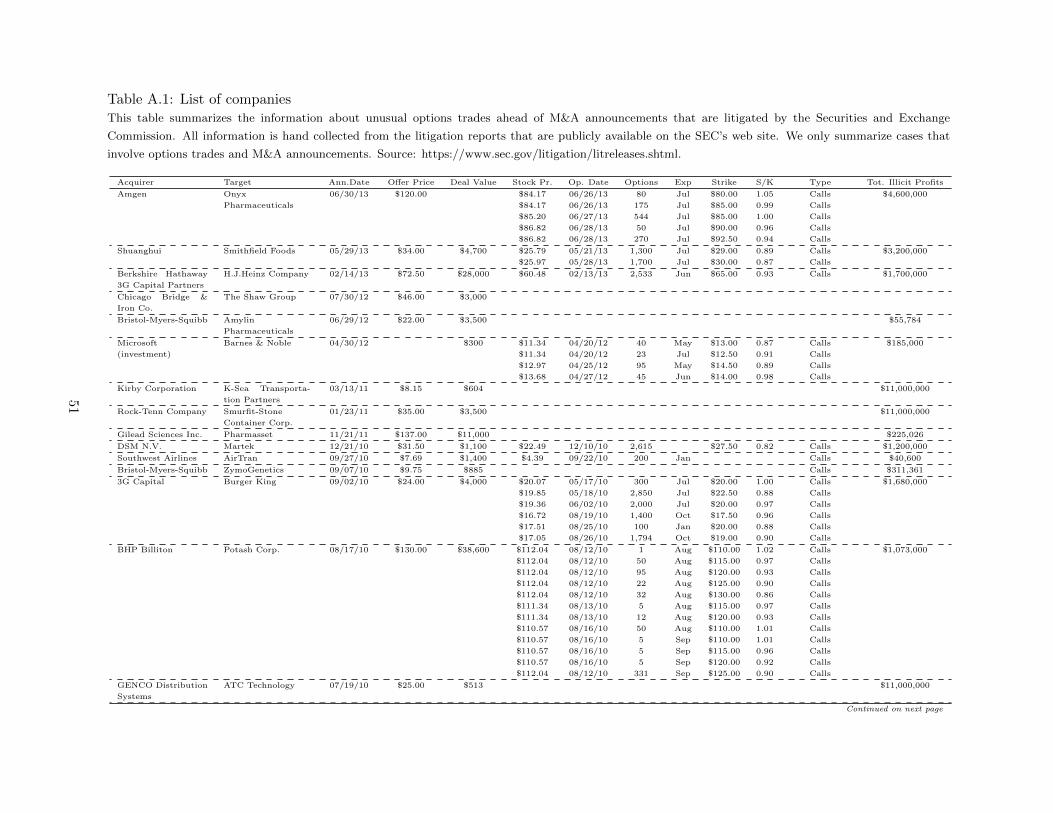
Table A.1: List of companiesThis table summarizes the information about unusual options trades ahead of M&A announcements that are litigated by the Securities and Exchange
Commission. All information is hand collected from the litigation reports that are publicly available on the SEC’s web site. We only summarize cases that
involve options trades and M&A announcements. Source: https://www.sec.gov/litigation/litreleases.shtml.
Acquirer Target Ann.Date Offer Price Deal Value Stock Pr. Op. Date Options Exp Strike S/K Type Tot. Illicit Profits
Amgen Onyx 06/30/13 $120.00 $84.17 06/26/13 80 Jul $80.00 1.05 Calls $4,600,000
Pharmaceuticals $84.17 06/26/13 175 Jul $85.00 0.99 Calls
$85.20 06/27/13 544 Jul $85.00 1.00 Calls
$86.82 06/28/13 50 Jul $90.00 0.96 Calls
$86.82 06/28/13 270 Jul $92.50 0.94 Calls
Shuanghui Smithfield Foods 05/29/13 $34.00 $4,700 $25.79 05/21/13 1,300 Jul $29.00 0.89 Calls $3,200,000
$25.97 05/28/13 1,700 Jul $30.00 0.87 Calls
Berkshire Hathaway
3G Capital Partners
H.J.Heinz Company 02/14/13 $72.50 $28,000 $60.48 02/13/13 2,533 Jun $65.00 0.93 Calls $1,700,000
Chicago Bridge &
Iron Co.
The Shaw Group 07/30/12 $46.00 $3,000
Bristol-Myers-Squibb Amylin 06/29/12 $22.00 $3,500 $55,784
Pharmaceuticals
Microsoft Barnes & Noble 04/30/12 $300 $11.34 04/20/12 40 May $13.00 0.87 Calls $185,000
(investment) $11.34 04/20/12 23 Jul $12.50 0.91 Calls
$12.97 04/25/12 95 May $14.50 0.89 Calls
$13.68 04/27/12 45 Jun $14.00 0.98 Calls
Kirby Corporation K-Sea Transporta-
tion Partners
03/13/11 $8.15 $604 $11,000,000
Rock-Tenn Company Smurfit-Stone 01/23/11 $35.00 $3,500 $11,000,000
Container Corp.
Gilead Sciences Inc. Pharmasset 11/21/11 $137.00 $11,000 $225,026
DSM N.V. Martek 12/21/10 $31.50 $1,100 $22.49 12/10/10 2,615 $27.50 0.82 Calls $1,200,000
Southwest Airlines AirTran 09/27/10 $7.69 $1,400 $4.39 09/22/10 200 Jan Calls $40,600
Bristol-Myers-Squibb ZymoGenetics 09/07/10 $9.75 $885 Calls $311,361
3G Capital Burger King 09/02/10 $24.00 $4,000 $20.07 05/17/10 300 Jul $20.00 1.00 Calls $1,680,000
$19.85 05/18/10 2,850 Jul $22.50 0.88 Calls
$19.36 06/02/10 2,000 Jul $20.00 0.97 Calls
$16.72 08/19/10 1,400 Oct $17.50 0.96 Calls
$17.51 08/25/10 100 Jan $20.00 0.88 Calls
$17.05 08/26/10 1,794 Oct $19.00 0.90 Calls
BHP Billiton Potash Corp. 08/17/10 $130.00 $38,600 $112.04 08/12/10 1 Aug $110.00 1.02 Calls $1,073,000
$112.04 08/12/10 50 Aug $115.00 0.97 Calls
$112.04 08/12/10 95 Aug $120.00 0.93 Calls
$112.04 08/12/10 22 Aug $125.00 0.90 Calls
$112.04 08/12/10 32 Aug $130.00 0.86 Calls
$111.34 08/13/10 5 Aug $115.00 0.97 Calls
$111.34 08/13/10 12 Aug $120.00 0.93 Calls
$110.57 08/16/10 50 Aug $110.00 1.01 Calls
$110.57 08/16/10 5 Sep $110.00 1.01 Calls
$110.57 08/16/10 5 Sep $115.00 0.96 Calls
$110.57 08/16/10 5 Sep $120.00 0.92 Calls
$112.04 08/12/10 331 Sep $125.00 0.90 Calls
GENCO Distribution
Systems
ATC Technology 07/19/10 $25.00 $513 $11,000,000
Continued on next page
51
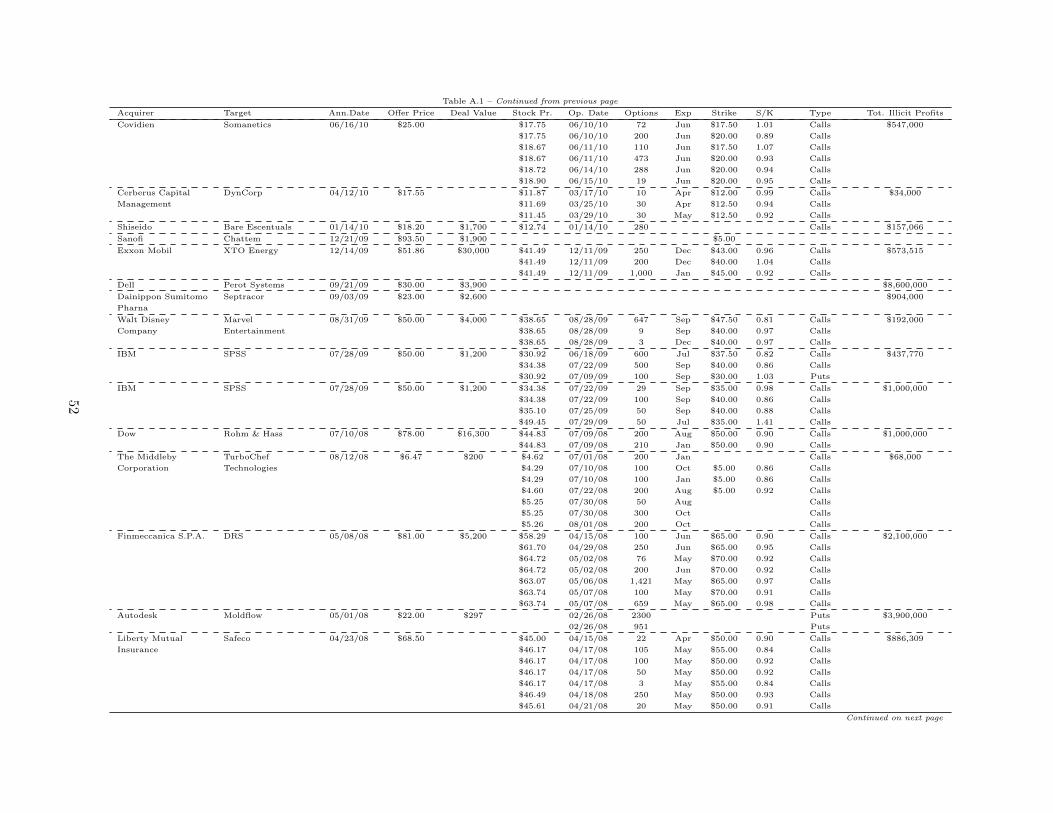
Table A.1 – Continued from previous page
Acquirer Target Ann.Date Offer Price Deal Value Stock Pr. Op. Date Options Exp Strike S/K Type Tot. Illicit Profits
Covidien Somanetics 06/16/10 $25.00 $17.75 06/10/10 72 Jun $17.50 1.01 Calls $547,000
$17.75 06/10/10 200 Jun $20.00 0.89 Calls
$18.67 06/11/10 110 Jun $17.50 1.07 Calls
$18.67 06/11/10 473 Jun $20.00 0.93 Calls
$18.72 06/14/10 288 Jun $20.00 0.94 Calls
$18.90 06/15/10 19 Jun $20.00 0.95 Calls
Cerberus Capital DynCorp 04/12/10 $17.55 $11.87 03/17/10 10 Apr $12.00 0.99 Calls $34,000
Management $11.69 03/25/10 30 Apr $12.50 0.94 Calls
$11.45 03/29/10 30 May $12.50 0.92 Calls
Shiseido Bare Escentuals 01/14/10 $18.20 $1,700 $12.74 01/14/10 280 Calls $157,066
Sanofi Chattem 12/21/09 $93.50 $1,900 $5.00
Exxon Mobil XTO Energy 12/14/09 $51.86 $30,000 $41.49 12/11/09 250 Dec $43.00 0.96 Calls $573,515
$41.49 12/11/09 200 Dec $40.00 1.04 Calls
$41.49 12/11/09 1,000 Jan $45.00 0.92 Calls
Dell Perot Systems 09/21/09 $30.00 $3,900 $8,600,000
Dainippon Sumitomo
Pharna
Septracor 09/03/09 $23.00 $2,600 $904,000
Walt Disney Marvel 08/31/09 $50.00 $4,000 $38.65 08/28/09 647 Sep $47.50 0.81 Calls $192,000
Company Entertainment $38.65 08/28/09 9 Sep $40.00 0.97 Calls
$38.65 08/28/09 3 Dec $40.00 0.97 Calls
IBM SPSS 07/28/09 $50.00 $1,200 $30.92 06/18/09 600 Jul $37.50 0.82 Calls $437,770
$34.38 07/22/09 500 Sep $40.00 0.86 Calls
$30.92 07/09/09 100 Sep $30.00 1.03 Puts
IBM SPSS 07/28/09 $50.00 $1,200 $34.38 07/22/09 29 Sep $35.00 0.98 Calls $1,000,000
$34.38 07/22/09 100 Sep $40.00 0.86 Calls
$35.10 07/25/09 50 Sep $40.00 0.88 Calls
$49.45 07/29/09 50 Jul $35.00 1.41 Calls
Dow Rohm & Hass 07/10/08 $78.00 $16,300 $44.83 07/09/08 200 Aug $50.00 0.90 Calls $1,000,000
$44.83 07/09/08 210 Jan $50.00 0.90 Calls
The Middleby TurboChef 08/12/08 $6.47 $200 $4.62 07/01/08 200 Jan Calls $68,000
Corporation Technologies $4.29 07/10/08 100 Oct $5.00 0.86 Calls
$4.29 07/10/08 100 Jan $5.00 0.86 Calls
$4.60 07/22/08 200 Aug $5.00 0.92 Calls
$5.25 07/30/08 50 Aug Calls
$5.25 07/30/08 300 Oct Calls
$5.26 08/01/08 200 Oct Calls
Finmeccanica S.P.A. DRS 05/08/08 $81.00 $5,200 $58.29 04/15/08 100 Jun $65.00 0.90 Calls $2,100,000
$61.70 04/29/08 250 Jun $65.00 0.95 Calls
$64.72 05/02/08 76 May $70.00 0.92 Calls
$64.72 05/02/08 200 Jun $70.00 0.92 Calls
$63.07 05/06/08 1,421 May $65.00 0.97 Calls
$63.74 05/07/08 100 May $70.00 0.91 Calls
$63.74 05/07/08 659 May $65.00 0.98 Calls
Autodesk Moldflow 05/01/08 $22.00 $297 02/26/08 2300 Puts $3,900,000
02/26/08 951 Puts
Liberty Mutual Safeco 04/23/08 $68.50 $45.00 04/15/08 22 Apr $50.00 0.90 Calls $886,309
Insurance $46.17 04/17/08 105 May $55.00 0.84 Calls
$46.17 04/17/08 100 May $50.00 0.92 Calls
$46.17 04/17/08 50 May $50.00 0.92 Calls
$46.17 04/17/08 3 May $55.00 0.84 Calls
$46.49 04/18/08 250 May $50.00 0.93 Calls
$45.61 04/21/08 20 May $50.00 0.91 Calls
Continued on next page
52
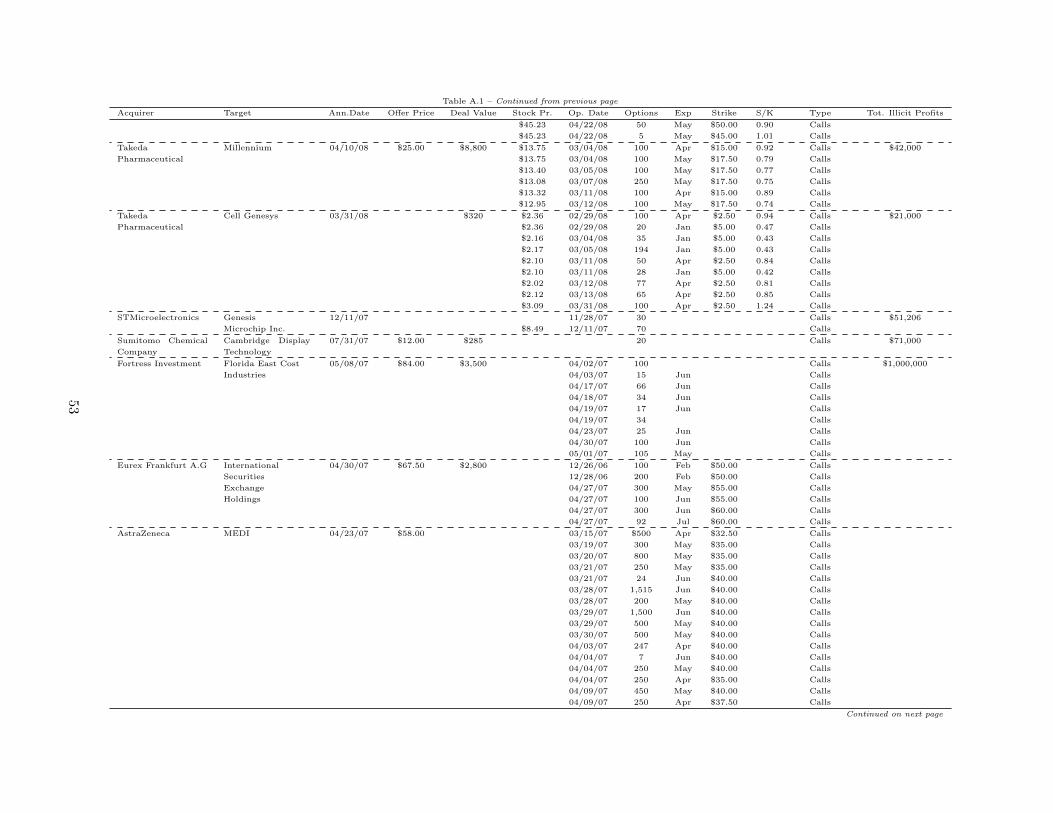
Table A.1 – Continued from previous page
Acquirer Target Ann.Date Offer Price Deal Value Stock Pr. Op. Date Options Exp Strike S/K Type Tot. Illicit Profits
$45.23 04/22/08 50 May $50.00 0.90 Calls
$45.23 04/22/08 5 May $45.00 1.01 Calls
Takeda Millennium 04/10/08 $25.00 $8,800 $13.75 03/04/08 100 Apr $15.00 0.92 Calls $42,000
Pharmaceutical $13.75 03/04/08 100 May $17.50 0.79 Calls
$13.40 03/05/08 100 May $17.50 0.77 Calls
$13.08 03/07/08 250 May $17.50 0.75 Calls
$13.32 03/11/08 100 Apr $15.00 0.89 Calls
$12.95 03/12/08 100 May $17.50 0.74 Calls
Takeda Cell Genesys 03/31/08 $320 $2.36 02/29/08 100 Apr $2.50 0.94 Calls $21,000
Pharmaceutical $2.36 02/29/08 20 Jan $5.00 0.47 Calls
$2.16 03/04/08 35 Jan $5.00 0.43 Calls
$2.17 03/05/08 194 Jan $5.00 0.43 Calls
$2.10 03/11/08 50 Apr $2.50 0.84 Calls
$2.10 03/11/08 28 Jan $5.00 0.42 Calls
$2.02 03/12/08 77 Apr $2.50 0.81 Calls
$2.12 03/13/08 65 Apr $2.50 0.85 Calls
$3.09 03/31/08 100 Apr $2.50 1.24 Calls
STMicroelectronics Genesis 12/11/07 11/28/07 30 Calls $51,206
Microchip Inc. $8.49 12/11/07 70 Calls
Sumitomo Chemical
Company
Cambridge Display
Technology
07/31/07 $12.00 $285 20 Calls $71,000
Fortress Investment Florida East Cost 05/08/07 $84.00 $3,500 04/02/07 100 Calls $1,000,000
Industries 04/03/07 15 Jun Calls
04/17/07 66 Jun Calls
04/18/07 34 Jun Calls
04/19/07 17 Jun Calls
04/19/07 34 Calls
04/23/07 25 Jun Calls
04/30/07 100 Jun Calls
05/01/07 105 May Calls
Eurex Frankfurt A.G International 04/30/07 $67.50 $2,800 12/26/06 100 Feb $50.00 Calls
Securities 12/28/06 200 Feb $50.00 Calls
Exchange 04/27/07 300 May $55.00 Calls
Holdings 04/27/07 100 Jun $55.00 Calls
04/27/07 300 Jun $60.00 Calls
04/27/07 92 Jul $60.00 Calls
AstraZeneca MEDI 04/23/07 $58.00 03/15/07 $500 Apr $32.50 Calls
03/19/07 300 May $35.00 Calls
03/20/07 800 May $35.00 Calls
03/21/07 250 May $35.00 Calls
03/21/07 24 Jun $40.00 Calls
03/28/07 1,515 Jun $40.00 Calls
03/28/07 200 May $40.00 Calls
03/29/07 1,500 Jun $40.00 Calls
03/29/07 500 May $40.00 Calls
03/30/07 500 May $40.00 Calls
04/03/07 247 Apr $40.00 Calls
04/04/07 7 Jun $40.00 Calls
04/04/07 250 May $40.00 Calls
04/04/07 250 Apr $35.00 Calls
04/09/07 450 May $40.00 Calls
04/09/07 250 Apr $37.50 Calls
Continued on next page
53
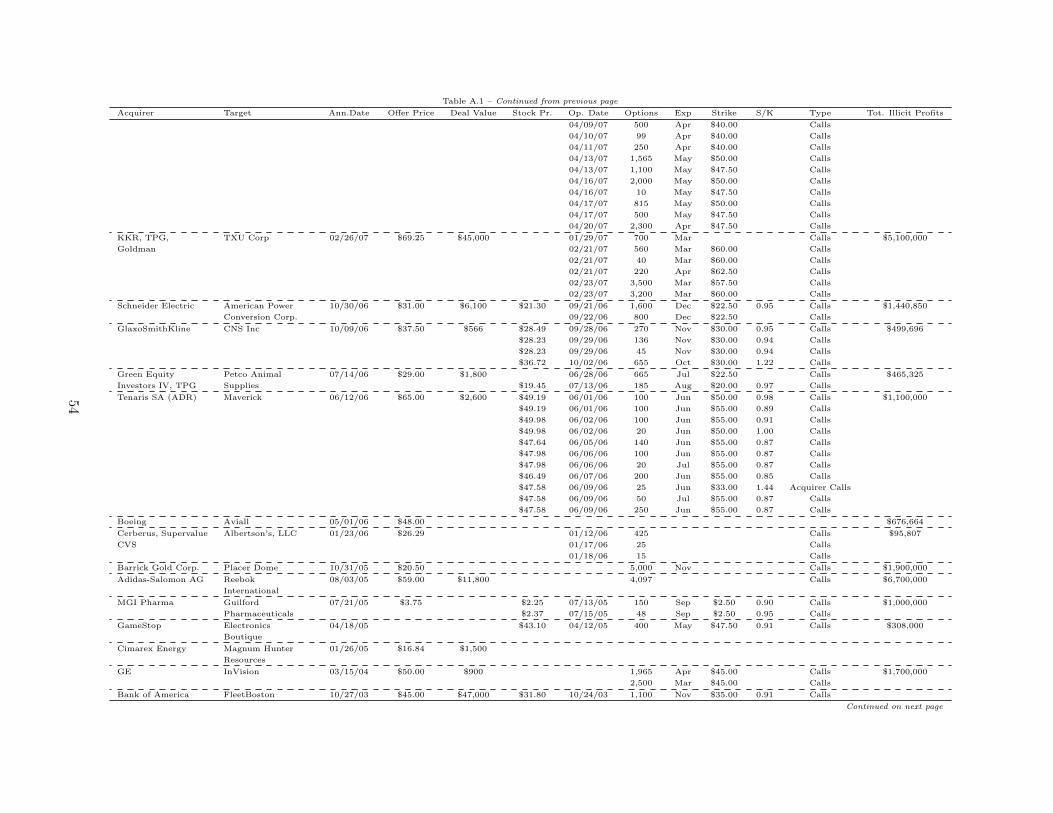
Table A.1 – Continued from previous page
Acquirer Target Ann.Date Offer Price Deal Value Stock Pr. Op. Date Options Exp Strike S/K Type Tot. Illicit Profits
04/09/07 500 Apr $40.00 Calls
04/10/07 99 Apr $40.00 Calls
04/11/07 250 Apr $40.00 Calls
04/13/07 1,565 May $50.00 Calls
04/13/07 1,100 May $47.50 Calls
04/16/07 2,000 May $50.00 Calls
04/16/07 10 May $47.50 Calls
04/17/07 815 May $50.00 Calls
04/17/07 500 May $47.50 Calls
04/20/07 2,300 Apr $47.50 Calls
KKR, TPG, TXU Corp 02/26/07 $69.25 $45,000 01/29/07 700 Mar Calls $5,100,000
Goldman 02/21/07 560 Mar $60.00 Calls
02/21/07 40 Mar $60.00 Calls
02/21/07 220 Apr $62.50 Calls
02/23/07 3,500 Mar $57.50 Calls
02/23/07 3,200 Mar $60.00 Calls
Schneider Electric American Power 10/30/06 $31.00 $6,100 $21.30 09/21/06 1,600 Dec $22.50 0.95 Calls $1,440,850
Conversion Corp. 09/22/06 800 Dec $22.50 Calls
GlaxoSmithKline CNS Inc 10/09/06 $37.50 $566 $28.49 09/28/06 270 Nov $30.00 0.95 Calls $499,696
$28.23 09/29/06 136 Nov $30.00 0.94 Calls
$28.23 09/29/06 45 Nov $30.00 0.94 Calls
$36.72 10/02/06 655 Oct $30.00 1.22 Calls
Green Equity Petco Animal 07/14/06 $29.00 $1,800 06/28/06 665 Jul $22.50 Calls $465,325
Investors IV, TPG Supplies $19.45 07/13/06 185 Aug $20.00 0.97 Calls
Tenaris SA (ADR) Maverick 06/12/06 $65.00 $2,600 $49.19 06/01/06 100 Jun $50.00 0.98 Calls $1,100,000
$49.19 06/01/06 100 Jun $55.00 0.89 Calls
$49.98 06/02/06 100 Jun $55.00 0.91 Calls
$49.98 06/02/06 20 Jun $50.00 1.00 Calls
$47.64 06/05/06 140 Jun $55.00 0.87 Calls
$47.98 06/06/06 100 Jun $55.00 0.87 Calls
$47.98 06/06/06 20 Jul $55.00 0.87 Calls
$46.49 06/07/06 200 Jun $55.00 0.85 Calls
$47.58 06/09/06 25 Jun $33.00 1.44 Acquirer Calls
$47.58 06/09/06 50 Jul $55.00 0.87 Calls
$47.58 06/09/06 250 Jun $55.00 0.87 Calls
Boeing Aviall 05/01/06 $48.00 $676,664
Cerberus, Supervalue Albertson’s, LLC 01/23/06 $26.29 01/12/06 425 Calls $95,807
CVS 01/17/06 25 Calls
01/18/06 15 Calls
Barrick Gold Corp. Placer Dome 10/31/05 $20.50 5,000 Nov Calls $1,900,000
Adidas-Salomon AG Reebok 08/03/05 $59.00 $11,800 4,097 Calls $6,700,000
International
MGI Pharma Guilford 07/21/05 $3.75 $2.25 07/13/05 150 Sep $2.50 0.90 Calls $1,000,000
Pharmaceuticals $2.37 07/15/05 48 Sep $2.50 0.95 Calls
GameStop Electronics 04/18/05 $43.10 04/12/05 400 May $47.50 0.91 Calls $308,000
Boutique
Cimarex Energy Magnum Hunter 01/26/05 $16.84 $1,500
Resources
GE InVision 03/15/04 $50.00 $900 1,965 Apr $45.00 Calls $1,700,000
2,500 Mar $45.00 Calls
Bank of America FleetBoston 10/27/03 $45.00 $47,000 $31.80 10/24/03 1,100 Nov $35.00 0.91 Calls
Continued on next page
54
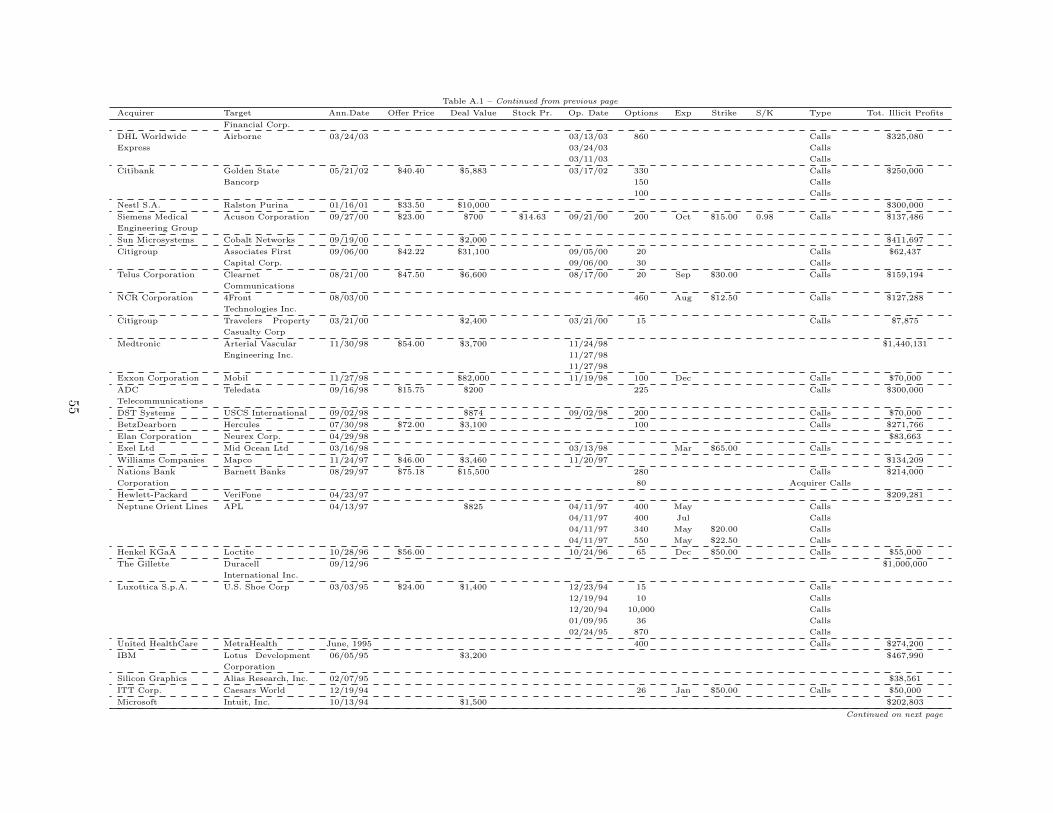
Table A.1 – Continued from previous page
Acquirer Target Ann.Date Offer Price Deal Value Stock Pr. Op. Date Options Exp Strike S/K Type Tot. Illicit Profits
Financial Corp.
DHL Worldwide Airborne 03/24/03 03/13/03 860 Calls $325,080
Express 03/24/03 Calls
03/11/03 Calls
Citibank Golden State 05/21/02 $40.40 $5,883 03/17/02 330 Calls $250,000
Bancorp 150 Calls
100 Calls
Nestl S.A. Ralston Purina 01/16/01 $33.50 $10,000 $300,000
Siemens Medical Acuson Corporation 09/27/00 $23.00 $700 $14.63 09/21/00 200 Oct $15.00 0.98 Calls $137,486
Engineering Group
Sun Microsystems Cobalt Networks 09/19/00 $2,000 $411,697
Citigroup Associates First 09/06/00 $42.22 $31,100 09/05/00 20 Calls $62,437
Capital Corp. 09/06/00 30 Calls
Telus Corporation Clearnet 08/21/00 $47.50 $6,600 08/17/00 20 Sep $30.00 Calls $159,194
Communications
NCR Corporation 4Front 08/03/00 460 Aug $12.50 Calls $127,288
Technologies Inc.
Citigroup Travelers Property
Casualty Corp
03/21/00 $2,400 03/21/00 15 Calls $7,875
Medtronic Arterial Vascular 11/30/98 $54.00 $3,700 11/24/98 $1,440,131
Engineering Inc. 11/27/98
11/27/98
Exxon Corporation Mobil 11/27/98 $82,000 11/19/98 100 Dec Calls $70,000
ADC Teledata 09/16/98 $15.75 $200 225 Calls $300,000
Telecommunications
DST Systems USCS International 09/02/98 $874 09/02/98 200 Calls $70,000
BetzDearborn Hercules 07/30/98 $72.00 $3,100 100 Calls $271,766
Elan Corporation Neurex Corp. 04/29/98 $83,663
Exel Ltd Mid Ocean Ltd 03/16/98 03/13/98 Mar $65.00 Calls
Williams Companies Mapco 11/24/97 $46.00 $3,460 11/20/97 $134,209
Nations Bank Barnett Banks 08/29/97 $75.18 $15,500 280 Calls $214,000
Corporation 80 Acquirer Calls
Hewlett-Packard VeriFone 04/23/97 $209,281
Neptune Orient Lines APL 04/13/97 $825 04/11/97 400 May Calls
04/11/97 400 Jul Calls
04/11/97 340 May $20.00 Calls
04/11/97 550 May $22.50 Calls
Henkel KGaA Loctite 10/28/96 $56.00 10/24/96 65 Dec $50.00 Calls $55,000
The Gillette Duracell 09/12/96 $1,000,000
International Inc.
Luxottica S.p.A. U.S. Shoe Corp 03/03/95 $24.00 $1,400 12/23/94 15 Calls
12/19/94 10 Calls
12/20/94 10,000 Calls
01/09/95 36 Calls
02/24/95 870 Calls
United HealthCare MetraHealth June, 1995 400 Calls $274,200
IBM Lotus Development
Corporation
06/05/95 $3,200 $467,990
Silicon Graphics Alias Research, Inc. 02/07/95 $38,561
ITT Corp. Caesars World 12/19/94 26 Jan $50.00 Calls $50,000
Microsoft Intuit, Inc. 10/13/94 $1,500 $202,803
Continued on next page
55
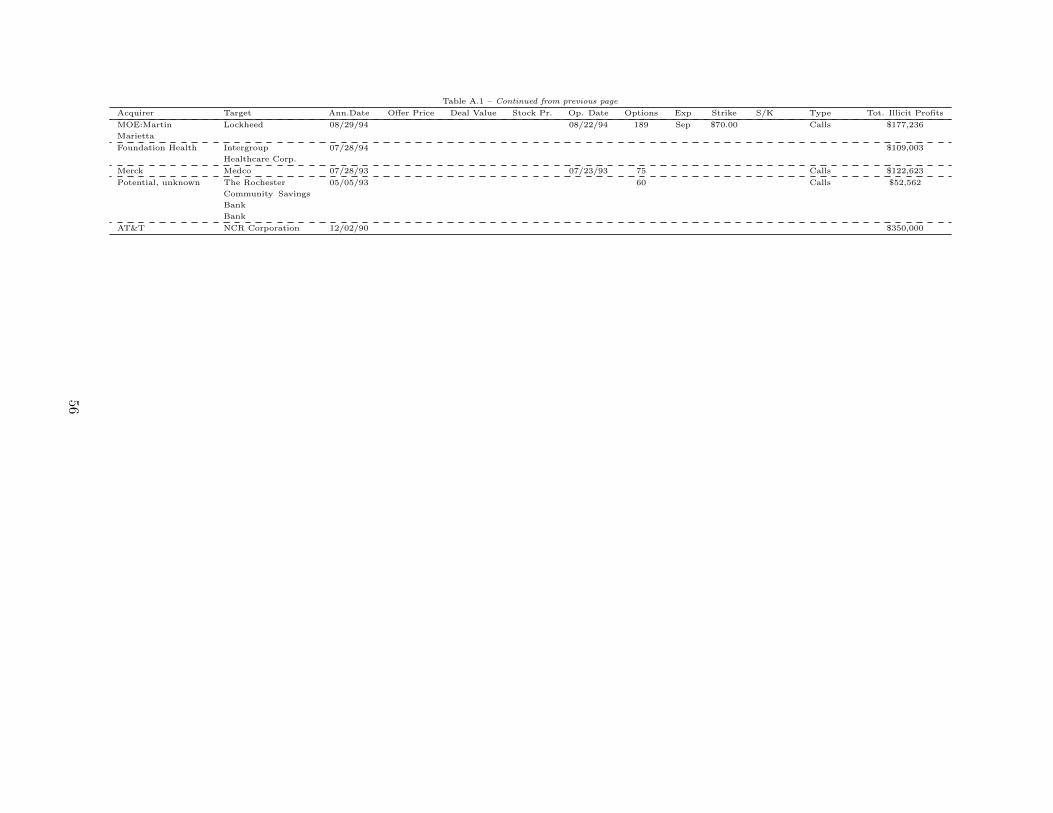
Table A.1 – Continued from previous page
Acquirer Target Ann.Date Offer Price Deal Value Stock Pr. Op. Date Options Exp Strike S/K Type Tot. Illicit Profits
MOE:Martin Lockheed 08/29/94 08/22/94 189 Sep $70.00 Calls $177,236
Marietta
Foundation Health Intergroup 07/28/94 $109,003
Healthcare Corp.
Merck Medco 07/28/93 07/23/93 75 Calls $122,623
Potential, unknown The Rochester 05/05/93 60 Calls $52,562
Community Savings
Bank
Bank
AT&T NCR Corporation 12/02/90 $350,000
56


![Microsoft Outlook - Memo Style - Larsen & Toubrovalves.larsentoubro.com/CustomerCare/documents/9_LT... · · 2015-10-19From: Jagdish Dhamane [mailto:Jagdish_Dhamane@lntenc.com]](https://img.dokumen.tips/doc/110x75/5ada34cb7f8b9a137f8d28bc/microsoft-outlook-memo-style-larsen-jagdish-dhamane-mailtojagdishdhamanelntenccom.jpg)