Embed Size (px)
Citation preview


Supplementary financial information 328
Supplementary people information 343
Supplementary sustainability information 345
Shareholder information 349
Major awards 2015 351
Glossary 353
Index 357
Su
pp
leme
nta
ry in
form
ation
Supplementary information

328 Standard Chartered Annual Report 2015
Average balance sheets and yieldThe following tables set out the average balances and yields for the Group’s assets and liabilities for the years ended 31 December 2015 and 31 December 2014. For the purpose of the following tables, average balances have generally been determined on the basis of daily
balances, except for certain categories, for which balances have been determined less frequently. The Group does not believe that the information presented in these tables would be significantly different had such balances been determined on a daily basis.
2015
Average non-interest
earning balance$million
Average interest earning balance$million
Interest income$million
Gross yield
%
Assets Cash and balances at central banks 17,405 62,960 238 0.4 Gross loans and advances to banks 3,573 79,489 1,020 1.3 Gross loans and advances to customers 76 290,624 10,373 3.6 Impairment provisions against loans and advances to banks and customers – (4,232) – – Investment securities 7,009 126,654 2,982 2.4 Property, plant and equipment and intangible assets 9,729 – – –Prepayments, accrued income and other assets 103,964 – – –
Total average assets 141,756 555,495 14,613 2.6
2014
Average non-interest
earning balance$million
Average interest earning balance$million
Interest income$million
Gross yield
%
Assets Cash and balances at central banks 13,085 58,999 246 0.4 Gross loans and advances to banks 4,235 86,388 1,206 1.4 Gross loans and advances to customers 318 303,132 12,267 4.0 Impairment provisions against loans and advances to banks and customers – (2,899) – – Investment securities 7,683 122,611 3,265 2.7 Property, plant and equipment and intangible assets 9,228 – – –Prepayments, accrued income and other assets 108,520 – – –
Total average assets 143,069 568,231 16,984 3.0
Supplementary financial information

329
Su
pp
leme
nta
ry in
form
ation
2015
Average non-interest
bearing balance$million
Average interest bearing balance$million
Interest expense$million
Rate paid
%
Liabilities Deposits by banks 6,516 51,803 396 0.8 Customer accounts:
Current accounts and savings deposits 44,663 160,569 971 0.6 Time and other deposits 5,325 182,148 2,501 1.4
Debt securities in issue 264 77,736 773 1.0 Accruals, deferred income and other liabilities 100,962 5 – – Subordinated liabilities and other borrowed funds 878 21,895 565 2.6 Non-controlling interests 113 – – –Shareholders’ funds 47,312 – – –
Total average liabilities and shareholders’ funds 206,033 494,156 5,206 1.1
Net yield 1.5
Net interest margin 1.7
2014
Average non-interest
bearing balance$million
Average interest bearing balance$million
Interest expense$million
Rate paid
%
Liabilities Deposits by banks 8,191 51,758 408 0.8 Customer accounts:
Current accounts and savings deposits 34,619 170,022 1,009 0.6 Time and other deposits 2,679 201,809 2,960 1.5
Debt securities in issue 3,082 75,517 866 1.1 Accruals, deferred income and other liabilities 95,638 75 – – Subordinated liabilities and other borrowed funds 33 23,817 738 3.1 Non-controlling interests 111 – – –Shareholders’ funds 46,339 – – –
Total average liabilities and shareholders’ funds 190,692 522,998 5,981 1.1
Net yield 1.8
Net interest margin 1.9

330 Standard Chartered Annual Report 2015
Supplementary financial information
Volume and price variancesThe following table analyses the estimated change in the Group’s net interest income attributable to changes in the average volume of interest-earning assets and interest-bearing liabilities, and changes in their respective interest rates for the periods presented. Volume and rate variances have been determined based on movements in average
balances and average exchange rates over the period and changes in interest rates on average interest-earning assets and average interest-bearing liabilities. Variances caused by changes in both volume and rate have been allocated to changes in volume.
2015 versus 2014
Increase/(decrease) in interest due to: Net increase/
(decrease)in interest
$million Volume$million
Rate$million
Interest-earning assets Cash and unrestricted balances at central banks 15 (23) (8)Loans and advances to banks (89) (97) (186)Loans and advances to customers (446) (1,448) (1,894)Investment securities 95 (378) (283)
Total interest-earning assets (425) (1,946) (2,371)
Interest-bearing liabilities Subordinated liabilities and other borrowed funds (50) (123) (173)Deposits by banks – (12) (12)Customer accounts:
Current accounts and savings deposits (57) 19 (38)Time and other deposits (270) (189) (459)
Debt securities in issue 22 (115) (93)
Total interest-bearing liabilities (355) (420) (775)
2014 versus 2013
Increase/(decrease) in interest due to: Net increase/
(decrease)in interest
$million Volume$million
Rate$million
Interest-earning assets Cash and unrestricted balances at central banks 99 (6) 93 Loans and advances to banks 202 (78) 124 Loans and advances to customers 1 (936) (935)Investment securities 236 (127) 109
Total interest-earning assets 538 (1,147) (609)
Interest-bearing liabilities Subordinated liabilities and other borrowed funds 142 (59) 83 Deposits by banks 55 (35) 20 Customer accounts:
Current accounts and savings deposits 57 (62) (5)Time and other deposits 58 (468) (410)
Debt securities in issue 107 (251) (144)
Total interest-bearing liabilities 419 (875) (456)

331
Su
pp
leme
nta
ry in
form
ation
Five-year summary
2015
$million2014
$million 2013
$million2012
$million2011
$million
Operating profit before impairment losses and taxation 4,116 7,289 8,584 8,061 7,720 Impairment losses on loans and advances and other credit risk provisions (4,976) (2,141) (1,617) (1,196) (908)Other impairment (855) (1,161) (1,129) (196) (111)(Loss)/profit before taxation (1,523) 4,235 6,064 6,851 6,775 (Loss)/profit attributable to shareholders (2,194) 2,613 4,090 4,887 4,849 Loans and advances to banks1 64,494 83,890 83,702 67,797 65,981 Loans and advances to customers1 257,356 284,695 290,708 279,638 266,790 Total assets 640,483 725,914 674,380 631,208 592,686 Deposits by banks1 37,611 54,391 43,517 36,427 35,296 Customer accounts1 350,633 405,353 381,066 372,874 345,726 Shareholders’ equity 46,204 46,432 46,246 45,362 40,714 Total capital resources2 70,364 69,685 67,238 64,643 58,092
Information per ordinary share Basic earnings per share3 (91.9)c 97.3c 156.5c 190.1c 191.1cNormalised earnings per share3,4 (6.6)c 138.9c 194.2c 214.3c 188.5cDividends per share3 13.71c 81.85c 81.85c 79.95c 72.34cNet asset value per share 1,366.0c 1,833.9c 1,872.8c 1,852.3c 1,653.2cNet tangible asset value per share 1,224.1c 1,610.9c 1,597.6c 1,526.5c 1,355.6cReturn on assets5 (0.3)% 0.4% 0.6% 0.8% 0.8%
Ratios Normalised return on ordinary shareholders’ equity4 (0.4)% 7.8% 11.2% 12.8% 12.2%Basic cost-income ratio 73.1% 60.2% 54.3% 57.1% 56.2%Cost-income ratio – normalised basis4 67.8% 58.9% 54.4% 53.7% 56.5%Capital ratios:
CET1/Tier 1 capital6 12.6% 10.5% 10.9% 13.4% 13.7%Total capital6 19.5% 16.7% 17.0% 17.4% 17.6%
1. Excludes amounts held at fair value through profit or loss2. Shareholders’ funds, non-controlling interests and subordinated loan capital3. Restated for the impact of the bonus element included within the 2015 rights issue4. Results on a normalised basis reflect the Group’s results, excluding amortisation and impairment of intangible assets, gains and losses of a capital nature, and gains and
losses on repurchase of subordinated liabilities5. Represents profit attributable to shareholders divided by the total assets of the Group6. Unaudited

332 Standard Chartered Annual Report 2015
Supplementary financial information
A. Convenience translation of selected financial statements into Indian RupeesIn compliance with clause 37(3) of the Indian Depository Receipts Listing agreement, the Consolidated financial statements on pages 235 to 239 are presented in Indian rupees (INR). Amounts have been translated, including totals and sub-totals, using the US dollar/Indian
rupee exchange rate of 66.3260 as at 31 December 2015 as published by Reserve Bank of India. Any discrepancies in any table between totals and sums of the amounts listed are due to rounding.
Consolidated income statement (translated to INR)For the year ended 31 December 2015
2015
`million2014
`million
Interest income 969,222 1,126,481 Interest expense (345,293) (396,696)
Net interest income 623,929 729,785 Fees and commission income 271,141 308,482 Fees and commission expense (31,903) (31,306)Net trading income 60,489 125,754 Other operating income 90,402 83,305 Non-interest income 390,130 486,236
Operating income 1,014,058 1,216,021 Staff costs (472,175) (450,221)Premises costs (55,117) (60,357)General administrative expenses (169,728) (179,611)Depreciation and amortisation (44,040) (42,382)Operating expenses (741,060) (732,571)
Operating profit before impairment losses and taxation 272,998 483,450 Impairment losses on loans and advances and other credit risk provisions (330,038) (142,004)Other impairment
Goodwill (32,367) (50,275)Other (24,342) (26,729)
Profit from associates and joint ventures 12,735 16,449
(Loss)/profit before taxation (101,014) 280,891 Taxation (44,637) (101,479)
(Loss)/profit for the year (145,652) 179,412
Profit attributable to: Non-controlling interests (133) 6,102 Parent company shareholders (145,519) 173,310
(Loss)/profit for the year (145,652) 179,412
Rupees Rupees
Earnings per share: Basic earnings per ordinary share (61.0) 64.5 Diluted earnings per ordinary share (61.0) 64.1 Dividends per ordinary share: Final dividend recommended/paid – 36.11 Interim dividend 9.09 18.18 Total dividend for the year 9.09 54.29
`million `million
Total dividend: Final dividend recommended/paid – 93,652 Interim dividend 24,275 47,091 Total dividend for the year 24,275 140,744

333
Su
pp
leme
nta
ry in
form
ation
Consolidated statement of comprehensive income (translated to INR)For the year ended 31 December 2015
2015
`million2014
`million
(Loss)/profit for the year (145,652) 179,412 Other comprehensive (loss)/income:Items that will not be reclassified to Income statement:
Actuarial losses on retirement benefit obligations (3,781) (4,046)Items that may be reclassified subsequently to Income statement:
Exchange differences on translation of foreign operations: Net losses taken to equity (132,851) (72,295) Net gains on net investment hedges 5,969 1,327 Share of other comprehensive income from associates and joint ventures – 1,128 Available-for-sale investments: Net valuation (losses)/gains taken to equity (3,781) 31,770 Reclassified to income statement (21,755) (28,056)Cash flow hedges: Net losses taken to equity (4,709) (7,694) Reclassified to income statement 7,097 862
Taxation relating to components of other comprehensive (loss)/income 1,658 (1,459)Other comprehensive loss for the year, net of taxation (152,152) (78,464)
Total comprehensive (loss)/income for the year (297,804) 100,948
Total comprehensive (loss)/income attributable to:Non-controlling interests (2,653) 4,179 Parent company shareholders (295,151) 96,770
(297,804) 100,948

334 Standard Chartered Annual Report 2015
Supplementary financial information
Consolidated balance sheet (translated to INR)As at 31 December 2015
2015
`million2014
`million
Assets Cash and balances at central banks 4,331,884 6,452,326 Financial assets held at fair value through profit or loss 1,552,095 2,163,753 Derivative financial instruments 4,188,023 4,366,506 Loans and advances to banks 4,277,629 5,564,088 Loans and advances to customers 17,069,394 18,882,681 Investment securities 7,612,036 6,913,690 Other assets 2,294,946 2,566,087 Current tax assets 25,734 24,010 Prepayments and accrued income 144,193 175,565 Interests in associates and joint ventures 128,473 130,132 Goodwill and intangible assets 307,885 344,232 Property, plant and equipment 478,144 529,547 Deferred tax assets 70,239 34,357
Total assets 42,480,675 48,146,972
Liabilities Deposits by banks 2,494,587 3,607,537 Customer accounts 23,256,084 26,885,443 Financial liabilities held at fair value through profit or loss 1,384,356 1,485,039 Derivative financial instruments 4,108,166 4,199,298 Debt securities in issue 3,971,601 4,772,222 Other liabilities 2,123,162 2,071,825 Current tax liabilities 51,005 59,096 Accruals and deferred income 361,543 392,318 Subordinated liabilities and other borrowed funds 1,449,356 1,521,983 Deferred tax liabilities 19,434 16,316 Provisions for liabilities and charges 14,260 8,556 Retirement benefit obligations 29,515 27,393
Total liabilities 39,263,069 45,047,027
Equity Share capital 108,708 81,979 Share premium 361,410 363,599 Other reserves 807,983 642,699 Retained earnings 1,786,424 1,991,372
Total parent company shareholders’ equity 3,064,527 3,079,649 Other equity instruments 131,790 –
Total equity excluding non-controlling interests 3,196,316 3,079,649 Non-controlling interests 21,291 20,296
Total equity 3,217,607 3,099,945
Total equity and liabilities 42,480,675 48,146,972

335
Su
pp
leme
nta
ry in
form
ation
Consolidated statement of changes in equity (translated to INR)For the year ended 31 December 2015
Share capital
and share premium account`million
Other equity
instru-ments
`million
Capital and
capital redemption
reserve1
`million
Merger reserve`million
Available- for-sale reserve`million
Cash flow
hedge reserve`million
Translation reserve`million
Retained earnings`million
Parent company
share-holders’
equity`million
Non-controlling
interests`million
Total`million
As at 1 January 2014 444,848 – 1,194 823,835 29,581 995 (139,683) 1,906,541 3,067,312 39,464 3,106,776 Profit for the year – – – – – – – 173,310 173,310 6,102 179,412 Other comprehensive income/(loss) – – – – 663 (4,775) (69,112) (3,316)2 (76,540) (1,923) (78,464)Distributions – – – – – – – – – (3,980) (3,980)Shares issued, net of expenses 730 – – – – – – – 730 – 730 Net own shares adjustment – – – – – – – (6,168) (6,168) – (6,168)Share option expense, net of taxation – – – – – – – 16,383 16,383 – 16,383 Dividends, net of scrip – – – – – – – (96,239) (96,239) – (96,239)Other increases/(decreases)3 – – – – – – – 862 862 (19,367) (18,505)
As at 31 December 2014 445,578 – 1,194 823,835 30,245 (3,781) (208,794) 1,991,3722 3,079,649 20,296 3,099,945 Loss for the year – – – – – – – (145,519) (145,519) (133) (145,652)Other comprehensive (loss)/income – – – – (21,490) 730 (124,560) (4,311)2 (149,631) (2,520) (152,152)Distributions – – – – – – – – – (1,724) (1,724)Shares issued, net of expenses 24,541 – – 310,605 – – – – 335,145 – 335,145 Other equity instruments issued, net of expenses – 131,790 – – – – – – – – – Net own shares adjustment – – – – – – – (3,847) (3,847) – (3,847)Share option expense, net of taxation – – – – – – – 9,816 9,816 – 9,816 Dividends, net of scrip – – – – – – – (61,086) (61,086) – (61,086)Other increases4 – – – – – – – – – 5,372 5,372
As at 31 December 2015 470,119 131,790 1,194 1,134,440 8,755 (3,051) (333,354) 1,786,424 3,196,316 21,291 3,217,607
1. Includes capital reserve of `332 million and capital redemption reserve of `862 million2. Comprises actuarial gains, net of taxation and non-controlling interests of `4,444 million (2014: `3,117 million) 3. Relate to the redemption of $300 million 7.267 per cent Hybrid Tier 1 securities issued by Standard Chartered Bank Korea Limited4. Additional investment from non-controlling interests in one of the Group’s subsidiary undertakings

336 Standard Chartered Annual Report 2015
Supplementary financial information
Cash flow statement (translated to INR)For the year ended 31 December 2015
Group Company
2015 `million
2014 `million
2015 `million
2014 `million
Cash flows from operating activities (Losses)/profit before taxation (101,014) 280,891 58,566 98,361 Adjustments for:
Non-cash items and other adjustments included within income statement 460,899 296,477 (16,316) (49,546)Change in operating assets 2,442,057 (905,814) 13,862 5,903 Change in operating liabilities (4,659,004) 3,934,525 (3,781) 17,576 Contributions to defined benefit schemes (7,230) (6,500) – – UK and overseas taxes paid (85,229) (113,285) (1,525) –
Net cash (used in)/from operating activities (1,949,520) 3,486,294 50,806 72,295
Cash flows from investing activities Purchase of property, plant and equipment (9,087) (12,536) – – Disposal of property, plant and equipment 7,230 4,444 – – Acquisition of investment in subsidiaries, net of cash acquired – (4,245) (232,141) (315,645)Disposal of subsidiaries 44,239 – – – Purchase of investment securities (13,896,557) (13,003,478) – (245,274)Disposal and maturity of investment securities 12,963,881 12,738,240 – 119,453 Dividends received from associates and joint ventures 796 862 64,535 99,091
Net cash used in investing activities (889,498) (276,712) (167,606) (342,375)
Cash flows from financing activities Issue of ordinary and preference share capital, net of expenses 335,145 730 335,145 730 Issue of Additional Tier 1 capital, net of expenses 131,790 – – – Purchase of own shares (4,510) (7,296) (4,510) (7,296)Exercise of share options 663 1,128 663 1,128 Interest paid on subordinated liabilities (71,765) (72,295) (40,194) (28,785)Gross proceeds from issue of subordinated liabilities – 310,671 – 310,671 Repayment of subordinated liabilities (332) (140,213) – – Investment/(repayment) to non-controlling interests 5,439 (19,765) – – Interest paid on senior debts (38,734) (49,081) (30,510) (40,127)Gross proceeds from issue of senior debts 357,364 436,359 281,753 334,814 Repayment of senior debts (460,767) (425,017) (301,651) (269,483)Dividends paid to non-controlling interests, Additional Tier 1 securities holders and preference shareholders (12,735) (10,678) (11,010) (6,699)Dividends paid to ordinary shareholders, net of scrip (50,076) (89,540) (50,076) (89,540)
Net cash from/(used in) financing activities 191,483 (64,999) 311,401 205,412
Net (decrease)/increase in cash and cash equivalents (2,647,535) 3,144,582 194,601 (64,668) Cash and cash equivalents at beginning of the year 8,613,758 5,581,731 1,166,210 1,230,878 Effect of exchange rate movements on cash and cash equivalents (101,147) (112,555) – –
Cash and cash equivalents at end of the year 5,865,076 8,613,758 1,360,811 1,166,210

337
Su
pp
leme
nta
ry in
form
ation
Company balance sheet (translated to INR)As at 31 December 2015
2015
`million2014
`million
Non-current assets Investments in subsidiary undertakings 1,882,398 1,650,257
Current assets Derivative financial instruments 42,382 57,372 Investment securities 816,407 816,407 Amounts owed by subsidiary undertakings 1,360,811 1,166,210
2,219,600 2,039,989
Current liabilities Derivative financial instruments 95,377 31,638 Other creditors 25,668 26,995 Taxation 1,525 3,316 Deferred income – 1,194
122,570 63,142
Net current assets 2,097,029 1,976,846
Total assets less current liabilities 3,979,427 3,627,104 Non-current liabilities Debt securities in issue 1,146,976 1,236,184 Subordinated liabilities and other borrowed funds 911,054 940,304
2,058,029 2,176,488
Total assets less liabilities 1,921,398 1,450,616
Equity Share capital 108,708 81,979 Share premium 361,410 363,599 Other reserves 1,135,634 825,029 Retained earnings 183,856 180,009
Total shareholders’ equity 1,789,608 1,450,616 Other equity instruments 131,790 –
Total equity 1,921,398 1,450,616

338 Standard Chartered Annual Report 2015
Supplementary financial information
Company statement of changes in equity (translated to INR)For the year ended 31 December 2015
Share capital
and share premium account`million
Other equity instruments
`million
Capital and capital
redemption reserve1 `million
Merger reserve`million
Retained earnings`million
Total`million
As at 1 January 2014 444,848 – 1,194 823,835 167,672 1,437,550 Profit for the year – – – – 98,295 98,295 Shares issued, net of expenses 730 – – – – 730 Net own shares adjustment – – – – (6,168) (6,168)Share option expense – – – – 16,449 16,449 Dividends, net of scrip – – – – (96,239) (96,239)
As at 31 December 2014 445,578 – 1,194 823,835 180,009 1,450,616 Profit for the year – – – – 58,566 58,566 Shares issued, net of expenses 24,541 – – 310,605 – 335,145 Other equity instruments issued, net of expenses – 131,790 – – – 131,790 Net own shares adjustment – – – – (3,847) (3,847)Share option expense – – – – 10,214 10,214 Dividends, net of scrip – – – – (61,086) (61,086)
As at 31 December 2015 470,119 131,790 1,194 1,134,440 183,856 1,921,398
1. Includes capital reserve of `332 million and capital redemption reserve of `862 million

339
Su
pp
leme
nta
ry in
form
ation
B. Summary of significant differences between Indian GAAP and IFRSThe consolidated financial statements of the Group for the year ended 31 December 2015 with comparatives as at 31 December 2014 are prepared in accordance with International Financial Reporting Standards (IFRS) and IFRS Interpretations Committee (IFRIC) interpretations as adopted by the European Union.
IFRS differs in certain significant respects from Indian Generally Accepted Accounting Principles (GAAP). Such differences involve methods for measuring the amounts shown in the financial statements of the Group, as well as additional disclosures required by Indian GAAP.
Set out below are descriptions of certain accounting differences between IFRS and Indian GAAP that could have a significant effect on profit attributable to parent company shareholders for the period ended 31 December 2015, and year ended 31 December 2014 and total parent company shareholders’ equity as at the same date. This section does not provide a comprehensive analysis of such differences. In particular, this description considers only those Indian GAAP pronouncements for which adoption or application is required in financial statements for years ended on or prior to 31 December 2015. The Group has not quantified the effect of differences between IFRS and Indian GAAP, nor prepared consolidated financial statements under Indian GAAP, nor undertaken a reconciliation of IFRS and Indian GAAP financial statements. Had the Group undertaken any such quantification or preparation or reconciliation, other potentially significant accounting and disclosure differences may have come to its attention which are not identified below. Accordingly, the Group does not provide any assurance that the differences identified below represent all the principal differences between IFRS and Indian GAAP relating to the Group. Furthermore, no attempt has been made to identify future differences between IFRS and Indian GAAP. Finally, no attempt has been made to identify all differences between IFRS and Indian GAAP that may affect the financial statements as a result of transaction or events that may occur in the future.
In making an investment decision, potential investors should consult their own professional advisors for an understanding of the differences between IFRS and Indian GAAP and how those differences may have affected the financial results of the Group. The summary does not purport to be complete and is subject and qualified in its entirety by reference to the pronouncements of the International Accounting Standards Board (IASB), together with the pronouncements of the Indian accounting profession.
Changes in accounting policyIFRS (IAS 8 Accounting Policies, Changes in Accounting Estimates and Errors)Changes in accounting policy are applied retrospectively. Comparatives are restated and the effect of period(s) not presented is adjusted against opening retained earnings of the earliest year presented. Policy changes made on the adoption of a new standard are made in accordance with that standard’s transitional provisions.
Indian GAAP (AS 5 Net Profit or Loss for the Period, Prior Period Items and Changes in Accounting Policies)The cumulative amount of the change is included in the income statement for the period in which the change is made except as specified in certain standards (transitional provision) where the change during the transition period resulting from adoption of the standard has to be adjusted against opening retained earnings and the impact disclosed.
Where a change in accounting policy has a material effect in the current period, the amount by which any item in the financial statements is affected by such change should also be disclosed to the extent ascertainable. Where such an amount is not ascertainable, this fact should be indicated.
Functional and presentation currencyIFRS (IAS 21 The Effects of Changes in Foreign Exchange Rates)An entity may present its financial statements in any currency (or currencies). If the presentation currency differs from the entity’s functional currency, it translates its results and financial position into the presentation currency.
Assets and liabilities are translated at the closing rate at the date of that statement of financial position. Income statement items are translated at the exchange rate at the date of transaction or at average rates. The functional currency is the currency of the primary economic environment in which an entity operates. The presentation currency of the Group is US dollars.
Indian GAAP (AS 11 The Effects of Changes in Foreign Exchange Rates)There is no concept of functional or presentation currency. Entities in India have to prepare their financial statements in Indian rupees.
A foreign currency transaction should be recorded, on initial recognition in the reporting currency, by applying to the foreign currency amount, the exchange rate between the reporting currency and the foreign currency at the date of the transaction.
At each balance sheet date:
a) foreign currency monetary items should be reported using the closing rate;
b) non-monetary items which are carried in terms of historical cost denominated in a foreign currency should be reported using the exchange rate at the date of the transaction; and
c) non-monetary items which are carried at fair value or other similar valuation denominated in a foreign currency should be reported using the exchange rates that existed when the values were determined.
ConsolidationIFRS (IFRS 10 Consolidated Financial Statements)Entities are consolidated when the Group controls an entity. The Group controls an entity when it is exposed to, or has rights to, variable returns from its involvement with the entity and has the ability to affect those returns through its power over the investee. This also includes entities where control is not derived through voting rights such as structured entities.
Indian GAAP (AS 21 Consolidated Financial Statements)Guidance is based on the power through the ability to govern the financial and operating policies of an entity so as to obtain benefits while not taking into consideration potential voting rights.
No specific guidance is given by Indian GAAP on consolidation of Structured Entities.
Business combinationsIFRS (IFRS 3 Business Combinations)All business combinations are treated as acquisitions. Assets, liabilities and contingent liabilities acquired are measured at their fair values. Pooling of interest method is prohibited.
For acquisitions occurring on or after 1 January 2004, IFRS 3 Business Combinations requires that, when assessing the value of the assets of an acquired entity, certain identifiable intangible assets must be recognised and if considered to have a finite life, amortised through the income statement over an appropriate period. As the Group has not applied IFRS 3, or its predecessor IAS 22, to transactions that occurred before 1 January 2004, no intangible assets, other than goodwill, were recognised on acquisitions prior to that date.

340 Standard Chartered Annual Report 2015
Supplementary financial information
B. Summary of significant differences between Indian GAAP and IFRS continuedAdjustments to provisional fair values are permitted provided those adjustments are made within 12 months from the date of acquisition, with a corresponding adjustment to goodwill. After re-assessment of respective fair values of net assets acquired, any excess of acquirer’s interest in the net fair values of acquirer’s identifiable assets is recognised immediately in the income statement. Where less than 100 per cent of an entity is acquired, non-controlling interests are stated at their proportion of the fair value of the identifiable net assets and contingent liabilities acquired.
Indian GAAP (AS 14 Accounting for Amalgamations)Treatment of a business combination depends on whether the acquired entity is held as a subsidiary, whether it is an amalgamation or whether it is an acquisition of a business. For an entity acquired and held as a subsidiary, the business combination is accounted for as an acquisition. The assets and liabilities acquired are incorporated at their existing carrying amounts.
For an amalgamation of an entity, either pooling of interests or acquisition accounting may be used. The assets and liabilities amalgamated are incorporated at their existing carrying amounts or, alternatively, if acquisition accounting is adopted, the consideration can be allocated to individual identifiable assets (which may include intangible assets) and liabilities on the basis of their fair values.
Adjustments to the value of acquired or amalgamated balances are not permitted after initial recognition. Any excess of acquirer’s interest in the net fair values of acquirer’s identifiable assets is recognised as capital reserve, which is neither amortised nor available for distribution to shareholders. However, in case of an amalgamation accounted under the purchase method, the fair value of intangible assets with no active market is reduced to the extent of capital reserve, if any, arising on the amalgamation. Minority interests arising on the acquisition of a subsidiary are recognised at their share of the historical book value.
GoodwillIFRS (IFRS 3 Business Combinations and IAS 38 Intangible Assets)IFRS 3 requires that goodwill arising on all acquisitions by the Group and associated undertakings is capitalised but not amortised and is subject to an annual review for impairment. Under the transitional provisions of IFRS 1, the Group has not applied IFRS 3, or its predecessor IAS 22, to transactions that occurred before 1 January 2004, the date of transition to IFRS. Accordingly, goodwill previously written off to reserves, as permitted under UK GAAP until the implementation of FRS 10 Goodwill and intangible assets in 1998, has not been reinstated nor will it be written back on disposal. Amortisation of goodwill that has been charged up to 31 December 2003 has not been reversed and the deemed carrying value of the goodwill on transition to IFRS is equal to the net book value as at 31 December 2003. Goodwill is tested annually for impairment. Any impairment losses recognised may not be reversed in subsequent accounting periods.
Indian GAAP (AS 14 Accounting for Amalgamations and AS 26 Intangible Assets)Goodwill arising for amalgamations is capitalised and amortised over useful life not exceeding five years, unless a longer period can be justified. For goodwill arising on acquisition of a subsidiary or a business, there is no specific guidance. In practice, there is either no amortisation or amortisation not exceeding 10 years. Goodwill is reviewed for impairment whenever an indicator of impairment exists. Impairment losses recognised may be reversed under exceptional circumstances only in subsequent accounting periods through the income statement.
Acquired and internally generated intangible assetsIFRS (IAS 38 Intangible Assets)Intangible assets are recognised if the specific criteria are met. Assets with a finite useful life are amortised on a systematic basis over their useful life. An asset with an indefinite useful life and which is not yet available for use should be tested for impairment annually.
Indian GAAP (AS 26 Intangible Assets)Intangible assets are capitalised if specific criteria are met and are amortised over their useful life, generally not exceeding 10 years. The recoverable amount of an intangible asset that is not available for use or is being amortised over a period exceeding 10 years should be reviewed at least at each financial year end even if there is no indication that the asset is impaired.
Property, plant and equipmentIFRS (IAS 16 Property, Plant and Equipment, IAS 23 Borrowing Costs)Fixed assets are recorded at cost or revalued amounts. Under the transition rules of IFRS 1, the Group elected to freeze the value of all its properties held for its own use at their 1 January 2004 valuations, their deemed cost under IFRS. They will not be revalued in the future.
Foreign exchange gains or losses relating to the procurement of property, plant and equipment, under very restrictive conditions, can be capitalised as part of the asset. Depreciation is recorded over the asset’s estimated useful life. The residual value and the useful life of an asset and the depreciation method shall be reviewed at least at each financial year end. The Group has the option to capitalise borrowing costs incurred during the period that the asset is getting ready for its intended use.
Indian GAAP (AS 10 Fixed Assets, AS 16 Borrowing Cost and AS 6 Depreciation Accounting)Fixed assets are recorded at historical costs or revalued amounts. Relevant borrowing costs are capitalised if certain criteria in AS 16 are met. Depreciation is recorded over the asset’s useful life. Schedule II (Part C) of the Companies Act 2013 and Banking Regulations prescribe minimum rates of depreciation and these are typically used as the basis for determining useful life.
Recognition and measurement of financial instruments IFRS (IAS 39 Financial Instruments: Recognition and Measurement)IAS 39 requires all financial instruments to be initially measured at their fair value, which is usually to be the transaction price. In those cases where the initial fair value is based on a valuation model that uses inputs which are not observable in the market, the difference between the transaction price and the valuation model is not recognised immediately in the income statement, but is amortised to the income statement until the inputs become observable, the transaction matures or is terminated.
At the time of initial recognition, IAS 39 requires all financial assets to be classified as either:
• Held at fair value through profit or loss (as a trading instrument or as designated by management), with realised and unrealised gains or losses reflected in profit or loss
• Available-for-sale at fair value, with unrealised gains and losses reflected in shareholders’ equity and recycled to the income statement when the asset is sold or is impaired
• Held-to-maturity at amortised cost, where there is the intent and the ability to hold them to maturity
• As loans and receivables at amortised cost
At the time of initial recognition, IAS 39 requires all financial liabilities to be classified as either:
• Held at fair value through profit or loss (as a trading instrument or as designated by management), with realised and unrealised gains or losses reflected in profit or loss
• At amortised cost
A financial asset or financial liability, other than one held for trading, can be designated as being held at fair value through profit or loss if it meets the criteria set out below:
• The designation eliminates or significantly reduces a measurement or recognition inconsistency that would otherwise arise from measuring assets or liabilities on a different basis

341
Su
pp
leme
nta
ry in
form
ation
B. Summary of significant differences between Indian GAAP and IFRS continued• A group of financial assets and/or liabilities is managed and its
performance evaluated on a fair value basis, or
• Assets or liabilities include embedded derivatives and such derivatives are not recognised separately
The designation of a financial instrument as held at fair value through profit or loss is irrevocable in respect of the financial instruments to which it relates. Subsequent to initial recognition instruments cannot be classified into or out of this category. Changes in the fair value of available-for-sale financial assets resulting from movements in foreign currency exchange rates are included in the income statement as exchange differences. Foreign currency exchange movements for available-for-sale equity securities is recognised in reserves.
Indian GAAP (AS 13 Investments)AS 13 requires investments to be categorised as follows:
• Current investments, which are those readily realisable and intended to be held for less than one year, are carried at the lower of cost and fair value, with changes in fair value taken directly to profit or loss
• Long-term investments, which are those investments not classified as current, are carried at cost unless there is a permanent diminution in value, in which case a provision for diminution is required to be made by the entity
For investments, Reserve Bank of India (RBI) outlines similar classifications to IFRS, but the classification criteria and measurement requirements differ from those set out in IFRS. Financial liabilities are usually carried at cost. There is no ability to designate instruments at fair value. AS 30 Financial Instruments: Recognition and Measurement provides guidance on classification criteria and measurement requirements, however, this is not mandatory.
DerivativesIFRS (IAS 39 Financial Instruments: Recognition and Measurement)IAS 39 requires that all derivatives be recognised on balance sheet at fair value. Changes in the fair value of derivatives that are not hedges are reported in the income statement. Changes in the fair value of derivatives that are designated as hedges are either offset against the change in fair value of the hedged asset or liability through earnings or recognised directly in equity until the hedged item is recognised in earnings, depending on the nature of the hedge. The ineffective portion of the hedge’s change in fair value is immediately recognised in earnings. A derivative may only be classified as a hedge if an entity meets stringent qualifying criteria in respect of documentation and hedge effectiveness.
IAS 39 requires the separation of derivatives embedded in a financial instrument if it is not deemed to be closely related to the economic characteristics of the underlying host instrument.
Indian GAAPForeign exchange contracts held for trading or speculative purposes are carried at fair value, with gains and losses recognised in the income statement. In the absence of specific guidance, equity options are carried at the lower of cost or market value.
There is no specific guidance on hedge accounting since AS 30 is not mandatory. However, requirements of AS 30 with respect to hedge accounting are largely similar to that of IAS 39. For banks, there are guidelines prescribed by RBI on measurement and accounting of IRS and FRA entered onto for hedging purposes.
Impairment of financial assetsIFRS (IAS 39 Financial Instruments: Recognition and Measurement)At each balance sheet date, an assessment is made as to whether there is any objective evidence of impairment. A financial asset is impaired and impairment losses are incurred if, and only if, there is objective evidence of impairment.
Assets held at amortised cost If objective evidence of impairment exists, an assessment is made to determine what, if any, impairment loss should be recognised. The impairment loss is the difference between the asset’s carrying amount and its estimated recoverable amount.
The recoverable amount is determined based on the present value of expected future cash flows, discounted at the instrument’s original effective interest rate, either individually or collectively. Individually assessed assets for which there is no objective evidence of impairment are collectively assessed for impairment.
Available-for-sale assetsIf objective evidence of impairment exists, the cumulative loss (measured as the difference between the acquisition cost and the current fair value, less any previously recognised impairment) is removed from equity and recognised in the income statement.
Market recoveries leading to a reversal of an impairment provision for available-for-sale debt securities are recognised in the income statement. Impairment losses for equity instruments classified as available-for-sale are not permitted to be reversed through profit or loss.
Indian GAAP (AS 13 Investments)Long-term investments are written down when there is a decline in fair value, which is deemed to be other than temporary. Impairments may be reversed through the income statement in subsequent periods if the investment rises in value or the reasons for the impairment no longer exist.
In accordance with RBI regulations, in respect of available-for-sale investments, impairments are required to be reversed through Investment Reserve Account (equity reserve) if the investment rises in value or the reasons for the impairment no longer exist.
For loans and advances, the RBI regulations additionally require banks to hold provisions in respect of standard assets and for specific country risk exposures.
Derecognition of financial assetsIFRS (IAS 39 Financial Instruments: Recognition and Measurement)A financial asset is derecognised if substantially all the risks and rewards of ownership have been transferred. If substantially all the risks and rewards have not been transferred, the asset will continue to be recognised to the extent of any continuing involvement.
Indian GAAP (RBI Guidelines on Securitisation of Standard Assets)There is limited guidance on derecognition of financial assets. Securitised financial assets can only be derecognised if the originator has surrendered control over the assets. Control is not surrendered where the securitised assets are not beyond the reach of the creditors of the originator or where the transferee does not have the right to pledge, sell, transfer or exchange the securitised asset for its own benefit, or where there is an option that entitles the originator to repurchase the financial assets transferred under a securitisation transaction from the transferee.
Liabilities and equityIFRS (IAS 39 Financial Instruments: Recognition and Measurement)A financial instrument is classified as a liability where there is a contractual obligation to deliver either cash or another financial asset to the holder of that instrument, regardless of the manner in which the contractual obligation will be settled. Preference shares, which carry a mandatory coupon or are redeemable on a specific date or at the option of the shareholder are classified as financial liabilities and are presented in other borrowed funds. The dividends on these preference shares are recognised in the income statement as interest expense on an amortised cost basis using the effective interest method.

342 Standard Chartered Annual Report 2015
Supplementary financial information
B. Summary of significant differences between Indian GAAP and IFRS continuedIndian GAAPClassification is based on the legal form rather than substance.
Provisions for liabilities and chargesIFRS (IAS 37 Provisions, Contingents Liabilities and Contingent Assets)The amount recognised as a provision is the best estimate at the balance sheet date of the expenditure required to settle the obligation, discounted using a pre-tax market discount rate if the effect is material.
Indian GAAP (AS 29 Provisions, Contingents Liabilities and Contingent Assets)Provisions are recognised and measured on a similar basis to IFRS, except that there is no requirement for discounting the provision or liability.
Pension obligationsIFRS (IAS 19 Employee Benefits)The discount rate to be used for determining defined benefit obligations is established by reference to market yields at the balance sheet date on high-quality corporate bonds of a currency and term consistent with the currency and term of the post-employment benefit obligations. Actuarial gains or losses are recognised in Other Comprehensive Income (retained earnings).
Under the transitional provisions of IFRS 1, First time adoption of International Financial Reporting Standards (IFRS 1), and in accordance with IAS 19, the Group elected to record all actuarial gains and losses on the pension surplus or deficit in the year in which they occur within the Consolidated statement of comprehensive income.
Indian GAAP (AS 15 Employee Benefits)The discount rate to be used for determining defined benefit obligations is established by reference to market yields at the balance sheet date on government bonds. The expected return on plan assets is based on market expectation for the returns over the entire life of the related obligation. Actuarial gains or losses are recognised immediately in the statement of income.
Share-based compensationIFRS (IFRS 2 Share-based payments)IFRS 2 requires that all share-based payments are accounted for using a fair value method. The fair value of the employee services received in exchange for the grant of the options is recognised as an expense. For equity-settled awards, the total amount to be expensed over the vesting period must be determined by reference to the fair value of the options granted (determined using an option pricing model), excluding the impact of any non-market vesting conditions (for example, profitability and growth targets). Non-market vesting conditions must be included in assumptions about the number of options that are expected to become exercisable. At each balance sheet date, the Group revises its estimates of the number of options that are expected to become exercisable. It recognises the impact of the revision of original estimates, if any, in the income statement, and a corresponding adjustment to equity over the remaining vesting period. The proceeds received net of any directly attributable transaction costs are credited to share capital (nominal value) and share premium when the options are exercised.
Cash-settled awards must be revalued at each balance sheet date on an intrinsic value basis (being the difference between the market price of the share at the measurement date and the exercise price) with any changes in fair value charged or credited to staff costs in the income statement.
Deferred tax is recognised based on the intrinsic value of the award and is recorded in the income statement if the tax deduction is less than or equal to the cumulative share-based compensation expense or equity if the tax deduction exceeds the cumulative expense.
Indian GAAPEntities may either follow the intrinsic value method or the fair value method for determining the costs of benefits arising from share-based compensation plans. Although the fair value approach is recommended, entities may use the intrinsic value method and provide fair value disclosures.
Deferred tax is not recognised as it is not considered to represent a timing difference.
Entities are also permitted the option of recognising the related compensation cost over the service period for the entire award (that is, over the service period of the last separately vesting portion of the award), provided that the amount of compensation cost recognised at any date at least equals the fair value of the vested portion of the award at that date.
Deferred taxation IFRS (IAS 12 Income Taxes)Deferred tax is determined based on temporary differences, being the difference between the carrying amount and tax base of assets and liabilities, subject to certain exceptions.
Deferred tax assets are recognised if it is probable (more likely than not) that sufficient future taxable profits will be available to utilise to deferred tax assets.
Indian GAAP (AS 22 Accounting for Taxes on Income)Deferred tax is determined based on timing differences, being the difference between accounting income and taxable income for a period that is capable of reversal in one or more subsequent periods.
Deferred tax assets are recognised where it is probable that future taxable profit will be available against which the temporary differences can be utilised.
Interest income and expenseIFRS (IAS 18 Revenue)Interest income and expense is recognised in the income statement using the effective interest method. The effective interest rate is the rate that discounts estimated future cash payments or receipts through the expected life of the financial instrument. When calculating the effective interest rate, the Group estimates cash flows considering all contractual terms of the financial instrument but does not consider future credit losses. The calculation includes all fees and points paid or received between parties to the contract that are an integral part of the effective interest rate, transaction costs and all other premiums or discounts.
Indian GAAP (AS 9 Revenue Recognition)In the absence of a specific effective interest rate requirement, premiums and discounts are usually amortised on a straight-line basis over the term of the instrument.
DividendsIFRS (IAS 10 Events After The Reporting Date)Dividends to holders of equity instruments, when proposed or declared after the balance sheet date, should not be recognised as a liability on the balance sheet date. A company, however, is required to disclose the amount of dividends that were proposed or declared after the balance sheet date but before the financial statements were authorised for issue.
Indian GAAPDividends are reflected in the financial statements of the year to which they relate, even if proposed or approved after the year end.

343
Su
pp
leme
nta
ry in
form
ation
Supplementary people information
Countries2015 2014 2013
Global 67 71 71
Workforce profileHeadcount
2015 2014 2013
Global total 84,076 90,940 86,640
of which businesses 42,036 49,638 46,892
of which support services 42,040 41,302 39,748
(Decline)/growth (6,864) 4,300 (2,418)
(Decline)/growth percentage (8.0)% 5.0% (2.7)%
Location of employees (by region)2015
%2014
%2013
%
Greater China 20 21 22
North East Asia 5 6 7
South Asia 27 25 24
ASEAN 25 25 25
MENAP 9 9 9
Africa 10 10 9
Americas 1 1 1
Europe 3 3 3
Employee attrition2015
%2014
%2013
%
Employee turnover rate 21.7 18.5 19.5
Employee voluntary turnover rate 16.7 15.1 15.9
Years of service2015
%2014
%2013
%
0-5 years 59 61 58
5-10 years 23 22 25
> 10 years 18 17 17
Age of employees2015
%2014
%2013
%
< 30 years 29 32 33
30-50 years 65 62 61
> 50 years 6 6 6
Gender2015
%2014
%2013
%
Female representation 47 47 47
Female senior management1 12 15 16
Female executive and non-executive director2 23 11 14
Gender per region (female)2015
%2014
%2013
%
Greater China 64 63 63
North East Asia 57 50 50
South Asia 30 30 30
ASEAN 54 54 54
MENAP 30 30 30
Africa 50 50 50
Americas 44 43 42
Europe 44 44 44
1. Director, bands 1 and 22. As at 31 December 2015, the Board comprised 23 per cent women. As at 23 February 2016, the Board comprised 20 per cent women
344 Standard Chartered Annual Report 2015
Nationalities (aggregate number)2015 2014 2013
Global 135 133 132
Senior management1 32 29 27
Nationalities (percentage of total workforce)2015
%2014
%2013
%
Greater China 20 20 21
North East Asia 5 6 7
South Asia 31 28 27
ASEAN 21 21 21
MENAP 6 7 7
Africa 10 10 9
Americas 2 2 2
Europe 3 4 4
Other 2 3 4
Talent management, learning and developmentLearning
2015 2014 2013
Employees receiving training (%) 93 94 97
High potential employee receiving training (%) 91 97 100
Average number of training days per employee 3.3 3.2 3.4
Average spend on training per employee ($) 781 764 800
Talent deployment2015 2014 2013
Graduate recruitment programmes 223 375 382
Internal cross-border moves initiated in year 264 204 235
Performance and rewardPerformance management
2015%
2014%
2013%
Employees appraised 99 98 99
Employees reviewed against agreed objectives and values 99 100 99
Reward2015 2014 2013
Total staff costs ($million) 7,119 6,788 6,570
Discretionary annual incentives pool ($million) 855 1,098 1,208
Absenteeism2015
%2014
%2013
%
Sick leave absence/days lost 0.8 0.8 0.9
Employees that have taken sick leave 43 37 42
1. Director, bands 1 and 2
Supplementary people information
345
Su
pp
leme
nta
ry in
form
ation
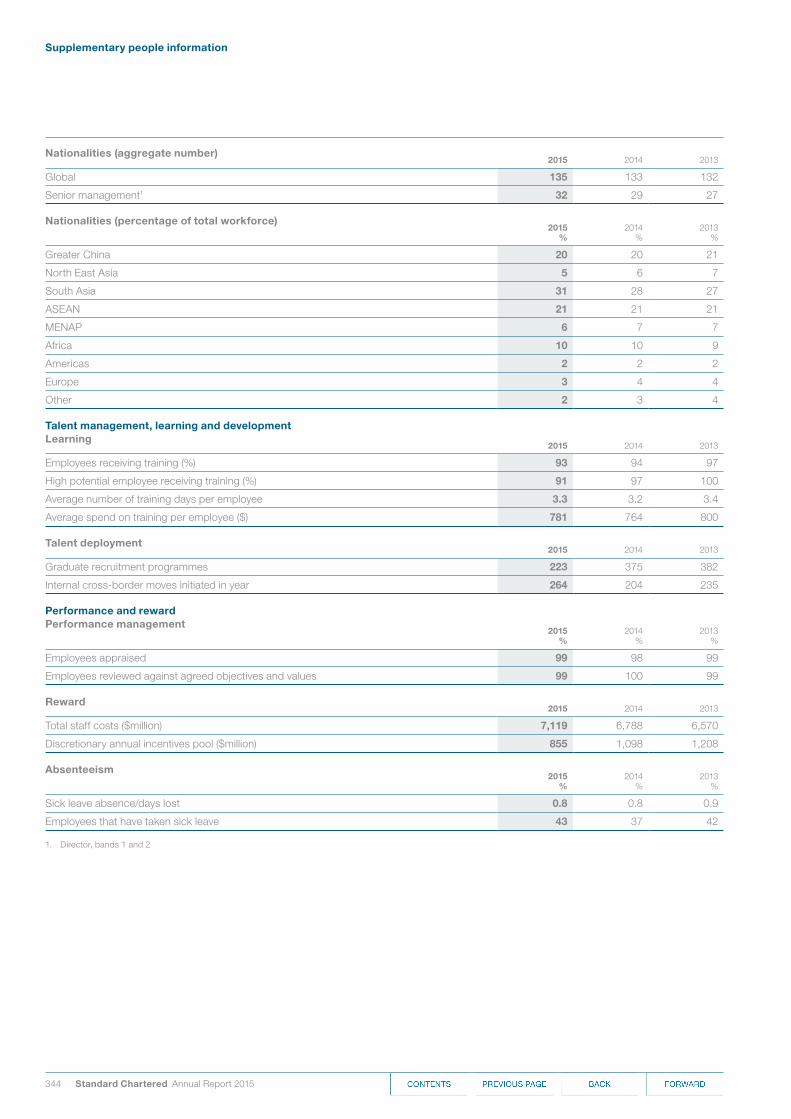
Supplementary sustainability information
Contributing to sustainable economic growthAccess to financial servicesMicrofinance
2015 2014 2013
Loans extended ($million) 271.6 318.1 271.0
Individuals impacted (million)1 1.8 2.1 1.8
1. Based on an assumption of average loan size of $150 in local currency
Clean technology2015 2014 2013
Value of funds provided and facilitated ($million) 883.3 798.6 945.7
Environmental and social risk managementEmployees trained in environmental and social risk management1
2015 2014 2013
Employees trained2 1,708 2,477 1,374
1. Data in this table has been restated from 20132. Employees targeted for training are those in client-facing roles and relevant support teams
Equator principlesProject finance mandates
Cat A1 Cat B2 Cat C3
Total 2012 3 17 –
Total 2013 9 29 3
Total 2014 3 11 –
Total 2015 4 9 –
2015Sector
Mining – – –
Infrastructure – 2 –
Oil and Gas 1 3 –
Renewables – 1 –
Telecoms – – –
Power 3 3 –
Other – – –
Region
Greater China – – –
North East Asia – – –
South Asia – 1 –
ASEAN 1 1 –
MENAP 1 3 –
Africa 1 2 –
Americas 1 2 –
Europe – – –
Designation4 –
Designated – 3 –
Non-designated 4 6 –
Independent review
Yes 4 8 –
No – 1 –
1. ‘Cat A’ or Category A are projects with potential significant adverse environmental and social risks and/or impacts that are diverse, irreversible or unprecedented 2. ‘Cat B’ or Category B are projects with potential limited adverse environmental and social risks and/or impacts that are few in number, generally site-specific, largely reversible
and readily addressed through mitigation measures3. ‘Cat C’ or Category C are projects with minimal or no adverse environmental and social risks and/or impacts4. ‘Designation’ is split into designated and non-designated countries. Designated countries are deemed by the Equator Principles to have robust environmental and social
governance, legislation systems and institutional capacity designed to protect their people and the natural environment. Non-designated countries are countries that are not found on the list of designated countries. The list of countries can be found at www.equator-principles.com
346 Standard Chartered Annual Report 2015
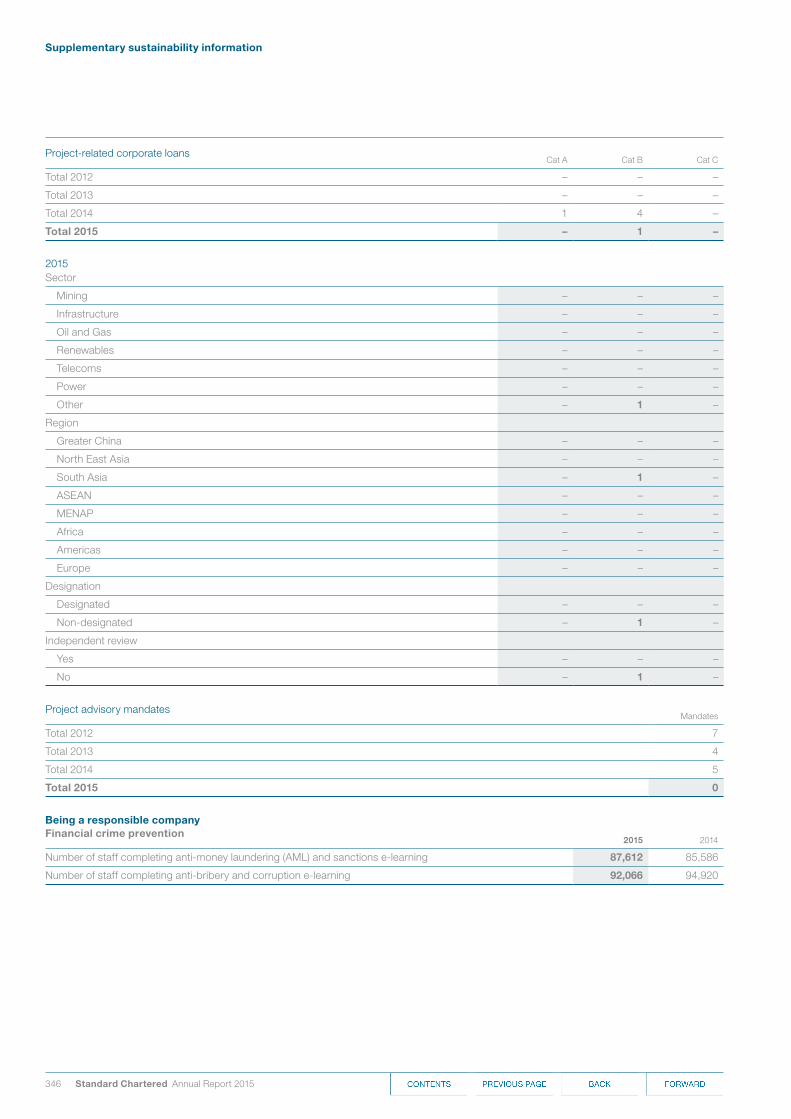
Project-related corporate loans Cat A Cat B Cat C
Total 2012 – – –
Total 2013 – – –
Total 2014 1 4 –
Total 2015 – 1 –
2015Sector
Mining – – –
Infrastructure – – –
Oil and Gas – – –
Renewables – – –
Telecoms – – –
Power – – –
Other – 1 –
Region
Greater China – – –
North East Asia – – –
South Asia – 1 –
ASEAN – – –
MENAP – – –
Africa – – –
Americas – – –
Europe – – –
Designation
Designated – – –
Non-designated – 1 –
Independent review
Yes – – –
No – 1 –
Project advisory mandates Mandates
Total 2012 7
Total 2013 4
Total 2014 5
Total 2015 0
Being a responsible companyFinancial crime prevention
2015 2014
Number of staff completing anti-money laundering (AML) and sanctions e-learning 87,612 85,586
Number of staff completing anti-bribery and corruption e-learning 92,066 94,920
Supplementary sustainability information

347
Su
pp
leme
nta
ry in
form
ation
Environment 2015 2014 2013
Measured Scaled-up Measured Scaled-up Measured Scaled-up
Offices reporting 190 – 201 – 201 –
Net internal area of occupied property (m2) 846,480 1,261,320 891,338 1,308,959 879,815 1,354,541
Green lease clause inclusion1 (%) 67 – – – – –
Occupied net internal area where data is collected (%) 73 – 75 – 72 –
Full-time employees (FTE) 58,528 84,076 78,216 90,940 73,851 86,640
Annual operating income ($m) from 1 October to 30 September ($m) – 17,566 – 18,105 – 19,298
Greenhouse gas emissions – Absolute (tonnes CO2eq/year)
Scope 1 emissions (combustion of fuels) 8,865 16,904 11,307 20,144 13,687 23,878
Scope 2 emissions (purchased electricity) 132,030 184,912 140,825 192,403 161,877 226,727
Scope 1 & 2 emissions 140,895 201,816 152,132 212,547 175,564 250,605
Scope 3 emissions without distance uplift (air travel) 54,519 54,519 54,216 55,296 50,220 55,127
Scope 3 emissions with distance uplift (air travel) 59,426 59,426 59,095 60,273 54,739 60,087
Scope 1, 2 & 3 emissions 195,414 256,335 206,348 267,843 225,784 305,732
Scope 3 emissions (Global Data Centre)2 – 19,339 – – – –
Greenhouse gas emissions – Intensity
Scope 1 & 2 emissions/m2 (kg CO2eq/m2/year) 166 160 171 162 200 185
Scope 1 & 2 emissions/FTE (tonnes CO2eq/FTE/year) 2.41 2.40 1.95 2.34 2.38 2.89
Scope 3 emissions/FTE without distance uplift (tonnes CO2eq/FTE/year) 0.64 0.65 0.54 0.54 0.63 0.63
Scope 3 emissions/FTE with distance uplift (tonnes CO2eq/FTE/year) 0.69 0.71 0.58 0.58 0.69 0.69
Scope 1, 2 & 3 emissions/m2 (kg CO2eq/m2/year) 231 203 232 205 257 226
Scope 1, 2 & 3 emissions/FTE (tonnes CO2eq/FTE/year) 3.34 3.05 2.64 2.95 3.06 3.53
Scope 1 & 2 emissions/$m operating income (tonnes CO2eq/$m/year) – 11.49 – 11.74 – 12.99
Scope 1, 2 & 3 emissions/$m operating income (tonnes CO2eq/$m/year) – 14.59 – 14.79 – 15.84
Environmental resource efficiency
Energy
Indirect non-renewable energy consumption3 (GWh/year) 201 284 215 298 226 328
Indirect renewable energy consumption4 (GWh/year) 14 13 8 8 13 13
Direct non-renewable energy consumption5 (GWh/year) 36 68 46 86 51 90
Direct renewable energy consumption6 (GWh/year) – – – – – –
On-site renewable energy consumption7 (MWh/year) 276 276 115 115 115 115
Energy consumption8 (GWh/year) 252 365 287 405 291 431
Energy consumption/FTE (kWh/FTE/year) 4,306 4,341 3,669 4,453 3,940 4,975
Energy consumption/m2 (kWh/m2/year) 298 289 322 309 334 320
Water
Water consumption (ML/year) 793 1,037 814 1,191 838 1,902
Water consumption/FTE (m3/FTE/year) 14 12 10 13 11 22
Water consumption/m2 (kL/m2/year) 0.94 0.82 1.03 0.91 1.06 1.40
Paper
Print paper consumption (ktonnes/year) 1.04 1.50 1.51 1.75 1.51 1.77
Print paper consumption/FTE (kg/FTE/year) 17.70 17.70 19.25 19.25 20.43 20.43
Waste
Waste (ktonnes/year) 5.2 6.6 5.9 7.2 5.5 8.1
Waste/FTE (kg/FTE/year) 89 79 75 79 74 93
Waste reused or recycled (%) 27 27 28 28 30 30
Retired IT equipment reused or recycled (ktonnes/year) 0.19 0.19 0.16 0.28 0.11 0.15
1. Percentage of green lease clause inclusion in all new and renewed leases within the reporting year, please refer to the eco efficiency criteria for more information2. Scope 3 emissions calculated from total energy consumption from our outsourced global data centres3. Indirect non-renewable energy refers to purchased electricity from non-renewable sources4. Indirect renewable energy refers to purchased electricity from off-site renewable sources5. Direct non-renewable energy refers to the gross calorific values of fuels consumed on-site6. Direct renewable energy refers to the gross calorific values of renewable fuels consumed on-site7. On-site renewable energy refers to renewable energy generated and consumed on-site8. The 2014 measured energy total of 287 GWh includes an estimated 18 GWh of energy for locations where invoices were not available at the reporting date

348 Standard Chartered Annual Report 2015
Supplementary sustainability information
Additional notes on environment dataThe emissions within our inventory correspond to a reporting period of 1 October 2014 to 30 September 2015. This is to allow sufficient time for independent assurance to be gained prior to the publication of results. Accordingly, the operating income used in this inventory corresponds to the same period rather than the calendar year used in financial reporting. This is consistent with international carbon reporting practice.
‘Measured’ data is collected from Global Environment Management System (GEMS) properties, defined as all properties that are over 10,000 square feet for energy and water. For paper and business travel, it is defined per full-time employee.
‘Scaled-up’ data is an extrapolation made from measured data to account for 100 per cent of the Group’s occupied property footprint for energy and water. For paper and business travel, it is defined per full-time employee (as at the end of the reporting period).
Carbon abatement benefit from indirect renewable energy is not taken into account.
Total energy use is normalised to reflect periods of vacancy in certain sites during the reporting period.
Net internal areas used for water use intensity do not include sites that have reported zero water consumption in demised areas.
Warehouses, empty land, car parks, unoccupied sites for business continuity purposes, residential properties, space occupied by automated teller machines, vaults and space sub-let to tenants are excluded from this extrapolation.
Scope 3 emissions are drawn from reliable data collected from 36 countries, based on seating class and distance flown.
As we operate largely outside of the UK, all flights domestic or international with flight distance of less than 463km, labelled by the Department for Environment, Food and Rural Affairs (DEFRA) as ‘domestic flights’, have been classified as ‘short haul’. All flights with distance flown ranging from 463 to 1,108km, labelled by DEFRA as ‘short haul’ have been classified as ‘medium haul’.
PwC is our independent third-party assurance provider for Greenhouse Gas (GHG) emissions. In 2015, our measured Scope 1 and Scope 2 emissions were assured by PwC, ensuring the accuracy and credibility of our reporting. For additional information, review the Independent Assurance Report on www.sc.com/EnvironmentalAssurance
Investing in communitiesCommunity expenditure
2015$million
2014$million
2013$million
Cash contributions 24.5 25.2 15.4
Employee time (non-cash item) 20.0 23.6 24.2
Gifts in Kind (non-cash item)1 0.1 0.1 0.2
Management costs 5.5 5.8 6.0
Total (direct investment by the Group) 50.1 54.7 45.7
Leverage2 10.2 9.5 8.4
Total (incl. leverage)3 60.3 64.2 54.1
Percentage of prior year operating profit (PYOP) 1.42 1.06 0.79
1. Gifts in Kind comprises all non-monetary donations2. Leverage data relates to the proceeds from staff and other fundraising activity 3. Total figures subject to rounding

349
Su
pp
leme
nta
ry in
form
ation
Shareholder information
Dividend and interest payment datesOrdinary shares
On 3 November 2015, the Board announced, as part of the 2015 strategic review, it had taken the decision to pay no final dividend for the year ended 31 December 2015.
Preference shares 1st half yearly dividend 2nd half yearly dividend
73∕8 per cent Non-cumulative irredeemable preference shares of £1 each 1 April 2016 1 October 201681∕4 per cent Non-cumulative irredeemable preference shares of £1 each 1 April 2016 1 October 2016
6.409 per cent Non-cumulative redeemable preference shares of $5 each 30 January 2016 30 July 20167.014 per cent Non-cumulative redeemable preference shares of $5 each 30 January 2016 30 July 2016
Annual general meetingThe annual general meeting (AGM) details are as follows:
Date and time LocationWednesday 4 May 2016 etc venues 11.00am London time 200 Aldersgate (6.00pm Hong Kong time) St Paul’s London EC1A 4HD
Details of the business to be transacted at the AGM are included in the Notice of AGM.
Details of voting at the Company’s AGM and of proxy votes cast can be found on the Company’s website at investors.sc.com
Interim resultsThe interim results will be announced to the London Stock Exchange, The Hong Kong Stock Exchange, the Bombay Stock Exchange and the National Stock Exchange of India and put on the Company’s website.
Country-by-country reportingIn accordance with the requirements of the Capital Requirements (country-by-country reporting) Regulations 2013, the Group will publish additional country-by-country information in respect of the year ended 31 December 2015, on or before 31 December 2016. We have also published our approach to tax and tax policy.
This information will be available on the Group’s website at sc.com
ShareCareShareCare is available to shareholders on the Company’s UK register who have a UK address and bank account, and allows you to hold your Standard Chartered shares in a nominee account. Your shares will be held in electronic form so you will no longer have to worry about keeping your share certificates safe. If you join ShareCare you will still be invited to attend the Company’s AGM and receive your dividend at the same time as everyone else. ShareCare is free to join and there are no annual fees to pay.
If you would like to receive more information, please visit our website at investors.sc.com/en/resource.cfm or contact the shareholder helpline on 0370 702 0138.
Previous dividend payments (unadjusted for the impact of the 2015/2010/2008 Rights Issues)
Dividend and financial year Payment date Dividend per ordinary share
Cost of one new ordinary share under share dividend scheme
Interim 2005 14 October 2005 18.94c/10.7437p/HK$1.46911 £11.878/$21.3578
Final 2005 12 May 2006 45.06c/24.9055p/HK$3.49343 £14.2760/$24.77885
Interim 2006 11 October 2006 20.83c/11.14409p/HK$1.622699 £13.2360/$25.03589
Final 2006 11 May 2007 50.21c/25.17397p/HK$3.926106 £14.2140/$27.42591
Interim 2007 10 October 2007 23.12c/11.39043p/HK$1.794713 £15.2560/$30.17637
Final 2007 16 May 2008 56.23c/28.33485p/HK$4.380092 £16.2420/$32.78447
Interim 2008 9 October 2008 25.67c/13.96133p/HK$1.995046 £14.00/$26.0148
Final 2008 15 May 2009 42.32c/28.4693p/HK$3.279597 £8.342/$11.7405
Interim 2009 8 October 2009 21.23c/13.25177p/HK$1.645304 £13.876/$22.799
Final 2009 13 May 2010 44.80c/29.54233p/HK$3.478306 £17.351/$26.252
Interim 2010 5 October 2010 23.35c/14.71618p/HK$1.811274/INR0.9841241 £17.394/$27.190
Final 2010 11 May 2011 46.65c/28.272513p/HK$3.623404/INR1.99751701 £15.994/$25.649
Interim 2011 7 October 2011 24.75c/15.81958125p/HK$1.928909813/INR1.137971251 £14.127/$23.140
Final 2011 15 May 2012 51.25c/31.63032125p/HK$3.9776083375/INR2.66670151 £15.723/$24.634
Interim 2012 11 October 2012 27.23c/16.799630190p/HK$2.111362463/INR1.3498039501 £13.417/$21.041
Final 2012 14 May 2013 56.77c/36.5649893p/HK$4.4048756997/INR2.9762835751 £17.40/$26.28792
Interim 2013 17 October 2013 28.80c/17.8880256p/HK$2.233204992/INR1.68131 £15.362/$24.07379
Final 2013 14 May 2014 57.20c/33.9211444p/HK$4.43464736/INR3.3546261 £11.949$19.815
Interim 2014 20 October 2014 28.80c/17.891107200p/HK$2.2340016000/INR1.6718425601 £12.151/$20.207
Final 2014 14 May 2015 57.20c/37.16485p/HK$4.43329/INR3.5140591 £9.797/$14.374
Interim 2015 19 October 2015 14.40c/9.3979152p/HK$1.115985456/INR0.861393721 £8.5226/$13.34383
1. The INR dividend is per Indian Depository Receipt

350 Standard Chartered Annual Report 2015
Shareholder information
Donating shares to ShareGift Shareholders who have a small number of shares often find it uneconomical to sell them. An alternative is to consider donating them to the charity ShareGift (registered charity 1052686), which collects donations of unwanted shares until there are enough to sell, and uses the proceeds to support UK charities. There is no implication for Capital Gains Tax (no gain or loss) when you donate shares to charity, and UK taxpayers may be able to claim income tax relief on the value of their donation.
Further information can be obtained from the Company’s registrars or from ShareGift on 020 7930 3737 or from www.ShareGift.org
Bankers’ Automated Clearing System (BACS)Dividends can be paid straight into your bank or building society account.
Please register online at www.investorcentre.co.uk or contact our registrar for a mandate form
Registrars and shareholder enquiriesIf you have any enquiries relating to your shareholding and you hold your shares on the UK register, please contact our registrar Computershare Investor Services PLC, The Pavilions, Bridgwater Road, Bristol BS99 7ZY or call the shareholder helpline number on 0370 702 0138.
If you hold your shares on the Hong Kong branch register and you have enquiries, please contact Computershare Hong Kong Investor Services Limited, 17M Floor, Hopewell Centre, 183 Queen’s Road East, Wan Chai, Hong Kong.
You can check your shareholding at: www.computershare.com/hk/investors
If you hold Indian Depository Receipts and you have enquiries, please contact Karvy Computershare Private Limited, Karvy Selenium Tower B, Plot 31-32, Gachibowli, Financial District, Nanakramguda, Hyderabad Soo 032, India.
Chinese translationIf you would like a Chinese version of the 2015 Annual Report and Accounts please contact Computershare Hong Kong Investor Services Limited, 17M Floor, Hopewell Centre, 183 Queen’s Road East, Wan Chai, Hong Kong.
本年報之中文譯本可向香港中央證券登記有限公司索取,地址﹕香港灣仔皇后大道東183號合和中心17M樓。Shareholders on the Hong Kong branch register who have asked to receive corporate communications in either Chinese or English can change this election by contacting Computershare.
If there is a dispute between any translation and the English version of this Annual Report and Accounts, the English text shall prevail.
TaxationInformation on taxation applying to dividends paid to you if you are a shareholder in the United Kingdom, Hong Kong or the US will be sent to you with your dividend documents.
Electronic communicationsIf you hold your shares on the UK register and in future you would like to receive the Annual Report and Accounts electronically rather than by post, please register online at: www.investorcentre.co.uk. Then click on Register and follow the instructions. You will need to have your Shareholder or ShareCare reference number when you log on. You can find this on your share certificate or ShareCare statement. Once registered you can also submit your proxy vote and dividend election electronically, and change your bank mandate or address information.
Forward-looking statementsIt is possible that this document could or may contain forward-looking statements that are based on current expectations or beliefs, as well as assumptions about future events. These forward-looking statements can be identified by the fact that they do not relate only to historical or current facts. Forward-looking statements often use words such as anticipate, target, expect, estimate, intend, plan, goal, believe, will, may, should, would, could or other words of similar meaning. Undue reliance should not be placed on any such statements because, by their very nature, they are subject to known and unknown risks and uncertainties and can be affected by other factors that could cause actual results, and the Group’s plans and objectives, to differ materially from those expressed or implied in the forward-looking statements.
There are several factors which could cause actual results to differ materially from those expressed or implied in forward-looking statements. Among the factors that could cause actual results to differ materially from those described in the forward looking statements are changes in the global, political, economic, business, competitive, market and regulatory forces, future exchange and interest rates, changes in tax rates, future business combinations or dispositions and other factors specific to the Group.
Any forward-looking statement contained in this document is based on past or current trends and/or activities of the Group and should not be taken as a representation that such trends or activities will continue in the future. No statement in this document is intended to be a profit forecast or to imply that the earnings of the Group for the current year or future years will necessarily match or exceed the historical or published earnings of the Group.
Except as required by any applicable regulations, the Group expressly disclaims any obligation to revise or update any forward-looking statement contained within this document, regardless of whether those statements are affected as a result of new information, future events or otherwise.
The information, statements and opinions contained in this document do not constitute a public offer under any applicable legislation or an offer or solicitation of any securities, or any advice or recommendation with respect to any securities, in any jurisdiction.

351
Su
pp
leme
nta
ry in
form
ation
Major awards 2015
Asia Risk Awards 2015• Credit Derivatives House of the
Year – Regional• Currency Derivatives House of
the Year – Regional
The Asset Benchmark Research Awards 2015 • Top Bank in the Secondary
Market – Government Bonds (Offshore), Rank 1 – China
• Top Bank in the Secondary Market – Government Bonds, Rank 1 – Hong Kong
• Top Bank in the Secondary Market – Government Bonds, Rank 2 – India
• Top Bank in the Secondary Market – Government Bonds, Rank 3 – Indonesia
• Top Bank in the Secondary Market – Government Bonds (Offshore), Rank 1 – Korea
• Top Bank in the Secondary Market – Government Bonds, Rank 3 – Malaysia
• Top Bank in the Secondary Market – Government Bonds, Rank 1 – Singapore
• Top Bank in the Secondary Market – Government Bonds, Rank 1 – Thailand
• Top Bank in the Secondary Market – Corporate Bonds, Rank 2 – Hong Kong
• Top Bank in the Secondary Market – Corporate Bonds (Offshore), Rank 3 – Korea
• Top Bank in the Secondary Market – Offshore Renminbi, Rank 2 – Asia
The Asset Servicing, Fund Management and Investor Awards 2015• Best Fund Administrator –
Retail Funds• Best Subcustodian• Custody Specialist – Best
Custody Specialist – Africa• Mandate of the Year – Best
Fund Administration Mandate (Retail Funds) – Global
• Best Domestic Custody – India – Rising Star
• Best Fund Administrator (Retail Funds) – India – Rising Star
• Best Fund Administrator (Retail Funds) – Korea
• Best SubCustody – Pakistan• Best SubCustody – Vietnam• Best Domestic Custody –
Vietnam• Best Fund Administrator
(Retail Funds) – Vietnam
The Asset Triple A Country Awards 2015• Best Bank in Vietnam• Best M&A Advisor in Korea
The Asset Triple A Islamic Finance Awards 2015• Best Loan House • Sukuk House of the Year,
Middle East• Sukuk House of the Year, UAE
The Asset Triple A Treasury, Trade and Risk Management Awards 2015• Best Structured Trade Finance
Bank – Regional• Best Renminbi Bank – Regional• Best Regional Specialist
FI/NBFI – Asia• Best Treasury and Cash
Management Bank – MENAP• Best Treasury and Cash
Management Bank – North Asia• Best Working Capital Trade
Finance Bank – South Asia• Best Working Capital Trade
Finance Bank – MENAP• SME Bank for Treasury/
Working Capital Management – Hong Kong
• SME Bank for Treasury/ Working Capital Management – Korea
• SME Bank for Treasury/ Working Capital Management – Pakistan
• MNC/Large Corporate Bank for Treasury/Working Capital Management – Bangladesh
• MNC/Large Corporate Bank for Treasury/Working Capital Management – India
• MNC/Large Corporate Bank for Treasury/Working Capital Management – Pakistan
• MNC/Large Corporate Bank for Treasury/Working Capital Management – Sri Lanka
• FI and NBFI Bank for Treasury/Working Capital Management – China
• NBFI Bank for Treasury/Working Capital Management – India
• FI and NBFI Bank for Treasury/Working Capital Management – Pakistan
• FI and NBFI Bank for Treasury/Working Capital Management – Vietnam
• Best Transaction Bank – South Korea
• Best Cash Management Bank – Bangladesh
• Best Cash Management Bank – Hong Kong
• Best Cash Management Bank – South Korea
• Best Cash Management Bank – Pakistan
• Best Liquidity Management Bank – China
• Best Renminbi Bank – Hong Kong
• Best Structured Trade Finance Bank – Indonesia
• Best Structured Trade Finance Bank – Thailand
• Best Structured Trade Finance Bank – South Korea
• Best Trade Finance Bank – Bangladesh
• Best Trade Finance Bank – India
Awards for Excellence 2015 (poll)• Trade Finance Awards – Best
Trade Bank in Sub-saharan Africa
The Banker Transaction Banking Awards 2015• Best Transaction Bank – Africa
The Banker Transaction Banking Awards 2015• Best Transaction Bank
for Payments
Central Banking Awards 2015 • Foreign Exchange Dealer of the
Year – Global
EMEA Finance Achievement Awards 2015 • Best Islamic Finance House
Euromoney Awards for Excellence 2015 – Country awards (Africa) • Best Bank in Zambia
Euromoney Awards for Excellence 2015 – Regional awards (Africa)• Best Transaction Services
House in Africa
Banking awards

352 Standard Chartered Annual Report 2015
Major awards 2015
Euromoney Awards for Excellence 2015 – Regional awards (Middle East)• Best Risk Advisor in the
Middle East • Best Flow House in the
Middle East
Global Finance Stars of China 2015• Best Subcustodian – China• Best for Small Business
Lending – China
Global Finance Stars of China 2015• Best Supply Chain Finance
Provider – China
Global Finance World’s Best Subcustodian Banks Award 2015• Best Subcustodian Bank
(Country) – Indonesia• Best Subcustodian Bank
(Country) – Jordan• Best Subcustodian Bank
(Country) – Vietnam
Power in Africa Awards• The Investors Spirit of Africa
Award
Dow Jones Sustainability IndexWe were included in the Dow Jones Sustainability Index (DJSI) World Index and Europe Index. We were noted for our strong performance in brand management, environmental reporting, corporate citizenship, stakeholder engagement and financial inclusion.
FTSE4GoodWe were listed in the FTSE4Good Index. The FTSE4Good measures the performance of companies that meet globally recognised corporate responsibility standards.
Carbon Disclosure ProjectWe were selected for the UK FTSE Carbon Disclosure Leadership Index and for the second consecutive year were on the A List: The Carbon Disclosure Project (CDP) Climate Performance Leadership Index.
Sustainability indices

353
Su
pp
leme
nta
ry in
form
ation
Glossary
Additional Tier 1 capital Additional Tier 1 (AT1) capital consists of instruments issued by the Group and related share premiums that meet the criteria for inclusion in AT1 capital (and are not included in Common Equity Tier 1), and regulatory adjustments required in the calculation of AT1 capital.
Additional value adjustment See ‘Prudential valuation adjustment’.
Advanced internal rating-based (AIRB) approachThe AIRB approach under the Basel II framework is used to calculate credit risk capital based on the Group’s own estimates of certain parameters.
Advances-to-deposits ratioThe ratio of total loans and advances to customers relative to total customer deposits. A low advances-to-deposits ratio demonstrates that customer deposits exceed customer loans resulting from emphasis placed on generating a high level of stable funding from customers.
ASEANAssociation of South East Asian Nations (ASEAN) which includes the Group’s operation in Brunei, Indonesia, Malaysia, Philippines, Singapore, Thailand and Vietnam.
Asset backed securities (ABS)Securities that represent an interest in an underlying pool of referenced assets. The referenced pool can comprise any assets which attract a set of associated cash flows but are commonly pools of residential or commercial mortgages and in the case of collateralised debt obligations (CDOs), the reference pool may be ABS.
Attributable profit to ordinary shareholdersProfit for the year after non-controlling interests and the declaration of dividends on preference shares classified as equity.
Basel IIThe capital adequacy framework issued by the Basel Committee on Banking Supervision (BCBS) in June 2006 in the form of the ‘International Convergence of Capital Measurement and Capital Standards’.
Basel IIIIn December 2010, the Basel Committee on Banking Supervision issued the Basel III rules text, which was updated in June 2011, and represents the details of strengthened global regulatory standards on bank capital adequacy and liquidity. The new requirements will be phased in and fully implemented by 1 January 2019.
Basis point (bps)One hundredth of a per cent (0.01 per cent); 100 basis points is 1 per cent. Used in quoting movements in interest rates or yields on securities.
BIPRUThe Prudential Regulation Authority’s Prudential Sourcebook for Banks, Building Societies and Investment Firms.
Capital Adequacy Directive 2 (CAD2)An amendment to CAD that gives national regulators the discretion to permit firms to use their own value at risk model for calculating capital requirements subject to certain criteria.
Capital Requirements Directive (CRD) IVRepresents the CRD and Capital Requirements Regulation that implement the Basel III proposals in Europe.
Capital resourcesSum of Tier 1 and Tier 2 capital after regulatory adjustments.
Claw-backRemuneration already paid to an individual, which has to be returned to the Group under certain circumstances.
Client due diligence (CDD) CDD is an important part of the Group’s management of financial crime, reputational and regulatory risk. CDD enables us to understand our clients and their activities so that financial crime risks are identified and mitigated. CDD is performed at the point of onboarding the client and on an ongoing basis. As a general rule, no products or services can be provided to a client until CDD has been completed.
Collateralised debt obligations (CDOs)Securities issued by a third party which reference asset backed securities and/or certain other related assets purchased by the issuer. CDOs may feature exposure to sub-prime mortgage assets through the underlying assets.
Collectively assessed loan impairment provisionsAlso known as portfolio impairment provisions. Impairment assessment on a collective basis for homogeneous groups of loans that are not considered individually significant and to cover losses that have been incurred but have not yet been identified at the balance sheet date. Typically Retail Clients are assessed on a portfolio basis.
Commercial mortgage backed securities (CMBS)Securities that represent interests in a pool of commercial mortgages. Investors in these securities have the
right to cash received from future mortgage payments (interest and/or principal).
Commercial paper An unsecured promissory note issued to finance short-term credit needs. It specifies the face amount paid to investors on the maturity date.
Commercial real estateIncludes office buildings, industrial property, medical centres, hotels, malls, retail stores, shopping centres, farm land, multi-family housing buildings, warehouses, garages and industrial properties. Commercial real estate loans are those backed by a package of commercial real estate assets.
Common Equity Tier 1 (CET1)capitalCET1 capital consists of the common shares issued by the bank and related share premium, retained earnings, accumulated other comprehensive income and other disclosed reserves, eligible non-controlling interests and regulatory adjustments required in the calculation of CET1.
Constant currencyConstant currency change is derived by applying a simple translation of the previous period functional currency number in each entity using the current average and period-end US dollar exchange rates to the income statement and balance sheet respectively.
Contractual maturityContractual maturity refers to the final payment date of a loan or other financial instrument, at which point all the remaining outstanding principal will be repaid and interest is due to be paid.
Core Tier 1 capitalCore Tier 1 capital comprises called-up ordinary share capital and eligible reserves plus non-controlling interests, less goodwill and other intangible assets and deductions relating to excess expected losses over eligible provisions and securitisation positions as specified by the UK’s Prudential Regulation Authority.
Core Tier 1 capital ratioCore Tier 1 capital as a percentage of risk-weighted assets.
Corporate planDetailed plan produced as an output of the Group’s formalised annual budgeting, management reporting and review process. It comprises a five-year forecast of the Group’s profitability, capital position, and funding and liquidity requirements. The corporate plan provides information to the Board which is used to ensure the adequacy of
resources available for the Group to meet its business objectives, both on a short-term and strategic basis.
Cost-to-income ratioRepresents the proportion of total operating expenses to total operating income.
Countercyclical capital bufferRegulatory capital of up to 2.5 per cent of risk-weighted assets that is required to be held under Basel III rules to ensure that banks build up surplus capital when macroeconomic conditions indicate excess credit growth.
Counterparty credit riskThe risk that a counterparty defaults before satisfying its obligations under a contract.
Cover ratioRepresents the extent to which non-performing loans are covered by impairment allowances.
Credit conversion factorEither prescribed by The Prudential Regulation Authority’s Prudential Sourcebook for Banks, Building Societies and Investment Firms or modelled by the Group, an estimate of the amount the Group expects a customer to have drawn down further on a facility limit at the point of default.
Credit default swaps A credit derivative is an arrangement whereby the credit risk of an asset (the reference asset) is transferred from the buyer to the seller of protection. A credit default swap is a contract where the protection seller receives premium or interest-related payments in return for contracting to make payments to the protection buyer upon a defined credit event. Credit events normally include bankruptcy, payment default on a reference asset or assets, or downgrades by a rating agency.
Credit institutionsAn institution whose business is to receive deposits or other repayable funds from the public and to grant credits for its own account.
Credit risk mitigation Credit risk mitigation is a process to mitigate potential credit losses from any given account, customer or portfolio by using a range of tools such as collateral, netting agreements, credit insurance, credit derivatives and other guarantees.
Credit valuation adjustments (CVA)An adjustment to fair value primarily in respect of derivative contracts that reflects the possibility that the counterparty may default such that the Group would not receive the full market value of the transactions.

354 Standard Chartered Annual Report 2015
Glossary
Customer depositsMoney deposited by all individuals and companies that are not credit institutions including securities sold under repurchase agreement (repo). Such funds are recorded as liabilities in the Group’s balance sheet under customer accounts.
Debt restructuringThis is when the terms and provisions of outstanding debt agreements are changed. This is often done in order to improve cash flow and the ability of the borrower to repay the debt. It can involve altering the repayment schedule as well as debt or interest charge reduction.
Debt securitiesDebt securities are assets on the Group’s balance sheet and represent certificates of indebtedness of credit institutions, public bodies or other undertakings excluding those issued by central banks.
Debt securities in issueDebt securities in issue are transferable certificates of indebtedness of the Group to the bearer of the certificate. These are liabilities of the Group and include certificates of deposits.
Deferred tax assetIncome taxes recoverable in future periods in respect of deductible temporary differences between the accounting and tax base of an asset or liability that will result in tax deductible amounts in future periods, the carry-forward of tax losses and the carry-forward of unused tax credits.
Deferred tax liabilityIncome taxes payable in future periods in respect of taxable temporary differences between the accounting and tax base of an asset or liability that will result in taxable amounts in future periods.
Defined benefit obligationThe present value of expected future payments required to settle the obligations of a defined benefit scheme resulting from employee service.
Defined benefit schemePension or other post-retirement benefit scheme other than a defined contribution scheme.
Defined contribution schemePension or other post-retirement benefit scheme where the employer’s obligation is limited to its contributions to the fund.
DelinquencyA debt or other financial obligation is considered to be in a state of delinquency when payments are overdue. Loans and advances are considered to be delinquent when consecutive payments are missed. Also known as arrears.
Deposits by banksDeposits by banks comprise amounts owed to other domestic or foreign credit institutions by the Group including securities sold under a repurchase agreement (repo).
Dividend per shareRepresents the entitlement of each shareholder in the share of the profits of the company. Calculated in the lowest unit of currency in which the shares are quoted.
Effective tax rate The tax on profits on ordinary activities as a percentage of profit on ordinary activities before taxation.
Encumbered assetsOn-balance sheet assets pledged or used as collateral in respect of certain of the Group’s liabilities.
EurozoneRepresents the 17 European Union countries that have adopted the euro as their common currency. The 17 countries are Austria, Belgium, Cyprus, Estonia, Finland, France, Germany, Greece, Ireland, Italy, Luxembourg, Malta, Netherlands, Portugal, Slovakia, Slovenia and Spain.
Expected lossThe Group’s measure of anticipated loss for exposures captured under an internal ratings-based credit risk approach for capital adequacy calculations. It is measured as the Group-modelled view of anticipated loss based on probability of default, loss given default and exposure at default, with a one-year time horizon.
ExposuresCredit exposures represent the amount lent to a customer, together with any undrawn commitment.
Exposure at default (EAD)The estimation of the extent to which the Group may be exposed to a customer or counterparty in the event of, and at the time of, that counterparty’s default. At default, the customer may not have drawn the loan fully or may already have repaid some of the principal, so that exposure is typically less than the approved loan limit.
External Credit Assessment Institutions (ECAI)For the standardised approach to credit risk for sovereigns, corporates and institutions, external ratings are used to assign risk weights. These external ratings must come from the Prudential Regulation Authority’s approved rating agencies, known as ECAI; namely Moody’s, Standard & Poor’s and Fitch.
Financial Conduct Authority (FCA)The Financial Conduct Authority regulates the conduct of financial firms and, for certain firms, prudential standards in the UK. It has a strategic objective to ensure that the relevant markets function well.
ForbearanceForbearance takes place when a concession is made to the contractual terms of a loan in response to an obligor’s financial liabilities.
Free deliveriesA transaction in which securities, foreign currencies or commodities have been paid for before receiving them or where securities, foreign currencies or commodities have been delivered before receiving payment for them.
Free funds Free funds includes equity capital, retained reserves, current year unremitted profits and capital injections net of proposed dividends. It does not include debt capital instruments, unrealised profits or losses or any non-cash items.
Funded/unfunded exposuresExposures where the notional amount of the transaction is funded or unfunded. Represents exposures where there is a commitment to provide future funding but funds have been released/not released.
Global Systemically Important Institutions (G-SII)In November 2011, The Financial Stability Board established a methodology to identify G-SIIs based on 12 principal indicators. Designation will result in the application of a Common Equity Tier 1 buffer between 1 per cent and 3.5 per cent, to be phased in by 1 January 2019. The list of G-SIIs is re-assessed through annual rescoring of banks and a triennial review of the methodology. National regulators have discretion to introduce higher charges than the minimum. In Capital Requirements Directive IV, this is implemented via the G-SII buffer.
Global Systemically Important Institutions (G-SII) bufferA capital buffer prescribed in the EU under Capital Requirements Directive IV, to address risks in the financial sector as a whole, or one or more sub-sectors, to be deployed as necessary by each EU member state with a view to mitigate structural macro-prudential risk. In the UK this was transposed in January 2015 and is to be applied to ring-fenced banks and building societies over a certain threshold.
High-quality liquid assetsAssets that are unencumbered, liquid in markets during a time of stress and, ideally, are central bank eligible. These include, for example, cash and claims on central governments and central banks. The Basel III Rules require this ratio to be at least 100 per cent.
Impaired loansLoans where individual identified impairment provisions have been raised and also include loans which are collateralised or where indebtedness has already been written down to the expected realisable value. The impaired loan category may include loans which, while impaired, are still performing.
Impairment allowancesImpairment allowances are a provision held on the balance sheet as a result of the raising of a charge against profit for the incurred loss. An impairment allowance may either be identified or unidentified and individual (specific) or collective (portfolio).
Individually assessed loan impairment provisionsAlso known as specific impairment provisions. Impairment is measured individually for assets that are individually significant to the Group. Typically, assets within the Corporate & Institutional Clients segment of the Group are assessed individually.
Innovative Tier 1 capitalInnovative tier 1 capital consists of instruments which incorporate certain features, the effect of which is to weaken (but only marginally) the key characteristics of Tier 1 capital (that is, fully subordinated, perpetual and non-cumulative). Innovative Tier 1 capital is subject to a limit of 15 per cent of total Tier 1 capital.
Interest rate risk Interest rate risk arises due to the investment of equity and reserves into rate-sensitive assets, as well as some tenor mismatches between debt issuance and placements.
Internal ratings-based (IRB) approach The IRB approach is used to calculate risk-weighted assets in accordance with the Basel Capital Accord where capital requirements are based on a firm’s own estimates of certain parameters.
Internal Model Approach (IMA)The approach used to calculate market risk capital and risk-weighted assets with an internal market risk model approved by the PRA under the terms of Capital Requirements Directive IV/Capital Requirements Regulation. Formerly referred to as Capital Adequacy Directive 2.

355
Su
pp
leme
nta
ry in
form
ation
Investment gradeA debt security, treasury bill or similar instrument with a credit rating measured by external agencies of AAA to BBB.
Leverage ratioA ratio introduced under Capital Requirements Directive IV that compares Tier 1 capital to total exposures, including certain exposures held off-balance sheet as adjusted by stipulated credit conversion factors. Intended to be a simple, non-risk based backstop measure.
Leveraged financeLoans or other financing agreements provided to companies whose overall level of debt is high in relation to their cash flow (net debt: earnings before interest tax, depreciation and amortisation (EBITDA)) typically arising from private equity sponsor-led acquisitions of the businesses concerned.
Liquid asset bufferThese assets include high-quality government or central bank securities, certain deposits with central banks and securities issued by designated multilateral development banks to meet the Prudential Regulation Authority’s requirement for liquidity.
Liquid asset ratioRatio of total liquid assets to total assets. Liquid assets comprise cash (less restricted balances), net interbank, treasury bills and debt securities less illiquid securities.
Liquidation portfolioA portfolio of assets which is beyond our current risk tolerance metrics and is held for liquidation.
Liquidity and credit enhancementsCredit enhancement facilities are used to enhance the creditworthiness of financial obligations and cover losses due to asset default. Two general types of credit enhancement are third-party loan guarantees and self-enhancement through over-collateralisation. Liquidity enhancement makes funds available if required, for other reasons than asset default, e.g. to ensure timely repayment of maturing commercial paper.
Liquidity coverage ratio (LCR)A short-term liquidity measure that considers a 30-day period of liquidity stress.
Loans and advancesThis represents lending made under bilateral agreements with customers entered into in the normal course of business and is based on the legal form of the instrument. An example of a loan product is a home loan.
Loans to banksAmounts loaned to credit institutions including securities bought under reverse repurchase.
Loans to individualsMoney loaned to individuals rather than institutions. The loans may be for car or home purchases, medical care, home repair, holidays and other consumer uses.
Loan-to-value ratioThe loan-to-value ratio is a mathematical calculation that expresses the amount of a first mortgage lien as a percentage of the total appraised value of real property. The loan-to-value ratio is used in determining the appropriate level of risk for the loan and therefore the correct price of the loan to the borrower.
Loans past due Loans on which payments have been due for up to a maximum of 90 days including those on which partial payments are being made.
Loss given default (LGD)LGD is the percentage of an exposure that a lender expects to lose in the event of obligor default.
MalusAn arrangement that permits the Group to prevent vesting of all, or part of the amount of a deferred remuneration award in relation to risk outcomes or performance.
Master netting agreementAn agreement between two counterparties that have multiple derivative contracts with each other that provides for the net settlement of all contracts through a single payment, in a single currency, in the event of default on, or termination of, any one contract.
Mezzanine capitalFinancing that combines debt and equity characteristics. For example, a loan that also confers some profit participation to the lender.
Minimum requirement for own funds and eligible liabilities (MREL) A requirement under the Bank Recovery and Resolution Directive for EU resolution authorities to set a minimum requirement for own funds and eligible liabilities for banks. Similar to Total Loss Absorbing Capacity, MREL is intended to ensure there is sufficient equity and specific types of liabilities within the Group that can absorb losses and recapitalise the Group, facilitating an orderly resolution that minimises any impact on financial stability and ensures the continuity of critical functions and avoids exposing taxpayers to loss.
Net asset value per shareRatio of net assets (total assets less total liabilities) to the number of ordinary shares outstanding at the end of a reporting period.
Net exposureThe aggregate of loans and advances to customers/loans and advances to banks after impairment provisions, restricted balances with central banks, derivatives (net of master netting agreements), investment debt and equity securities, and letters of credit and guarantees.
Net interest income The difference between interest received on assets and interest paid on liabilities.
Net interest marginThe margin is expressed as net interest income divided by average interest earning assets.
Net stable funding ratio (NSFR)The ratio of available stable funding to required stable funding over a one-year time horizon, assuming a stressed scenario. It is a longer-term liquidity measure designed to restrain the amount of wholesale borrowing and encourage stable funding over a one-year time horizon.
Non-performing loans (NPLs)A non-performing loan is any loan that is more than 90 days past due or is otherwise individually impaired, other than a loan which is:• Renegotiated before 90 days past
due, and on which no default in interest payments or loss of principal is expected
• Renegotiated at or after 90 days past due, but on which there has been no default in interest or principal payments for more than 180 days since renegotiation, and against which no loss of principal is expected.
Normalised earningsProfit attributable to ordinary shareholders adjusted for profits or losses of a capital nature; amounts consequent to investment transactions driven by strategic intent; and other infrequent and/or exceptional transactions that are significant or material in the context of the Group’s normal business earnings for the period.
Over-the-counter (OTC) derivativesA bilateral transaction (e.g. derivatives) that is not exchange traded and that is valued using valuation models.
Pillar 1The first Pillar of the three pillars of Basel II/Basel III which provides the approach to calculation of the minimum capital requirements for credit, market and operational risk.
Pillar 2Pillar 2 requires banks to undertake a comprehensive assessment of their risks and to determine the appropriate amounts of capital to be held against these risks where other suitable mitigants are not available.
Pillar 3Pillar 3 aims to provide a consistent and comprehensive disclosure framework that enhances comparability between banks and further promotes improvements in risk practices.
Private equity investmentsEquity securities in operating companies generally not quoted on a public exchange. Investment in private equity often involves the investment of capital in private companies. Capital for private equity investment is raised by retail or institutional investors and used to fund investment strategies such as leveraged buyouts, venture capital, growth capital, distressed investments and mezzanine capital.
Probability of default (PD)PD is an internal estimate for each borrower grade of the likelihood that an obligor will default on an obligation.
Profit attributable to ordinary shareholdersProfit for the year after non-controlling interests and dividends declared in respect of preference shares classified as equity.
Prudential valuation adjustmentA deduction from Common Equity Tier 1 capital, to reflect the difference between fair value and prudent value positions, where the application of prudent results in a lower absolute carrying value than recognised in the financial statements.
Prudential Regulation Authority (PRA)The Prudential Regulation Authority is the statutory body responsible for the prudential supervision of banks, building societies, credit unions, insurers and a small number of significant investment firms in the UK. The PRA is a subsidiary of the Bank of England.
Renegotiated loansLoans and advances are generally renegotiated either as part of an ongoing customer relationship or in response to an adverse change in the circumstances of the borrower. In the latter case renegotiation can result in an extension of the due date of payment or repayment plans under which the Group offers a concessionary rate of interest to genuinely distressed borrowers. Such assets will be individually impaired where the renegotiated payments of interest and principal will not recover the original carrying

356 Standard Chartered Annual Report 2015
Glossary
amount of the asset and are defined as forborne loans. In other cases, renegotiation may lead to a new agreement, which would be treated as a new loan.
Repo/Reverse repoA repurchase agreement or repo is a short-term funding agreement which allows a borrower to sell a financial asset, such as asset backed securities or government bonds as collateral for cash. As part of the agreement, the borrower agrees to repurchase the security at some later date, usually less than 30 days, repaying the proceeds of the loan. For the party on the other end of the transaction (buying the security and agreeing to sell in the future) it is a reverse repurchase agreement or reverse repo.
Residential mortgageA loan to purchase a residential property which is then used as collateral to guarantee repayment of the loan. The borrower gives the lender a lien against the property, and the lender can foreclose on the property if the borrower does not repay the loan per the agreed terms. Also known as a home loan.
Residential mortgage backed securities (RMBS)Securities that represent interests in a group of residential mortgages. Investors in these securities have the right to cash received from future mortgage payments (interest and/or principal).
Return on equityRepresents the ratio of the current year’s profit available for distribution to ordinary shareholders to the weighted average ordinary shareholders equity for the reporting period.
Risk-weighted assets (RWA)A measure of a bank’s assets adjusted for their associated risks. Risk weightings are established in accordance with the Basel Capital Accord as implemented by the Financial Services Authority.
Risk capital adjusted profitA risk-adjusted, profit-based funding mechanism. This is applied as a combination of automatic adjustments and other adjustments determined by the Remuneration Committee for specific risk and control matters that are not already taken into account through automatic adjustments.
Risks-not-in-VaR (RNIV)A framework for identifying and quantifying marginal types of market risk that are not captured in the value at risk (VaR) measure for any reason, such as being a far-tail risk or the necessary historical market data not being available.
Secured (fully and partially)A secured loan is a loan in which the borrower pledges an asset as collateral for a loan which, in the event that the borrower defaults, the Group is able to take possession of. All secured loans are considered fully secured if the fair value of the collateral is equal to or greater than the loan at the time of origination. All other secured loans are considered to be partly secured.
SecuritisationSecuritisation is a process by which debt instruments are aggregated into a pool, which is used to back new securities. A company sells assets to a structured entity who then issues securities backed by the assets based on their value. This allows the credit quality of the assets to be separated from the credit rating of the original company and transfers risk to external investors.
Senior debtSenior debt, frequently issued in the form of senior notes, is debt that takes priority over other unsecured or otherwise more ‘junior’ debt owed by the issuer. Senior debt has greater seniority in the issuer’s capital structure after subordinated debt. In the event the issuer goes bankrupt, senior debt theoretically must be repaid before other creditors receive any payment.
Significant investment holdingsSignificant investment holdings are holdings in undertakings other than subsidiaries, joint ventures or associates, where the shareholding is greater than, or equal to, 20 per cent of the nominal value of any class of shares, or a book value greater than 20 per cent of the Group’s assets.
Sovereign exposuresExposures to central governments and central government departments, central banks and entities owned or guaranteed by the aforementioned. Sovereign exposures, as defined by the European Banking Authority, includes only exposures to central governments.
Standardised approachIn relation to credit risk, a method for calculating credit risk capital requirements using External Credit Assessment Institutions ratings and supervisory risk weights. In relation to operational risk, a method of calculating the operational capital requirement by the application of a supervisory defined percentage charge to the gross income of eight specified business lines.
Stressed value at riskA regulatory market risk measure based on potential market movements for a continuous one-year period of stress for a trading portfolio.
Structured finance/notesA structured note is an investment tool which pays a return linked to the value or level of a specified asset or index and sometimes offers capital protection if the value declines. Structured notes can be linked to equities, interest rates, funds, commodities and foreign currency.
Subordinated liabilitiesLiabilities which, in the event of insolvency or liquidation of the issuer, are subordinated to the claims of depositors and other creditors of the issuer.
Sub-primeSub-prime is defined as loans to borrowers typically having weaker credit histories that include payment delinquencies and potentially more severe problems such as court judgements and bankruptcies. They may also display reduced repayment capacity as measured by credit scores, high debt-to-income ratios, or other criteria indicating heightened risk of default.
Tier 1 capitalTier 1 capital comprises Core Tier 1 capital plus innovative Tier 1 securities and preference shares and tax on excess expected losses less material holdings in credit or financial institutions.
Tier 1 capital ratioTier 1 capital as a percentage of risk-weighted assets.
Tier 2 capitalTier 2 capital comprises qualifying subordinated liabilities, allowable portfolio impairment provision and unrealised gains in the eligible revaluation reserves arising from the fair valuation of equity instruments held as available-for-sale.
Total Loss Absorbing Capacity (TLAC)A standard set by the Financial Stability Board to ensure global systemically important institutions have a sufficient amount of specific types of liabilities, which can be used to absorb losses and recapitalise a bank in resolution. These proposals are intended to facilitate an orderly resolution that minimises any impact on financial stability, ensures the continuity of critical functions, and avoids exposing taxpayers to loss.
UK bank levyA levy that applies to certain UK banks and the UK operations of foreign banks from 1 January 2011. The levy is payable each year based on a percentage of the chargeable liabilities of the Group as at 31 December.
Value at risk (VaR)Value at risk is an estimate of the potential loss which might arise from market movements under normal market conditions, if the current positions were to be held unchanged for one business day, measured to a confidence level of 97.5 per cent.
Write-downsAfter an advance has been identified as impaired and is subject to an impairment allowance, the stage may be reached whereby it is concluded that there is no realistic prospect of further recovery. Write-downs will occur when, and to the extent that, the whole or part of a debt is considered irrecoverable.
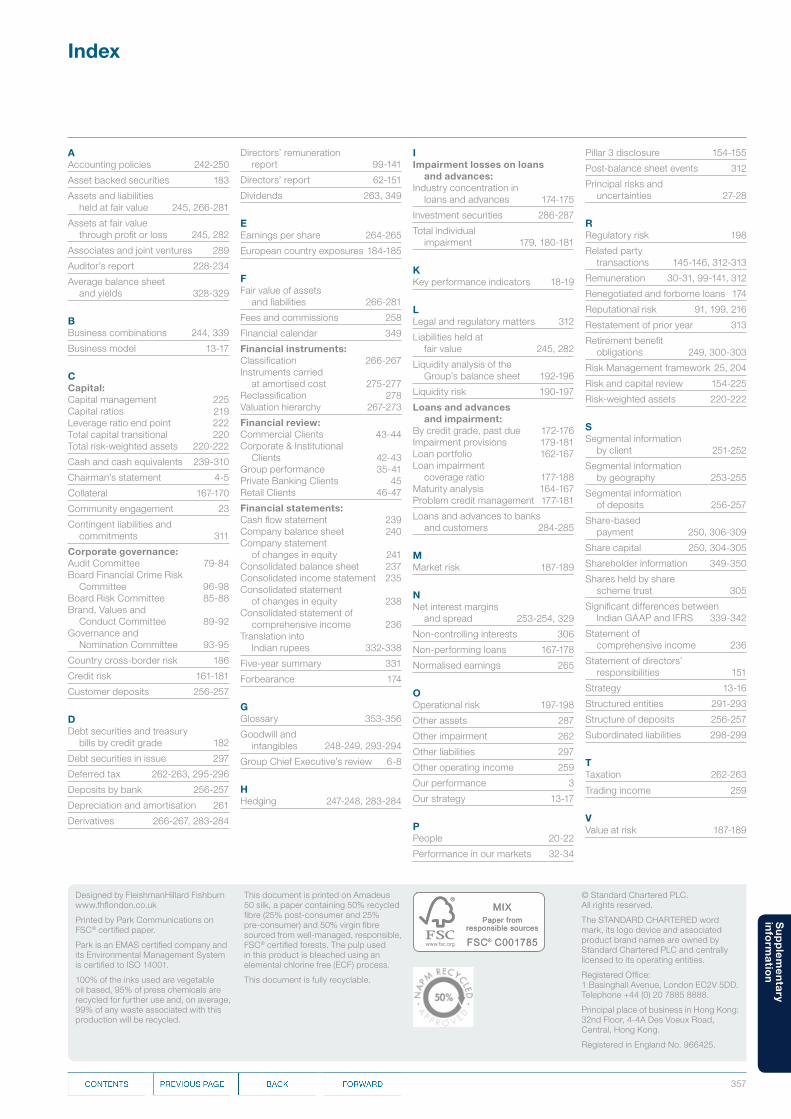
357
Su
pp
leme
nta
ry in
form
ation
Index
AAccounting policies 242-250
Asset backed securities 183
Assets and liabilities held at fair value 245, 266-281
Assets at fair value through profit or loss 245, 282
Associates and joint ventures 289
Auditor’s report 228-234
Average balance sheet and yields 328-329
BBusiness combinations 244, 339
Business model 13-17
CCapital:Capital management 225Capital ratios 219Leverage ratio end point 222Total capital transitional 220Total risk-weighted assets 220-222
Cash and cash equivalents 239-310
Chairman’s statement 4-5
Collateral 167-170
Community engagement 23
Contingent liabilities and commitments 311
Corporate governance:Audit Committee 79-84Board Financial Crime Risk
Committee 96-98 Board Risk Committee 85-88Brand, Values and
Conduct Committee 89-92Governance and
Nomination Committee 93-95
Country cross-border risk 186
Credit risk 161-181
Customer deposits 256-257
DDebt securities and treasury
bills by credit grade 182
Debt securities in issue 297
Deferred tax 262-263, 295-296
Deposits by bank 256-257
Depreciation and amortisation 261
Derivatives 266-267, 283-284
Directors’ remuneration report 99-141
Directors’ report 62-151
Dividends 263, 349
EEarnings per share 264-265
European country exposures 184-185
FFair value of assets
and liabilities 266-281
Fees and commissions 258
Financial calendar 349
Financial instruments:Classification 266-267Instruments carried
at amortised cost 275-277Reclassification 278Valuation hierarchy 267-273
Financial review:Commercial Clients 43-44Corporate & Institutional
Clients 42-43Group performance 35-41Private Banking Clients 45Retail Clients 46-47
Financial statements:Cash flow statement 239Company balance sheet 240Company statement
of changes in equity 241Consolidated balance sheet 237Consolidated income statement 235Consolidated statement
of changes in equity 238Consolidated statement of
comprehensive income 236Translation into
Indian rupees 332-338
Five-year summary 331
Forbearance 174
GGlossary 353-356
Goodwill and intangibles 248-249, 293-294
Group Chief Executive’s review 6-8
HHedging 247-248, 283-284
IImpairment losses on loans
and advances:Industry concentration in
loans and advances 174-175
Investment securities 286-287
Total individual impairment 179, 180-181
KKey performance indicators 18-19
LLegal and regulatory matters 312
Liabilities held at fair value 245, 282
Liquidity analysis of the Group’s balance sheet 192-196
Liquidity risk 190-197
Loans and advances and impairment:
By credit grade, past due 172-176Impairment provisions 179-181 Loan portfolio 162-167Loan impairment
coverage ratio 177-188Maturity analysis 164-167Problem credit management 177-181
Loans and advances to banks and customers 284-285
MMarket risk 187-189
NNet interest margins
and spread 253-254, 329
Non-controlling interests 306
Non-performing loans 167-178
Normalised earnings 265
OOperational risk 197-198
Other assets 287
Other impairment 262
Other liabilities 297
Other operating income 259
Our performance 3
Our strategy 13-17
PPeople 20-22
Performance in our markets 32-34
Pillar 3 disclosure 154-155
Post-balance sheet events 312
Principal risks and uncertainties 27-28
RRegulatory risk 198
Related party transactions 145-146, 312-313
Remuneration 30-31, 99-141, 312
Renegotiated and forborne loans 174
Reputational risk 91, 199, 216
Restatement of prior year 313
Retirement benefit obligations 249, 300-303
Risk Management framework 25, 204
Risk and capital review 154-225
Risk-weighted assets 220-222
SSegmental information
by client 251-252
Segmental information by geography 253-255
Segmental information of deposits 256-257
Share-based payment 250, 306-309
Share capital 250, 304-305
Shareholder information 349-350
Shares held by share scheme trust 305
Significant differences between Indian GAAP and IFRS 339-342
Statement of comprehensive income 236
Statement of directors’ responsibilities 151
Strategy 13-16
Structured entities 291-293
Structure of deposits 256-257
Subordinated liabilities 298-299
TTaxation 262-263
Trading income 259
VValue at risk 187-189
Designed by FleishmanHillard Fishburn www.fhflondon.co.uk
Printed by Park Communications on FSC® certified paper.
Park is an EMAS certified company and its Environmental Management System is certified to ISO 14001.
100% of the inks used are vegetable oil based, 95% of press chemicals are recycled for further use and, on average, 99% of any waste associated with this production will be recycled.
This document is printed on Amadeus 50 silk, a paper containing 50% recycled fibre (25% post-consumer and 25% pre-consumer) and 50% virgin fibre sourced from well-managed, responsible, FSC® certified forests. The pulp used in this product is bleached using an elemental chlorine free (ECF) process.
This document is fully recyclable.
© Standard Chartered PLC. All rights reserved.
The STANDARD CHARTERED word mark, its logo device and associated product brand names are owned by Standard Chartered PLC and centrally licensed to its operating entities.
Registered Office: 1 Basinghall Avenue, London EC2V 5DD. Telephone +44 (0) 20 7885 8888.
Principal place of business in Hong Kong: 32nd Floor, 4-4A Des Voeux Road, Central, Hong Kong.
Registered in England No. 966425.

LSE Stock code: STAN.LN HKSE Stock code: 02888 BSE/NSE Stock code: STAN.IN
Contact information
Global headquarters Standard Chartered Bank 1 Basinghall Avenue London, EC2V 5DD United Kingdom
telephone: +44 (0)20 7885 8888 facsimile: +44 (0)20 7885 9999
Digital Annual Report and Accounts
www.sc.com/annual-report/2015
Shareholder enquiries
ShareCare informationwebsite: investors.sc.com/en/resource.cfm helpline: 0370 702 0138
ShareGift information website: www.ShareGift.orghelpline: 020 7930 3737
Registrar information
UKComputershare Investor Services PLC The Pavilions Bridgwater Road Bristol, BS99 7ZY helpline: 0370 702 0138
Hong KongComputershare Hong Kong Investor Services Limited 17M Floor, Hopewell Centre 183 Queen’s Road East Wan Chai Hong Kongwebsite: www.computershare.com/hk/investors
Indian Depository ReceiptsKarvy Computershare Private Limited Karvy Selenium Tower B, Plot 31-32 Gachibowli, Financial District Nanakramguda Hyderabad Soo 032, India
Chinese translationComputershare Hong Kong Investor Services Limited 17M Floor, Hopewell Centre 183 Queen’s Road East Wan Chai Hong Kong
Register for electronic communicationswebsite: www.investorcentre.co.uk