Embed Size (px)
Citation preview

SharePoint Deployment Planning Services
SharePoint 2010 Insights

SharePoint 2010 Insights Overview

Challenges

Business Challenges
Information Worker
• Effective tools for the development of business insights
• Immediate productivity
• Flexible, consistent user access
IT Management
• Streamlined platform management
• Seamless access to business data
• Integrated visualization of business data in the most effective formats
Organization
• Delivery of a strategic platform business information
• Cost-effective content delivery
• Increased productivity
• Cross-business governance

SharePoint 2010 Insights Features
SharePoint 2010 Solutions
Information Worker
• Familiar analysis and solution development tools
• Integrated collaboration of data for shared development
• Flexible, consistent user access
IT Management
• LoB application integration
• Application platform that offers a range of solutions, familiar to users but extended to an enterprise deployment
• Single seat administration
Organization
• Cost-effective deployment
• Scalability across delivery architectures
• Reduced training/ increased productivity
• Governance and compliance across deliver platforms

Excel Services – New Features
Improved UsabilityMulti-user CollaborationDelegate Services PermissionsSlicer featureSparklinesFidelity across multiple browsers
Improved ManagementUnattended Service AccountManage Service ApplicationsTrusted LocationsWindows PowerShell

Collaborating In Real Time
Edit Web Spreadsheets (Excel Workbooks) in the BrowserMultiple users can edit, values will sync across user sessions

PowerPivot Add-in with Excel

PerformancePoint Services
DashboardsScorecardsReport ViewsFiltersRich Analytic VisualizationsData SourcesChart Web Part

Dashboards
Deployed to SharePointFiltersScorecardsReport Views

Scorecards
KPIsCreated from multiple data sourcesKPI weightingKPI scoring Annotation capabilitiesCalculate KPI builderMultiple attributes and targetsVariance calculations
ScorecardsDynamic Navigation (OLAP)Balanced

Analytic Reports
Full analytic navigation
Drill down/upExpand/collapseCross drill
Filtering/SortingAnalyze in decomposition tree
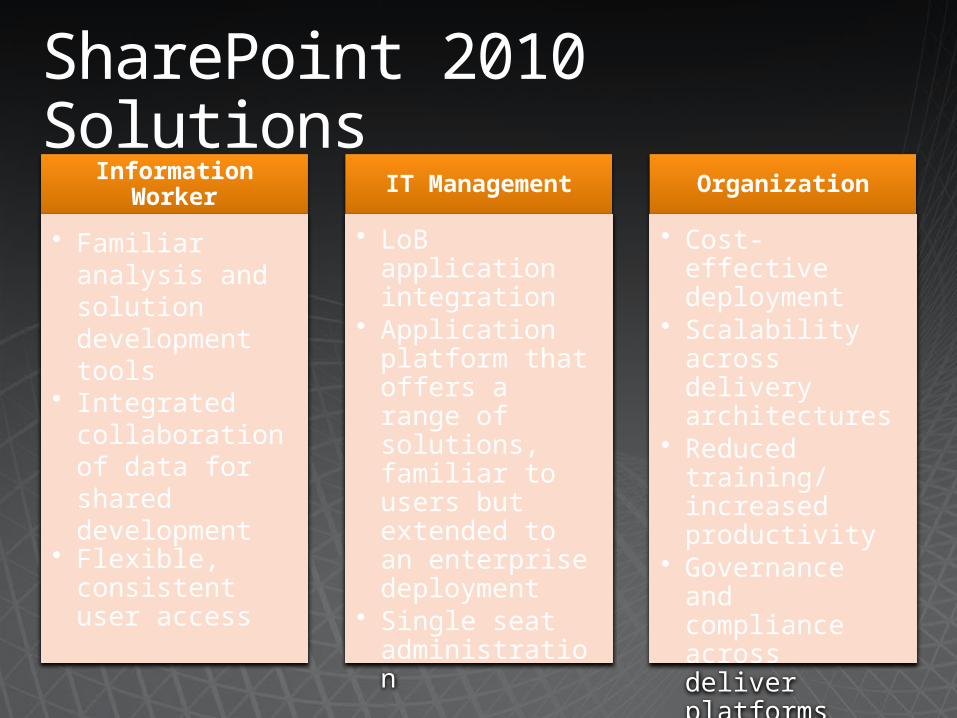
Visio Services
RenderingBrowser-agnosticFull Fidelity rendering using Down-level experience in PNG
Visual Refresh of Data DiagramsRefresh diagrams connected to:
Automatic refresh
Custom
OLEDB ODBCSP
ListsSQL Excel
ODC

Visio Services Features
SharePoint IntegrationVisio Web Access web partJavaScript Mash-up APISupports web part connections
AdministrationVisio Services is a Shared ServiceCustomizable in Central Administration and PowerShell
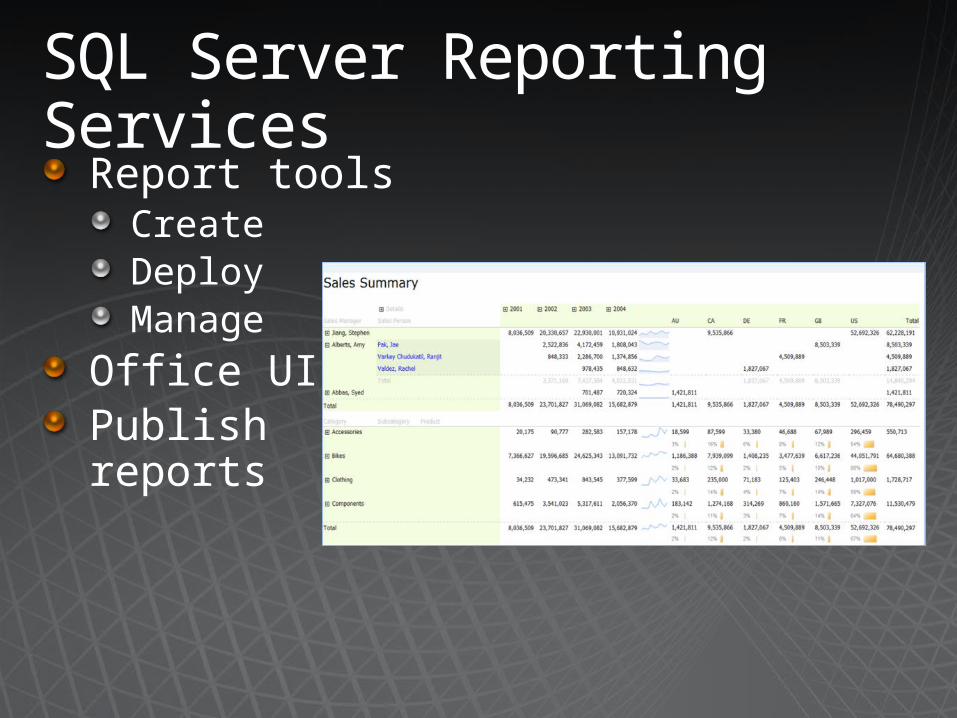
SQL Server Reporting Services
Report toolsCreateDeployManage
Office UIPublish reports

SharePoint 2010 BI Center
Center PanelDashboard libraryData Connections libraryDocuments libraryPerformancePoint Content list

Architecture

Physical Architecture
Custom
OLEDB ODBCSP
ListsSQL Excel
SQL Server
Reporting
Services
Visio Services
Excel Services
Publishing
Functions
BrowserPowerPoint 2007 &
2010
Excel 2007 & 2010
Farm
Client Access
Authoring
SharePoint 2010 Insights Services
Data Sources
WFE
AppSrv
DbSrv

Planning

Hardware and Software Platforms
64-bit ServersEnabling 2010 features will require more power!Dedicate SQL power to Logging DB and Web AnalyticsRecommended Hardware Requirements:
WFE and Apps Servers - Dual processor, 8 GB RAMSQL Server - Quad Core, 16 GB RAM
Recommended Software RequirementsClient – IE7 (IE8 preferred) / Fire Fox 3.5/ Safari for Mac browsers 64-bit Windows Server 2008 (or 2008 R2)64-bit SQL Server 2008 R2, 64-bit SQL Server 2008 or 64-bit SQL

Insights Tools PlanningUser Insights
• Personal• Self-service• Flexible
format. • Minimal IT
involvement.
Community Insights
• Team working• Promotion of
collaboration• Rapid
sharing.
Organizational Insights
• Organizational tools
• Manage goals, objectives, and metrics
• Synchronize effort
Visio & Visio Services
Excel and PowerPivot
Excel ServicesPerformancePoint
ServicesReport Builder
Reporting Services

Excel Services 2007 Architecture
TiersWeb Front EndApplication Server
ConfigurationsSimple - Single ServerComplex – Multiple Servers
Security Provided by SharePointPerformance and Scalability
Optimized for Multi-User AccessCaching at Multiple LevelsAllow/Disallow Data RefreshSettings to Limit Workbook Size or Request Duration

Excel Services 2007 Architecture
Web Front-EndSharePoint UIHTML Rendering and Web Services
Application ServerLoads Spreadsheets, Refreshes Data, Performs CalculationsMaintains State for InteractivityFile & Query Caches for Performance
The Office Servers ProvideSolution PlatformStore: Spreadsheets, Connection FilesManagement: Settings, UI, ScriptingSecurity: Authentication, Authorization
Web Front End
Excel Web Access (EWA) Web Part
Excel Web Services
ECS Proxy
Excel Calculation Server (ECS)
ECS Interface
Application Server
External Data Sources
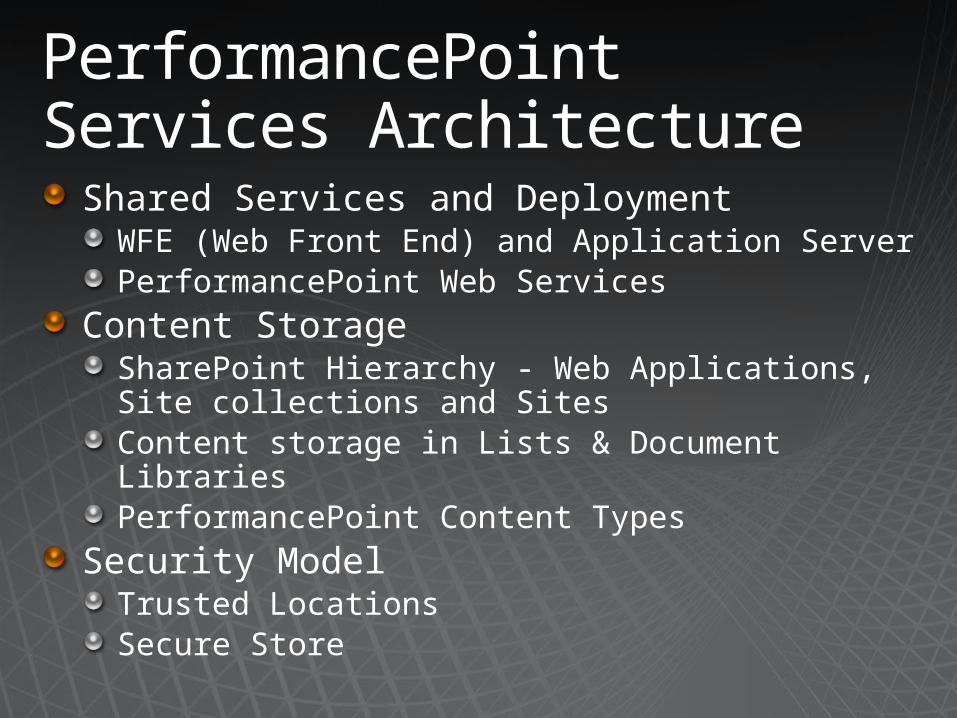
PerformancePoint Services Architecture
Shared Services and DeploymentWFE (Web Front End) and Application ServerPerformancePoint Web Services
Content Storage SharePoint Hierarchy - Web Applications, Site collections and SitesContent storage in Lists & Document LibrariesPerformancePoint Content Types
Security ModelTrusted LocationsSecure Store
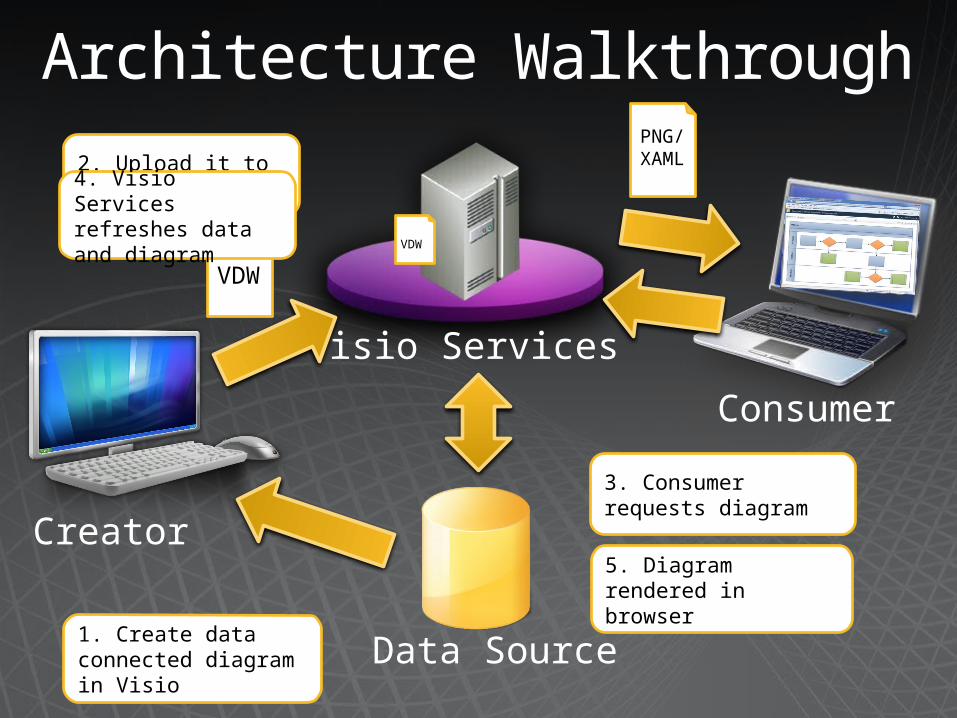
Architecture Walkthrough
Creator
Data Source
Visio Services
Consumer
VDW
PNG/ XAML
1. Create data connected diagram in Visio
2. Upload it to SharePoint
3. Consumer requests diagram
5. Diagram rendered in browser
4. Visio Services refreshes data and diagram VD
W

Visio Services Usage
When should you select Visio Services?
Integration Options Visio Web Access web partWeb Part ConnectionsVisio JavaScript Mash-up API
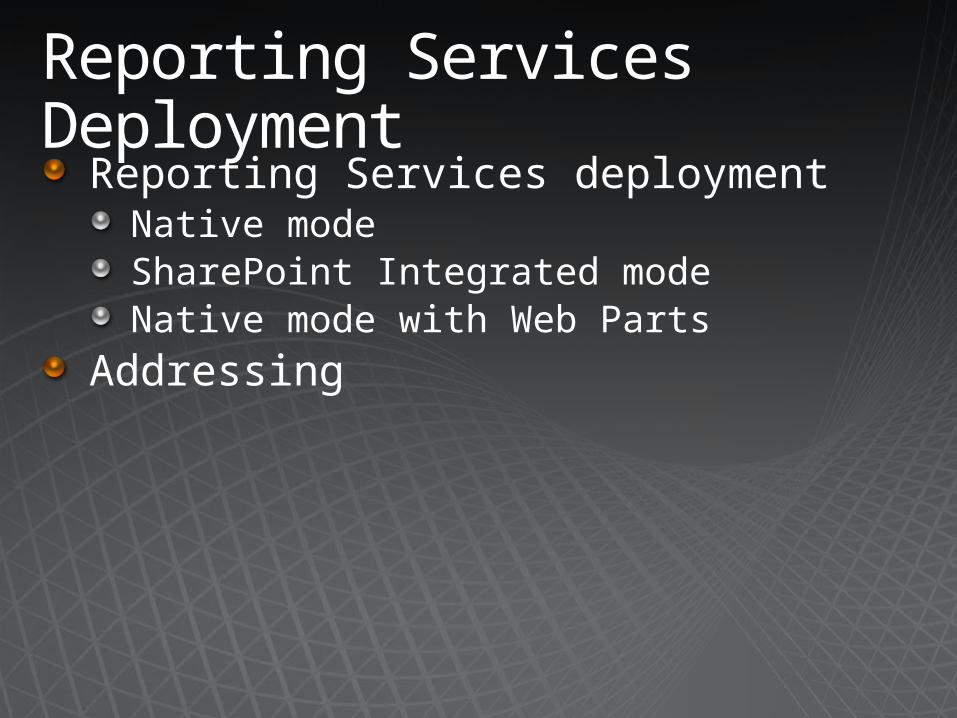
Reporting Services Deployment
Reporting Services deploymentNative modeSharePoint Integrated modeNative mode with Web Parts
Addressing