Embed Size (px)
Citation preview

8-Dec-02SMD157, Information
Visualization 1
L
Information Visualization
SMD157Human-Computer Interaction
Fall 2002
8-Dec-02SMD157, Information
Visualization 2
L Overview
• What is information visualization?• What do we need to do? • Guidelines for design of information seeking
applications• The human visual system• Perception plus the Gestalt principles• Coding of data
8-Dec-02SMD157, Information
Visualization 3
L
What is Information Visualization?

8-Dec-02SMD157, Information
Visualization 4
L Information versus Scientific Visualization
8-Dec-02SMD157, Information
Visualization 5
L Why Information Visualization?
• Comprehension• Context• Interaction• Patterns
8-Dec-02SMD157, Information
Visualization 6
L
What Do We Need to Do
Shneiderman’s Abstract Tasks

8-Dec-02SMD157, Information
Visualization 7
L What do we need to do?
• Overview• Zoom• Filter• Details-on-
demand• Relate• History• Extract
8-Dec-02SMD157, Information
Visualization 8
L What do we need to do?
• Overview• Zoom• Filter• Details-on-
demand• Relate• History• Extract
8-Dec-02SMD157, Information
Visualization 9
L What do we need to do?
• Overview• Zoom• Filter• Details-on-
demand• Relate• History• Extract

8-Dec-02SMD157, Information
Visualization 10
L What do we need to do?
• Overview• Zoom• Filter• Details-on-
demand• Relate• History• Extract
8-Dec-02SMD157, Information
Visualization 11
L What do we need to do?
• Overview• Zoom• Filter• Details-on-
demand• Relate• History• Extract
8-Dec-02SMD157, Information
Visualization 12
L What do we need to do?
• Overview• Zoom• Filter• Details-on-
demand• Relate• History• Extract

8-Dec-02SMD157, Information
Visualization 13
L What do we need to do?
• Overview• Zoom• Filter• Details-on-
demand• Relate• History• Extract
8-Dec-02SMD157, Information
Visualization 14
L
Guidelines for Designing Information Seeking Applications
8-Dec-02SMD157, Information
Visualization 15
L Guidelines
• Visualization is not always the best solution.• User tasks must be supported.• Three dimensions are not necessarily better
than two.• Navigation and zooming do not replace filtering.• The graphic method should depend on the data.• Multiple views should be coordinated.• Test your designs with users.

8-Dec-02SMD157, Information
Visualization 16
L Visualization Is Not Always the Best Solution
• Dedicated procedures are:- Faster- Less error prone
• Use visualization when:- User goals are less well-defined.- Good algorithms are lacking- The user needs to explore the data
8-Dec-02SMD157, Information
Visualization 17
L User Tasks Must Be Supported
• Specific support is better than general tools.• Example, comparing two directories
8-Dec-02SMD157, Information
Visualization 18
L Three Dimensions Are Not Necessarily Better Than Two
• Pros:- Extra continuous data dimension- Easier to separate coincident points
• Cons:- Increased navigation time- Occlusion- Judging size difficult

8-Dec-02SMD157, Information
Visualization 19
L Two Studies Using Three Dimensions
• Network Visualization, Ware and Franck• Hierarchical Visualization, Wiss and Carr
8-Dec-02SMD157, Information
Visualization 20
L Networks and 3D
• Compared four conditions- Static 2D view- 3D view, stereo perspective, static- 3D view, mono, head-coupled perspective- 3D view, stereo, head-coupled perspective
• Test to compare error rates in determining node connectivity
• Random networks, random pairs
8-Dec-02SMD157, Information
Visualization 21
L Sample Task
Are the two red
nodes connected?

8-Dec-02SMD157, Information
Visualization 22
L Experiment Results
Static, 2D
Stereo 3D
Head-coupled, mono 3D
Head-coupled, stereo 3D
8-Dec-02SMD157, Information
Visualization 23
L 3D Networks, Analysis
• The networks were random; this may not transfer to real networks.
• The 2D view was static; zooming, filtering, and selective highlighting may have given different results.
• Navigation was head-coupled, manipulating controls may affect the results.
• Still, it seems that head-coupled, stereo viewing helps people cope with visual complexity.
8-Dec-02SMD157, Information
Visualization 24
L Hierarchies and 3D
• Three 3D hierarchical visualizations:- Information Landscape- Cam Tree- Information Cube
• Three task types:- Search (Zoom task based)- Count (Relate task based, parent-child)- Compare (Overview task based)

8-Dec-02SMD157, Information
Visualization 25
L Hierarchies and 3D, Results
0
10
20
30
40
50
Sea
rch
Co
un
t
Co
mp
are
Successful Tasks
Info LandCam TreeInfo Cube
0
50
100
150
200
250
Sea
rch
Co
un
t
Co
mp
are
Time to Complete
Info LandCam TreeInfo Cube
8-Dec-02SMD157, Information
Visualization 26
L Hierarchies and 3D, Analysis
• Navigation time overriding factor- Task-based navigation support vital
• Occlusion contributes to errors and disorientation- Overview very important
• Study too short to comment on learning- Participants were still learning during the study.
• A good 2D visualization would have allowed doing the tasks by inspection.
8-Dec-02SMD157, Information
Visualization 27
L Navigation and Zooming Do Not Replace Filtering
• Filtering- Reduces data to be considered- Helps for studying items that are not adjacent- Supports logical identification of records
• Navigation and Zooming do not support:- Reduction on non-adjacent data- Logical identification
8-Dec-02SMD157, Information
Visualization 28
L The Graphic Method Should Depend on the Data
• 1-Dimensional- program source code- wrapped lines
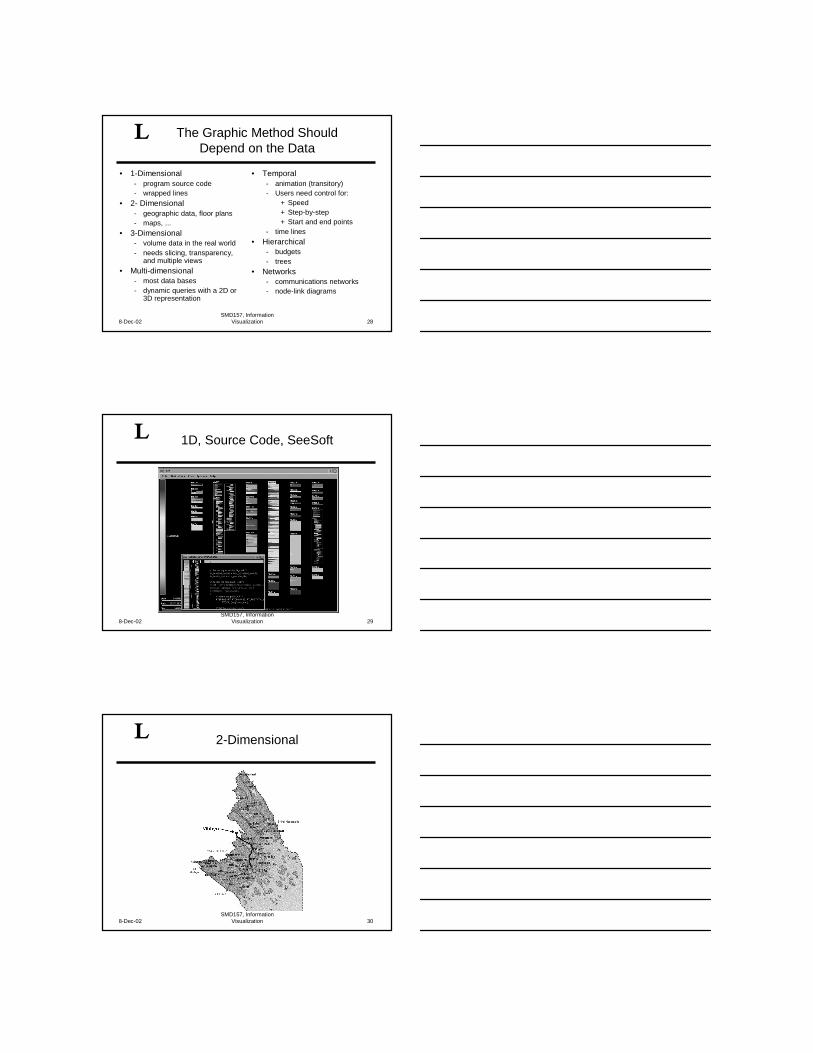
• 2- Dimensional- geographic data, floor plans- maps, ...
• 3-Dimensional- volume data in the real world- needs slicing, transparency,
and multiple views• Multi-dimensional
- most data bases- dynamic queries with a 2D or
3D representation
• Temporal- animation (transitory)- Users need control for:
+ Speed+ Step-by-step+ Start and end points
- time lines• Hierarchical
- budgets- trees
• Networks- communications networks- node-link diagrams
8-Dec-02SMD157, Information
Visualization 29
L 1D, Source Code, SeeSoft
8-Dec-02SMD157, Information
Visualization 30
L 2-Dimensional

8-Dec-02SMD157, Information
Visualization 31
L 3-Dimensional
• Special color coding• Slicing
8-Dec-02SMD157, Information
Visualization 32
L Temporal Data - LifeLines
8-Dec-02SMD157, Information
Visualization 33
L Multi-Dimensional

8-Dec-02SMD157, Information
Visualization 34
L Hierarchical
8-Dec-02SMD157, Information
Visualization 35
L Networks, SeeNet3D
8-Dec-02SMD157, Information
Visualization 36
L Multiple Views Should Be Coordinated
• Users need context to be maintained• Should be based on the data and not graphics

8-Dec-02SMD157, Information
Visualization 37
L Test Your Designs with Users
• There is little hard design knowledge about visualization.
• The existing knowledge is primarily from:- Laboratory settings- Novice use
• Best results are obtained with something tailored to your users and their tasks.
8-Dec-02SMD157, Information
Visualization 38
L
The Human Visual System
8-Dec-02SMD157, Information
Visualization 39
L Components of the System
• Three stage processing- The eye- 1st stage mental processing- 2nd stage mental processing
Perception for:actionspatial layout
Motor output,long-term motor memory
Object identificationVisual working memory
Natural language subsystem
Early Processing for contour, color, texture, and spatial cues.
Long-term object memory

8-Dec-02SMD157, Information
Visualization 40
L Characteristics of the Eye
• Two areas of vision- Central (fovea)
+ narrow field (.5°-2°), sharp, adapted for detail- Edges
+ wide field (perhaps 200°), fuzzy, adapted for motion
• Central focus “always” in motion (move-fixate-move)
• Uses differential processing- Method to adapt to a wide variety of light, color, ...
8-Dec-02SMD157, Information
Visualization 41
L Characteristics of Processing Centers
• 1st Stage- Operates in parallel- Extract environmental
features such as:+ Color+ texture
+ contour+ …
• 2nd Stage- Largely sequential- 2 parallel subsystems
+ Motor control
+ Language
8-Dec-02SMD157, Information
Visualization 42
L
Perception, plus the Gestalt Principles
We see with our minds,not our eyes!

8-Dec-02SMD157, Information
Visualization 43
L Pre-Attentive Processing
• Information that “pops out” must:- Use pre-attentive processing- Otherwise, one must think about it and this takes time
• Attributes must be processed early- Form, color, motion, position
• Time to process is independent of number of irrelevant objects (distracters).
8-Dec-02SMD157, Information
Visualization 44
L Pre-Attentive Processing, Example
8658972698469726897643589226598655453124685397
8658972698469726897643589226598655453124685397
Search for the 3’s
8-Dec-02SMD157, Information
Visualization 45
L Pre-Attentive Attributes, Details
• Form- Line orientation- Line length- Line width
- Deviation from collinear lines
- Size- Curvature
- Spatial grouping- Added marks
- Number of group symbols
• Color- Hue- Intensity
• Motion- Flicker- Direction
• Spatial Position- 2D position- Stereoscopic depth- Convex/concave shape
from shading

8-Dec-02SMD157, Information
Visualization 46
L Gestalt Principles
• Pragnanz: - Structure is seen as simply
as possible.
• Proximity:- Nearby objects tend to be
grouped.
• Similarity:- Similar items tend to be
grouped.
• Closure:- Nearby contours tend to be
united.
• Continuation:- Grouping tends to occur
along simple curves.
• Common fate:- Elements that move
together tend to be grouped.
• Familiarity:- The familiar or meaningful
tends to be grouped.
8-Dec-02SMD157, Information
Visualization 47
L
Coding of Data
8-Dec-02SMD157, Information
Visualization 48
L Three Types of Data
• Nominal (= or ≠, e.g., apples, oranges, pears)• Ordinal (< relation, e.g., 1st, 2nd, ...)
- Ordinal Time
• Quantitative (can do arithmetic)- Spatial- Geographical- Time

8-Dec-02SMD157, Information
Visualization 49
L Visual Structures for Data Presentation
• Spatial substrate- Up to three dimensions
• Position encoding techniques- Composition (orthogonal placement, the scatter plot)- Alignment - Folding (SeeSoft)- Recursion (e.g., the desktop metaphor)- Overloading (multiple plots in the same space, tiling)
8-Dec-02SMD157, Information
Visualization 50
L Composition
8-Dec-02SMD157, Information
Visualization 51
L Alignment

8-Dec-02SMD157, Information
Visualization 52
L Folding in SeeSoft
8-Dec-02SMD157, Information
Visualization 53
L Recursion
8-Dec-02SMD157, Information
Visualization 54
L Overloading

8-Dec-02SMD157, Information
Visualization 55
L Visual Structures
• Marks- Points, lines, areas, volumes
• Graphical attributes of the marks- Position (spatial)- Size- Gray Scale- Orientation- Color- Texture- Shape
Extent
Differential
Limited Extent,Differential
8-Dec-02SMD157, Information
Visualization 56
L Effectiveness of Graphical Attributes
Attribute Quantitative Ordinal NominalPosition + + +Size + + +Gray scale o + -Orientation o o +Color o o +Texture o o +Shape - - +
8-Dec-02SMD157, Information
Visualization 57
L Attribute Qualities
• Position- X, Y are strongest- Z interacts with size
• Size- Reasonable differences limit number of categories- Small differences can be perceived if adjacent and
the same shape.

8-Dec-02SMD157, Information
Visualization 58
L Attribute Qualities
• Gray scale- Hard to perceive many discrete steps (about 4 max.)- Interactions with background make absolute value
perception difficult
- Small differences are however relatively easy to detect
8-Dec-02SMD157, Information
Visualization 59
L Attribute Qualities, Color
• Subject to interference- Blue X and box are the same
color
- Blue+red causes focus problems
• People can recognize about 12 distinct colors
• These colors are culturally independent
• Summary- Especially good for categories
XX
whiteblack
redyellow green
green yellow
blue brown
pinkpurpleorangegray
8-Dec-02SMD157, Information
Visualization 60
L Attribute Qualities
• Orientation- Rotation can express
values
- Perception of absolute difference limited to about 45°
+ higher for adjacent symbols
- Perception tends to blend areas of nearly identical adjacent symbols
• Texture- Best adapted to
comparisons- Contrast/Intensity can give
some absolute values- Similar adjacent areas
blend
• Shape- No nature mapping to
value- Useful for nominal data
with many values

8-Dec-02SMD157, Information
Visualization 61
L Questions?
8-Dec-02SMD157, Information
Visualization 62
L References
• Card, S., Mackinlay, J., and Shneiderman, B. eds. Readings in Information Visualization Using Vision to Think, Morgan Kaufmann, 1999, ISBN 1-55860-533-9.
• Wiss, U. & Carr, D. An empirical study of task support in 3D information visualizations, Proceedings IEEE Conference on Information Visualization (IV’99), 392-399. (http://www.ida.liu.se/~davca/postscript/3visStudy.pdf)
• Carr, D., "Guidelines for Designing Information Visualization Applications", Proceedings of ECUE'99, Stockholm, Sweden, December 1-3, 1999. (http://www.ida.liu.se/~davca/postscript/VizGuidelines.pdf)
• Ware & Franck, Evaluating stereo and motion cues for visualizinginformation nets in three dimensions; ACM Trans. Graph. 15, 2, Apr. 1996), 121-140.
• Ware, Information Visualization: Perception for Design; Morgan Kaufmann, 2000, ISBN 1-55860-511-8.