Embed Size (px)
Citation preview

UNCTAD/SDTE/ECB/2005/1
UNITED NATIONS CONFERENCE ON TRADE AND DEVELOPMENT
Geneva
INFORMATION ECONOMY REPORT 2005
CHAPTER 1
UNITED NATIONS New York and Geneva, 2005

1
A. INTRODUCTION
The present chapter is concerned with informationsociety indicators, in terms of available statistics andof improving data and indicators in developing coun-tries. This is based on recognition of the increasingneed for reliable data and indicators regarding ICTreadiness, use and impact. Such data are crucial forformulating policies and strategies concerning ICT-driven or ICT-enabled growth, for social inclusionand cohesion, and for monitoring and evaluatingICT-related economic and social developments. Theyhelp companies take the right investment and busi-ness decisions and allow developing countries tobenchmark their information economies againstthose of other countries, both developed and devel-oping. Finally, they contribute to documenting theimpact of the information society on the implementa-tion of internationally agreed development goals (e.g.the Millennium Development Goals) and measuringprogress in the use of ICTs to achieve those goals.
The focus on the development of ICT statistical datastems from recent advances in measuring the infor-mation society at the international and regional levels,the increasing demand by policymakers and the inter-national community for quantitative assessment ofthe impact of ICT on development and growth, andthe attention the subject has attracted in internationalforums such as the World Summit on the Informa-tion Society (WSIS), the UN ICT Task Force and theUN Statistical Commission. It also reflectsUNCTAD’s ongoing work in this field, at both theanalytical and the capacity-building levels.
The chapter is divided into two main parts. In the firstpart, it presents the latest developments in the spreadand use of information and communication technol-ogy, particularly in e-business, as well as trade in ICTgoods, on the basis of available statistical data (sectionB). In the second part, it draws the reader’s attentionto the need to improve the availability of comparablestatistical data on ICT use and impact in developing
countries, and describes progress made in this regard,including by the secretariat of UNCTAD (section C).The chapter ends with some suggestions about howthe development of comparable statistics in develop-ing countries could be enhanced, for the purpose ofmonitoring and assessing the information society.
B. Global and regional trendsin ICT uptake
ICTs continue to spread in all parts of the world, par-ticularly in the developing world. As illustrated below,more people have access to the Internet and at ahigher speed, more have computers, and many morehave mobile phones. More enterprises use the Inter-net for streamlining their business processes, forreaching out to potential clients, and in general, forincreasing their competitive advantage. The contin-ued spread of ICTs increases opportunities for usersto benefit from the potential of ICTs for economicand social development.
At the same time, many of the poorest countries con-tinue to have very low ICT penetration rates, in par-ticular those with a large rural population and rela-tively high-priced basic ICT infrastructure. In thesecountries, the incorporation of ICT policies into thebroader national social and economic developmentagenda will be crucial for the development of theirinformation societies. They are also the countries thathave the greatest need for assistance in this process.
This part of the chapter will first discuss the latesttrends in basic ICT infrastructure and access, forexample with regard to the Internet, broadband, com-puters and mobile phones, from a developing countrypoint of view (section 1). These indicators, based ontime series data compiled by the ITU, are essential tothe development of an information economy. Thenfigures on the actual use of ICTs by enterprises will be
Chapter 1
ICT INDICATORS FOR DEVELOPMENT:TRENDS AND MEASUREMENT ISSUES

2 CHAPTER 1. ICT INDICATORS FOR DEVELOPMENT: TRENDS AND MEASUREMENT ISSUES
INFORMATION ECONOMY REPORT 2005
presented, such as Internet and web use, and thetypes of activities that businesses carry out over theInternet, including e-commerce (section 2). The sec-tion will present data from selected developed anddeveloping countries, drawing primarily from dataprovided by the Organisation for Economic Co-oper-ation and Development (OECD), Eurostat andUNCTAD. Section 3 will focus on recent develop-ments in the international trade of ICT goods, animportant sector in the development of the informa-tion economy, and will use trade data from the UNComtrade database. The classification of countriesfollows the UNCTAD Handbook of Statistics (2004)(see annex II).
1. Basic access to ICTs
Internet users
This section provides an overview of the number ofInternet users in selected regions and countries, basedon the latest available data. These data are based onestimates of all Internet users in a country, includingthose that use the Internet in public places, offices,Internet cafes, and so forth. In countries where nosurveys on Internet users are carried out, estimates
are typically made on the basis of the number of sub-scribers. The indicator does not provide informationon the intensity of Internet use, which would be bet-ter estimated by looking at the number of subscribers.In a developing country context, however, subscriberfigures could be understated since many users sharesubscriptions or use public localities to access theInternet.
Between 2003 and 2004, the total number of Internetusers continued to grow substantially (table 1.1 andannex I). At the end of 2004, most Internet userslived in Asia, followed by Europe. The United Statesstill accounts for the largest Internet population, with185 million users, about twice as many as China (insecond place). On the basis of higher growth rates,Europe has now overtaken North America in termsof the number of Internet users. Developing coun-tries continue to catch up (see chart 1.1), with thehighest growth rates in Africa. There has been a con-siderable surge in the number of Internet users inSouth-East Europe and the CIS countries, with agrowth rate of more than 70 per cent. The currenttake-up of ICTs in this region is also reflected in someof the other indicators presented below.
Table 1.1
Internet users by region and level of development, 2000-2004
2000% change 2000-2001 2001 % change
2001-2002 2002 % change 2002-2003 2003 % change
2003-2004 2004
RegionAfrica 4 314 700 36.2 5 876 800 57.5 9 255 620 41.5 13 096 650 66.6 21 813 872Asia 110 958 867 37.2 152 262 521 39.0 211 582 599 20.8 255 668 777 28.6 328 887 039Europe 107 999 345 27.6 137 834 925 23.9 170 817 495 17.9 201 324 310 20.7 242 951 272Latin America and
Caribbean 19 352 400 49.4 28 918 492 45.9 42 191 573 20.9 50 995 059 18.7 60 534 062
North America 136 971 000 14.5 156 823 000 11.1 174 200 000 2.9 179 232 400 14.4 205 000 000Oceania 8 182 800 16.7 9 545 400 31.4 12 544 450 8.3 13 581 400 21.1 16 445 726
Level of developmentDeveloped countries 285 429 829 20.7 344 585 162 16.7 402 012 514 7.8 433 307 644 15.8 501 756 193Developing countries 96 367 167 42.9 137 712 413 48.8 204 925 742 25.3 256 845 766 29.6 332 998 292South-East Europe and
CIS 5 982 116 49.8 8 963 563 52.3 13 653 481 73.9 23 745 186 72.2 40 877 486
Total 387 799 112 26.7 491 291 138 26.2 620 191 737 15.1 713 898 596 22.7 875 631 972
Source: UNCTAD calculations based on ITU World Telecommunication Indicators database, 2005.Note: For those countries that had not reported data for 2004 at the time of publication, the 2004 values were derived by averaging the growth of theprevious four years.

INFORMATION ECONOMY REPORT 2005
CHAPTER 1. ICT INDICATORS FOR DEVELOPMENT: TRENDS AND MEASUREMENTS ISSUES 3
Chart 1.1
Internet users by level of development, 2000-2004
At the regional level, Africa has very high growthrates (66 per cent), but many countries start fromrather low levels (table 1.2). The highest growth in thenumber of Internet users has been in Eritrea, Sudan,Morocco, Congo, Libya, Lesotho and Nigeria. Egypt,with 3.9 million users, has caught up with SouthAfrica (3.1 million users in 2002, no later datareported), and is now the country with the secondlargest number of Internet users in Africa.
In Asia, the top five countries together account forabout 75 per cent of all Internet users in the region(China, Japan, India, Republic of Korea and TaiwanProvince of China). China’s growth has slowed down,from 35 per cent between 2002 and 2003 to 18 percent between 2003 and 2004. The highest growthrates are in Myanmar, India, Turkey, Viet Nam andPakistan. The almost doubling of the number ofInternet users in India has contributed significantly tothe increase in Asia during this period.
In Europe, more than 50 per cent of Internet userslive in four countries (Germany, United Kingdom,Italy, and France). But the highest growth rates occurin Eastern European countries (such as Latvia,Ukraine and Bulgaria) and the Russian Federation.Western European countries usually have lowergrowth rates than the rest of Europe.
In the Americas, Brazil and Mexico, the two largesteconomies in the Latin American and Caribbeanregion, account for about 60 per cent of all Internetusers there. But the highest growth rates are found in
Central America and the Caribbean, a region that iscatching up with South America.
While the absolute number of Internet users providesimportant information about the dimensions andgrowth of national and regional Internet markets, fig-ures on Internet penetration (i.e. users per 100 inhab-itants) are crucial for assessing relative access to theInternet, in particular in population-rich countries(see annex I). Worldwide, 14.3 per cent of the popula-tion had access to Internet at the end of 2004. TheRepublic of Korea has overtaken the United Statesand now ranks number three worldwide (after NewZealand and Sweden), with a penetration rate of 65.7per cent. In China, the second largest Internet marketin 2004 as far as number of users is concerned, pene-tration is growing by 16.4 per cent. However, with 7.2per cent penetration, still only a small proportion ofthe Chinese population use the Internet.
The gap between developed and developing countriescontinues to be impressive, as shown in table 1.3,although developing countries are slowly catching up,because of their high growth rates. Only 3.1 per centof Africans had access to the Internet in 2004, com-pared with 62.6 per cent of North Americans. Therelatively low figure for Europe (EU 25) is largely dueto the low penetration rates in some of the EasternEuropean countries, whereas the EU15 country aver-age is 50 per cent (the exception being Greece, whichhas both low penetration and low growth rates)(Eurostat, 2005). At the same time, many of the
Source: UNCTAD calculations based on the ITU World Telecommunication Indicators database, 2005.

4 CHAPTER 1. ICT INDICATORS FOR DEVELOPMENT: TRENDS AND MEASUREMENT ISSUES
INFORMATION ECONOMY REPORT 2005
Table 1.2
Internet users by region, 2000-2004 (top 10 countries/territories)sorted by decreasing order of 2003 values
Country/territory 2000 % change 2000-2001 2001 % change
2001-2002 2002 % change 2002-2003 2003 % change
2003-2004 2004
Egypt 450 000 33.3 600 000 216.7 1 900 000 57.9 3 000 000 30.0 3 900 000Kenya 100 000 100.0 200 000 100.0 400 000 150.0 1 000 000 .. ..Morocco 200 000 100.0 400 000 75.0 700 000 42.9 1 000 000 250.0 3 500 000Sudan 30 000 86.7 56 000 50.0 84 000 1 015.5 937 000 21.7 1 140 000Zimbabwe 50 000 100.0 100 000 400.0 500 000 60.0 800 000 2.5 820 000Nigeria 80 000 43.8 115 000 265.2 420 000 78.6 750 000 .. ..Tunisia 260 000 57.7 410 000 23.3 505 500 24.6 630 000 32.5 835 000United Rep. of Tanzania 40 000 50.0 60 000 33.3 80 000 212.5 250 000 .. ..Côte d'Ivoire 40 000 75.0 70 000 28.6 90 000 166.7 240 000 .. ..Senegal 40 000 150.0 100 000 5.0 105 000 114.3 225 000 .. ..Africa total 4 314 700 36.2 5 876 800 57.5 9 255 620 41.5 13 096 650 66.6 21 813 872
China 22 500 000 49.8 33 700 000 75.4 59 100 000 34.5 79 500 000 18.2 94 000 000Japan 38 000 000 28.7 48 900 000 17.0 57 200 000 7.7 61 600 000 21.8 75 000 000Rep. of Korea 19 040 000 28.0 24 380 000 7.8 26 270 000 11.2 29 220 000 8.1 31 580 000India 5 500 000 27.3 7 000 000 136.9 16 580 000 11.5 18 481 044 89.4 35 000 000Taiwan Province of China 6 260 000 24.9 7 820 000 37.1 10 720 000 9.5 11 740 000 4.0 12 210 000
Malaysia 4 977 000 27.5 6 346 650 23.5 7 840 640 10.5 8 661 000 14.1 9 878 214Indonesia 1 900 000 121.1 4 200 000 7.1 4 500 000 79.6 8 080 000 .. ..Thailand 2 300 000 53.7 3 536 019 35.7 4 800 000 25.6 6 030 000 15.6 6 970 000Turkey 2 000 000 75.0 3 500 000 22.9 4 300 000 39.5 6 000 000 70.3 10 220 000Iran (Islamic Rep. of) 625 000 60.8 1 005 000 215.2 3 168 000 51.5 4 800 000 .. ..Asia total 110 893 867 37.2 152 185 521 38.9 211 402 599 20.8 255 448 777 28.7 328 887 039
United Kingdom 15 800 000 25.3 19 800 000 26.3 25 000 000 37.6 34 400 000 9.3 37 600 000Germany 24 800 000 4.8 26 000 000 7.7 28 000 000 17.9 33 000 000 25.0 41 263 000Italy 13 200 000 18.2 15 600 000 27.6 19 900 000 15.0 22 880 000 26.2 28 870 000France 8 460 000 85.0 15 653 000 19.6 18 716 000 17.0 21 900 000 14.2 25 000 000Russian Federation 2 900 000 48.3 4 300 000 39.5 6 000 000 66.7 10 000 000 60.0 16 000 000Spain 5 486 000 34.7 7 388 000 6.3 7 856 000 24.6 9 789 000 32.8 13 000 000Poland 2 800 000 35.7 3 800 000 133.7 8 880 000 1.0 8 970 000 0.3 9 000 000Netherlands 7 000 000 12.9 7 900 000 3.8 8 200 000 3.7 8 500 000 17.6 10 000 000Sweden 4 048 000 13.6 4 600 000 11.4 5 125 000 10.3 5 655 000 20.2 6 800 000Belgium 3 000 000 6.7 3 200 000 6.3 3 400 000 17.6 4 000 000 5.0 4 200 000Europe total 107 999 345 27.6 137 834 925 23.9 170 817 495 15.3 196 944 310 23.4 242 951 272
Brazil 5 000 000 60.0 8 000 000 78.8 14 300 000 25.9 18 000 000 22.2 22 000 000Mexico 5 058 000 46.5 7 410 124 45.3 10 764 715 13.5 12 218 830 14.9 14 036 475Argentina 2 600 000 40.4 3 650 000 12.3 4 100 000 10.5 4 530 000 13.0 5 120 000Chile 2 537 308 22.3 3 102 200 15.2 3 575 000 11.9 4 000 000 7.5 4 300 000Peru 800 000 150.0 2 000 000 20.0 2 400 000 18.8 2 850 000 13.0 3 220 000Colombia 878 000 31.4 1 154 000 73.3 2 000 113 36.6 2 732 201 31.2 3 585 688Venezuela 820 022 40.5 1 152 502 10.6 1 274 429 51.8 1 934 791 19.5 2 312 683Costa Rica 228 000 68.4 384 000 108.3 800 000 12.5 900 000 11.1 1 000 000

INFORMATION ECONOMY REPORT 2005
CHAPTER 1. ICT INDICATORS FOR DEVELOPMENT: TRENDS AND MEASUREMENTS ISSUES 5
Source: UNCTAD calculations based on ITU World Telecommunication Indicators database, 2005.
Country/territory 2000 % change 2000-2001 2001 % change
2001-2002 2002 % change 2002-2003 2003 % change
2003-2004 2004
Dominican Rep. 327 118 21.5 397 333 25.8 500 000 30.0 650 000 23.1 800 000Ecuador 180 000 85.0 333 000 61.5 537 881 5.9 569 727 9.6 624 579Latin America and
Caribbean total 19 372 400 49.4 28 948 492 44.4 41 791 573 22.0 50 995 059 18.7 60 534 062
United States 124 000 000 15.2 142 823 000 11.3 159 000 000 1.7 161 632 400 14.5 185 000 000Canada 12 971 000 7.9 14 000 000 8.6 15 200 000 15.8 17 600 000 13.6 20 000 000North America total 136 971 000 14.5 156 823 000 11.1 174 200 000 2.9 179 232 400 14.4 205 000 000
Australia 6 600 000 16.7 7 700 000 36.4 10 500 000 7.6 11 300 000 15.0 13 000 000New Zealand 1 515 000 16.3 1 762 000 8.3 1 908 000 10.6 2 110 000 51.7 3 200 000New Caledonia 30 000 33.3 40 000 25.0 50 000 20.0 60 000 16.7 70 000Fiji 12 000 25.0 15 000 233.3 50 000 10.0 55 000 .. ..French Polynesia 15 000 0.0 15 000 33.3 20 000 75.0 35 000 .. ..Micronesia 4 000 25.0 5 000 20.0 6 000 66.7 10 000 20.0 12 000Vanuatu 4 000 37.5 5 500 27.3 7 000 7.1 7 500 0.0 7 500Solomon Islands 2 000 0.0 2 000 10.0 2 200 13.6 2 500 .. ..Marshall Islands 0 800 12.5 0 900 38.9 1 250 12.0 1 400 .. ..Oceania total 8 182 800 16.7 9 545 400 31.4 12 544 450 8.3 13 581 400 20.6 16 383 400
Table 1.2 (continued)
Table 1.3
Internet penetration by region and level of development, 2000-2004
2000% change 2000-2001 2001
% change 2001-2002 2002
% change 2002-2003 2003
% change 2003-2004 2004
RegionAfrica 0.7 33.3 0.9 54.2 1.4 38.5 1.9 63.1 3.1Asia 3.1 35.5 4.2 37.3 5.7 19.4 6.8 27.1 8.7Europe 14.7 27.6 18.8 23.9 23.3 17.9 27.5 20.7 33.2Latin America and Caribbean 3.9 47.3 5.7 43.8 8.2 19.2 9.7 17.1 11.4North America 43.5 13.4 49.3 10.0 54.2 1.9 55.3 13.3 62.6Oceania 32.8 15.3 37.9 29.9 49.2 7.0 52.6 19.7 63.0
Level of developmentDeveloped countries 30.7 20.1 36.9 16.0 42.8 7.2 45.9 15.2 52.9Developing countries 2.1 40.8 3.0 46.7 4.4 23.6 5.4 27.9 6.9South-East Europe and CIS 1.8 50.2 2.7 52.7 4.2 74.4 7.2 72.6 12.5
Total 6.6 25.2 8.3 24.8 10.4 13.7 11.8 21.3 14.3
Source: UNCTAD calculations based on ITU World Telecommunication Indicators database, 2005.Note: For those countries that had not reported data for 2004 at the time of publication, the 2004 values were derived by averaging the growth of theprevious four years.

6 CHAPTER 1. ICT INDICATORS FOR DEVELOPMENT: TRENDS AND MEASUREMENT ISSUES
INFORMATION ECONOMY REPORT 2005
Eastern European countries have on average veryhigh growth rates, and it is thus expected that theywill catch up quickly with the rest of Europe.
Broadband
Broadband access to the Internet has become a regularfeature in developed countries’ enterprises. By speed-ing up all Internet-related business activities, such astransferring web pages and data files, handling cus-tomer requests or automating supply chain manage-ment, broadband enables companies to work moreefficiently and respond quickly to customers’ needs.For certain e-business solutions, broadband has thusbecome indispensable.1 Broadband access also allowscompanies to have multipurpose telecommunicationslines, which can be particularly attractive to SMEs. Italso supports the outsourcing of certain applications,distance learning and telecommuting. In some indus-tries, such as media and entertainment, which involve
the exchange of large data files, broadband is particu-larly important.
In a number of countries, mostly developed coun-tries, policymakers have recognized the role of broad-band in the spread and use of ICTs, including its abil-ity to accelerate the contribution of ICTs toeconomic growth, and are taking action to foster thedevelopment and effective use of broadband at thenational level (OECD, 2004; European Commission,2005).
Available data for 2003 cover 98 countries (and for2004, 83 countries), but data for many developingcountries, especially in Latin America, are missing.Nevertheless, a few important observations can bemade.
First of all, the top five broadband countries, meas-ured by number of subscribers in 2004, were theUnited States, Japan, the Republic of Korea, China
Table 1.4Top 25 countries/territories in terms of broadband subscribers, 2001-2004
sorted by decreasing order of 2004 values
Country/territory 2001% change 2001-2002 2002
% change 2002-2003 2003
% change 2003-2004 2004
United States 12 792 812 55.4 19 881 549 26.3 25 110 000 50.9 37 890 646Japan 3 835 000 145.0 9 397 426 58.7 14 917 165 25.1 18 660 000China 339 510 1 480.8 5 367 000 96.0 10 519 000 61.0 16 935 000Rep. Of Korea 7 806 000 33.3 10 405 486 7.4 11 178 000 4.7 11 700 000Germany 2 100 000 52.6 3 205 000 42.3 4 560 000 51.4 6 905 159France 601 500 179.8 1 682 992 112.1 3 569 381 89.2 6 754 035United Kingdom 501 000 263.5 1 821 000 75.7 3 200 000 95.5 6 256 300Canada 2 836 000 23.9 3 515 000 28.4 4 513 000 24.8 5 631 714Italy 390 000 117.9 850 000 158.8 2 200 000 113.7 4 701 252Taiwan, China 1 133 000 85.3 2 100 000 44.9 3 043 273 23.3 3 751 214Spain 430 055 190.1 1 247 496 76.5 2 202 000 56.3 3 441 630Netherlands 466 200 129.3 1 068 966 86.0 1 988 000 61.3 3 206 000Brazil 331 000 120.8 731 000 64.0 1 199 000 88.2 2 256 000Australia 122 800 110.2 258 100 132.6 600 400 157.9 1 548 300Hong Kong, China 716 435 45.0 1 038 995 18.4 1 230 607 23.0 1 513 103Sweden 356 500 100.9 716 085 35.1 967 464 34.7 1 302 861Switzerland 140 000 225.2 455 220 72.2 783 874 53.3 1 202 000Belgium 458 759 89.4 868 994 30.6 1 135 000 .. ..Israel 38 000 444.7 207 000 214.0 650 000 64.6 1 070 000Denmark 223 276 97.3 440 492 63.0 718 000 41.2 1 013 500Chile 59 975 214.2 188 454 257.8 674 305 35.4 913 172Mexico 50 000 254.0 177 000 .. .. .. 840 147Austria 320 600 68.3 539 500 11.4 601 000 36.4 820 000Finland 52 000 426.0 273 500 79.6 491 100 62.9 800 000Portugal 96 324 169.4 259 491 93.9 503 119 31.6 661 948
Source: UNCTAD calculations based on ITU World Telecommunication Indicators database, 2005.

INFORMATION ECONOMY REPORT 2005
CHAPTER 1. ICT INDICATORS FOR DEVELOPMENT: TRENDS AND MEASUREMENTS ISSUES 7
and Germany (see table 1.4). As far as penetrationrates are concerned, the Republic of Korea is still theworld leader (with 24.6 out of 100 inhabitants), fol-lowed by Hong Kong (China) and the Netherlands(see table 1.5). European countries have high pene-tration growth rates and are overtaking Canada,Japan and Taiwan Province of China. Eurostat data
show wide variations in broadband uptake in house-holds, led by Scandinavian countries (Iceland with 45per cent, Denmark 36 per cent and Norway 30 percent). At the other end of the range are countriessuch as Cyprus (2 per cent) and Ireland (3 per cent).This belies broadband uptake by EU enterprises (seesection 2.a).
Table 1.5.
Broadband penetration, 2000-2004 (selected countries/territories)
Broadband subscribers per 100 inhabitantssorted by decreasing order of 2004 values
Country/territory 2000 % change 2000-2001 2001 % change
2001-2002 2002 % change 2002-2003 2003 % change
2003-2004 2004
Republic of Korea 8.4 97.6 16.6 32.7 22.0 7.0 23.6 4.3 24.6Hong Kong, China 6.7 59.1 10.7 43.3 15.3 17.1 17.9 21.6 21.7Netherlands 1.6 82.3 2.9 128.1 6.7 85.0 12.3 60.5 19.8Denmark 1.1 278.7 4.2 96.6 8.2 62.5 13.3 40.7 18.7Iceland 0.8 358.8 3.7 130.6 8.5 65.0 14.0 32.2 18.5Canada 4.6 98.9 9.2 22.7 11.2 27.1 14.3 23.5 17.6Switzerland 0.6 224.5 1.9 224.3 6.3 71.8 10.8 53.0 16.6Taiwan Province of China 1.0 407.1 5.1 84.3 9.3 44.3 13.5 22.8 16.6Norway 0.5 291.1 2.0 130.6 4.5 92.3 8.7 88.1 16.3Israel .. .. 0.6 433.6 3.3 207.8 10.0 61.5 16.2Finland 0.4 150.5 1.0 424.5 5.3 79.0 9.4 62.4 15.3Japan 0.7 330.4 3.0 144.6 7.4 58.5 11.7 24.9 14.6Sweden 0.9 345.0 4.0 100.1 8.0 34.5 10.8 34.1 14.5United States 2.5 78.3 4.5 53.9 6.9 25.1 8.6 49.5 12.8Singapore 1.9 94.0 3.7 76.0 6.5 54.1 10.0 20.0 12.0France 0.3 236.9 1.0 178.7 2.8 111.2 5.9 88.4 11.2Belgium 1.2 270.0 4.4 89.0 8.4 30.3 10.9 .. ..United Kingdom .. .. 0.9 262.2 3.1 75.1 5.4 94.9 10.5Austria 2.4 64.7 4.0 67.9 6.6 11.1 7.4 36.1 10.0Macao, China 0.8 173.2 2.2 71.9 3.8 62.7 6.1 61.8 9.9Luxembourg .. .. 0.3 362.6 1.3 165.9 3.4 183.9 9.6Andorra .. .. .. .. 1.7 212.3 5.4 73.7 9.4Estonia .. .. 1.3 166.4 3.4 75.1 5.9 41.0 8.4Germany 0.3 749.2 2.5 52.5 3.9 42.1 5.5 51.3 8.4Italy 0.2 237.4 0.7 117.6 1.5 158.5 3.8 113.4 8.1Spain 0.2 423.0 1.0 186.6 3.0 74.3 5.2 54.5 8.1Australia 0.4 59.1 0.6 107.8 1.3 130.1 3.0 155.1 7.8Portugal 0.3 212.4 0.9 168.0 2.5 92.9 4.8 30.9 6.3Chile .. .. 0.4 210.6 1.2 253.9 4.2 34.0 5.7Malta 0.4 481.0 2.3 92.1 4.5 28.0 5.7 .. ..New Zealand 0.1 347.6 0.4 149.1 1.1 88.6 2.1 128.4 4.8Dominica .. .. 0.2 82.5 0.4 727.2 3.4 22.4 4.1Bahamas .. .. .. .. 6.3 - 44.8 3.5 15.4 4.0Hungary .. .. 0.2 458.7 1.1 137.7 2.6 41.0 3.7Ireland .. .. .. .. 0.3 287.1 1.0 216.8 3.3

8 CHAPTER 1. ICT INDICATORS FOR DEVELOPMENT: TRENDS AND MEASUREMENT ISSUES
INFORMATION ECONOMY REPORT 2005
Source: UNCTAD calculations based on ITU World Telecommunication Indicators database, 2005.
Table 1.5. (continued)
Country/territory 2000 % change 2000-2001 2001 % change
2001-2002 2002 % change 2002-2003 2003 % change
2003-2004 2004
Slovenia .. .. 0.3 931.4 2.9 2.2 2.9 .. ..Lithuania .. .. 0.1 727.5 0.6 235.1 1.9 24.5 2.4Latvia .. .. 0.1 211.0 0.4 96.4 0.8 152.9 2.1Poland .. .. 0.0 914.6 0.3 59.3 0.5 319.3 2.1Cyprus .. .. 0.3 132.2 0.7 68.6 1.2 31.7 1.6El Salvador .. .. .. .. .. .. 0.3 380.1 1.4Qatar .. .. .. .. 0.0 1 127.8 0.4 239.2 1.4China .. .. 0.0 1 470.2 0.4 94.8 0.8 60.0 1.3Argentina .. .. 0.2 34.0 0.3 102.1 0.6 110.0 1.3Brazil .. .. 0.2 117.7 0.4 61.7 0.7 85.6 1.2Belize .. .. .. .. .. .. 0.4 228.8 1.2Malaysia .. .. 0.0 372.9 0.1 459.6 0.5 125.1 1.0Slovak Republic .. .. .. .. .. .. 0.1 538.2 0.9Kuwait .. .. 0.2 101.6 0.4 19.6 0.5 49.0 0.8Czech Republic .. .. 0.1 147.0 0.1 126.9 0.3 118.3 0.7Turkey .. .. 0.0 91.5 0.0 827.1 0.3 142.4 0.7Costa Rica .. .. .. .. 0.0 3 920.7 0.4 84.3 0.7Grenada .. .. .. .. 0.6 112.9 1.2 - 49.4 0.6Panama .. .. 0.1 88.3 0.3 90.6 0.5 19.4 0.6Peru .. .. 0.0 368.2 0.1 168.4 0.3 45.4 0.5Greece .. .. .. .. .. .. 0.1 361.4 0.4Romania .. .. 0.0 164.3 0.1 126.0 0.2 158.2 0.4Trinidad & Tobago .. .. .. .. 0.0 476.6 0.1 347.5 0.4Maldives .. .. .. .. 0.1 158.2 0.2 39.1 0.2Mauritius .. .. .. .. 0.0 311.8 0.1 126.4 0.2Morocco .. .. .. .. 0.0 33.0 0.0 2 259.9 0.2Colombia .. .. 0.0 148.2 0.1 37.3 0.1 84.7 0.2South Africa .. .. .. .. 0.0 655.3 0.0 193.6 0.1Suriname .. .. .. .. 0.0 79.6 0.0 145.5 0.1Nicaragua .. .. 0.0 41.7 0.0 86.1 0.1 11.3 0.1Ecuador .. .. .. .. .. .. 0.1 65.6 0.1Moldova .. .. .. .. 0.0 43.3 0.0 300.6 0.1Gabon .. .. .. .. .. .. 0.0 1 051.9 0.0Egypt .. .. .. .. 0.0 407.8 0.0 492.8 0.0Armenia .. .. .. .. 0.0 25.5 0.0 9 936.7 0.0Tunisia .. .. .. .. .. .. 0.0 8.4 0.0India .. .. 0.0 62.2 0.0 67.7 0.0 64.9 0.0Vanuatu .. .. .. .. .. .. 0.0 50.4 0.0Sudan .. .. .. .. .. .. 0.0 37.4 0.0Burkina Faso .. .. .. .. 0.0 180.8 0.0 2.9 0.0Benin .. .. .. .. .. .. 0.0 195.1 0.0

INFORMATION ECONOMY REPORT 2005
CHAPTER 1. ICT INDICATORS FOR DEVELOPMENT: TRENDS AND MEASUREMENTS ISSUES 9
Second, China has experienced the most spectaculargrowth in the number of broadband subscribers: fromclose to zero (2001) to 17 million subscribers (2004)(see chart 1.2). This makes China the country with thesecond largest number of broadband subscribers, afterthe United States and Japan. Although broadbandpenetration in China has almost doubled comparedwith 2003, the country is still at the bottom of the list,with 1.3 subscribers per 100 inhabitants in 2004.
Third, with regard to developing country regions,only Asia has any significant broadband penetration.Even though subscriber growth rates in Africa andLatin America are very high, it will take years beforethey reach the subscriber levels of Asia, Europe orNorth America. Especially in Africa, the number ofbroadband subscribers in most countries is extremelysmall, and penetration rates are less than 1 per centeven in countries that are more advanced in ICT, suchas South Africa, Mauritius, Egypt and Tunisia.
The digital divide in terms of broadband in many lessdeveloped countries could have serious implicationsfor their enterprises as far as fully embracing ICTs isconcerned. While previous research has demon-strated that dial-up access is sufficient for companiesto start moving online, using e-mail and hosting abasic informational website, more advanced applica-tions of ICTs, such as online ordering, customeracquisition and retention, finance and account man-agement, product service and support, or logisticsand inventory control, will benefit significantly fromhigh-speed access (UNCTAD, 2004). These are alsothe areas where most ICT-related productivity gains
will be achieved. For many SMEs in developing coun-tries, which do not currently have such access, theleap towards a more integrated adoption of ICTs inbusiness processes will thus heavily depend onimproved access to the Internet, in terms of bothquality and speed.
Computers
Even though the Internet is increasingly beingaccessed through a variety of devices, computers arestill by far the most important gateway to the Inter-net. Computers are indispensable for the develop-ment of the information economy and in particularfor the application of ICT in e-business processes. Anin-depth presentation of the presence of computersin developing countries is limited by the availabledata. Estimates about the number of PCs in countriesare usually based on shipments (i.e. computers sold)or, if this information is not available, imports, cou-pled with a realistic replacement rate.2 The latter obvi-ously differs among countries, with many developingcountries having significantly lower rates. Thenumber of PCs by country is shown in annex I, whiletable 1.6 shows the penetration of PCs by region andlevel of country development.
The following observations can be made about thespread of computers:
• There is continued growth in the number ofcomputers worldwide. In 2003, the highestgrowth was in developing countries/someemerging economies (such as China, Brazil, theRussian Federation, Mexico, India, the IslamicRepublic of Iran and Malaysia). When it comesto computer penetration, however, these coun-tries rank very low; for example, China at 3.7per cent, Brazil at 8.9 per cent and India at 0.9per cent – similar to most low-income coun-tries.
• Switzerland leads in terms of penetration, with74.2 computers per 100 inhabitants in 2003,followed by Singapore and Sweden.
• There are huge gaps among countries: forexample, in 2003 the Republic of Korea had26.7 million PCs, compared with only 11.5 mil-lion PCs in the whole of Africa. Some Africancountries have very few computers; for exam-ple, Malawi reported 15,800 computers for2003. Similarly, computer penetration rates arelowest for Africa (1.4 per cent), compared with66.8 per cent for North America.
Chart 1.2Broadband subscribers in China and
the United States, 2001-2004
Source: Unctad calculations based on ITU World Telecom-munications Indicators database, 2005

10 CHAPTER 1. ICT INDICATORS FOR DEVELOPMENT: TRENDS AND MEASUREMENT ISSUES
INFORMATION ECONOMY REPORT 2005
Tabl
e 1.
6
Pers
onal
com
pute
r pen
etra
tion
by re
gion
and
leve
l of d
evel
opm
ent,
2000
-200
4
Sour
ce: U
NCTA
D ca
lculat
ions b
ased
on IT
U W
orld
Telec
ommu
nicati
on In
dicato
rs da
tabas
e, 20
05.
Note
: For
thos
e cou
ntries
that
had n
ot re
porte
d data
for 2
004 a
t the t
ime o
f pub
licati
on, th
e 200
4 valu
es w
ere d
erive
d by a
vera
ging t
he gr
owth
of the
prev
ious f
our y
ears.
2000
% C
hang
e20
01%
Cha
nge
2002
% C
hang
e20
03%
Cha
nge
2004
Num
berP
CsPe
netra
tion
2000
-200
1Nu
mbe
rPcs
Pene
tratio
n20
01-2
002
Num
berP
CsPe
netra
tion
2002
-200
3Nu
mbe
rPCs
Pene
tratio
n20
03-2
004
Num
berP
CsPe
netra
tion
Regi
on
Afric
a7'0
47'76
00.9
9.67'8
91'75
11.0
18.1
9'521
'025
1.217
.711
'448'7
131.4
13.4
13'25
7'266
1.6
Asia
113'9
12'80
03.2
16.1
133'9
09'40
03.7
15.6
156'6
38'50
04.3
17.9
186'9
37'85
05.1
17.2
221'6
53'61
46.0
Euro
pe13
1'642
'887
18.3
11.5
146'7
19'00
020
.412
.516
5'020
'000
23.0
12.1
185'0
09'30
825
.719
.822
1'567
'577
30.8
Latin
Ame
rica
and t
he C
aribb
ean
24'47
5'500
4.919
.629
'712'0
005.8
14.7
34'56
7'409
6.717
.241
'099'4
367.8
13.9
47'48
6'964
8.9
North
Ame
rica
173'9
00'00
055
.29.4
192'2
00'00
060
.45.8
205'3
00'00
063
.94.5
216'6
63'53
666
.810
.824
2'390
'000
74.0
Ocea
nia10
'794'6
1535
.79.0
11'92
9'721
38.9
9.113
'189'2
0042
.46.7
14'25
5'760
45.2
11.9
16'15
6'861
50.6
Leve
l of d
evelo
pmen
t
Deve
loped
coun
tries
343'5
69'00
037
.010
.538
1'564
'000
40.9
7.941
3'988
'000
44.1
7.744
8'292
'647
47.5
16.0
522'7
85'28
955
.1
Deve
loping
coun
tries
105'8
00'07
52.3
17.6
126'2
43'87
22.7
19.0
152'3
61'63
43.2
20.3
185'9
14'17
03.8
13.1
213'2
43'86
84.3
South
-Eas
tEu
rope
and C
IS
12'40
4'487
4.617
.914
'554'0
005.4
23.5
17'88
6'500
6.719
.121
'207'7
867.9
25.5
26'48
3'125
10.0
Tota
l 46
1'773
'562
7.911
.752
2'361
'872
8.810
.558
4'236
'134
9.710
.965
5'414
'603
10.8
15.0
762'5
12'28
212
.4

INFORMATION ECONOMY REPORT 2005
CHAPTER 1. ICT INDICATORS FOR DEVELOPMENT: TRENDS AND MEASUREMENTS ISSUES 11
• On the basis of 2003 values, the United Statesand Canada combined had more computersthan all of Europe or all of Asia.
Overall, the computer penetration rates are very simi-lar to the Internet penetration rates presented earlier.However, it is important to bear in mind that these fig-ures do not represent the number of computer users.Computers are often shared and the rate of sharing indeveloping countries is higher than in developed coun-tries. This is particularly the case at the household andindividual user level, but even small enterprises in ruralareas often access computers in local village commu-nity centres and similar public places. In the absence ofbetter data on the use of computers, the above figuressuggest that the gap in computer use penetration ratesbetween developed and developing countries is smallerthan the gap in Internet user penetration rates. Thisleaves further room for increasing Internet user pene-tration in developing countries, based on computeraccess, given the same number of computers.
Mobile phones
One of the most significant developments in thespread of ICTs during the past few years is the stun-
ning growth of mobile phone access in all parts of theworld, surpassing the number of fixed telephone linesin many countries. Given that an estimated 77 percent of the world’s population is able to access mobilenetworks, the number of cell phone subscribersworldwide continues to increase at a very rapid rate,with the most significant growth being in developingcountries (see table 1.7) (World Bank, 2005) 3. What ismost significant, however, is that in 2003 developingcountries overtook developed countries in terms ofabsolute numbers of cellular subscribers, mainlybecause of Asian developing countries (e.g. China andIndia). This makes mobile phones the only ICT indi-cator where developing countries have higher sharesthan developed countries (see chart 1.3).
In order to get a more realistic picture of the distribu-tion of mobile phones among users, penetration rates,i.e. subscribers per 100 inhabitants, need to be takeninto consideration. Although these are lower in thedeveloping world, accounting for 17.8 per cent onlywhen compared to the developed world with 77.5 percent (table 1.8), the trend remains positive.
Table 1.7
Mobile phone subscribers by region and level of development, 2000-2004
2000% change 2000-2001 2001
% change 2001-2002 2002
% change 2002-2003 2003
% change 2003-2004 2004
RegionAfrica 15'633'872 63.6 25'583'344 45.3 37'170'404 38.0 51'313'043 56.1 80'103'000Asia 256'460'391 40.6 360'685'744 39.1 501'832'608 19.3 598'435'765 24.7 745'993'223Europe 275'415'270 23.5 340'171'811 13.1 384'594'128 15.9 445'853'766 23.0 548'367'260Latin America and
Caribbean61'463'003 34.7 82'777'855 20.2 99'474'308 24.7 124'042'755 39.5 173'001'627
North America 118'358'031 17.6 139'177'512 9.8 152'763'842 12.6 171'949'981 14.0 196'089'531Oceania 10'213'768 32.9 13'573'551 12.0 15'203'646 13.0 17'179'776 15.1 19'778'880
Level of developmentDeveloped countries 464'565'999 18.9 552'325'810 9.0 602'046'769 10.0 662'394'988 11.8 740'630'471Developing
countries261'776'686 47.8 386'979'017 41.9 548'974'336 23.5 677'854'370 32.0 894'932'102
South-East Europe and CIS
11'201'650 102.3 22'664'990 76.6 40'017'831 71.2 68'525'728 86.5 127'770'948
Total 737'544'335 30.4 961'969'817 23.8 1'191'038'936 18.3 1'408'775'086 25.2 1'763'333'520
Source: UNCTAD calculations based on ITU World Telecommunication Indicators database, 2005.Note: For those countries that had not reported data for 2004 at the time of publication, the 2004 values were derived by averaging the growth of theprevious four years.
12 CHAPTER 1. ICT INDICATORS FOR DEVELOPMENT: TRENDS AND MEASUREMENT ISSUES
INFORMATION ECONOMY REPORT 2005
An important consideration here, however, is that indeveloping countries a single mobile phone is fre-quently shared by several people, particularly in poor,rural communities, and people at all income levels areable to access mobile services either through owning aphone or using someone else’s. In India, for example,drivers pedal rickshaws equipped with mobile phonesby a national mobile phone company throughout thestate of Rajasthan offering mobile phone services for
a fee.4 In other words, one subscriber could have manyusers, a fact which is not captured by the data providedhere (see also box 1.1). That said, full penetration bymobile telephony is desired as much in developed as indeveloping countries.
Table 1.9 shows the mobile phone penetration rate inthe top 10 countries in each region, next to the regionaverage. Annex I contains the data on mobile phone
Chart 1.3
Mobile phone subscribers by level of development, 2000-2004
2000% change 2000-2001 2001
% change 2001-2002 2002
% change 2002-2003 2003
% change 2003-2004 2004
RegionAfrica 2.0 60.1 3.2 42.1 4.5 35.1 6.1 52.9 9.4Asia 7.0 38.9 9.8 37.4 13.4 17.8 15.8 23.2 19.5Europe 37.5 23.5 46.4 13.1 52.4 15.9 60.8 23.0 74.7Latin America and Caribbean 12.0 32.7 15.9 18.4 18.8 22.9 23.1 37.5 31.8North America 37.6 16.4 43.8 8.7 47.6 11.5 53.0 13.0 59.9Oceania 40.9 31.3 53.8 10.7 59.5 11.7 66.5 13.8 75.7
Level of development Developed countries 49.7 18.2 58.8 8.4 63.7 9.4 69.7 11.2 77.5Developing countries 5.5 45.6 8.0 39.8 11.2 21.7 13.7 30.2 17.8South-East Europe
and CIS 3.3 102.8 6.8 77.0 12.0 71.7 20.5 86.9 38.4
Total 12.3 28.8 15.8 22.3 19.3 16.9 22.6 23.7 27.9
Table 1.8
Mobile phone penetration by region and level of development, 2000-2004Mobile phone subscribers per 100 inhabitants (weighted averages)
Source: UNCTAD calculations based on ITU World Telecommunication Indicators database, 2005.Note: For those countries that had not reported data for 2004 at the time of publication, the 2004 values were derived by averaging the growth of theprevious four years.
Source: Unctad calculations based on ITU World Telecommunications Indicators database, 2005

INFORMATION ECONOMY REPORT 2005
CHAPTER 1. ICT INDICATORS FOR DEVELOPMENT: TRENDS AND MEASUREMENTS ISSUES 13
Country/territory 2000 % change 2000-2001 2001 % change
2001-2002 2002 % change 2002-2003 2003 % change
2003-2004 2004
Réunion 39.5 45.8 57.6 14.4 65.9 13.4 74.7 .. ..Seychelles 32.0 41.2 45.2 18.3 53.4 11.3 59.5 2.2 60.8South Africa 19.1 26.8 24.2 24.5 30.1 20.6 36.4 18.6 43.1Botswana 12.2 54.4 18.8 34.5 25.3 17.5 29.7 5.7 31.4Mauritius 15.1 50.5 22.7 26.7 28.8 -7.2 26.7 54.9 41.4Morocco 8.2 100.5 16.4 27.8 20.9 16.8 24.4 23.0 30.1Gabon 9.8 21.4 11.9 80.8 21.5 4.4 22.4 61.3 36.2Mayotte 0.0 - 0.0 .. 13.5 59.2 21.6 5.5 22.8Tunisia 1.3 222.9 4.0 45.9 5.9 235.4 19.4 84.8 35.9Mauritania 0.6 603.7 4.2 118.1 9.2 38.3 12.8 37.5 17.5Africa total 2.0 60.1 3.2 42.1 4.5 35.1 6.1 52.9 9.4
Taiwan Province of China 80.2 21.2 97.2 11.4 108.3 5.4 114.0 -12.3 100.0Hong Kong (China) 81.7 5.1 85.9 9.7 94.3 14.5 108.0 6.0 114.5Israel 70.2 29.2 90.7 5.3 95.5 0.7 96.0 9.1 104.7Singapore 68.4 5.9 72.4 9.9 79.6 7.2 85.0 5.3 89.5Macao (China) 32.1 38.9 44.5 40.4 62.5 29.8 81.0 14.3 92.6United Arab Emirates 44.0 24.5 54.7 18.2 64.7 13.7 74.0 14.5 84.7Rep. of Korea 58.3 5.2 61.4 10.7 67.9 3.2 70.0 8.7 76.1Japan 52.6 11.7 58.8 8.3 63.7 6.7 68.0 5.3 71.6Bahrain 32.4 42.7 46.2 25.2 57.9 10.3 64.0 37.4 87.9Kuwait 21.7 77.5 38.6 34.5 51.9 10.1 57.0 35.2 77.1Asia Total 7.0 38.9 9.8 37.4 13.4 17.8 15.8 23.2 19.5
Luxembourg 69.2 34.6 93.1 14.0 106.1 12.6 119.4 .. ..Italy 73.7 19.8 88.3 6.3 93.9 8.4 103.3 5.9 109.4Sweden 71.8 12.3 80.6 10.3 88.9 10.3 98.1 5.3 103.2Iceland 76.5 13.1 86.5 4.8 90.6 6.6 96.8 2.8 99.4Czech Republic 42.3 60.6 68.0 24.9 84.9 13.7 96.5 9.2 105.3Portugal 66.5 16.1 77.2 6.9 82.5 16.8 96.4 6.1 102.3United Kingdom 72.7 6.0 77.0 9.1 84.1 8.4 91.2 12.8 102.8Finland 72.0 11.6 80.4 7.9 86.7 4.9 91.0 5.1 95.6Norway 74.8 11.1 83.1 1.5 84.4 7.7 90.9 .. ..Greece 56.2 33.8 75.2 12.5 84.5 6.7 90.2 11.5 100.6Europe total 37.5 23.5 46.4 13.1 52.4 15.9 60.8 23.0 74.7
Jamaica 14.2 71.3 24.4 118.9 53.3 27.7 60.6 35.7 82.2Saint Vincent 2.1 213.0 6.5 31.0 8.5 519.7 52.9 -11.0 47.1Barbados 10.6 86.0 19.8 82.5 36.1 43.7 51.9 21.6 63.1Chile 22.4 53.1 34.2 25.1 42.8 19.4 49.4 25.7 62.1
Table 1.9
Mobile phone penetration, regional country/territory performance, 2000-2004(Top 10 countries)
sorted by decreasing order of 2003 values

14 CHAPTER 1. ICT INDICATORS FOR DEVELOPMENT: TRENDS AND MEASUREMENT ISSUES
INFORMATION ECONOMY REPORT 2005
subscribers and penetration for all countries. Withregard to regional differences, Africa is catching up ingeneral terms, but one fourth of subscribers are inSouth Africa. The top four countries (South Africa,Morocco, Nigeria and Egypt) account for 57 per centof all subscribers in the region. Very high subscribergrowth rates can be observed in many countries, suchas Algeria, Nigeria, Ghana and Sudan, to name thelarger ones. The small countries start from very lowlevels. However, if we look at penetration rates, eventhe highest rate, which is in South Africa (at 43 percent, followed by Mauritius, Gabon, Tunisia and Bot-swana), is still low compared with some Europeancountries, which have approximately one mobilephone per inhabitant (e.g. Italy, the Czech Republic,Sweden, the United Kingdom and Portugal). Tunisiahas experienced a surge in mobile phone penetration,
from only 6 per cent (2002) to 36 per cent (2004),mainly owing to the deregulation of the market andthe subsequent fall in prices.5 Other countries thathave both high penetration growth and penetrationrates above 10 per cent, are Algeria, Mauritania andNamibia.
In Asia, China is clearly the outstanding case in termsof absolute numbers, with about 45 per cent of allsubscribers in the region. It is followed by Japan,India, the Republic of Korea, Turkey, the Philippines,Indonesia and Thailand. While Taiwan Province ofChina and Hong Kong (China) are the two econo-mies with the highest penetration rates in the region,with more than one subscriber per inhabitant (reflect-ing double subscriptions), mainland China has a pen-etration rate of 25 per cent. Meanwhile, India andPakistan, with a penetration rate of 4.4 per cent and
Country/territory 2000 % change 2000-2001 2001 % change
2001-2002 2002 % change 2002-2003 2003 % change
2003-2004 2004
Grenada 4.6 40.9 6.4 11.1 7.1 428.1 37.6 11.7 42.1Trinidad & Tobago 12.5 57.5 19.7 41.2 27.8 43.5 37.3 32.9 49.6Bahamas 10.3 90.8 19.7 97.8 39.0 -6.1 36.7 60.0 58.7Suriname 9.5 109.1 19.8 13.9 22.5 42.2 32.0 51.4 48.5Paraguay 14.9 36.6 20.4 41.3 28.8 3.5 29.9 - 50.3 14.9Mexico 14.2 54.1 21.9 17.4 25.8 14.4 29.5 24.3 36.6Latin America and Caribbean total 12.0 32.7 15.9 18.4 18.8 22.9 23.1 37.5 31.8
United States 38.9 15.7 45.0 8.6 48.9 11.7 54.6 11.7 61.0Canada 28.8 20.4 34.7 10.0 38.2 9.7 41.7 13.3 47.2North America total 37.6 16.4 43.8 8.7 47.6 11.5 53.0 13.0 59.9
Australia 44.7 28.5 57.4 11.4 64.0 12.8 72.2 14.5 82.6New Zealand 40.0 47.5 59.0 5.4 62.2 4.3 64.8 19.6 77.5New Caledonia 23.3 33.1 31.0 15.3 35.7 18.7 42.4 18.4 50.2Fiji 6.8 46.5 9.9 10.2 11.0 21.3 13.3 .. ..Samoa 1.4 -1.0 1.4 6.9 1.5 285.0 5.8 .. ..Micronesia .. .. .. .. 0.1 5752.7 5.4 111.8 11.5Vanuatu 0.2 -6.6 0.2 1263.3 2.4 55.0 3.8 28.9 4.8Marshall Islands 0.9 7.8 0.9 11.2 1.0 6.7 1.1 .. ..Kiribati 0.4 29.5 0.5 23.3 0.6 4.5 0.6 .. ..Solomon Islands 0.3 -18.3 0.2 0.5 0.2 38.8 0.3 .. ..Oceania total 40.9 31.3 53.8 10.7 59.5 11.7 66.5 13.8 75.7
World total 12.3 28.8 15.8 22.3 19.3 16.9 22.6 23.7 27.9
Source: UNCTAD calculations based on ITU World Telecommunication Indicators database, 2005.
Table 1.9 (continued)

INFORMATION ECONOMY REPORT 2005
CHAPTER 1. ICT INDICATORS FOR DEVELOPMENT: TRENDS AND MEASUREMENTS ISSUES 15
3.2 per cent respectively, are at the bottom level ofpenetration. Countries/territories with high mobilephone penetration growth between 2003 and 2004include Kazakhstan, Palestine, Syria, Azerbaijan andSri Lanka.
Brazil and Mexico account for about 60 per cent of allcellular subscribers in the Latin American and theCaribbean region, but their penetration rates, at 36.3per cent and 36.6 per cent respectively, are not amongthe highest but are just about average for the region.The small States of the Caribbean have the highestpenetration rates, together with Chile. Similarly, aswith the number of Internet users, the countries inthe Caribbean and Central America have the highestgrowth rates in the region as far as mobile phone pen-etration is concerned, in addition to their overallalready higher penetration levels. Exceptions here areCuba and Haiti, which are at the bottom of the listwith almost 0 per cent (Cuba) and 4 per cent (Haiti).
With regard to other regions, it is worthwhile pointingout the dynamics of the countries of South-EastEurope and the Commonwealth of IndependentStates, which have on average the highest growth ratefor mobile subscribers. Mobile subscribers in theUnited States and Canada are growing in numbers butare still only at half the penetration rate of manyEuropean countries.
The substantial growth of mobile telephony in devel-oping countries is largely explained by the fact thatmobile phones are more widely accessible to userscompared with fixed line telephony, for which waiting
periods can be up to two years (ITU, 2003). Further-more, mobile telephony has contributed to reducingthe costs of telecommunications and facilitating theconnection of rural areas. This continued growth canhave significant implications for economic develop-ment in these countries. Apart from plenty of anecdo-tal evidence about how mobile phones have createdbusiness opportunities for the poor, there is anemerging literature examining the link between theuse of mobile phones and economic growth in devel-oping countries (Torero et al., 2002; Sridhar and Srid-har, 2004). According to a recent study by researchersat the London School of Economics, an increase of10 mobile phones per 100 people in African develop-ing countries would increase GDP growth by 0.6 percent (Waverman et al., 2005).
It is argued that mobile telephony is the informationand communication technology that has the most sig-nificant impact on development, particularly in devel-oping and least developed countries. In these coun-tries, mobile phones are used for more than simplecommunication, often as a business tool by means ofwhich producers and buyers can shop around forprices and vendors can be paid.6 The importanceaccorded to these economic benefits is reflected inthe larger share of income that developing countryusers spend on telecommunications as compared withusers in developed countries. African countries, andparticularly sub-Saharan ones, are a good example ofthis (see box 1.1). The number of mobile phone sub-scribers in Africa increased from 15 million in 2000 toover 80 million in 2004, an increase of 433 per cent(table 1.7).
Box 1.1
Use of mobile phones by African businesses
A recent study surveyed the use of mobile phones among small businesses (under 50 employees) in rural and urban communities in Egyptand South Africa (Waverman et al., 2005). In those countries, tradesmen such as bricklayers and painters advertise themselves by giving amobile phone number, taxi drivers are contacted by phone, and retailers avoid unnecessary travel by pre-shopping over the phone forsupplies. The study found that the large majority of small businesses used mobiles (85 per cent in Egypt and 89 per cent in South Africa)and had overtaken fixed-line phones and other communication tools, despite the relatively higher price for mobile telephone calls.Nonetheless, it is significant that many of the businesses had no form of telephone access before the acquisition of a mobile phone, and inthe South African sample, 85 per cent of the businesses depended solely on mobiles. Nearly a third of the businesses also indicated thattheir start-up was partly influenced by the availability of mobile phones, particularly in the service sector, and that higher spending was notdetrimental to profitability. In fact, this spending was compensated for by greater efficiency, and a larger number of customers and turnover,all of which were indicated by the majority of the businesses surveyed.

16 CHAPTER 1. ICT INDICATORS FOR DEVELOPMENT: TRENDS AND MEASUREMENT ISSUES
INFORMATION ECONOMY REPORT 2005
2. ICT access and use in enterprises
In its E-Commerce and Development Report 2004,UNCTAD noted that the focus on measuring e-com-merce transactions might divert attention from meas-uring other uses of ICTs in businesses and thereforeprovide only limited information on the adoption ofICTs by enterprises. Therefore, increasing attention isbeing paid to the measurement of e-business – ormore broadly the use of ICTs in enterprises for a vari-ety of business activities that go beyond e-commerce.Many of the efficiency gains related to the adoptionof ICTs result from changes in business processes,such as logistics and inventory control, order fulfil-ment and tracking, and customer acquisition andretention. Also, the growing adoption of ICTs bybusinesses in developing countries can be analysedfor its impact on development, and better data onICT readiness, use and impact are needed in order todesign, implement and evaluate ICT developmentpolicies.
In that context, the UNCTAD secretariat launched anannual data collection exercise, starting with the E-Commerce and Development Report 2004, to com-pile e-business statistics from developing countries.On the basis of the list of core ICT indicators agreedupon at the WSIS Thematic Meeting on “Measuringthe Information Society” (see section C), an extendedgroup of selected developing countries were surveyedin 2005 regarding their e-business statistics.7 Whilethe data are still very limited, they give an initial indi-cation on the adoption of ICTs by enterprises indeveloping countries. OECD and Eurostat providecomplementary data on developed countries. A tablesummarizing the information available from selectedeconomies can be found in annex I, table 6.
Internet access and use
In developed countries, a very high proportion ofenterprises are connected to the Internet. Eighty-nineper cent of enterprises in EU countries are con-nected. There are however significant differencesbetween European countries; for example, Denmarkand Finland report that 97 per cent of enterprises areconnected to the Internet while Romania (a EU can-didate country) reports 52 per cent. Some differencesalso persist between SMEs and large enterprises (seechart 1.4). As a group, OECD countries also showhigh proportions of Internet access by enterprises.Among non-European members, for example, Aus-tralia reported 88.6 per cent, New Zealand reported84 per cent and Canada reported 82 per cent (2004).
It is harder to obtain comparable information onInternet access by enterprises in developing countries.The diversity of surveys conducted in developingcountries affects the comparability between countriesand prevents from drawing conclusions at theregional level, or for developing countries as a whole.Several developing countries report high percentagesof Internet access by enterprises, on a par with devel-oped countries, such as the Republic of Korea (94 percent), Trinidad and Tobago (77 per cent) and Singa-pore (76 per cent). Others report very low propor-tions, such as Mauritius (5 per cent) and Thailand (9per cent). The reference years for the data reportedvary from 2001 to 2004, and the samples vary fromeconomy-wide to focused on specific sectors, such asmanufacturing. In some cases, samples are made uppredominantly of small enterprises. There is virtuallyno information on Internet access by enterprises dis-aggregated by urban or rural areas, although it is likelythat results for some countries have a strong biastowards urban areas, which tend to concentrate over-all ICT infrastructure and commercial activities (datafor Morocco’s survey, for example, was disaggregatedby major cities and towns).
Nonetheless, in the cases in which data are disaggre-gated according to the size of enterprises, it appearsthat also in developing countries access to Internet ismore prevalent among larger businesses. Since smalland medium-sized enterprises represent a significantshare of developing economies, it is important to lookat the weight they have in the overall picture of ICT
Chart 1.4
Proportion of EU 15 enterprises with access to the Internet by size,2002-2004
Source: Eurostat database, 2005.

INFORMATION ECONOMY REPORT 2005
CHAPTER 1. ICT INDICATORS FOR DEVELOPMENT: TRENDS AND MEASUREMENTS ISSUES 17
uptake in these countries. In Thailand, for example,although the overall proportion of business access toInternet is merely 9 per cent in a survey with an over-whelming share of microenterprises, the proportionincreases tenfold among large enterprises to 90 percent, as shown in table 1.10.
Regarding modes of access to the Internet in enter-prises, these are not always equally defined and thereare significant differences among countries, depend-ing on the availability of certain technologies. Forexample, in Europe the broadband roll-out is gather-ing speed and is overtaking ISDN.8 Eurostat datashow that the percentage of enterprises with Internetin the EU 15 that had broadband access grew from46 per cent in 2003 to 61 per cent in 2004. For theEU 25, the percentage was of 58 per cent in 2004.Although the proportion of enterprises with broad-band access increases with the size of the enterprise,recent growth in adoption has been stronger amongSMEs (see chart 1.5).
The data received from developing countries indicatethat many businesses connect to the Internet throughan analogue modem (87.8 per cent in Colombia and74.5 per cent in Moldova) or with fixed line connec-tions under 2 Mbps (76.7 per cent in Morocco).Notable exceptions are some Asian countries/territo-ries: Hong Kong SAR reports that 31.9 per cent ofbusinesses have fixed line connections over 3 Mbpsrather than 2 Mbps; Macao SAR reports that 75 percent of businesses connect through ADSL; and theRepublic of Korea reports that 98 per cent of busi-nesses connect through fixed line connections of 2Mbps or more, including XDSL, dedicated lines andcable modem. Classifications for modes of access thatwere provided by countries, although not requestedby the UNCTAD survey, include dedicated and leasedlines, cable modem and wireless connections, includ-ing mobiles.
Regarding the proportion of businesses with a web-site (or a web presence over which the business hascontrol with regard to content), 58 per cent of busi-nesses in the European Union have them. IncludingEU candidate countries, the same differences that canbe found with respect to Internet access can also befound in terms of websites; the largest proportion isfound in Denmark, with 81 per cent, and the lowest isfound in Romania, with 19 per cent (35 per cent ofbusinesses that have Internet). Also, as in the case ofInternet access, the prevalence of websites is higherthe larger the enterprise: 53 per cent of small compa-nies, 76 per cent of medium-sized companies and 89per cent of large companies.
Among developing countries reporting data, propor-tions of businesses with Internet that have a websiteare generally lower, the lowest being Colombia with
Number of Employees1-15 16-25 26-30 31-50 51-200 200+
Number of enterprises in the survey 800'425 12'096 2'793 5'879 6'556 2'119
Proportion of businesses using the Internet (%) 7.2 45.6 52.6 59.4 73.3 90.1
Table 1.10
Proportion of businesses using the Internet in Thailand, 2003
Source: UNCTAD e-business database 2005.
Chart 1.5
Proportion of EU 15 entreprises with access to the Internet having
broadband access, by size, 2003-2004
Source: Eurostat database, 2005.

18 CHAPTER 1. ICT INDICATORS FOR DEVELOPMENT: TRENDS AND MEASUREMENT ISSUES
INFORMATION ECONOMY REPORT 2005
12 per cent and the highest Trinidad and Tobago,with 57.6 per cent. Where disaggregated data areavailable, aside from the presence of websites accord-ing to size of companies, which follows a trend simi-lar to that for more developed countries, the presenceof websites can vary significantly among industrialclassifications and can affect the weighted total. Forexample, Chile reported an overall proportion of 8.6per cent, although approximately 73 per cent of utilitycompanies (electricity, gas and water supply) had web-sites. In the Philippines, with a proportion of 10 percent overall, it is the financial intermediation sectorthat reported the highest proportion of websites, with26.4 per cent. Other sectors that reported higher orlower proportions of businesses with websites, rang-ing from 25 to 70 per cent, were real estate, rentingand business activities (Chile, Colombia, Hong KongSAR, Thailand), education (Russian Federation),heavy industry (Republic of Korea), and post and tel-ecommunications (Romania).
E-commerce
E-commerce, understood as placing and receivingorders over the Internet and other networks,9 contin-ues to grow in most countries, although exact data on
the value of e-commerce sales and purchases are notvery common, in particular on a time-series basis.
In the United States, the largest global e-commercemarket, e-commerce sales (including both Internetand other networks) continued to grow during 2003(see table 1.11). E-commerce is most prominent inmanufacturing shipments, followed by wholesaletrade (accounting for 21.1 per cent and 13.1 per centof total sales respectively). Online sales are less com-mon in retail trade (B2C) or in services industries,with 1.7 per cent and 1 per cent of total sales respec-tively. However, with a growth rate significantlyhigher than for total retail trade, the share of e-com-merce in total retail trade is also growing. The latestavailable figures (2005) indicate that its share hasmore than doubled since 2000.10
In Canada, Internet sales continued to increase sub-stantially reaching $22.9 million (C$ 28.3 billion) in2004, primarily on the basis of private sector sales(see table 1.12). Seventy-five per cent of Internet salesis B2B, up from 68 per cent in 2003, mainly betweenlarge firms, whereas small firms tend to sell more tohouseholds. As far as industries are concerned, onequarter of all Internet sales took place in the whole-
2003% change2002-2003 2002 % change
2001-2002 2001% change2000-2001 2000
Manufacturing e-commerce E-commerce 842'666 12.1 751'985 3.7 725'149 -4.1 755'807Total manufacturing 3'979'917 1.5 3'920'632 -1.3 3'970'500 -5.7 4'208'582E-commerce share in total manufacturing 21.2 10.4 19.2 5.0 18.3 1.7 18.0
Wholesale trade e-commerceE-commerce 386'922 12.7 343'327 26.1 272'183 12.9 241'109Total wholesale trade 2'946'473 4.3 2'824'417 4.3 2'708'666 -1.2 2'742'593E-commerce share in total wholesale trade 13.1 8.0 12.2 21.0 10.0 14.3 8.8
Retail e-commerceE-commerce 55'731 24.7 44'706 30.5 34'263 21.7 28'152Total retail 3'275'407 4.3 3'141'468 -0.5 3'156'754 3.2 3'059'173E-commerce share in total retail 1.7 19.6 1.4 31.1 1.1 17.9 0.9
Selected services e-commerceE-commerce 49'945 21.3 41'185 10.5 37'261 -0.1 37'312Total selected services 5'076'846 4.3 4'868'907 2.3 4'759'796 2.4 4'647'156E-commerce share in total selected services 1.0 16.3 0.8 8.1 0.8 -2.5 0.8
Table 1.11
E-commerce sales in the United States, 2000-2003 (million USD)
Source: US Bureau of Census, 2005.

INFORMATION ECONOMY REPORT 2005
CHAPTER 1. ICT INDICATORS FOR DEVELOPMENT: TRENDS AND MEASUREMENTS ISSUES 19
sale trade sector, followed by transportation andwarehousing (17 per cent).11
Other than for North America, available informationon the value of e-commerce is fragmentary, althoughthere appears to be clear growth. Eurostat data indi-cate that e-commerce sales over the Internetincreased from 0.9 per cent in 2002 to 2.2 per cent in2004.12 The highest shares were reported by enter-prises in Ireland (12.9 per cent), which has an impor-tant software sector, and Denmark (4.4 per cent).When online sales using other networks (in particularEDI) are added, the value increases from 6.2 per centto 7.7 per cent over the same period (UnitedKingdom 12.5 per cent, Denmark 8.5 per cent andIreland 8.3 per cent). Partial data also indicate that thepercentage of enterprises’ total turnover from e-com-merce increased from 5.9 per cent in 2003 to 9.4 percent in 2004. Compilations by the OECD suggestthat online sales represent a small but growing shareof total sales in most member countries, and thatthere is solid growth in B2C e-commerce (OECD,2004). Because of the current difficulties in deter-mining, collecting and comparing data on the value ofe-commerce even in developed countries, these dataare not currently included in the core list of indicators(see box 1.3) nor are they requested of countries inthe UNCTAD survey.
In the case of developing countries, information onthe value of e-commerce is virtually non-existent, aswell as measures of the share of e-commerce in theturnover of enterprises. Only some developing coun-tries covered by the UNCTAD survey were able toprovide information on businesses receiving ordersover the Internet (see annex I, table 6). However, as ageneral observation, countries reported fewer ordersbeing received than placed, the main country receiv-ing orders being Singapore (33.7 per cent), followedby Trinidad and Tobago (21.9 per cent) and Colombia(15.3 per cent).13
There is, however, more information from developedcountries. In 2004, 15 per cent of enterprises in theEU 15 received orders over the Internet, as comparedwith 10 per cent in 2003. However, in 2004 the pro-portion for the 25 EU countries was 15 per cent. Theproportion of enterprises selling online increases withthe size of the company, since 29 per cent of largeenterprises placed orders as compared with medium-sized enterprises (19 per cent) and small enterprises(12 per cent). Among non-European OECD coun-tries, Japan reported in 2002 the largest percentage ofbusinesses receiving orders over the Internet (18 percent), although this refers only to enterprises with 100or more employees, while Australia reported 13 percent in the same year. Chart 1.6 illustrates the propor-tion of enterprises placing and receiving orders overthe Internet in selected countries.
Regarding online purchases, 27 per cent of EU 25enterprises reported having placed orders over theInternet in 2004, almost double that of online sales.The proportion was greater for large enterprises, 45per cent of which reported online purchases. This isconfirmed by data from selected OECD countries,which report a much larger proportion of businessespurchasing products and placing orders online thanthere were selling or receiving orders. The developingcountries that reported the largest proportions ofonline purchases, of businesses with Internet wereSingapore (45.5 per cent), Trinidad and Tobago (42.0per cent) and the Republic of Korea (25.5 per cent).
Other e-business
As regards other e-business, there is limited but grow-ing information on the use of ICT by enterprises forinternal business processes, and on the use of theInternet by type of activity. As may be expected,developed countries collect more advanced e-busi-ness data and more frequently, since they are also
2000
% change2000-2001 2001
% change2001-2002 2002
% change2002-2003 2003
% change2003-2004 2004
Private sector 4'496 14.2 5'134 70.7 8'762 68.0 14'716 45.5 21'419
Public sector 90 62.1 146 46.2 214 187.0 613 148.7 1'524
Total 4'586 15.1 5'280 70.0 8'976 70.8 15'329 49.7 22'944
Table 1.12
Internet sales in Canada, 2000-2004 (million USD)
Source: Statistics Canada, 2005.FX rate: 1.00 C$ = 0.810174 US$, live mid-market rate as at 23.06.2005, XE.com.

20 CHAPTER 1. ICT INDICATORS FOR DEVELOPMENT: TRENDS AND MEASUREMENT ISSUES
INFORMATION ECONOMY REPORT 2005
more advanced users of ICTs. For example, businessoperations might be linked to online orders (see chart1.7), or ICTs can be used as tools for management(see chart 1.8).
As far as the use of the Internet by enterprises is con-cerned, it is difficult to obtain comparable data fromdeveloping countries in this regard. Many countriesdo not collect data specifically on the use of the Inter-net, but among those that do, unsurprisingly, e-mail isthe most common type of Internet activity, followedby information search (about goods and services, themarket, government and public authorities) and otherresearch (see table 6 in annex I). Also, response cate-gories can vary from country to country. As can beseen in table 1.13, Thailand requests different infor-mation from enterprises as regards their use of theInternet, and more of the larger enterprises use theInternet for different types of activity.
The Internet is also used by enterprises for e-bankingand other financial services. In the EU 25, 68 per centof enterprises used the Internet for financial servicesin 2004. In the OECD countries, a selected numberof countries had a very high proportion of firms thatuse the Internet for banking and financial services,
from 45 per cent in Cyprus to 87 per cent in Slovenia.Bulgaria and Romania, reported 26 per cent and 23per cent respectively. Almost none of the developingeconomies covered by the UNCTAD survey reportedthe use of the Internet for these purposes, with theexceptions of Hong Kong SAR (34.1 per cent) andThailand (5.6 per cent).
Even in the EU, which has a strong e-governmentagenda, transacting with public authorities over theInternet is still not widespread, although enterprisesdo so more than individuals and the level of interac-tivity is growing slowly. In 2004, only 18 per cent ofenterprises in the EU 25 with Internet access used itfor full electronic case handling14 with Governments.However, 51 per cent of enterprises with Internetaccess used the Internet to obtain information frompublic authorities, 46 per cent for obtaining formsand 32 per cent for returning filled-in forms. Thecountries covered by the UNCTAD survey have notprovided much information on businesses using theInternet to transact with Government or publicauthorities, despite the increase in e-government initi-atives. Notable, but not surprising exceptions areBulgaria and Romania, which are EU candidate coun-tries, and Andorra, which is not in the EU but is in
Chart 1.6
Enterprises placing and receiving orders over the Internet,2004 or latest available year (selected countries)
Source: Eurostat database, 2005; UNCTAD e-business database, 2005.
of enterprises using the Internet

INFORMATION ECONOMY REPORT 2005
CHAPTER 1. ICT INDICATORS FOR DEVELOPMENT: TRENDS AND MEASUREMENTS ISSUES 21
Chart 1.8
Business processes linked to online ordersin selected OECD countries, 2003
Chart 1.7
Proportion of enterprises carrying out e-business activitiesin selected European countries, 2003
Source: OECD, 2004.
Source: OECD, 2004.

22 CHAPTER 1. ICT INDICATORS FOR DEVELOPMENT: TRENDS AND MEASUREMENT ISSUES
INFORMATION ECONOMY REPORT 2005
the region. Other than these countries, Macao SARreported that 9.4 per cent of enterprises use the Inter-net to transact with public authorities.
Other ICT use indicators
The proportion of businesses with an intranet is alsoa core indicator owing to the importance of such net-works in e-business.15 Intranets help an organization
work more efficiently, particularly in terms of internalcommunication, coordination and sharing of knowl-edge. In 2004, 33 per cent of businesses (with morethan 10 employees) in European countries used anintranet, with Belgium reporting the highest propor-tion (45 per cent). Bulgaria reported that 27.2 per centof enterprises have an intranet, and Romania reported16 per cent. Although many countries still do not col-lect information on the use of intranets by enter-
Uses of Internet total 1-15 16-25 26-30 31-50 51-200 200+Information searches 7.7 6.1 38.9 44.6 50.9 64.0 82.2Monitoring the market 3.6 2.6 19.5 25.6 29.4 38.1 53.8E-mail 6.3 4.8 35.4 41.9 47.0 61.2 78.3Communication other than e-mail 1.0 0.8 5.1 5.8 7.7 10.3 17.6Advertising of own goods and services 1.5 1.0 10.2 11.5 14.5 23.6 38.8Transactions or communication w/ trading partner 1.6 1.3 8.1 9.9 11.5 16.6 26.2Banking and financial services 0.5 0.4 2.5 2.9 5.1 6.7 14.9
Other 0.5 0.5 1.0 1.5 2.1 2.2 2.5
Table 1.13
Different uses of Internet by enterprises in Thailand by number of employees, 2003(percentages)
Source: UNCTAD e-business database 2005.
Chart 1.9
Proportion of Moroccan enterprises using intranets for different types of activity,by enterprise size, 2004
Source: UNCTAD e-business database 2005.

INFORMATION ECONOMY REPORT 2005
CHAPTER 1. ICT INDICATORS FOR DEVELOPMENT: TRENDS AND MEASUREMENTS ISSUES 23
prises, among those covered by the UNCTAD surveythe use of intranets is not far from European num-bers and even surpasses them. The outperformer isSingapore, reporting that 64.3 per cent of enterprisesuse an intranet, followed by Madagascar with 38.2 percent and the Republic of Korea with 35.2 per cent. Atthe lower end is Chile with 4.6 per cent, a result whichis weighted downwards by retail trade enterprises (63per cent of the sample), which have a low prevalenceof intranets; as can be expected, enterprises in com-puter and related activities (less than 1 per cent of thesample), report 40 per cent of intranet prevalence. InMorocco, the national regulatory authority also col-lects data on the types of activities for which intranetsare used by enterprises (see chart 1.9).
It should be noted that size also matters here. In theEU 25, 76 per cent of large enterprises have anintranet, as opposed to 27 per cent of small enter-prises and 54 per cent of medium-sized enterprises.This may be due to several factors: for example,SMEs have fewer resources available for developmentand maintenance of an intranet, their size might notjustify the use of an intranet, or there is less manage-ment awareness of the potential benefits of such anetwork. A certain basic infrastructure, such as aLAN, is also required. In this sense, there is a definitecorrespondence between the proportion of busi-nesses with a LAN and those with an intranet, in
which the former is always equal to or greater thanthe latter (see table 6 in annex I).
The use of an extranet is less common, perhaps acombination of security concerns related to allowingexternal users into parts of an enterprise's system, andthe technical challenge of expanding the functionali-ties of the system to allow for external interaction.16
Extranets also entail changes in business processesand structures, since resources are required for main-taining and following up on this additional avenue forinteraction with clients, suppliers and the general pub-lic. Such an indicator provides information on thelevel of e-business sophistication and interactivity incountries. In particular, more in-depth analysis of thisindicator could also help assess the relative impor-tance of B2B extranets for enterprise productivity.
In 2004, only 12 per cent of businesses in Europeancountries had extranets, with Belgium also reportingthe highest proportion (23 per cent). Bulgaria andRomania reported 3.4 per cent and 4.9 per centrespectively. Among developing countries, this indica-tor is collected less frequently than that on intranets,and in those cases where data are available the pro-portion of businesses with extranets is also lower thanthe proportion of businesses with intranets. Singa-pore, which is more advanced in ICT uptake thanmost developing countries, reported the highest pro-portion with 27.4 per cent.
3. International trade in ICT goods
Another set of core indicators related to measuring theinformation economy concerns the ICT-producingsector and international trade in ICT goods and serv-ices (see section C.2). Currently, very little internation-ally comparable data are available on the ICT sector indeveloping countries. Similarly, comparable data oninternational trade in ICT services suffer from a lackof an internationally agreed upon definition of ICTtrade in services.17 By contrast, data on internationaltrade in goods are collected at national borders bymost countries and compiled in the UN Comtradedatabase. This section will thus provide an overview oftrends in the international trade of ICT goods from adeveloping country perspective.
The data presented in this section are based on theclassification of ICT goods developed by the OECDWorking Party on Indicators for the InformationSociety (WPIIS) and are currently under considera-tion by the UN Statistical Commission for final
Table 1.14
Proportion of businesses with extranet and intranet, 2003 or latest available
year (selected countries)
Source: UNCTAD e-business database 2005.
Country
Businesseswith anintranet
Businesseswith anextranet
Singapore 84.7 36.1Madagascar 57.0 ..Republic of Korea 37.4 ..Argentina 50.2 15.6Morocco 33.3Bulgaria 44.0 5.5Philippines 33.1 7.8Trinidad & Tobago 24.2 ..Romania 31.0 9.5Chile 22.7 7.2Colombia 0.8 0.4
of businesses with Internet

24 CHAPTER 1. ICT INDICATORS FOR DEVELOPMENT: TRENDS AND MEASUREMENT ISSUES
INFORMATION ECONOMY REPORT 2005
approval. A detailed list (at the six-digit level of theHarmonized System) of all the items covered underthis classification is provided in annex III.
Global trends in international trade of ICTgoods
Since 1996, exports of ICT goods have doubled andhave grown at a faster pace than merchandise exports.Between 1996 and 2003 merchandise exports
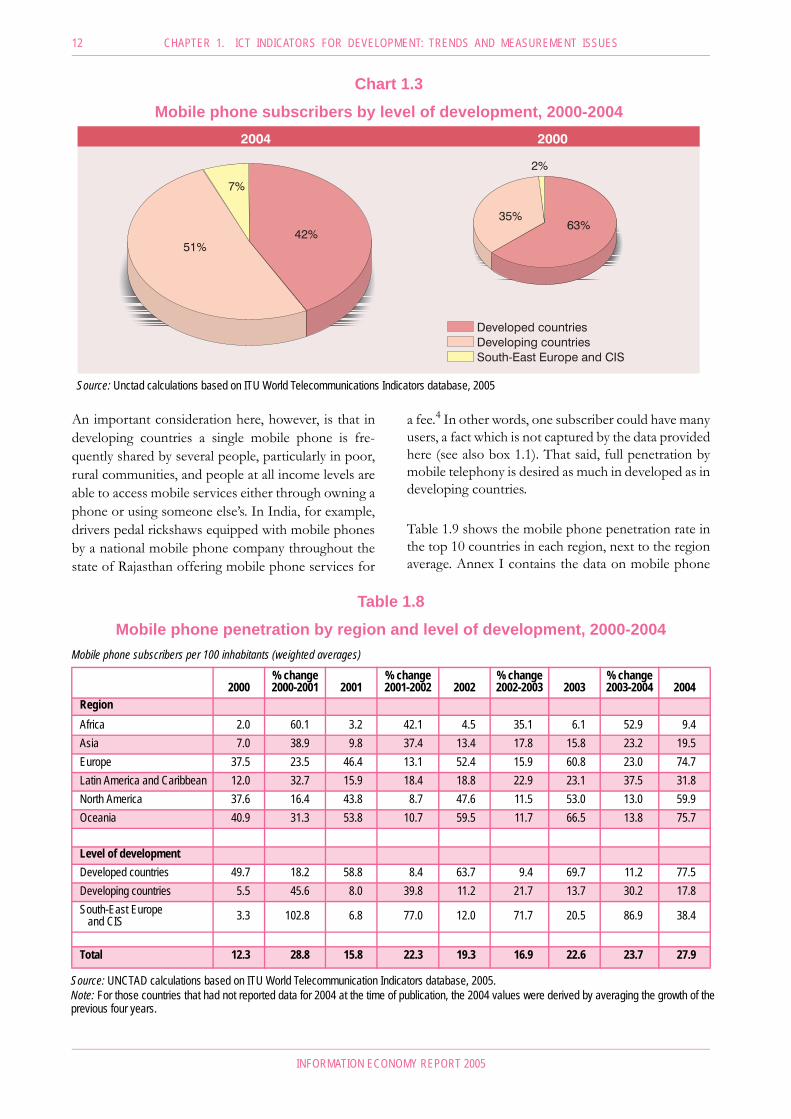
increased by 60 per cent, while ICT goods exportsincreased by 100 per cent (see chart 1.10). In 2003,exports of ICT goods exceeded $ 1.1 trillion,accounting for 15 per cent of world merchandiseexports. The value of international trade in ICTgoods thus exceeded the combined value of interna-tional trade in agriculture, textiles and clothing.18
This growth has taken place despite a general stagna-tion in international merchandise trade at the turn ofthe millennium and following the crash of the NAS-DAQ stock market, which particularly impacted ontrade in ICT goods. In 2001, trade in ICT goodsplummeted by 11 per cent, a fall far greater than thedecline in merchandise trade. ICT goods exportsstarted to recover in 2002, and grew strongly again in2003, as well as merchandise trade in general, with anaverage annual growth rate of 15 per cent.19
Trade in ICT goods continues to be highly concen-trated: the top ten exporters account for 72 per centof global ICT exports, and the top ten importers forslightly less (66 per cent of global ICT imports). Con-centration is even higher in developing countries: thetop ten developing country exporters amount forover 98 per cent of all developing countries’ exportsin ICT goods (the top ten importers amount for
Chart 1.10
Evolution of ICT goods and total merchandise exports, 1996-2003
(1996 = 100)
2000 2001 2002 2003% change 2000-2001
% change 2001-2002
% change 2002-2003
% of world exports in ICT goods
2003
Level of development
Developed countries 635'468 560'468 528'510 569'916 -12 -6 8 50.7South-East Europe and CIS 1'790 2'223 2'391 2'360 24 8 -1 0.2Developing countries 461'529 410'961 442'853 551'690 -11 8 25 49.1
Region
Africa 797 800 1'386 1'661 0 73 20 0.1North America 204'886 167'161 144'631 148'645 -18 -13 3 13.2Latin America and Caribbean 42'944 42'066 40'139 40'253 -2 -5 0 3.6Asia 549'203 469'306 501'451 621'265 -15 7 24 55.3Europe 298'969 292'365 284'151 309'938 -2 -3 9 27.6Oceania 1'988 1'954 1'996 2'204 -2 2 10 0.2
World ICT goods exports 1'098'787 973'651 973'754 1'123'967 -11.4 0.0 15.4 100.0
World merchandise exports 5'970'375 5'826'804 5'951'043 6'962'775 -2.5 2.1 14.5 –
Table 1.15
ICT goods exports by region and level of development, 2000-2003 (million USD)
Source: UNCTAD calculations based on UN COMTRADE database.
Source: UN COMTRADE database.

INFORMATION ECONOMY REPORT 2005
CHAPTER 1. ICT INDICATORS FOR DEVELOPMENT: TRENDS AND MEASUREMENTS ISSUES 25
90 per cent of the developing countries’ ICT goodsimports). China alone takes 22 per cent of all develop-ing countries’ trade in ICT goods.
Major exporters
As table 1.15 shows, the growth in global ICT goodsexports was particularly driven by increased exportsfrom developing countries, which grew by 25 per centin 2003. Developing countries now amount foralmost 50 per cent of world exports in ICT goods.
Regionally, Africa and Asia experienced strongergrowth rates, although Africa started from very lowlevels. Characterized by impressive growth and highinitial levels of exports, the Asian region dominatesthe international market with a 55 per cent worldmarket share, followed by Europe (27 per cent) andNorth America (13 per cent). Latin America and theCaribbean represent under 4 per cent of the worldmarket, while neither Oceania nor Africa accounts for1 per cent of world exports of ICT goods.
Asian exporters continue to be highly specialized inICT trade (30 per cent of total merchandise trade)whereas since 2001 North America’s relative exportsin ICT goods have decreased, from 20 per cent to 15per cent of total merchandise trade. For Europe andLatin America, ICT goods continue to representabout 10 per cent of their total merchandise exports.Finally, for Oceania and Africa, exports of ICT goods
represent less than 5 per cent of total merchandiseexports (see chart 1.11).
The recent growth in market share of developingcountries has been driven by a small number of eco-nomies, namely China, Hong Kong SAR and theRepublic of Korea. In three years, China has morethan doubled its market share and, in 2003, becamethe second major exporter after the United States.The market share of Hong Kong SAR increased by40 per cent during the same period, and in 2003 itbecame the fourth largest exporter of ICT goods (seetable 1.16 and chart 1.12).
This growth in developing countries’ market shareswas also due to the fact that some of the largest devel-oped country exporters (such as the United States,Japan, the United Kingdom, France, Ireland, Italy andCanada) had decreased their exports (in absolutevalues) since 2000.
Furthermore, lower production costs, economies ofscale, an increased interest in investing in certaindeveloping countries and perhaps a move towardsICT services rather than goods by developed coun-tries prompted the reallocation of ICT goods produc-tion to developing countries. This development, cou-pled with a surge in local ICT productive sectors insome developing countries contributed to theincrease in ICT goods exports from developing coun-tries. Except for Germany, the ten major developed
Chart 1.11
Share of ICT goods in total merchandise exports, 1996-2003
Source: UN COMTRADE database.

26 CHAPTER 1. ICT INDICATORS FOR DEVELOPMENT: TRENDS AND MEASUREMENT ISSUES
INFORMATION ECONOMY REPORT 2005
country exporters saw their market share in exportsof ICT goods eroded during the period 2000–2003.
However, some of the previously leading developingcountries also lost market share in exports of ICTgoods. Malaysia and Singapore both lost 8 per centand 6.5 per cent respectively of their market share inthese three years.20 This may be explained by a reallo-cation of ICT manufacturing businesses to lower-wage countries such as China. Other developingcountries among the top 25 exporters – Mexico, thePhilippines, Thailand and Indonesia – also experi-enced negative and/or sluggish growth rates and a
loss in market share in global ICT goods exports (seetable 1.16).
African and Latin American regions are scarcely rep-resented in the list of 25 major exporters. The threemajor African exporters are Morocco, South Africaand Tunisia. Together they account for 94 per cent ofAfrica’s ICT goods exports. Nevertheless, these fig-ures need to be considered with caution as few Afri-can countries report data on trade in ICT goods, andexport data from important African exporters such asEgypt are lacking. Mexico is by far the largestexporter of ICT goods in Latin America and the Car-ibbean, accounting for 90 per cent of all the Latin
Exports (million $) % change
Worldmarket share
(%)
Exports 2000 2001 2002 2003 2000-2001 2001-2002 2002-2003 2003
United States 182'261 152'150 132'613 136'630 -17 -13 3 12.2China 46'996 55'304 79'376 123'303 18 44 55 11.0Japan 123'547 94'498 95'013 106'649 -24 1 12 9.5Hong Kong SAR 55'312 54'431 63'494 78'056 -2 17 23 6.9Singapore 77'344 64'693 65'863 72'670 -16 2 10 6.5Germany 57'608 59'041 59'064 70'336 2 0 19 6.3Rep. of Korea 61'516 46'786 55'018 66'541 -24 18 21 5.9Taiwan PC 64'406 51'140 52'977 61'085 -21 4 15 5.4Malaysia 55'572 47'981 50'966 53'126 -14 6 4 4.7Netherlands 33'644 34'533 31'580 45'110 3 -9 43 4.0United Kingdom 54'927 53'394 51'394 43'051 -3 -4 -16 3.8Mexico 38'262 38'054 36'313 36'062 -1 -5 -1 3.2France 35'149 29'920 27'240 28'152 -15 -9 3 2.5Philippines 26'421 21'394 24'080 24'157 -19 13 0 2.1Ireland 25'607 28'999 26'489 22'453 13 -9 -15 2.0Thailand 20'360 17'428 - 20'844 -14 0 0 1.9Italy 12'830 12'801 11'406 12'524 0 -11 10 1.1Belgium 11'432 11'813 10'218 12'125 3 -14 19 1.1Canada 22'625 15'011 12'018 12'015 -34 -20 0 1.1Hungary 7'776 7'510 8'938 11'967 -3 19 34 1.1Finland 11'555 9'413 9'789 11'085 -19 4 13 1.0Sweden 14'705 9'352 10'250 10'754 -36 10 5 1.0Spain 6'135 6'158 5'896 7'615 0 -4 29 0.7Indonesia 7'843 6'500 6'680 6'274 -17 3 -6 0.6Austria 4'883 5'189 5'721 6'080 6 10 6 0.5Rest of the world 40'072 40'158 41'358 45'302 0 3 10 4.0
World exports 1'098'787 973'651 973'754 1'123'967 -11 0 15 100.0
Table 1.16
Major exporters of ICT goods, 2000-2003
Source: UN COMTRADE database.

INFORMATION ECONOMY REPORT 2005
CHAPTER 1. ICT INDICATORS FOR DEVELOPMENT: TRENDS AND MEASUREMENTS ISSUES 27
American ICT goods exports, followed by Brazil (5.8per cent) and Costa Rica (3.8 per cent).
A useful measure to assess the export performance inICT goods of individual countries is the revealedcomparative advantage (RCA) index, combined withworld market share (WMS) data.21 The following willthus take a closer look at the countries that havegained comparative advantage and world market sharein ICT goods exports.
According to table 1.17a, only a few economies have arevealed comparative advantage in ICT goods
Chart 1.12Major exporters of ICT goods, 2003
Tables 1.17a and 1.17b
WMS and RCA by country/territory, 2000-2003
Source: UNCTAD calculations based on UN COMTRADE database
Countries/territories with 2003 RCA >1
RCARCA
growth (%)
2003 2000-2003 Philippines 4.13 10 Malaysia 3.14 2 Singapore 3.13 3 Taiwan PC 2.54 7 Rep. of Korea 2.13 10 Hong Kong SAR 2.12 42 Hungary 1.75 16 China 1.74 70 Costa Rica 1.65 -5 Thailand 1.61 0 Ireland 1.51 -19 Japan 1.40 0 Mexico 1.35 8 Finland 1.35 -5 Netherlands 1.25 15 United States 1.17 -8
Countries/territories with WMS>1, 2003 RCA >1 and positivegrowth rates
Three year Av. WMS
IndexWMS
growth (%) RCA
RCAgrowth
(%)
2001-2003 2000-2003 2003 2000-2003
China 1.37 156 1.74 70 Hong Kong SAR 1.11 38 2.12 42 Hungary 1.15 50 1.75 16 Netherlands 1.10 31 1.25 15 Rep. of Korea 1.03 6 2.13 10
Source: UN COMTRADE database
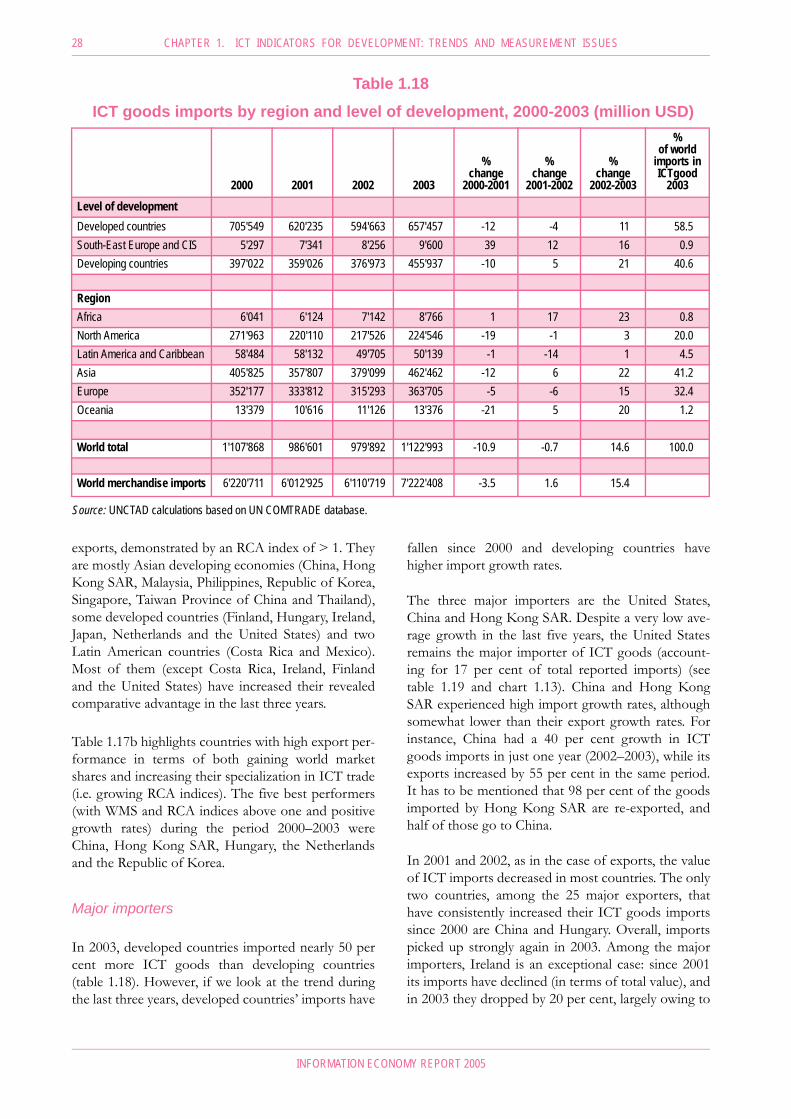
28 CHAPTER 1. ICT INDICATORS FOR DEVELOPMENT: TRENDS AND MEASUREMENT ISSUES
INFORMATION ECONOMY REPORT 2005
exports, demonstrated by an RCA index of > 1. Theyare mostly Asian developing economies (China, HongKong SAR, Malaysia, Philippines, Republic of Korea,Singapore, Taiwan Province of China and Thailand),some developed countries (Finland, Hungary, Ireland,Japan, Netherlands and the United States) and twoLatin American countries (Costa Rica and Mexico).Most of them (except Costa Rica, Ireland, Finlandand the United States) have increased their revealedcomparative advantage in the last three years.
Table 1.17b highlights countries with high export per-formance in terms of both gaining world marketshares and increasing their specialization in ICT trade(i.e. growing RCA indices). The five best performers(with WMS and RCA indices above one and positivegrowth rates) during the period 2000–2003 wereChina, Hong Kong SAR, Hungary, the Netherlandsand the Republic of Korea.
Major importers
In 2003, developed countries imported nearly 50 percent more ICT goods than developing countries(table 1.18). However, if we look at the trend duringthe last three years, developed countries’ imports have
fallen since 2000 and developing countries havehigher import growth rates.
The three major importers are the United States,China and Hong Kong SAR. Despite a very low ave-rage growth in the last five years, the United Statesremains the major importer of ICT goods (account-ing for 17 per cent of total reported imports) (seetable 1.19 and chart 1.13). China and Hong KongSAR experienced high import growth rates, althoughsomewhat lower than their export growth rates. Forinstance, China had a 40 per cent growth in ICTgoods imports in just one year (2002–2003), while itsexports increased by 55 per cent in the same period.It has to be mentioned that 98 per cent of the goodsimported by Hong Kong SAR are re-exported, andhalf of those go to China.
In 2001 and 2002, as in the case of exports, the valueof ICT imports decreased in most countries. The onlytwo countries, among the 25 major exporters, thathave consistently increased their ICT goods importssince 2000 are China and Hungary. Overall, importspicked up strongly again in 2003. Among the majorimporters, Ireland is an exceptional case: since 2001its imports have declined (in terms of total value), andin 2003 they dropped by 20 per cent, largely owing to
2000 2001 2002 2003
%change
2000-2001
%change
2001-2002
%change
2002-2003
%of world
imports in ICTgood
2003
Level of developmentDeveloped countries 705'549 620'235 594'663 657'457 -12 -4 11 58.5South-East Europe and CIS 5'297 7'341 8'256 9'600 39 12 16 0.9Developing countries 397'022 359'026 376'973 455'937 -10 5 21 40.6
RegionAfrica 6'041 6'124 7'142 8'766 1 17 23 0.8North America 271'963 220'110 217'526 224'546 -19 -1 3 20.0Latin America and Caribbean 58'484 58'132 49'705 50'139 -1 -14 1 4.5Asia 405'825 357'807 379'099 462'462 -12 6 22 41.2Europe 352'177 333'812 315'293 363'705 -5 -6 15 32.4Oceania 13'379 10'616 11'126 13'376 -21 5 20 1.2
World total 1'107'868 986'601 979'892 1'122'993 -10.9 -0.7 14.6 100.0
World merchandise imports 6'220'711 6'012'925 6'110'719 7'222'408 -3.5 1.6 15.4
Table 1.18
ICT goods imports by region and level of development, 2000-2003 (million USD)
Source: UNCTAD calculations based on UN COMTRADE database.

INFORMATION ECONOMY REPORT 2005
CHAPTER 1. ICT INDICATORS FOR DEVELOPMENT: TRENDS AND MEASUREMENTS ISSUES 29
Imports (million $) % change World
market share (%)
Exports 2000 2001 2002 2003 2000-2001 2001-2002 2002-2003 2003
United States 237'942 193'797 193'873 199'852 -19 0 3 17.8China 47'479 53'192 68'724 96'536 12 29 40 8.6HongKongSAR 64'403 61'552 69'082 82'686 -4 12 20 7.4Germany 65'432 67'831 63'255 73'779 4 -7 17 6.6Japan 66'871 58'207 55'092 61'220 -13 -5 11 5.5UnitedKingdom 66'934 55'388 49'353 54'465 -17 -11 10 4.9Singapore 59'769 47'950 48'144 53'153 -20 0 10 4.7Netherlands 36'535 34'767 29'816 43'020 -5 -14 44 3.8Rep.of Korea 39'085 30'334 32'288 37'543 -22 6 16 3.3Malaysia 36'390 30'821 35'057 37'399 -15 14 7 3.3Taiwan PC 43'410 31'353 33'756 34'698 -28 8 3 3.1France 38'760 33'391 30'893 34'670 -14 -7 12 3.1Mexico 36'308 36'568 34'394 33'980 1 -6 -1 3.0Canada 34'021 26'313 23'653 24'694 -23 -10 4 2.2Italy 23'511 21'508 20'879 24'018 -9 -3 15 2.1Philippines 12'621 12'020 17'300 18'288 -5 44 6 1.6Spain 14'238 13'276 13'080 16'345 -7 -1 25 1.5Thailand 15'276 14'329 - 16'214 -6 0 0 1.4Belgium 13'096 13'344 12'560 14'280 2 -6 14 1.3Ireland 16'680 18'492 17'525 13'925 11 -5 -21 1.2Australia 11'551 8'995 9'372 11'194 -22 4 19 1.0Hungary 7'612 8'050 8'666 10'425 6 8 20 0.9Sweden 10'982 9'073 8'632 10'093 -17 -5 17 0.9Switzerland 9'225 8'180 7'504 8'269 -11 -8 10 0.7Austria 7'057 6'906 6'945 8'043 -2 1 16 0.7Rest of the world 92'680 90'964 90'047 104'204 -2 -1 16 9.3World imports 1'107'868 986'601 979'892 1'122'993 -11 -1 15 100.0
Table 1.19
Major importers of ICT goods, 2000-2003
Source: UNCTAD calculations based on UN COMTRADE database.
a 50 per cent drop in the exports of electronic com-ponents.
As far as developing regions are concerned, the threemajor African importers of ICT goods are SouthAfrica (45 per cent of all African imports), Algeria (12per cent) and Morocco (11 per cent). They are fol-lowed by Nigeria (9 per cent) and Tunisia (8 per cent),all of which experienced positive growth in 2003. Asin the case of global imports, Africa’s imports of ICTgoods are less concentrated than its exports.
In Latin America, Mexico, Brazil and Costa Rica arethe largest importers. Mexico’s share in imports ismore modest (68 per cent of all ICT goods imported
by Latin American countries) compared with itsexports (90 per cent).
A final look at the role of LDCs in international tradeof ICT goods reveals that it is extremely small,accounting for only $13 million (2003) or 0.001 percent of world ICT goods exports.22 This ratio is muchsmaller than LDCs’ share in overall world merchandiseexports (0.22 per cent). On the other hand, imports ofICT goods are 100 times greater than their exportsand, with a value of $1,277 million represent 0.1 percent of world ICT goods imports.23 This shows that,unlike major exporters in this field, most LDCs do notimport ICT goods as inputs into other goods to beexported; rather, the final destination of such goods is

30 CHAPTER 1. ICT INDICATORS FOR DEVELOPMENT: TRENDS AND MEASUREMENT ISSUES
INFORMATION ECONOMY REPORT 2005
local use. However, LDCs share in ICT goods imports(0.1 per cent) is much smaller than LDCs’ share in totalmerchandise imports (0.36 per cent).
Seven out of the 10 LDCs that reported export datain 2000 and 2003 have experienced a negative com-pound annual growth rate. The only exceptions wereCambodia, Togo and Senegal (60 per cent, 48 percent and 27 per cent compound annual growth rate).On the other hand, of the 13 LDCs that reportedimport data for 2000 and 2003, all have increasedtheir imports (except for Cambodia). On average,LDCs’ imports of ICT goods have grown at a 19 percent compound annual growth rate. Given the lack ofdata on trade in ICT goods from LDCs, a note ofcaution should be exercised regarding any interpreta-tion of the data provided above.
Trade patterns by category of ICT product
The above trends refer to a large number of ICT prod-ucts. Therefore, this section disaggregates trade trendsby category of ICT good. Following the OECD clas-sification, ICT goods fall into five groups:24
• Telecommunications equipment;• Computer and related equipment;• Electronic components;• Audio and video equipment;
• Other ICT goods.
Charts 1.14 and 1.15 show that two thirds of trade inICT goods is in electronic components (34 per cent)and computer and related equipment (32 per cent).Trade in telecommunications equipment representsonly about 15 per cent and decreased in the last fewyears. Audio and video equipment now represents 12per cent of world ICT goods trade, with a slightincrease from three years ago. Furthermore, the gen-eral category of “Other ICT goods” represents 8 percent of global exports.
However, the share of the five product groups differsin some regions. Regarding exports, African countriesexport mainly electronic components (52 per cent)but few computers (8 per cent); and Latin Americancountries export mainly computers (37 per cent) butrelatively few electronic components (13 per cent). Interms of imports, African countries import mainlytelecommunications equipment (37 per cent) andLatin American countries mainly electronic compo-nents (40 per cent) (tables 1.20 and 1.21).
Since 2000, and following the NASDAQ stock mar-ket crash, each of the five ICT goods categories hasbeen performing very differently (chart 1.16).Exports in electronic equipment fell sharply in 2001and recovered strongly in 2003, to almost their levelat the start of the millennium. However, exports oftelecommunications equipment, which dropped in2001 and 2002, have not yet reached their 2000 levels.
Chart 1.13
Major importers of ICT goods, 2003
Source: UN COMTRADE database
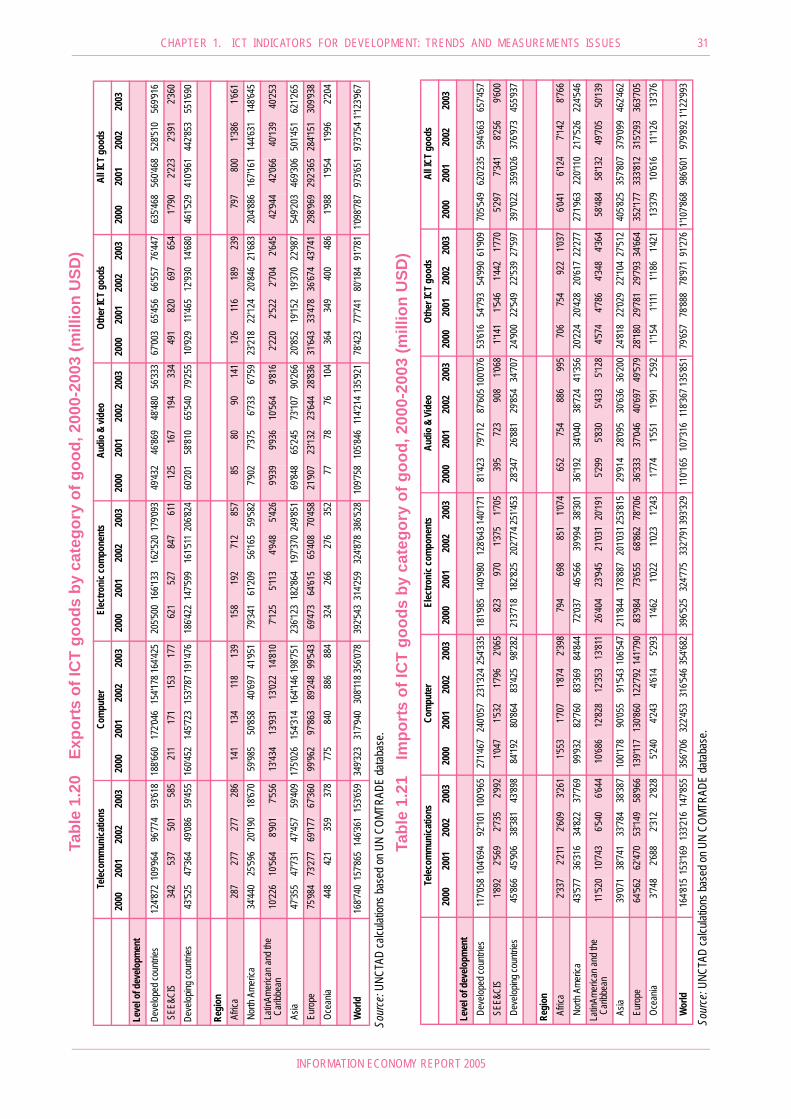
INFORMATION ECONOMY REPORT 2005
CHAPTER 1. ICT INDICATORS FOR DEVELOPMENT: TRENDS AND MEASUREMENTS ISSUES 31
Te
lecom
mun
icatio
ns
Com
pute
r E
lectro
nic c
ompo
nent
s A
udio
& vi
deo
Oth
er IC
T go
ods
All I
CT g
oods
2000
2001
2002
2003
2000
2001
2002
2003
2000
2001
2002
2003
2000
2001
2002
2003
2000
2001
2002
2003
2000
2001
2002
2003
Leve
l of d
evelo
pmen
t
Deve
loped
coun
tries
124'8
7210
9'964
96'77
493
'618
188'6
6017
2'046
154'1
7816
4'425
205'5
0016
6'133
162'5
2017
9'093
49'43
246
'869
48'48
056
'333
67'00
365
'456
66'55
776
'447
635'4
6856
0'468
528'5
1056
9'916
SEE
&CIS
342
537
501
585
211
171
153
177
621
527
847
611
125
167
194
334
491
820
697
654
1'790
2'223
2'391
2'360
Deve
loping
coun
tries
43'52
547
'364
49'08
659
'455
160'4
5214
5'723
153'7
8719
1'476
186'4
2214
7'599
161'5
1120
6'824
60'20
158
'810
65'54
079
'255
10'92
911
'465
12'93
014
'680
461'5
2941
0'961
442'8
5355
1'690
Regi
on A
frica
287
277
277
286
141
134
118
139
158
192
712
857
8580
9014
112
611
618
923
979
780
01'3
861'6
61 N
orth
Amer
ica34
'440
25'59
620
'190
18'67
059
'985
50'85
840
'697
41'95
179
'341
61'20
956
'165
59'58
27'9
027'3
756'7
336'7
5923
'218
22'12
420
'846
21'68
320
4'886
167'1
6114
4'631
148'6
45 La
tinAm
erica
n and
the
Carib
bean
10'22
610
'564
8'901
7'556
13'43
413
'931
13'02
214
'810
7'125
5'113
4'948
5'426
9'939
9'936
10'56
49'8
162'2
202'5
222'7
042'6
4542
'944
42'06
640
'139
40'25
3
Asia
47'35
547
'731
47'45
759
'409
175'0
2615
4'314
164'1
4619
8'751
236'1
2318
2'864
197'3
7024
9'851
69'84
865
'245
73'10
790
'266
20'85
219
'152
19'37
022
'987
549'2
0346
9'306
501'4
5162
1'265
Eur
ope
75'98
473
'277
69'17
767
'360
99'96
297
'863
89'24
899
'543
69'47
364
'615
65'40
870
'458
21'90
723
'132
23'64
428
'836
31'64
333
'478
36'67
443
'741
298'9
6929
2'365
284'1
5130
9'938
Oce
ania
448
421
359
378
775
840
886
884
324
266
276
352
7778
7610
436
434
940
048
61'9
881'9
541'9
962'2
04
Wor
ld16
8'740
157'8
6514
6'361
153'6
5934
9'323
317'9
4030
8'118
356'0
7839
2'543
314'2
5932
4'878
386'5
2810
9'758
105'8
4611
4'214
135'9
2178
'423
77'74
180
'184
91'78
11'0
98'78
797
3'651
973'7
541'1
23'96
7
Tabl
e 1.
20Ex
port
s of
ICT
good
s by
cat
egor
y of
goo
d, 2
000-
2003
(mill
ion
USD
)
Sour
ce: U
NCTA
D ca
lculat
ions b
ased
on U
N CO
MTRA
DE da
tabas
e.
Tabl
e 1.
21Im
port
s of
ICT
good
s by
cat
egor
y of
goo
d, 2
000-
2003
(mill
ion
USD
)
Telec
omm
unica
tions
C
ompu
ter
Elec
troni
c com
pone
nts
Aud
io &
Vid
eo
Oth
er IC
T go
ods
All I
CT g
oods
2000
2001
2002
2003
2000
2001
2002
2003
2000
2001
2002
2003
2000
2001
2002
2003
2000
2001
2002
2003
2000
2001
2002
2003
Leve
l of d
evelo
pmen
t D
evelo
ped c
ountr
ies
117'0
5810
4'694
92'10
110
0'965
271'4
6724
0'057
231'3
2425
4'335
181'9
8514
0'980
128'6
4314
0'171
81'42
379
'712
87'60
5100
'076
53'61
654
'793
54'99
061
'909
705'5
4962
0'235
594'6
6365
7'457
SEE
&CIS
1'8
922'5
692'7
352'9
921'0
471'5
321'7
962'0
6582
397
01'3
751'7
0539
572
390
81'0
681'1
411'5
461'4
421'7
705'2
977'3
418'2
569'6
00 D
evelo
ping c
ountr
ies
45'86
645
'906
38'38
143
'898
84'19
280
'864
83'42
598
'282
213'7
1818
2'825
202'7
7425
1'453
28'34
726
'881
29'85
434
'707
24'90
022
'549
22'53
927
'597
397'0
2235
9'026
376'9
7345
5'937
Regi
on A
frica
2'337
2'211
2'609
3'261
1'553
1'707
1'874
2'398
794
698
851
1'074
652
754
886
995
706
754
922
1'037
6'041
6'124
7'142
8'766
Nor
th Am
erica
43'57
736
'316
34'82
237
'769
99'93
282
'760
83'36
984
'844
72'03
746
'566
39'99
438
'301
36'19
234
'040
38'72
441
'356
20'22
420
'428
20'61
722
'277
271'9
6322
0'110
217'5
2622
4'546
Latin
Amer
ican a
nd th
e Ca
ribbe
an11
'520
10'74
36'5
406'6
4410
'686
12'82
812
'353
13'81
126
'404
23'94
521
'031
20'19
15'2
995'8
305'4
335'1
284'5
744'7
864'3
484'3
6458
'484
58'13
249
'705
50'13
9
Asia
39
'071
38'74
133
'784
38'38
710
0'178
90'05
591
'543
106'5
4721
1'844
178'8
8720
1'031
253'8
1529
'914
28'09
530
'636
36'20
024
'818
22'02
922
'104
27'51
240
5'825
357'8
0737
9'099
462'4
62 E
urop
e 64
'562
62'47
053
'149
58'96
613
9'117
130'8
6012
2'792
141'7
9083
'984
73'65
568
'862
78'70
636
'333
37'04
640
'697
49'57
928
'180
29'78
129
'793
34'66
435
2'177
333'8
1231
5'293
363'7
05 O
cean
ia
3'748
2'688
2'312
2'828
5'240
4'243
4'614
5'293
1'462
1'022
1'023
1'243
1'774
1'551
1'991
2'592
1'154
1'111
1'186
1'421
13'37
910
'616
11'12
613
'376
Wor
ld
164'8
1515
3'169
133'2
1614
7'855
356'7
0632
2'453
316'5
4635
4'682
396'5
2532
4'775
332'7
9139
3'329
110'1
6510
7'316
118'3
6713
5'851
79'65
778
'888
78'97
191
'276
1'107
'868
986'6
0197
9'892
1'122
'993
Sour
ce: U
NCTA
D ca
lculat
ions b
ased
on U
N CO
MTRA
DE da
tabas
e.

32 CHAPTER 1. ICT INDICATORS FOR DEVELOPMENT: TRENDS AND MEASUREMENT ISSUES
INFORMATION ECONOMY REPORT 2005
Exports of audio and video equipment fell less in2001, and have since grown by 25 per cent.
As far as the origin of exports is concerned, telecom-munications equipment is mainly exported fromdeveloped countries, and particularly Europe,although their share of global telecommunicationsexports decreased from 74 per cent in 2000 to justover 60 per cent in 2003. In 2000, the United Stateswas the main exporter of telecommunications equip-
ment, with 14 per cent of the global share. However,between 2000 and 2003 it halved its exports of tele-communications equipment, while the Republic ofKorea and China doubled them. Thus, by 2003, thelargest exporters of telecommunications equipmentwere the Republic of Korea, the United States andChina, accounting for about 10 per cent of the marketeach. They are followed closely by Germany and theUnited Kingdom (see table 1.22 and charts 1.17a to1.17d).
Chart 1.14
Exports of ICT goodsby category of good, 2003
Chart 1.15
Imports of ICT goodsby category of good, 2003
Chart 1.16
Evolution of ICT goods exports by category, 2000-2003 (2000 =100)
Source: UNCTAD calculations based on UN COMTRADE database. Source: UNCTAD calculations based on UN COMTRADE database.
Source: UNCTAD calculations based on UN COMTRADE database.

INFORMATION ECONOMY REPORT 2005
CHAPTER 1. ICT INDICATORS FOR DEVELOPMENT: TRENDS AND MEASUREMENTS ISSUES 33
Tabl
e 1.
22M
ajor
exp
orte
rs b
y ca
tego
ry o
f IC
T go
ods,
200
3 (m
illio
n U
SD)
Sour
ce: U
NCTA
D ca
lculat
ions b
ased
on U
N CO
MTRA
DE da
tabas
e
Telec
omm
unica
tions
Com
pute
rsEl
ectro
nic c
ompo
nent
sAu
dio
& Vi
deo
Othe
r ICT
goo
dsVa
lue
%Va
lue
%Va
lue
%Va
lue
%Va
lue
%Re
p. of
Kore
a15
'169
10Ch
ina
59'24
5 17
Unite
d Stat
es
56'62
5 15
China
24
'289
18Un
ited S
tates
19
'610
21Un
ited S
tates
14'87
110
Unite
d Stat
es
39'19
6 11
Japa
n
47'73
4 12
Japa
n
20'70
9 15
Germ
any
15
'055
16Ch
ina14
'558
9Ne
therla
nds
25
'205
7Si
ngap
ore
38
'645
10Ho
ng K
ong S
AR
15'39
1 11
Japa
n
10'68
2 12
Germ
any
13'40
79
Sing
apor
e
24'88
3 7
Hong
Kon
g SAR
31
'808
8Me
xico
9
'518
7Un
ited K
ingdo
m
6'20
1 7
Unite
d King
dom
11'80
68
Japa
n
21'83
8 6
Taiw
an, P
C
29'25
3 8
Rep.
of Ko
rea
7
'251
5Fr
ance
4
'453
5Fin
land
8'359
5Ho
ng K
ong S
AR
21'81
8 6
Rep.
of Ko
rea
25
'660
7Ma
laysia
6
'595
5Ne
therla
nds
4
'192
5Fr
ance
6'684
4Ta
iwan
, PC
19
'220
5Ma
laysia
25
'288
7Un
ited S
tates
6
'328
5Ta
iwan
, PC
3
'164
3Ho
ng K
ong S
AR6'6
644
Germ
any
17
'807
5Ch
ina
22'87
9 6
Germ
any
5
'589
4Ho
ng K
ong S
AR
2'37
6 3
Mexic
o6'1
334
Rep.
of Ko
rea
17
'638
5Ge
rman
y
18'47
7 5
Taiw
an, P
C
4'36
4 3
Mexic
o
2'35
9 3
Swed
en5'7
934
Malay
sia
16'66
2 5
Philip
pines
16
'564
4Si
ngap
ore
3
'710
3Ch
ina
2'33
2 3
Rest
of the
wor
ld50
'216
33Re
st of
the w
orld
92'5
67
26Re
st of
the w
orld
73'5
96
19Re
st of
the w
orld
32'1
77
24Re
st of
the w
orld
21'3
56
23
Tota
l tele
com
153'6
5910
0To
tal c
ompu
ters
356'0
78
100
Tota
l elec
troni
cco
mpo
nent
s 38
6'528
10
0To
tal a
udio
& vi
deo
135'9
21
100
Tota
lot
her
ITC
good
s 9
1'781
10
0

34 CHAPTER 1. ICT INDICATORS FOR DEVELOPMENT: TRENDS AND MEASUREMENT ISSUES
INFORMATION ECONOMY REPORT 2005
Developing countries have exported slightly morecomputers and related equipment than developedcountries. At the country level, China dominates thecomputer export market. In only three years, China’sshare in the global market tripled to reach 17 per centof world exports in computers by 2003. During thesame period, the United States’ exports of computersdecreased by 30 per cent, and this resulted in a dropto second place (with 11 per cent of the market).
Developing countries also have higher shares thandeveloped ones in exports of electronic components(54 per cent in 2003). Furthermore, while the UnitedStates and Japan have seen their exports of electroniccomponents drop by 25 per cent and 13 per cent
respectively, they continued to be the major exportersin 2003.
In 2003, almost 60 per cent of exports of audio andvideo equipment originated from developing coun-tries. Between 2000 and 2003 China doubled itsexports of audio and video equipment, and by 2003had the largest share of the market (18 per cent). Dur-ing the same period, exports from Japan stagnatedand in 2003 Japan moved from the leading position tosecond place with 15 per cent of the market.
Table 1.23 and charts 1.18a to 1.18d show the majorimporters by category of ICT good in 2003. Devel-oped countries account for about 70 per cent of
Chart 1.17 a, b, c, dMajor exporters by category of ICT goods, 2003 (million USD)
Source: UNCTAD calculations based on UN COMTRADE database.
17a. Telecommunications equipment 17b. Computers and related equipment
17c. Electronic components 17d. Audio and video equipment

INFORMATION ECONOMY REPORT 2005
CHAPTER 1. ICT INDICATORS FOR DEVELOPMENT: TRENDS AND MEASUREMENTS ISSUES 35
Telec
omm
unica
tions
Com
pute
rsEl
ectro
nic c
ompo
nent
sAu
dio
& Vi
deo
Othe
r ICT
goo
dsVa
lue
%Va
lue
%Va
lue
%Va
lue
%Va
lue
%Un
ited S
tates
34'04
623
Unite
d Stat
es76
'149
21Ch
ina62
'138
16Un
ited S
tates
37'55
128
Unite
d Stat
es 18
'151
20Un
ited K
ingdo
m 10
'392
7Ge
rman
y28
'495
8Ho
ng K
ong S
AR37
'227
9Ho
ng K
ong S
AR 13
'923
10Ge
rman
y7'2
718
Germ
any
8'90
06
Nethe
rland
s24
'379
7Un
ited S
tates
33'95
59
Germ
any
10'13
87
China
6'844
7Ho
ng K
ong S
AR 7'
785
5Ja
pan
23'19
47
Sing
apor
e30
'628
8Un
ited K
ingdo
m 7'
508
6Un
ited K
ingdo
m5'3
206
China
7'32
05
Unite
d King
dom
22'25
46
Malay
sia27
'763
7Ja
pan
7'30
65
Japa
n4'6
845
Fran
ce 5'
018
3Ho
ng K
ong S
AR21
'498
6Re
p. of
Kore
a24
'699
6Fr
ance
5'29
14
Fran
ce4'1
755
Italy
4'93
73
China
17'20
35
Japa
n22
'601
6Ne
therla
nds
4'37
73
Cana
da4'1
255
Sing
apor
e 4'
382
3Si
ngap
ore
13'24
74
Taiw
an, P
C22
'310
6Ita
ly 3'
832
3Re
p. of
Kore
a3'6
464
Nethe
rland
s 4'
164
3Fr
ance
12'67
44
Germ
any
18'97
55
Cana
da 3'
805
3Ta
iwan
, PC
3'359
4Sp
ain 3'
748
3Me
xico
9'947
3Me
xico
15'21
84
Sing
apor
e 3'
487
3Ita
ly3'0
283
Rest
of the
wor
ld57
'164
39Re
st of
the w
orld
105'6
4230
Rest
of the
wor
ld97
'817
25Re
st of
the w
orld
38'63
328
Rest
of the
wor
ld 30
'672
34
Wor
ld 14
7'855
100
Wor
ld35
4'682
100
Wor
ld39
3'329
100
Wor
ld13
5'851
100
Wor
ld91
'276
100
Tabl
e 1.
23M
ajor
impo
rter
s by
cat
egor
y of
ICT
good
s, 2
003
(mill
ion
USD
)3
Sour
ce: U
NCTA
D ca
lculat
ions b
ased
on
UN C
OMTR
ADE
data
base
.

36 CHAPTER 1. ICT INDICATORS FOR DEVELOPMENT: TRENDS AND MEASUREMENT ISSUES
INFORMATION ECONOMY REPORT 2005
imports of telecommunications equipment and com-puter and related equipment. The United States aloneimports one fifth of all telecommunications equip-ment and computers. The percentage of importsamong developing regions and major importers didnot undergo a significant change in the period 2000–2003. On the other hand, the subsector of electroniccomponents has seen some changes, and developingcountries now account for 64 per cent of imports (upfrom previous 54 per cent). This is largely due toChina, which has more than doubled its imports ofelectronic components in these three years, and in2003 imported 16 per cent of all electronic compo-nents. It is worth noting that China, together withHong Kong SAR and Singapore, amount for half ofthe developing countries’ imports of electronic com-ponents.
Directions of trade and South–South trade
When one looks at the direction of trade flows(exports) by development blocs (see table 1.24), theincreasing significance of trade among, and between,southern (developing) and transition economies isstriking. They experienced positive growth rates inthe last three years in all ICT goods categories.
The most important trade flows in telecommunica-tions equipment, computers and related equipment(35 per cent of all North–North trade), and otherICT goods are between developed countries, whiletrade in electronic components is largely betweendeveloping countries. Audio and video equipment ismostly exported to developed countries fromdeveloping countries.
Chart 1.18 a, b, c, d
Major importers by category of ICT goods, 2003 (million USD)
18a. Telecommunications equipment 18b. Computers and related equipment
18c. Electronic components 18d. Audio and video equipment
Source: UNCTAD calculations based on UN COMTRADE database.

INFORMATION ECONOMY REPORT 2005
CHAPTER 1. ICT INDICATORS FOR DEVELOPMENT: TRENDS AND MEASUREMENTS ISSUES 37
South–South trade is particularly substantial in elec-tronic components, which represent over 50 per centof all South-South ICT goods exports. But tradein the other sectors is growing at a slightly higherrate, particularly in telecommunications equipment(with a 9 per cent annual average growth rate for2000–2003). Trade among SEE and CIS economies ismost significant in the “other ICT goods” categories,while trade of computer and related components hasexperienced the highest compound annual growthrate during this period (25 per cent).
C. Measuring ICT in developing countries
The previous part of this chapter clearly reflects thelimited availability of internationally comparable dataon ICTs, in particular on the use and impact of ICTsin developing countries. This severely restricts anempirical analysis of the trends and impact of ICTs inthe context of the information economy. At the sametime, as ICTs become key elements of national devel-opment strategies, policymakers have an increasingneed for reliable data and indicators on the informa-tion society (UNCTAD, 2003a). Such data help for-mulate strategies for ICT-driven growth and monitorand evaluate economic and social developmentsrelated to ICTs; they also help companies takeinformed business and investment decisions. Being
able to measure the information society is thus a pre-condition for:
• Fine-tuning and assessing ICT policies andstrategies;
• Monitoring the digital divide;
• Evaluating and benchmarking informationsociety developments; and
• Documenting the impact of the informationsociety on the implementation of internation-ally agreed development goals and measuringprogress in the use of ICTs to achieve thosegoals.
The lack of comparable data not only hampers theability of policymakers and business people to takestrategic decisions, but also makes it difficult to carryout meaningful macroeconomic analyses of theimpact of ICTs on economic growth, trade, invest-ment and employment. Current research is limited tothe use of data on basic ICT infrastructure, such asthe number of telephone lines, PCs or Internet hostsavailable in countries. However, cross-sectoral studieson the economic impact of ICTs would require statis-tical data such as firm-level data on investments in,and use of, ICTs; the enabling resources that have ledto the effective use of ICTs; the performance of theseenterprises; the cost of ICTs; productivity growth inthe ICT-producing sector; changes in the patterns ofoccupations and skill requirements demanded of the
Value of exports (million USD), 2003 CAGR (%) 2000-2003
Trade flow
Tele-commu-nications
equipment
Computers and
related equipment
Electronic components
Audio& video
equipment
OtherICT
goods
Tele-commu-nications
equipment
Computers and related equipment
Electronic components
Audio & video
equipment
OtherICT
goods TotalICT
North-North 64'720 127'701 76'084 45'808 52'872 -11 -5 -8 5 5 -5%
North-SEE & CIS 4'591 3'245 1'277 779 1'581 30 20 14 27 21 23%
North-South 24'306 33'476 101'731 9'744 21'992 -8 -4 -2 0 2 -2%
SEE & CIS-North 273 98 407 232 178 5 -18 -6 55 -10 0%
SEE & CIS-SEE& CIS 99 49 45 92 157 13 26 6 17 7 12%
SEE & CIS-South 213 30 159 9 319 81 41 19 29 37 40%
South-North 36'479 116'273 65'867 52'502 8'800 7 2 -7 8 9 1%
South-SEE & CIS 592 688 407 658 92 58 41 66 27 25 42%
South-South 22'384 74'516 140'550 26'095 5'787 19 15 11 12 13 13%
Table 1.24
Direction of exports of ICT goods, 2003
Source: UNCTAD calculations based on UN COMTRADE database.

38 CHAPTER 1. ICT INDICATORS FOR DEVELOPMENT: TRENDS AND MEASUREMENT ISSUES
INFORMATION ECONOMY REPORT 2005
labour force; and general data on the shifts ofemployment patterns related to changes in produc-tion processes.
This section sheds further light on the process ofimproving data on the information society and partic-ularly on the adoption of ICTs by enterprises. It firstpresents work currently undertaken at the global leveland its link to the WSIS process. It then provides anoverview of the status of the collection of official ICTbusiness statistics in developing countries based onthe results of a metadata survey carried out with alldeveloping countries in the second half of 2004. Afew country examples follow, demonstrating howICT statistics have been successfully linked tonational ICT policymaking.
1. Global e-measurement initiatives
The striking absence of comparable data on ICTs indeveloping countries, and the resulting difficulties incarrying out meaningful assessments of the informa-tion society and its impact on development, haveprompted a number of stakeholders at national,regional and international levels to take action in thisregard. At the national level, an increasing number ofoffices responsible for producing statistical data havestarted to incorporate basic questions on ICTs intotheir national data collections or have carried out newICT-specific surveys. An assessment of the currentavailability of ICT data in developing countries will beprovided below (section C.3).
At the regional and international levels, several orga-nizations involved in ICT-related research and policy-making, including e-measurement, started to cooper-ate, recognizing that coordination of their work wasindispensable for reaching global harmonization ofICT indicators. Today, the global “Partnership onMeasuring ICT for Development” is widely recog-nized as playing a leading role in this process. Currentpartners include Eurostat, the ITU, OECD,UNCTAD, UNESCO Institute for Statistics, fourUN Regional Commissions (ECA, ECLAC, ESCAP,ESCWA), the UN ICT Task Force and the WorldBank. The Partnership provides an open frameworkfor coordinating ongoing and future activities in thearea of information society measurements, and fordeveloping a coherent and structured approach toadvancing the development of ICT indicators glo-bally, and in particular in the developing countries.National statistics offices from statistically advancedcountries are invited to contribute to the Partnership’s
activities and provide expertise and advice to NSOsfrom developing countries, as well as to transferknowledge in areas such as methodologies and surveyprogrammes.
The Partnership, which was officially launched on theoccasion of UNCTAD XI, held in Brazil in June2004, has three main objectives:
• To achieve a common set of core ICT indica-tors, to be harmonized and agreed upon inter-nationally, which will constitute the basis for adatabase on ICT statistics;
• To enhance the capacities of NSOs in develop-ing countries to develop their compilation ofstatistics on the information society on thebasis of internationally agreed upon indicators;
• To develop a global database on ICT indicatorsand to make it available on the Internet.
Since its launch, the following activities have beencarried out under the umbrella of the Partnership:
(a) A global stocktaking exercise to examine thecurrent and future availability of official informationsociety statistics and indicators in all countries (seesection C.3).
(b) A series of regional workshops to identify pri-orities for action in the area of ICT indicators andagree on a common set of core indicators at theregional level. Workshops have taken place in WesternAsia (Beirut, October 2004 and June 2005), Africa(Gaborone, October 2004, and Addis Ababa, June2005), and Latin America and the Caribbean (San-tiago de Chile, November 2004 and Santo Domingo,October 2005).
(c) The development of a core list of ICT indica-tors that could be collected by all countries (see sec-tion C.2.). The list covers four broad areas of meas-urement: basic ICT infrastructure and access, ICTaccess and use by households, ICT use by businessesand the ICT sector and trade in ICT goods. The listwas adopted by delegates attending the WSIS The-matic Meeting in Geneva (see next item).
(d) A WSIS Thematic Meeting on “Measuringthe Information Society”, held in Geneva from 7 to 9February 2005. The meeting agreed on a list of coreICT indicators that could be collected by all coun-tries; made suggestions on how the production ofICT statistics in developing countries could beenhanced through effective capacity-building meas-ures; and stressed the need to formalize the link

INFORMATION ECONOMY REPORT 2005
CHAPTER 1. ICT INDICATORS FOR DEVELOPMENT: TRENDS AND MEASUREMENTS ISSUES 39
between ICT and the development agenda, notablyregarding measurement of the achievement of theinternationally agreed development goals, includingthose contained in the Millennium Declaration.
In addition, a WSIS parallel event on measuring theinformation society will be held in Tunis on 15November 2005. The event will bring together ICTpolicymakers, statistical offices and telecom regula-tors to discuss the need for internationally compara-ble data on ICT access, use and impact, share bestpractices in ICT measurement and examine some ofthe policy issues impeding effective measurement ofthe information society. Thematic sessions will beheld on related policy issues such as measuring theimpact of ICT on progress towards the achievementof international development goals.
As a result of the initiatives taken by the differentstakeholders, discussions in international forums suchas the WSIS started to pay increasing attention to the
measurement of the information society (box 1.2).This was reinforced by pressure from the interna-tional development community for empirical evi-dence about the impact of ICTs on development, inparticular on pro-poor growth, and the contributionof ICTs to the progress made towards the achieve-ment of the MDGs.
2. Towards a core list of ICT indicators
As indicated in the previous section, comparable sta-tistical indicators should contribute to the follow-upand implementation of the WSIS Geneva Plan ofAction and to monitoring progress in bridging thedigital divide. But most importantly, a list of core ICTindicators should help countries to carry out their col-lection of ICT data so that results are internationallycomparable, to understand their development pathinto the information society, and to design ICT fordevelopment policies. Within the framework of thePartnership on Measuring ICT for Development,
Box 1.2
Measuring the Information Society and the WSIS
The WSIS Plan of Action (para. 28), which was adopted by delegates at the Geneva Summit in December 2003, calls for action todevelop comparable ICT indicators: “A realistic international performance evaluation and benchmarking (both qualitative and quantitative), through comparable statisticalindicators and research results, should be developed to follow up the implementation of the objectives, goals and targets in the Plan ofAction, taking into account different national circumstances.… All countries and regions should develop tools so as to provide statistical information on the Information Society, with basic indicatorsand analysis of its key dimensions. Priority should be given to setting up coherent and internationally comparable indicator systems,taking into account different levels of development.”
During the Tunis phase of the Summit, further progress was made at both the political and the substantive level: • The WSIS Thematic Meeting on Measuring the Information Society (Geneva, 7–9 February 2005) adopted a core set of ICT indi-
cators that could be collected by all countries. The outcome of the meeting was reported to the WSIS PrepCom2 as a concreteinput into the Tunis Phase of the Summit.
• Several regional WSIS conferences addressed the subject of ICT indicators: the WSIS Africa Regional Preparatory Conference(Accra, 31 January – 1 February 2005); the Pan-Arab regional conference WSIS-Phase II (Cairo, 8–10 May 2005); and theRegional Preparatory Ministerial Conference of Latin America and the Caribbean for WSIS II (Rio de Janeiro, 8–10 June 2005),together with its regional action plan, eLAC 2007.
The subject of ICT indicators thus became an accepted element of the WSIS process and its follow-up. At the time of finalizing this report,the draft text of the final Tunis document makes reference to the subject of indicators calling for a continuation of the work of thePartnership.
1 The document, WSIS-II/PC-2/DOC/3-E, is available at http://www.itu.int/wsis/docs2/pc2/

40 CHAPTER 1. ICT INDICATORS FOR DEVELOPMENT: TRENDS AND MEASUREMENT ISSUES
INFORMATION ECONOMY REPORT 2005
much progress has been made during the past year inestablishing such a core list; indeed, this has been oneof the three key objectives of the Partnership.
Following a broad consultation process involving thePartners and NSOs, a proposal for a core list of indi-cators was prepared as an input to the WSISThematic Meeting on Measuring the InformationSociety, held in Geneva from 7 to 9 February 2005.25
It contained four sets of indicators: basic ICT infra-structure indicators, ICT access and use by house-holds and individuals, ICT use by enterprises, andthe ICT sector (see table 1.25 and box 1.3). The listof core indicators was accepted as an agreed outcomeof the meeting and is contained in annex IV of thischapter.
Box 1.3
Core ICT business indicators
The core list of ICT indicators contains 12 business indicators:Basic core• Proportion of businesses using computers;
• Proportion of employees using computers;
• Proportion of businesses using the Internet;
• Proportion of employees using the Internet;• Proportion of businesses with a website (or web presence where the business has control over the content)• Proportion of businesses with an intranet;
• Proportion of businesses receiving orders over the Internet;• Proportion of businesses placing orders over the Internet.
Extended core• Proportion of businesses accessing the Internet by modes of access (response categories);
• Proportion of businesses with a local area network (LAN);• Proportion of businesses with an extranet;
• Proportion of businesses using the Internet by type of activity (response categories).These indicators cover basic, policy-relevant information on the use of ICTs in enterprises. They are well defined, reflecting an internationalconsensus on measuring ICT in enterprises; they have been tested for several years and are easy to collect; and there are model questionsavailable that can be used in national surveys. Most importantly, however, from a policy perspective, the core list contains basic useindicators, such as the kind of activities enterprises carry out over the Internet. Most developing countries that have collected ICT businessindicators thus far have mainly asked questions about whether a company has computers, Internet access or a website. Little information hasbeen collected about what companies actually do on the Internet. The core list provides useful guidance on the type of information that couldbe collected in this regard, and in a way that makes the results be comparable internationally.
Set of indicatorsBasic core
Extended core Reference Total
ICT infrastructure and access 10 2 12
ICT access and use by households and individuals
10 3 1 14
ICT use by businesses 8 4 12
ICT sector 4 4
Total 32 9 1 42
Table 1.25
Number of core indicatorsby classification
Source: Partnership on Measuring ICT for Development (2005a).

INFORMATION ECONOMY REPORT 2005
CHAPTER 1. ICT INDICATORS FOR DEVELOPMENT: TRENDS AND MEASUREMENTS ISSUES 41
The selection of indicators reflects the key actors inthe information society (individuals, households andenterprises). Most importantly, however, it reflects anemerging consensus on definitions, guidelines andmethodologies regarding individual, household andbusiness ICT indicators, based on the outcome ofvarious national, regional and international initiatives.For example, most of the basic core ICT access indi-cators are compiled by the ITU; OECD and Eurostathave developed model household and business sur-veys.26 Less progress has been made on other ICT-related indicators, such as government or health. Thelatter will thus be dealt with at a later stage.
Future work on the list of core ICT indicators canaddress issues such as characteristics of Internet users(gender, language, disability, indigenous status, resi-dent status and geographical location), content lan-guage, community access, trade in ICT services, orICT investment and information security data. Meth-odological issues regarding definitions of the Internet,intranets, extranets, LANs and websites, and the dis-tinction between fixed and mobile broadband, arecurrently being added to the list.
The list of core indicators provides useful guidancefor countries wishing to start collecting ICT indica-tors, and constitutes the basis for developing interna-tionally comparable statistics on the information soci-ety. There is plenty of scope for further developingthe core list, which can be amended or expanded withnew policy-relevant statistical indicators as experienceis gained. This work has continued throughout 2005and will be presented at the WSIS Tunis parallel eventorganized by the Partnership.
Not all countries are at the same level of developmentor have well-developed statistical systems. Countrieswith little or no ICT infrastructure may not see theneed to collect ICT indicators. Countries with grow-ing investment in ICT may want to monitor thisgrowth by starting to measure ICT; these countriesmay want only to collect the most basic information,while others, with higher levels of ICT investment,may want to go further. To give further guidance tothe different collection efforts by countries, a distinc-tion was made between “basic core” indicators (forcountries in the initial stages of ICT data collection,and covering mainly basic access indicators), and“extended core” indicators (for countries with moreadvanced ICT data collection, with some basic useindicators added).
In addition, developing countries will always have torespond to national policy needs, which may be onlypartially covered by the core list, and might choose tosupplement this core list with additional indicators. Inparticular, the discussions held in 2004 and 2005 invarious forums point to a marked interest in develop-ing ICT indicators related to education, government,health or agriculture. Unlike in the case of the indica-tors that are already in the core list, which have beenwell defined and repeatedly tested and for which thereis a critical mass level of consensus, the developmentof ICT indicators in the areas mentioned before is anongoing process that still requires further widespreadconsultation and consideration. The indicators haveto be adequately defined so that they can be trulymeasurable and useful. ICT indicators in these addi-tional areas will become readily available only at alater stage, most likely in the medium term.
3. Status of ICT business indicators indeveloping countries
This chapter is primarily concerned with the use ofICTs by enterprises in developing countries. There-fore, efforts to enhance the availability of relevantdata need to start with an assessment of current datacollection concerning ICT business indicators. Thissection presents a summary of the results of a surveyon the status of ICT indicators in developing coun-tries, focusing on ICT business indicators.27 Theyhighlight differences among regions in the developingworld and underline the best performers and theregions that are most active in the planning of futuredata collection, as well as the gaps in the availability ofICT-related statistics.28 The questionnaire was sent to179 countries in Africa, Asia-Pacific, Central Asia andCentral and Eastern Europe, Latin America and theCaribbean, and Western Asia. Of those countries, 85returned the questionnaire, a response rate of 47 percent.
NSOs were asked to indicate, on the basis of theirinstitution’s perspective, the level of demand for col-lecting ICT business indicators (see chart 1.19).Excluding the countries that did not respond to thisquestion, the median value of all replies is “high”demand, with 37 per cent (31 countries) answeringeither “very high” or “high”. The NSOs in the 26countries that did not respond to this question wereprobably unable to answer because the issue has notbeen addressed or discussed at the policy level.

42 CHAPTER 1. ICT INDICATORS FOR DEVELOPMENT: TRENDS AND MEASUREMENT ISSUES
INFORMATION ECONOMY REPORT 2005
The key part of the questionnaire was a list of 20 indi-cators concerning access to and use of ICTs in enter-prises. Respondents were asked whether the individ-ual indicators are currently available from officialstatistical sources, whether they intend to producethem in the next year or three years, or whether theyare not planning to do so.
Table 1.26 shows the number of countries that collecteach indicator across regions. OECD member coun-tries are added as a comparison.29 Table 1.27 showsthe number of countries that already collect, plan tocollect or do not plan to collect ICT business indica-tors (65 out of 179 respondents replied to this ques-tion), for both developing countries/CEE andOECD countries.
The results show that, overall, data and official statis-tics on ICT in enterprises are still limited in mostdeveloping countries. However, 65 countries (59 percent of respondents) do collect some type of ICTbusiness indicator. Most of these are indicatorsrelated to basic access to ICTs (such as presence oftelephones, computers and the Internet). The infor-mation is frequently collected through manufacturingand services establishment surveys, which mostNSOs already have in place. All regions, except West-ern Asia, also collect a limited number of moreadvanced ICT access and use indicators (such as pres-ence of website, local network and modes of Internet
access). This area of statistics is frequently surveyedthrough specific ICT business surveys.
Indicators referring to the type of Internet activitiesand e-commerce are collected by a small portion ofNSOs across all regions (excluding Western Asia)(average of 12 countries). The least collected indica-tors are those on customer groups or destination ofInternet sales (8 per cent), barriers to e-commerce(9 per cent) and geographical location of sales (6 percent). These types of indicators are produced throughmore specific surveys aimed at collecting informationabout ICTs in particular. Therefore, it is mainly thecountries that have specific “ICT in business” surveysthat can provide information on these indicators.However, it was also noted that “ICT in business”surveys tend not to be carried out on a regular basis,unlike the other types of surveys. Indicators onbarriers to ICTs are rarely collected through surveysthat are not explicitly aimed at investigating ICT usein enterprises.
In the OECD countries, ICT data collection is con-siderably more advanced and the planning processlargely completed (see low figures in “planning” col-umn, table 1.27). Most countries have been collectinga large number of ICT-in-enterprise statistics for thepast few years. This is largely the result of the work ofthe OECD Working Party on Indicators for theInformation Society (WPIIS), a group that has metsince 1997 and is composed of representatives fromNSOs of OECD member countries.
Observations can also be made concerning theregional distribution of the responses. In Africa,Asia-Pacific and Central Asia, and CEE, each indica-tor is collected, although not by all countries. Asia-Pacific and Central Asia, and CEE, are the regionsthat have the highest number of countries collectingICT business indicators. In these regions the level ofdemand for ICT-related business statistics is on aver-age high, and NSOs respond effectively to thisdemand. In Latin America and the Caribbean, eachindicator except “geographical location of sales” iscollected, although not by all countries. In WesternAsia, six indicators out of 20 (“basic access to ICT”indicators and indicator 12 on “services the Internetis used for”) are collected; nevertheless, this is alsothe region where the highest percentage of countriesplans to collect business indicators within one orthree years.
Chart 1.19
Global level of demand of ICT business indicators
Source: Partnership on Measuring ICT for Development (2005 b).

INFORMATION ECONOMY REPORT 2005
CHAPTER 1. ICT INDICATORS FOR DEVELOPMENT: TRENDS AND MEASUREMENTS ISSUES 43
In Africa, where 13 countries out of the 19 respond-ents are LDCs, few NSOs collect ICT indicators andmany have no defined plans to collect most of themin the near future. However, since the indicateddemand for this region is on average high, it can beassumed that the collection of ICT business statisticsis on the agenda but will be implemented over aperiod longer than three years. These countries arelikely to be in particular need of capacity building andtraining at the national level. In particular, NSOs indeveloping countries that have limited or no experi-ence in data collection would benefit from technicalassistance in the establishment of such collection (orin the inclusion of ICT statistics in existing mecha-nisms), as well as in collecting information society sta-
tistics more broadly. This will be further addressed insection D.
4. ICT policymaking and ICT measurement
This section will give examples of developing coun-tries that are actively collecting data and statistics andhave used such data for ICT policy design, evaluation,monitoring and benchmarking. Observations willthen be made on what these examples show about therelationship between ICT data collection and policy-making, making the case for enhanced ICT statistics,particularly for business. The selection of countrieswas made based on the results of the global ICT
Indicator Africa (12/53)Asia-Pacific
(11/53)
Central Asia and CEE(17/24)
Latin America and the
Caribbean(18/36)
Western Asia (9/13)
Total developing/CEE (65/179)
OECD(28/30)
Fixed telephone 9 9 10 8 4 40 1Mobile devices 5 9 11 8 1 34 3Computer 6 7 6 7 2 28 25Number of computer 6 6 6 3 1 22 1Internet 6 9 11 11 1 38 25
Type of Internet access 5 5 6 4 0 20 24
Local network 4 5 5 5 0 19 23Website 7 5 5 9 0 26 25ICT Investment 5 5 6 2 0 18 5Share of PC 3 4 7 2 0 16 22Share of Internet 1 3 5 2 0 11 22
Services the Internet is used for 2 5 4 4 1 16 22
Value of purchases 4 1 3 3 0 11 17
Value of sales 4 1 3 5 0 13 24
Customer group 2 1 2 2 0 7 20ICT training 4 1 1 4 0 10 18Barriers to PC 4 4 2 1 0 11 0Barriers to Internet 3 4 3 1 0 11 1Barriers to e-commerce 2 2 2 2 0 8 21Geographical location 1 1 3 0 0 5 17
Table 1.26
Number of countries collecting each indicator by region
Source: Partnership on Measuring ICT for Development (2005 b).

44 CHAPTER 1. ICT INDICATORS FOR DEVELOPMENT: TRENDS AND MEASUREMENT ISSUES
INFORMATION ECONOMY REPORT 2005
statistics stocktaking and the availability of comple-mentary background material.
The case of Trinidad and Tobago
The national ICT agenda of Trinidad and Tobagoaims to make the country into a knowledge-basedsociety by 2008 and is part of the country’s overalldevelopment agenda to transform the country into adeveloped nation by the year 2020.31 The nationalICT plan is led by the Ministry of Public Administra-tion and Information and seeks to “spur the nextwave of social and economic development” throughnational ICT planning, of which one programme isfocused on e-commerce/e-business development.Phase 2 of the plan (Research and Mapping CurrentCapabilities) explicitly contemplated the production
of national statistics to support ICT planning, whichwas done with the 2003 National Survey of E-Com-merce Usage and Awareness among Businesses.
The results of the above-mentioned survey served toprovide a baseline snapshot of the situation of ICTsin the country at the start of the implementation of itsICT agenda.32 The survey was conducted on the basisof a register of businesses listed by the Central Statis-tical Office.33 Although several business sectors wererepresented, approximately half of the respondentswere under the national classification of “Distribu-tion, restaurants and bars”.34 At least half of therespondents were also microenterprises (under 10employees). The results showed that although mostbusinesses have computers and Internet accessthrough the telephone (87 per cent), only the majorindustries have had the wherewithal to invest in the
Collecting Planning to collect No plan to collect
Indicator Non-OECD OECD Non-OECD OECD Non-OECD OECD
Fixed telephone 40 1 9 0 16 27Mobile devices 34 3 11 1 18 24Computer 28 25 11 2 20 1Number of computer 22 1 14 1 25 26Internet 38 25 10 2 16 0Type of Internet access 20 24 12 3 28 0Local network 19 23 15 1 28 3Website 26 25 13 2 25 0ICT Investment 18 5 14 0 29 23Share of PC 16 22 18 2 27 4Share of Internet 11 22 21 2 29 4Services the Internet is used for 16 22 19 3 27 2Value of purchases 11 17 15 8 35 2
Value of sales 13 24 15 4 33 0Customer group 7 20 15 5 37 3
ICT training 10 18 18 5 32 5
Barriers to PC 11 0 18 0 31 28
Barriers to Internet 11 1 19 1 31 26Barriers to e-commerce 8 21 19 2 32 5Geographical location 5 17 16 7 38 4
Table 1.27
Number of countries planning to collect each indicator
Source: Partnership on Measuring ICT for Development (2005 b).

INFORMATION ECONOMY REPORT 2005
CHAPTER 1. ICT INDICATORS FOR DEVELOPMENT: TRENDS AND MEASUREMENTS ISSUES 45
switch to broadband, dedicated data lines and busi-ness automation. B2C is underdeveloped and web-sites lack functionality for online sales, since only avery small percentage of potential clients are currentlyusing the Internet (only 9 per cent of regular Internetusers). B2B and other applications of e-business arealmost non-existent, most companies using the Inter-net for e-mail and basic web presence.35 Employeeuse of ICTs in enterprises is also limited, since com-puters are shared and there are few work e-mailaddresses.
In addition, it is interesting to note that Trinidad andTobago has also used ICT indicators to conduct somebenchmarking of its own, including with two of thecountries highlighted in this section: Mauritius andSingapore (Ministry of Public Administration andInformation of Trinidad and Tobago, 2003a). Theywere chosen among others because they were smallisland nations with a similar population, albeit withdifferent income levels. The benchmarking was com-prehensive and covered several aspects of the infor-mation society, from basic infrastructure to e-govern-ment. On e-business (referred to as economy andfinance in the study), the benchmarking indicated thatalthough national enterprises have been slow to adoptwebsites, for example, this seemed to be consistentwith the other developing countries in the study(Costa Rica, Jamaica and Mauritius). Trinidad andTobago also recognized low levels of B2B or B2C e-commerce applications, on a par with Mauritius. Thiswas despite the apparent pervasiveness of e-paymentsystems (in this context, the study compared its sur-vey results with the rankings of the Global Informa-tion Technology Report).
ICT data collection and the benchmarking studyallowed Trinidad and Tobago to identify the buildingblocks for its ICT development (high GNP per capitafor a country in this geographical region, strong useof fixed line and cellular telephone service, high qual-ity of public schools, high availability of venture capi-tal, adequate overall infrastructure quality) and theweaknesses on which work is needed (low generalInternet use, mirrored by low availability of businessand government online services; no definitive band-width policy; telecommunications sector character-ized by poor access, bandwidth and affordability; ahigh incidence of IT brain drain). As Trinidad andTobago’s national ICT plan unfolds, the Ministry ofPublic Administration and Information Communica-tions has recognized that ongoing measures to trackdevelopment progress must be implemented, and reg-ularly updated. This will require coordination
between the competent ministry and the Central Sta-tistical Office to conduct regular surveys, using theinitial e-readiness study as reference. Certainly, a fol-low-up survey should be conducted in 2008, the tar-get date for the Fast Forward Agenda.
The case of Singapore
The Infocomm Development Authority of Singapore(IDA) has been the competent authority for thedevelopment of Singapore’s information economysince 1999, operating under the Ministry of Informa-tion, Communications and The Arts (MICA) for theimplementation of the national ICT plan, “ConnectedSingapore”. IDA has a comprehensive mandate tooversee everything from the development of Singa-pore’s ICT industry to its e-government. Since 1996,the Government of Singapore has had a very clearpolicy thrust for the development of e-commerce.36
In terms of e-business, IDA aims to create an envi-ronment conducive to its development, focused onthe legal and policy framework, infrastructure andbuilding businesses’ capabilities.
The Singapore Department of Statistics (DOS) andIDA are the main government agencies responsiblefor the compilation of ICT-related statistics in Singa-pore.37 The DOS compiles and publishes ICT-relateddata from existing nationwide and economy-widebusiness and household surveys, while data on e-commerce and ICT use in businesses are periodicallycollected as part of IDA's mandate.
The combined results of the multiple surveys thus farclearly show that Singapore is well advanced in theinformation economy. The last survey on ICT use bybusinesses showed that access to basic ICT infra-structure could be reaching saturation point at about83 per cent penetration, but that there is dynamism inthe adoption of new technologies (narrowband tobroadband, wireless) and applications (web-basedservices), in particular those aimed at increasing pro-ductivity and business relationships (IDA, 2002a and2003b). Regarding the use of ICT by employees,another survey indicated that about 13 per cent ofworking Singapore residents were telecommuters, andthat the more frequently used broadband Internetapplications used by these telecommuters for busi-ness purposes were e-mail (99 per cent), access totheir enterprises’ Virtual Private Networks (21 percent), videoconferencing (16 per cent) and telephony(13 per cent) (IDA, 2002a).

46 CHAPTER 1. ICT INDICATORS FOR DEVELOPMENT: TRENDS AND MEASUREMENT ISSUES
INFORMATION ECONOMY REPORT 2005
It should be noted that Singapore has consistentlyused its ICT data collection exercises as opportunitiesto obtain inputs from individual and corporate stake-holders to guide future policy actions, including onbarriers to e-commerce (cost of systems implementa-tion, lack of awareness, security concerns), perceivedbenefits of ICT (enhanced productivity, flexibility,reduced costs) and opportunities for government-ledaction (skills development, financial grants for ICTimplementation). For example, the 2002 survey onbroadband and wireless use asked about the perceivedbenefits of telecommuting through broadband Inter-net, namely increased flexibility, reduction of traveltime and cost, increased productivity with less distrac-tion, better balance between “work and play”, andextended employment opportunities for people withdisabilities. Such perceptions play a determining rolein the ongoing adoption of such practices by enter-prises and the implementation of policy actions toencourage it.
In terms of benchmarking, Singapore’s policy meas-ures and data clearly show the country to be theleader in ICT uptake and use by most stakeholders,both in the Asian region and worldwide. Singapore isrepeatedly at the top of the various ICT indices andrankings, which are used as leverage for the develop-ment of its ICT industry through foreign investmentsand public–private partnerships. In the case of Singa-pore there is a virtuous circle between positive bench-marking and advancing ICT policy objectives andactions, the Government feeling compelled to pre-serve its leading position (IDA, 2003c). In this sense,Singapore is proactively involved in regional efforts todevelop the information economy, both to developthe regional market for ICT goods and services (seesection C.3) and to become a regional hub for e-busi-ness. Benchmarking has highlighted Singapore’sexample for other developing countries that aredeveloping their information economies, in particularwith regard to policy formulation and follow-up, ofwhich statistical data are an integral part for diagnosis,monitoring and evaluation.
Singapore’s increasingly significant investments indeveloping its information economy will require con-tinued and expanded ICT business data collection.For example, in the case of a large project to developICT-enabled integrated supply chains for high-techmanufacturing,38 future collection of data on use of e-business applications will show progress in the adop-tion of such supply chains. ICT sector indicatorsshould also be used to evaluate the impact of such aproject, in particular regarding value added. Periodical
data on Internet modes of access should indicateprogress in the adoption of wireless, broadband andother technologies that have an impact on enterpriseproductivity, particularly in developing B2B e-com-merce.
The building of stakeholder confidence and trust in e-commerce and e-business was a main goal of Singa-pore’s policy to develop the adoption of e-commerce(IDA, 2001).39 Indicators on ICT uptake and use, inparticular Internet use by households, individuals andbusinesses, can serve to show the progress in adop-tion of, and thus of confidence in, e-commerce and e-business. Business ICT data should also serve to eval-uate the effectiveness of extensive efforts by IDA indeveloping capabilities for e-businesses. Current datacollected by Singapore reflect workforce proficiencyin ICT, but not the frequency or intensity of such use,or the proportion of employees in an enterprise thatwill use ICTs on a regular basis.40
The case of Mauritius
Mauritius has had a strong national IT strategic planin place since 1998, modelled on Singapore’s ICT pol-icy. The National Computer Board (NCB) and theMinistry of Information Technology and Telecom-munications are the competent authorities in chargeof its implementation, which includes the liberaliza-tion of telecommunications, the diffusion of ICT inthe workforce and e-government. To support itsmandate, the NCB has an ongoing project for datacollection and analysis, mostly focused on the ICTsector. Chapter 5 of the E-Commerce and DevelopmentReport 2003, which dealt with business process out-sourcing services for development, examined Mauri-tius’ plan to become a “cyber island” and a regionalICT hub, including through the Ebene Cyber Cityproject.41
A reduced survey in 2001 (300 businesses with morethan 10 employees) indicated that 83 per cent of busi-nesses had at least one computer and 75 per cent hadInternet access (National Computer Board of Mauri-tius, 2001). However, this result is affected by the factthat it excluded microenterprises, nearly half of thesample was made up of services industries and morethan half had a turnover of almost $700,000, which isnot insignificant in Mauritius’ economy. The Censusof Economic Activities in 2002 (excluding agriculturalenterprises) indicated a nationwide proportion ofbusinesses’ Internet access of only 4.9 per cent.Nonetheless, it is precisely on the high-use enterprise

INFORMATION ECONOMY REPORT 2005
CHAPTER 1. ICT INDICATORS FOR DEVELOPMENT: TRENDS AND MEASUREMENTS ISSUES 47
sector that Mauritius is concentrating its ICT policies(including manufacturing, wholesale and retail trade,hotels and restaurants, transport, storage and commu-nication, and banking and finance).
Owing to the size of the country, Mauritius’ internalICT market is very small and businesses must look toexternal markets for significant growth and econo-mies of scale that would justify ICT investments. InMay 2005 there were 78 ICT companies in Mauritius,employing approximately 3,500 people, with severalprojected new arrivals. This does not mean that atten-tion is not being paid to the overall diffusion of ICTsin Mauritius, since broader diffusion of ICTs, includ-ing through e-government, would reduce the cost ofconnectivity.42 Local diffusion is particularly impor-tant for the development of a local ICT workforce tobenefit from ICT sector growth and to use ICTs todevelop other service-based industries, such as tour-ism (see chapter 4 on e-tourism).
Since the IT household surveys (1998, 2000 and2002) have enabled Mauritius to track progress inhousehold access to and use of ICTs, it would seemobvious that the country should ensure that periodicICT surveys are also carried out in the business sec-tor. Mauritius has already taken a step in the rightdirection, the NCB having issued in 2004-2005 aninvitation to tender for conducting an assessment ofICT indicators aimed at evaluating the use of ICTs inkey economic sectors in Mauritius and serving as aninput for the elaboration of specific ICT policies. Theprojected assessment includes an ICT use survey inbusinesses that will update the 2001 information andwill measure (by sector) the computerization level,ICT use, investment and spending, infrastructure,human resource profile and the extent of e-commerceadoption. The assessment should also include abenchmarking exercise based on ITU’s Digital AccessIndex, which is partly based on the core indicatorsdiscussed in this chapter (National Computer Boardof Mauritius, 2002).43
The case of Colombia
Colombia’s Connectivity Agenda is led by the Minis-try of Communications and aims at the diffusion ofICTs as a catalyst for economic and social develop-ment. The Agenda is geared towards citizens, enter-prises and public administration. In the case of enter-prises, ICTs are to be encouraged to support growthand competitiveness, improve market access for theproductive sector and promote job creation. For
these purposes, ICT policy includes the developmentof electronic commerce, the promotion of the ICTsector and the use of e-business by SMEs (62 per centof GDP and 31 per cent of exports).44
In 2001, Colombia’s NSO conducted a survey-cum-model for the measurement of ICTs that was theresult of an agreement with the Ministry of Commu-nications; it aimed to provide a diagnosis of the statusof the information society in Colombia that would bethe basis for future work on ICT (including informa-tion gathering) (Departamento AdministrativoNacional de Estadística, 2003). Regarding the produc-tive sector, the survey focused on manufacturing,trade, services and microenterprises. It yielded someinteresting findings, such as that in terms of e-busi-ness, manufacturing makes extensive use of manage-ment software (83.1 per cent), but not of productionsoftware (19.6 per cent). In terms of e-commerce, inthe trade sector there was extensive use of websitesfor marketing products (81.1 per cent), but not fororder processing (10.3 per cent), online payments (1.1per cent) or secure transactions (3.2 per cent). Also,there were low percentages of ICT-trained personnelin all sectors (from 2.1 per cent in microenterprises to11 per cent in manufacturing).
In 2005, Colombia conducted a benchmarking exer-cise that took into consideration several internationalindices and rankings, and compared the country’s per-formance with that of developed countries and coun-tries in the region.45 Despite the recognition that theindices were not comparable the one with the otheror from one year to the other, the benchmarkingserved to identify desirable goals with respect to cer-tain indicators, such as increasing broadband andInternet user rates, and to the policies that influencethem, such as liberalization of the telecommunica-tions sector. The benchmarking also identified posi-tive developments, such as the increase in local web-sites and e-government services, which triggered anincrease in Colombia’s ranking in the e-governmentreadiness index of the UN Department of Economicand Social Affairs (UNDESA).
Although Colombia’s survey on ICT use was releasedat the end of 2003, the reference year is 2001 and theinformation is thus somewhat dated. In view of theGovernment’s programme to promote ICTs amongSMEs, expected developments in the spread ofbroadband and the elaboration of a strategy todevelop a software industry,46 the ConnectivityAgenda will be well served by an updated survey onICT use by businesses in the short to medium term.

48 CHAPTER 1. ICT INDICATORS FOR DEVELOPMENT: TRENDS AND MEASUREMENT ISSUES
INFORMATION ECONOMY REPORT 2005
At the same time, the survey should provide a morein-depth analysis of the reasons for any progress ordeterioration in the indicators and assist the compe-tent authority for the Connectivity Agenda in formu-lating the actions to address those findings.
Observations
Some observations can be made taking into accountthe experience of the above-mentioned countries, aswell as others surveyed for this report.
• Since ICT data collection in developing coun-tries, particularly data on business, is nascent,the data are being used mainly for diagnosis ofthe status of the information society/informa-tion economy of a country.
• There is an increased interest on the part ofseveral developing countries in internationalbenchmarking. Benchmarking can highlightexceptional cases such as Singapore, whichincidentally takes advantage of benchmarkingto attract ICT investments. Developing coun-tries that are less digitally advanced can alsodraw lessons from such exceptions, particularlyon the thoroughness of ICT policy planningand implementation, and on the use of updateddata for regular assessment of progress in ICTuptake.
• As data from initial or one-time surveys agethere is a growing interest in updating collec-tions. There appears to be increased awarenessof the need for periodic data collection for themonitoring and evaluation of policies, andcross-verification of international rankings.The WSIS and the MDGs have increasedawareness and the political will of countries todevelop their information society policies,including data collection to support those poli-cies.
• Data collection still remains largely focused oninfrastructure and household and individualaccess. The availability of business ICT indica-tors from developing countries could andshould be increased, in a manner that can becomparable internationally. Just as householdand individual indicators serve as measures of acountry's progress in the information society,so business indicators will indicate a country'sprogress in the information economy.
• It is worthwhile further exploring the extent towhich the collection, or lack thereof, of certainICT business statistics is related to the level ofdemand in countries, and to what extent it isrelated to the level of resources available toNSOs. The type of data collected officially bycountries may also respond to the real or per-ceived usefulness of such data to policymakers.For example, countries with explicit ICT-related development policies or with active ICTsectors would need more specific indicators forpolicy evaluation or benchmarking. Of course,the comparability of such indicators shouldalso be considered in order to make them rele-vant to a benchmarking exercise.
• Coordination between national statisticaloffices and ICT-related competent nationalauthorities (ministries of communication, edu-cation, finance, science and technology, trade,etc.) is essential to the ability to collect, dissem-inate, and meaningfully use ICT statistical data.This should include awareness creation and atransparent arrangement for information shar-ing, coordinated work for the inclusion of ICTquestions in censuses, identification of sam-ples, statistical capacity building and sharing oflogistical resources. To this end, several coun-tries have established high-level task forces orcoordination bodies that monitor the imple-mentation of ICT policies, for which indicatorsare needed. Coordination will also involve theprivate sector, which is determinant in ICTinvestments, business adoption of ICTs andthe development of the ICT sector.
• Although a coordinating body with a strongmandate and sufficient resources can performeffective data collection, such as IDA in Singa-pore, it is important that NSOs and relevantsector ministries as the main source of officialstatistics in a country be the main players inboth data collection and analysis. This ensuresthat data are mainstreamed as a policymakingtool.
D. The road ahead
Analysing trends in the spread of the informationeconomy in developing countries is a challenging task.Data are scarce, not always comparable, and not yet atthe level of detail necessary for measuring the impactof ICTs on economic development and growth. Theoverview of basic developments in ICT access and

INFORMATION ECONOMY REPORT 2005
CHAPTER 1. ICT INDICATORS FOR DEVELOPMENT: TRENDS AND MEASUREMENTS ISSUES 49
use presented in the first part of this chapter showedthat while rates of growth of basic access to ICTs arehigh in most developing countries, more advanceduse of ICTs for business activities such as enhancedcustomer services or supply chain management isnascent. At the same time, the impressive growth inthe numbers of cellular subscribers in many develop-ing countries could generate additional businessopportunities in some of the poorest countries.
While there are clear deficits of comparable ICT-related data, in particular data on the adoption of ICTby enterprises, there are also clear signs that anincreasing number of developing countries pay atten-tion to the development of ICT statistics, recognizingthe need to monitor their information societies andtake informed decisions concerning ICT policies fordevelopment. The country examples in the previoussection demonstrated how ICT measurement cancontribute effectively to improving the national ICTpolicy agenda.
In order to make further progress in this work thefollowing suggestions for policy action are provided.
1. Policy commitment and coordination
The development of comparable data, and the crea-tion of the necessary statistical tools, constitute along-term process. Therefore, even countries with rel-atively less advanced information societies shouldstart the process early in order to have some initialdata in the medium term.
In many countries, there is still an important need forawareness building both at the political and technicallevel. In some cases, ICT-driven ministries are keenon having the data, while statistical offices are slow toreact. In other cases, statistical offices are aware ofICT measurement issues but lack the resources andrelated political mandates to further develop the nec-essary programmes. Hence, there is a need to link thenational policy agenda with the e-measurementagenda, and this requires effective cooperationbetween policymakers and national statistical systems.
As at the national level, it is essential to establish thelink between ICT policymaking and ICT measure-ment in international forums dealing with the infor-mation society. Follow-up to and review of the WSISprocess will require the continuous monitoring of theprogress of information society developments, in par-
ticular in developing countries. This will require allcountries to develop comparable statistical indicators,which will become a critical element of the implemen-tation and evaluation of the Geneva Plan of Action.
2. Data collection and capacity-building
Coordination among different entities of national sta-tistical systems involved in the collection and dissemi-nation of statistical data is essential, owing to thecross-cutting nature of ICTs. The “statistical system”is stressed, as not all countries have a centralized sta-tistical office, and statistics may be the responsibilityof sector ministries, regulators or special agencies out-side the NSO.
The list of core ICT indicators presented in sectionC.2 provides a basis for starting to collect a smallnumber of ICT statistics, such as statistics on Internetuse by businesses or web presence. Countries thatlack resources to implement special ICT surveysshould follow a pragmatic approach, for example byincorporating a few basic questions into existing sur-veys.
Building capacity in statistical offices of developingcountries will be essential to improving the produc-tion of official information society statistics. NationalGovernments, with the support of the internationalcommunity, are called on to provide the necessarysupport to relevant statistical offices in designing andimplementing ICT statistical compilation pro-grammes. The Partnership on Measuring ICT forDevelopment can play an important role in thisregard. During the first phase of the Partnership,much emphasis has been put on establishing a list ofcore ICT indicators as a starting point for the collec-tion of internationally comparable data on ICT. In thenext phase, partners need to put more emphasis onthe building of capacity in developing countries' sta-tistical systems, which will include seeking the fundsnecessary for carrying out such activities.
Capacity-building for ICT statistics should be inte-grated with existing activities into statistical capacity-building and focus on sustainable systems. Capacity-building and technical assistance programmes shouldcover areas such as methodologies and definitions,survey implementation and data collection, data veri-fication, database development and analysis.

50 CHAPTER 1. ICT INDICATORS FOR DEVELOPMENT: TRENDS AND MEASUREMENT ISSUES
INFORMATION ECONOMY REPORT 2005
More specifically, capacity-building activities shouldaim at:
• Developing specialized training courses on ICTstatistics for practitioners from statisticaloffices in developing countries, including thepreparation of guidebooks on core indicators,comprising best practices, model question-naires and suggestions about methodologiesand data collection measures for developingcountries;
• Conducting training workshops for local staffinvolved in the collection of ICT indicators;and for policy-makers and regulators to raiseawareness about the importance of indicatorsfor monitoring ICT policies and carrying outimpact analysis;
• Assisting NSOs in developing ICT data collec-tion (e.g. defining frameworks, methodologies
or survey measures), database developmentand dissemination;
• Building regional statistical networks for ICTindicators (including the establishment oftechnical working groups on ICT indicators atthe regional level and conducting of technicalworkshops) to advance the development ofinformation society indicators, to continuediscussions on indicators, model questionsand survey implementation at the regionallevel, and to ensure the harmonization of ICTdata and statistics across countries in theregion;
• Developing common approaches to the collec-tion of ICT data and statistics and the harmo-nization of the work on ICT indicators at theglobal level, so as to increase comparabilitybetween countries and to develop a globaldatabase on ICT indicators.

INFORMATION ECONOMY REPORT 2005
CHAPTER 1. ICT INDICATORS FOR DEVELOPMENT: TRENDS AND MEASUREMENTS ISSUES 51
Annex I
Statistical annex
Table 1. Internet users by country/territory, 2000–2004
Country/territory 2000% change 2000-2001 2001
% change 2001-2002 2002
% change 2002-2003 2003
% change 2003-2004 2004
Afghanistan .. .. .. .. 1 000 1 900.0 20 000 25.0 25 000Albania 3 500 185.7 10 000 20.0 12 000 150.0 30 000 .. ..Algeria 150 000 33.3 200 000 150.0 500 000 .. .. .. ..Andorra 7 000 .. .. .. .. .. 10 049 .. ..Angola 15 000 33.3 20 000 105.0 41 000 .. .. .. ..Antigua & Barbuda 5 000 40.0 7 000 42.9 10 000 .. .. .. ..Argentina 2 600 000 40.4 3 650 000 12.3 4 100 000 10.5 4 530 000 13.0 5 120 000Armenia 40 000 25.0 50 000 20.0 60 000 133.3 140 000 7.1 150 000Aruba 14 000 71.4 24 000 .. .. .. .. .. ..Australia 6 600 000 16.7 7 700 000 36.4 10 500 000 7.6 11 300 000 15.0 13 000 000Austria 2 700 000 16.7 3 150 000 6.0 3 340 000 11.7 3 730 000 4.6 3 900 000Azerbaijan 12 000 108.3 25 000 1 100.0 300 000 16.7 350 000 .. ..Bahamas 13 130 28.9 16 923 254.5 60 000 40.0 84 000 10.7 93 000Bahrain 40 000 150.0 100 000 22.8 122 794 22.2 150 000 1.8 152 721Bangladesh 100 000 86.0 186 000 9.7 204 000 19.1 243 000 23.5 300 000Barbados 10 000 50.0 15 000 100.0 30 000 233.3 100 000 .. ..Belarus 187 036 130.0 430 263 87.9 808 481 72.2 1 391 903 .. ..Belgium 3 000 000 6.7 3 200 000 6.3 3 400 000 17.6 4 000 000 5.0 4 200 000Belize 15 000 20.0 18 000 66.7 30 000 .. .. .. ..Benin 15 000 66.7 25 000 100.0 50 000 40.0 70 000 42.9 100 000Bermuda 27 000 11.1 30 000 .. .. .. .. .. ..Bhutan 2 250 122.2 5 000 100.0 10 000 50.0 15 000 33.3 20 000Bolivia 120 000 50.0 180 000 50.0 270 000 14.8 310 000 12.9 350 000Bosnia and
Herzegovina 40 000 12.5 45 000 122.2 100 000 50.0 150 000 .. ..
Botswana 25 000 100.0 50 000 20.0 60 000 0.0 60 000 0.0 60 000Brazil 5 000 000 60.0 8 000 000 78.8 14 300 000 25.9 18 000 000 22.2 22 000 000Brunei Darussalam 30 000 16.7 35 000 .. .. .. .. .. ..Bulgaria 430 000 40.7 605 000 4.1 630 000 145.3 1 545 143 .. ..Burkina Faso 9 000 111.1 19 000 31.6 25 000 92.0 48 000 10.8 53 200Burundi 5 000 40.0 7 000 14.3 8 000 75.0 14 000 .. ..Cambodia 6 000 66.7 10 000 200.0 30 000 16.7 35 000 .. ..Cameroon 40 000 12.5 45 000 33.3 60 000 66.7 100 000 .. ..Canada 12 971 000 7.9 14 000 000 8.6 15 200 000 15.8 17 600 000 13.6 20 000 000Cape Verde 8 000 50.0 12 000 33.3 16 000 25.0 20 000 25.0 25 000Central African Rep. 2 000 50.0 3 000 66.7 5 000 20.0 6 000 50.0 9 000Chad 3 000 33.3 4 000 275.0 15 000 100.0 30 000 .. ..Chile 2 537 308 22.3 3 102 200 15.2 3 575 000 11.9 4 000 000 7.5 4 300 000China 22 500 000 49.8 33 700 000 75.4 59 100 000 34.5 79 500 000 18.2 94 000 000Colombia 878 000 31.4 1 154 000 73.3 2 000 113 36.6 2 732 201 31.2 3 585 688Comoros 1 500 66.7 2 500 28.0 3 200 56.3 5 000 .. ..

52 CHAPTER 1. ICT INDICATORS FOR DEVELOPMENT: TRENDS AND MEASUREMENT ISSUES
INFORMATION ECONOMY REPORT 2005
Country/territory 2000% change 2000-2001 2001
% change 2001-2002 2002
% change 2002-2003 2003
% change 2003-2004 2004
Congo 0 800 25.0 1 000 400.0 5 000 200.0 15 000 .. ..Costa Rica 228 000 68.4 384 000 108.3 800 000 12.5 900 000 11.1 1 000 000Côte d'Ivoire 40 000 75.0 70 000 28.6 90 000 166.7 240 000 .. ..Croatia 299 380 73.0 518 000 52.3 789 000 28.5 1 014 000 .. ..Cuba 60 000 100.0 120 000 33.3 160 000 - 38.8 98 000 53.1 150 000Cyprus 120 000 25.0 150 000 40.0 210 000 19.0 250 000 .. ..Czech Republic 1 000 000 50.0 1 500 000 73.3 2 600 000 19.2 3 100 000 54.8 4 800 000DR Congo 3 000 100.0 6 000 733.3 50 000 .. .. .. ..Denmark 2 090 000 10.0 2 300 000 19.8 2 756 000 10.1 3 034 000 .. ..Djibouti 1 400 135.7 3 300 36.4 4 500 44.4 6 500 .. ..Dominica 6 000 50.0 9 000 38.9 12 500 .. .. .. ..Dominican Rep. 327 118 21.5 397 333 25.8 500 000 30.0 650 000 23.1 800 000Ecuador 180 000 85.0 333 000 61.5 537 881 5.9 569 727 9.6 624 579Egypt 450 000 33.3 600 000 216.7 1 900 000 57.9 3 000 000 30.0 3 900 000El Salvador 70 000 114.3 150 000 100.0 300 000 83.3 550 000 6.8 587 475Equatorial Guinea 0 700 28.6 0 900 100.0 1 800 .. .. .. ..Eritrea 5 000 20.0 6 000 50.0 9 000 5.6 9 500 426.3 50 000Estonia 391 600 9.7 429 656 3.3 444 000 35.1 600 000 11.7 670 000Ethiopia 10 000 150.0 25 000 100.0 50 000 50.0 75 000 .. ..Faeroe Islands 15 000 33.3 20 000 25.0 25 000 .. .. .. ..Fiji 12 000 25.0 15 000 233.3 50 000 10.0 55 000 .. ..Finland 1 927 000 16.0 2 235 320 18.7 2 654 000 - 3.5 2 560 000 2.3 2 620 000France 8 460 000 85.0 15 653 000 19.6 18 716 000 17.0 21 900 000 14.2 25 000 000French Guiana 16 000 25.0 20 000 25.0 25 000 .. .. .. ..French Polynesia 15 000 0.0 15 000 33.3 20 000 75.0 35 000 .. ..Gabon 15 000 13.3 17 000 47.1 25 000 40.0 35 000 14.3 40 000Gambia 12 000 50.0 18 000 38.9 25 000 .. .. .. ..Georgia 23 000 102.2 46 500 58.1 73 500 59.2 117 020 50.1 175 600Germany 24 800 000 4.8 26 000 000 7.7 28 000 000 17.9 33 000 000 25.0 41 263 000Ghana 30 000 33.3 40 000 325.0 170 000 .. .. .. ..Greece 1 000 000 -8.5 915 347 62.3 1 485 281 15.7 1 718 435 13.8 1 955 000Greenland 17 841 12.1 20 000 25.0 25 000 .. .. .. ..Grenada 4 113 26.4 5 200 188.5 15 000 26.7 19 000 - 57.9 8 000Guadeloupe 25 000 60.0 40 000 25.0 50 000 .. .. .. ..Guam 25 007 60.0 40 000 25.0 50 000 .. .. .. ..Guatemala 80 000 150.0 200 000 100.0 400 000 .. .. .. ..Guernsey 20 000 25.0 25 000 20.0 30 000 10.0 33 000 .. ..Guinea 8 000 87.5 15 000 133.3 35 000 14.3 40 000 .. ..Guinea-Bissau 3 000 33.3 4 000 250.0 14 000 35.7 19 000 .. ..Guyana 50 000 100.0 100 000 25.0 125 000 12.0 140 000 3.6 145 000Haiti 20 000 50.0 30 000 166.7 80 000 87.5 150 000 233.3 500 000Honduras 55 000 63.6 90 000 87.3 168 560 10.1 185 510 19.8 222 273Hong Kong (China) 1 855 200 40.2 2 601 300 12.2 2 918 800 10.1 3 212 800 8.3 3 479 700Hungary 715 000 107.0 1 480 000 8.1 1 600 000 50.0 2 400 000 12.5 2 700 000Iceland 168 000 2.4 172 000 8.5 186 600 4.5 195 000 .. ..India 5 500 000 27.3 7 000 000 136.9 16 580 000 11.5 18 481 044 89.4 35 000 000
Table 1 (continued)

INFORMATION ECONOMY REPORT 2005
CHAPTER 1. ICT INDICATORS FOR DEVELOPMENT: TRENDS AND MEASUREMENTS ISSUES 53
Country/territory 2000% change 2000-2001 2001
% change 2001-2002 2002
% change 2002-2003 2003
% change 2003-2004 2004
Indonesia 1 900 000 121.1 4 200 000 7.1 4 500 000 79.6 8 080 000 .. ..Iran (Islamic Rep. of) 625 000 60.8 1 005 000 215.2 3 168 000 51.5 4 800 000 .. ..Iraq .. .. 12 500 100.0 25 000 20.0 30 000 ..Ireland 679 000 31.8 895 000 23.1 1 102 000 14.3 1 260 000 - 20.1 1 006 400Israel 1 270 000 41.7 1 800 000 11.1 2 000 000 .. .. .. 3 200 000Italy 13 200 000 18.2 15 600 000 27.6 19 900 000 15.0 22 880 000 26.2 28 870 000Jamaica 80 000 25.0 100 000 500.0 600 000 .. .. .. ..Japan 38 000 000 28.7 48 900 000 17.0 57 200 000 7.7 61 600 000 21.8 75 000 000Jersey 8 000 .. .. .. .. .. .. .. ..Jordan 127 317 83.8 234 000 31.4 307 469 44.4 444 000 35.1 600 000Kazakhstan 100 000 50.0 150 000 66.7 250 000 20.0 300 000 33.3 400 000Kenya 100 000 100.0 200 000 100.0 400 000 150.0 1 000 000 .. ..Kiribati 1 500 33.3 2 000 0.0 2 000 .. .. .. ..Kuwait 150 000 33.3 200 000 25.0 250 000 126.8 567 000 5.8 600 000Kyrgyzstan 51 600 191.9 150 600 0.9 152 000 31.6 200 000 .. ..Lao PDR 6 000 66.7 10 000 50.0 15 000 26.7 19 000 10.0 20 900Latvia 150 000 13.3 170 000 82.4 310 000 201.9 936 000 - 13.5 810 000Lebanon 300 000 -13.3 260 000 53.8 400 000 25.0 500 000 20.0 600 000Lesotho 4 000 25.0 5 000 320.0 21 000 42.9 30 000 .. ..Liberia 0 500 100.0 1 000 .. .. .. .. .. ..Libyan AJ 10 000 100.0 20 000 525.0 125 000 28.0 160 000 .. ..Lithuania 225 000 11.1 250 000 100.0 500 000 39.1 695 700 .. ..Luxembourg 100 000 60.0 160 000 3.1 165 000 3.0 170 000 .. ..Macao (China) 60 000 68.3 101 000 13.9 115 000 4.3 120 000 25.0 150 000Madagascar 30 000 16.7 35 000 57.1 55 000 28.2 70 500 .. ..Malawi 15 000 33.3 20 000 35.0 27 000 33.3 36 000 28.2 46 140Malaysia 4 977 000 27.5 6 346 650 23.5 7 840 640 10.5 8 661 000 14.1 9 878 214Maldives 6 000 66.7 10 000 50.0 15 000 .. .. .. ..Mali 15 000 33.3 20 000 25.0 25 000 40.0 35 000 42.9 50 000Malta 51 000 94.1 99 000 21.2 120 000 58.3 190 000 .. ..Marshall Islands 0 800 12.5 0 900 38.9 1 250 12.0 1 400 .. ..Martinique 30 000 33.3 40 000 50.0 60 000 33.3 80 000 .. ..Mauritania 5 000 40.0 7 000 42.9 10 000 20.0 12 000 .. ..Mauritius 87 000 21.8 106 000 17.9 125 000 20.0 150 000 .. ..Mayotte 1 800 .. .. .. .. .. .. .. ..Mexico 5 058 000 46.5 7 410 124 45.3 10 764 715 13.5 12 218 830 14.9 14 036 475Micronesia 4 000 25.0 5 000 20.0 6 000 66.7 10 000 20.0 12 000Mongolia 30 000 33.3 40 000 25.0 50 000 185.6 142 800 .. ..Morocco 200 000 100.0 400 000 75.0 700 000 42.9 1 000 000 250.0 3 500 000Mozambique 20 000 50.0 30 000 66.7 50 000 .. .. .. ..Myanmar 7 000 42.9 10 000 150.0 25 000 12.0 28 002 127.4 63 688Namibia 30 000 50.0 45 000 11.1 50 000 30.0 65 000 15.4 75 000Nepal 50 000 20.0 60 000 33.3 80 000 25.0 100 000 75.0 175 000Netherlands 7 000 000 12.9 7 900 000 3.8 8 200 000 3.7 8 500 000 17.6 10 000 000New Caledonia 30 000 33.3 40 000 25.0 50 000 20.0 60 000 16.7 70 000New Zealand 1 515 000 16.3 1 762 000 8.3 1 908 000 10.6 2 110 000 51.7 3 200 000
Table 1 (continued)

54 CHAPTER 1. ICT INDICATORS FOR DEVELOPMENT: TRENDS AND MEASUREMENT ISSUES
INFORMATION ECONOMY REPORT 2005
Country/territory 2000% change 2000-2001 2001
% change 2001-2002 2002
% change 2002-2003 2003
% change 2003-2004 2004
Nicaragua 50 000 50.0 75 000 20.0 90 000 11.1 100 000 25.0 125 000Niger 4 000 200.0 12 000 25.0 15 000 .. .. .. ..Nigeria 80 000 43.8 115 000 265.2 420 000 78.6 750 000 .. ..Norway 1 950 000 -32.3 1 319 400 6.0 1 398 600 13.2 1 583 300 .. ..Oman 90 000 33.3 120 000 50.0 180 000 .. .. .. ..Pakistan 300 000 66.7 500 000 100.0 1 000 000 20.0 1 200 000 66.7 2 000 000Palestine 35 000 71.4 60 000 75.0 105 000 38.1 145 000 10.3 160 000Panama 90 000 87.4 168 690 10.2 185 875 39.9 260 000 15.4 300 000Papua New Guinea 45 000 11.1 50 000 50.0 75 000 .. .. .. ..Paraguay 40 000 50.0 60 000 66.7 100 000 20.0 120 000 25.0 150 000Peru 800 000 150.0 2 000 000 20.0 2 400 000 18.8 2 850 000 13.0 3 220 000Philippines 1 540 000 29.9 2 000 000 75.0 3 500 000 .. .. .. ..Poland 2 800 000 35.7 3 800 000 133.7 8 880 000 1.0 8 970 000 0.3 9 000 000Portugal 1 680 200 10.7 1 860 400 21.9 2 267 200 17.9 2 674 000 10.4 2 951 000Puerto Rico 400 000 50.0 600 000 12.8 677 000 .. .. .. ..Qatar 30 000 33.3 40 000 75.0 70 000 101.1 140 760 17.2 165 000Rep. of Korea 19 040 000 28.0 24 380 000 7.8 26 270 000 11.2 29 220 000 8.1 31 580 000Rep. of Moldova 52 600 14.1 60 000 150.0 150 000 92.0 288 000 41.0 406 000Réunion 100 000 20.0 120 000 25.0 150 000 20.0 180 000 .. ..Romania 800 000 25.0 1 000 000 120.0 2 200 000 81.8 4 000 000 .. ..Russian Fed. 2 900 000 48.3 4 300 000 39.5 6 000 000 66.7 10 000 000 60.0 16 000 000Rwanda 5 000 300.0 20 000 25.0 25 000 .. .. .. ..S. Tome & Principe 6 500 38.5 9 000 22.2 11 000 36.4 15 000 .. ..Samoa 1 000 200.0 3 000 33.3 4 000 .. .. .. ..Saudi Arabia 460 000 120.9 1 016 208 39.6 1 418 880 5.7 1 500 000 .. ..Senegal 40 000 150.0 100 000 5.0 105 000 114.3 225 000 .. ..Serbia and Montenegro 400 000 50.0 600 000 6.7 640 000 32.3 847 000 41.7 1 200 000Seychelles 6 000 50.0 9 000 30.4 11 736 .. .. .. ..Sierra Leone 5 000 40.0 7 000 14.3 8 000 .. .. .. ..Singapore 1 300 000 30.8 1 700 000 23.5 2 100 000 1.7 2 135 034 13.4 2 421 782Slovakia 507 029 32.9 674 039 28.0 862 833 59.5 1 375 809 65.4 2 276 000Slovenia 300 000 100.0 600 000 25.0 750 000 6.7 800 000 18.8 950 000Solomon Islands 2 000 0.0 2 000 10.0 2 200 13.6 2 500 .. ..Somalia 0 500 100.0 1 000 1 400.0 15 000 500.0 90 000 122.2 200 000South Africa 2 400 000 20.4 2 890 000 7.3 3 100 000 .. .. .. ..Spain 5 486 000 34.7 7 388 000 6.3 7 856 000 24.6 9 789 000 32.8 13 000 000Sri Lanka 121 500 23.5 150 000 33.3 200 000 25.0 250 000 12.0 280 000Saint Kitts and Nevis 2 700 33.3 3 600 177.8 10 000 .. .. .. ..Saint Lucia 8 000 62.5 13 000 .. .. .. .. .. ..Saint Vincent 3 500 57.1 5 500 27.3 7 000 0.0 7 000 14.3 8 000Sudan 30 000 86.7 56 000 50.0 84 000 1 015.5 937 000 21.7 1 140 000Suriname 11 709 24.0 14 520 37.7 20 000 15.0 23 000 30.4 30 000Swaziland 10 000 40.0 14 000 42.9 20 000 35.0 27 000 .. ..Sweden 4 048 000 13.6 4 600 000 11.4 5 125 000 10.3 5 655 000 20.2 6 800 000Switzerland 2 096 000 6.1 2 224 000 14.9 2 556 000 14.1 2 916 000 61.2 4 700 000Syrian Arab Rep. 30 000 100.0 60 000 508.3 365 000 67.1 610 000 31.1 800 000Taiwan PC 6 260 000 24.9 7 820 000 37.1 10 720 000 9.5 11 740 000 4.0 12 210 000
Table 1 (continued)

INFORMATION ECONOMY REPORT 2005
CHAPTER 1. ICT INDICATORS FOR DEVELOPMENT: TRENDS AND MEASUREMENTS ISSUES 55
Country/territory 2000% change 2000-2001 2001
% change 2001-2002 2002
% change 2002-2003 2003
% change 2003-2004 2004
Tajikistan 3 000 6.7 3 200 9.4 3 500 17.7 4 120 .. ..TFYR Macedonia 50 000 40.0 70 000 42.9 100 000 26.0 126 000 .. ..Thailand 2 300 000 53.7 3 536 019 35.7 4 800 000 25.6 6 030 000 15.6 6 970 000Togo 100 000 50.0 150 000 33.3 200 000 5.0 210 000 .. ..Tonga 2 400 16.7 2 800 3.6 2 900 .. .. .. ..Trinidad & Tobago 100 000 20.0 120 000 15.0 138 000 .. .. .. ..Tunisia 260 000 57.7 410 000 23.3 505 500 24.6 630 000 32.5 835 000Turkey 2 000 000 75.0 3 500 000 22.9 4 300 000 39.5 6 000 000 70.3 10 220 000Turkmenistan 6 000 33.3 8 000 .. .. .. 20 000 .. ..Uganda 40 000 50.0 60 000 66.7 100 000 25.0 125 000 60.0 200 000Ukraine 350 000 71.4 600 000 50.0 900 000 177.8 2 500 000 .. ..United Arab Emirates 765 000 27.6 976 000 20.4 1 175 516 16.8 1 373 217 0.8 1 384 837United Kingdom 15 800 000 25.3 19 800 000 26.3 25 000 000 37.6 34 400 000 9.3 37 600 000United States 124 000 000 15.2 142 823 000 11.3 159 000 000 1.7 161 632 400 14.5 185 000 000UR of Tanzania 40 000 50.0 60 000 33.3 80 000 212.5 250 000 .. ..Uruguay 370 000 8.1 400 000 .. .. .. 530 000 28.3 680 000US Virgin Islands 15 000 33.3 20 000 50.0 30 000 .. .. .. ..Uzbekistan 120 000 25.0 150 000 83.3 275 000 78.9 492 000 .. ..Vanuatu 4 000 37.5 5 500 27.3 7 000 7.1 7 500 0.0 7 500Venezuela 820 022 40.5 1 152 502 10.6 1 274 429 51.8 1 934 791 19.5 2 312 683Viet Nam 200 000 404.8 1 009 544 48.6 1 500 000 133.3 3 500 000 67.7 5 870 000Yemen 15 000 13.3 17 000 488.2 100 000 20.0 120 000 50.0 180 000Zambia 20 000 25.0 25 000 109.7 52 420 30.0 68 150 .. ..Zimbabwe 50 000 100.0 100 000 400.0 500 000 60.0 800 000 2.5 820 000
Source: UNCTAD calculations based on ITU World Telecommunication Indicators Database, 2005.
Table 1 (continued)

56 CHAPTER 1. ICT INDICATORS FOR DEVELOPMENT: TRENDS AND MEASUREMENT ISSUES
INFORMATION ECONOMY REPORT 2005
Country/territory 2000 % change 2000-2001 2001 % change
2001-2002 2002 % change 2002-2003 2003 % change
2003-2004 2004
Iceland 59.8 0.2 59.9 8.2 64.8 4.1 67.5 .. ..Sweden 45.6 13.2 51.6 11.0 57.3 9.9 63.0 19.8 75.5Rep. of Korea 41.4 24.4 51.5 7.0 55.1 10.8 61.1 7.5 65.7United Kingdom 26.4 25.0 33.0 28.2 42.3 39.9 59.2 6.9 63.3Guernsey 31.9 39.5 44.5 20.4 53.6 10.3 59.1 .. ..Australia 34.5 15.1 39.7 34.5 53.4 6.4 56.8 14.8 65.3Denmark 39.2 9.4 42.9 19.6 51.3 9.6 56.2 .. ..United States 44.1 13.6 50.1 10.2 55.2 0.7 55.6 12.1 62.3Canada 42.1 6.9 45.0 7.6 48.4 14.5 55.4 13.7 63.0New Zealand 39.3 15.5 45.4 6.6 48.4 8.7 52.6 55.7 82.0Netherlands 43.8 12.1 49.1 3.1 50.6 3.1 52.2 18.1 61.6Taiwan Province of China 28.1 24.2 34.9 36.4 47.6 9.1 51.9 3.3 53.6Singapore 32.4 27.2 41.2 22.3 50.4 1.0 50.9 10.3 56.1Finland 37.2 15.6 43.0 18.6 51.0 - 3.8 49.1 2.4 50.2Japan 29.9 28.4 38.4 16.9 44.9 7.5 48.3 21.6 58.7Malta 13.1 93.1 25.3 19.8 30.3 56.8 47.5 .. ..Hong Kong (China) 27.8 39.2 38.7 11.1 43.0 9.7 47.2 3.7 48.9Austria 33.7 16.3 39.2 5.9 41.5 11.3 46.2 4.0 48.0Estonia 27.2 10.3 30.0 9.3 32.8 35.4 44.4 15.3 51.2Italy 23.0 17.0 26.9 30.5 35.1 18.6 41.6 20.9 50.3Latvia 6.2 16.1 7.2 84.7 13.3 203.5 40.4 - 12.2 35.4Slovenia 15.1 99.3 30.1 24.9 37.6 6.5 40.1 19.7 48.0Germany 30.1 4.7 31.5 7.6 33.9 17.9 40.0 6.1 42.4Switzerland 29.1 5.5 30.7 14.3 35.1 13.5 39.9 64.6 65.6Belgium 29.2 6.2 31.0 5.8 32.8 17.6 38.6 5.3 40.6Israel* 20.3 36.5 27.7 9.0 30.1 27.4 38.4 21.4 46.6Luxembourg 22.8 59.6 36.4 1.6 37.0 1.8 37.7 .. ..Barbados 3.7 51.4 5.6 100.0 11.2 231.1 37.1 .. ..France 14.4 83.3 26.4 18.9 31.4 16.4 36.6 13.2 41.4Norway 43.3 - 32.6 29.2 5.1 30.7 12.6 34.6 .. ..Malaysia 21.4 24.3 26.6 20.3 32.0 7.5 34.4 15.4 39.7United Arab Emirates 23.6 18.6 28.0 11.8 31.3 8.6 34.0 - 6.3 31.9Cyprus 17.7 23.2 21.8 34.9 29.4 14.7 33.7 .. ..Ireland 17.9 30.2 23.3 20.2 28.0 13.1 31.7 - 20.5 25.2Czech Republic 9.7 51.5 14.7 74.1 25.6 20.3 30.8 52.4 46.9Macao (China) 13.6 69.9 23.1 12.6 26.0 2.9 26.8 20.0 32.1Bahamas 4.3 27.9 5.5 249.1 19.2 38.0 26.5 10.8 29.3Chile 16.7 20.4 20.1 18.4 23.8 10.3 26.3 6.2 27.9New Caledonia 14.0 30.0 18.2 22.5 22.3 17.5 26.2 15.2 30.2Portugal 16.8 7.1 18.0 21.7 21.9 17.3 25.7 14.1 29.3Réunion 14.3 14.7 16.4 23.2 20.2 17.9 23.8 .. ..Hungary 7.1 108.5 14.8 6.8 15.8 50.1 23.7 15.8 27.5Poland 7.2 36.1 9.8 134.7 23.0 1.0 23.2 0.5 23.4
Table 2. Internet penetration, by country/territory, 2000–2004
Internet users per 100 inhabitantssorted by decreasing order of 2003 values

INFORMATION ECONOMY REPORT 2005
CHAPTER 1. ICT INDICATORS FOR DEVELOPMENT: TRENDS AND MEASUREMENTS ISSUES 57
Country/territory 2000 % change 2000-2001 2001 % change
2001-2002 2002 % change 2002-2003 2003 % change
2003-2004 2004
Croatia 6.7 76.1 11.8 52.5 18.0 28.8 23.2 .. ..Spain 13.7 33.6 18.3 5.5 19.3 18.8 22.9 37.9 31.6Kuwait 6.9 27.5 8.8 20.5 10.6 115.3 22.8 1.3 23.1Bahrain 6.3 144.4 15.4 18.8 18.3 18.0 21.6 - 4.3 20.7Costa Rica 5.7 63.2 9.3 111.8 19.7 9.5 21.6 9.1 23.5Slovakia 9.4 33.0 12.5 28.0 16.0 34.8 21.6 95.2 42.1Martinique 7.8 32.1 10.3 49.5 15.4 32.5 20.4 .. ..Lithuania 6.1 11.5 6.8 111.8 14.4 39.9 20.1 .. ..Qatar 4.9 28.6 6.3 65.1 10.4 91.6 19.9 33.8 26.7Bulgaria 5.3 41.5 7.5 8.0 8.1 144.6 19.8 .. ..Romania 3.6 25.0 4.5 124.4 10.1 82.7 18.5 .. ..Grenada 4.4 18.2 5.2 173.1 14.2 19.0 16.9 - 54.0 7.8Uruguay 10.9 5.5 11.5 2.6 11.8 39.0 16.4 27.9 21.0Greece 9.5 - 9.5 8.6 57.0 13.5 11.1 15.0 18.7 17.8Lebanon 9.1 - 14.3 7.8 50.0 11.7 22.1 14.3 18.3 16.9Belarus 1.9 126.3 4.3 90.7 8.2 72.0 14.1 .. ..French Polynesia 6.3 - 1.6 6.2 30.6 8.1 72.8 14.0 .. ..Mauritius 7.3 20.5 8.8 17.0 10.3 19.3 12.3 .. ..Argentina 7.3 38.9 10.1 11.2 11.2 6.8 12.0 10.1 13.2Mexico 5.1 47.1 7.5 42.7 10.7 11.8 12.0 11.9 13.4Andorra 9.0 .. .. .. .. .. 11.9 .. ..Peru 3.1 148.4 7.7 16.9 9.0 15.4 10.4 12.4 11.7Brazil 2.9 62.1 4.7 74.5 8.2 24.4 10.2 19.4 12.2S. Tome & Principe 4.4 36.4 6.0 21.7 7.3 35.2 9.9 .. ..Thailand 3.8 52.6 5.8 34.5 7.8 22.6 9.6 14.9 11.0Micronesia 3.7 27.0 4.7 19.1 5.6 65.5 9.3 16.6 10.8Turkey 3.1 64.5 5.1 21.6 6.2 36.9 8.5 66.4 14.1Panama 3.2 81.3 5.8 25.9 7.3 14.2 8.3 13.4 9.5El Salvador 1.1 109.1 2.3 100.0 4.6 80.2 8.3 7.1 8.9Jordan 2.5 80.0 4.5 28.9 5.8 39.8 8.1 31.8 10.7Rep. of Moldova 1.4 21.4 1.7 141.2 4.1 94.6 8.0 19.3 9.5Serbia and Montenegro 3.8 47.4 5.6 7.1 6.0 31.2 7.9 45.0 11.4Venezuela 3.4 38.2 4.7 8.5 5.1 47.6 7.5 17.4 8.8Dominican Rep. 3.8 21.1 4.6 32.6 6.1 22.8 7.5 21.5 9.1Iran (Islamic Rep. of) 1.0 60.0 1.6 200.0 4.8 50.8 7.2 .. ..Russian Fed. 2.0 45.0 2.9 41.4 4.1 66.6 6.8 62.5 11.1Zimbabwe 0.4 125.0 0.9 377.8 4.3 58.1 6.8 - 6.8 6.3Fiji 1.5 20.0 1.8 238.9 6.1 9.2 6.7 .. ..Saudi Arabia 2.2 113.6 4.7 38.3 6.5 2.5 6.7 .. ..Tunisia 2.7 55.6 4.2 23.8 5.2 22.7 6.4 31.7 8.4Colombia 2.1 28.6 2.7 70.4 4.6 35.7 6.2 27.9 8.0China 1.7 52.9 2.6 76.9 4.6 33.7 6.2 16.4 7.2TFYR Macedonia 2.5 36.0 3.4 41.2 4.8 26.0 6.1 .. ..Mongolia 1.3 30.8 1.7 23.5 2.1 176.7 5.8 .. ..Ukraine 0.7 71.4 1.2 58.3 1.9 176.3 5.3 .. ..Egypt 0.7 28.6 0.9 211.1 2.8 56.1 4.4 27.5 5.6
Table 2 (continued)

58 CHAPTER 1. ICT INDICATORS FOR DEVELOPMENT: TRENDS AND MEASUREMENT ISSUES
INFORMATION ECONOMY REPORT 2005
Country/territory 2000 % change 2000-2001 2001 % change
2001-2002 2002 % change 2002-2003 2003 % change
2003-2004 2004
Suriname 2.7 22.2 3.3 27.3 4.2 4.0 4.4 56.3 6.8Cape Verde 1.8 50.0 2.7 33.3 3.6 21.1 4.4 21.6 5.3Ecuador 1.4 85.7 2.6 65.4 4.3 1.2 4.4 8.7 4.7Philippines 2.0 27.0 2.6 72.2 4.4 - 2.0 4.3 35.0 5.8Viet Nam 0.3 300.0 1.2 50.0 1.8 138.9 4.3 65.6 7.1Azerbaijan 0.2 50.0 0.3 1 133.3 3.7 14.3 4.2 .. ..Togo 2.2 45.5 3.2 28.1 4.1 2.4 4.2 .. ..Palestine 1.1 63.6 1.8 66.7 3.0 33.7 4.0 8.2 4.3Kyrgyzstan 1.1 172.7 3.0 0.0 3.0 32.3 4.0 .. ..Bosnia 1.1 9.1 1.2 116.7 2.6 50.4 3.9 .. ..Indonesia 0.9 122.2 2.0 5.0 2.1 79.0 3.8 .. ..Bolivia 1.5 46.7 2.2 45.5 3.2 15.3 3.7 5.7 3.9Armenia 1.1 18.2 1.3 23.1 1.6 130.0 3.7 33.4 4.9Vanuatu 2.1 33.3 2.8 25.0 3.5 3.1 3.6 - 4.2 3.5Syrian Arab Rep. 0.2 100.0 0.4 425.0 2.1 65.7 3.5 26.1 4.4Botswana 1.5 100.0 3.0 16.7 3.5 - 2.6 3.4 - 2.1 3.3Namibia 1.7 47.1 2.5 8.0 2.7 25.2 3.4 10.4 3.7Morocco 0.7 100.0 1.4 71.4 2.4 38.3 3.3 239.5 11.3Kenya 0.3 93.9 0.6 98.4 1.3 148.0 3.2 .. ..Libyan AJ 0.2 100.0 0.4 475.0 2.3 25.7 2.9 .. ..Sudan 0.1 100.0 0.2 50.0 0.3 836.7 2.8 17.4 3.3Honduras 0.9 55.6 1.4 78.6 2.5 9.2 2.7 16.5 3.2Gabon 1.2 8.3 1.3 46.2 1.9 37.9 2.6 13.0 3.0Marshall Islands 1.6 6.2 1.7 41.2 2.4 7.9 2.6 .. ..Swaziland 1.0 40.0 1.4 35.7 1.9 36.3 2.6 .. ..Georgia 0.5 80.0 0.9 66.7 1.5 59.3 2.4 44.8 3.5Senegal 0.4 150.0 1.0 0.0 1.0 117.0 2.2 .. ..Bhutan 0.3 133.3 0.7 100.0 1.4 45.7 2.0 - 57.8 0.9Paraguay 0.7 57.1 1.1 54.5 1.7 18.8 2.0 23.3 2.5Uzbekistan 0.5 20.0 0.6 83.3 1.1 74.5 1.9 .. ..Kazakhstan 0.6 50.0 0.9 77.8 1.6 18.1 1.9 37.6 2.6Nicaragua 1.0 45.5 1.4 20.1 1.7 5.2 1.8 22.5 2.2Haiti 0.2 100.0 0.4 150.0 1.0 80.0 1.8 229.4 5.9India 0.5 40.0 0.7 128.6 1.6 9.4 1.8 85.1 3.2Guinea-Bissau 0.2 50.0 0.3 266.7 1.1 34.5 1.5 .. ..Côte d'Ivoire 0.3 33.3 0.4 25.0 0.5 188.0 1.4 .. ..Lesotho 0.2 0.0 0.2 400.0 1.0 38.0 1.4 .. ..Sri Lanka 0.7 14.3 0.8 37.5 1.1 18.2 1.3 11.5 1.5Benin 0.2 100.0 0.4 75.0 0.7 42.9 1.0 45.0 1.5Albania 0.1 200.0 0.3 33.3 0.4 145.0 1.0 .. ..Djibouti 0.2 150.0 0.5 40.0 0.7 38.6 1.0 .. ..Cuba 0.5 120.0 1.1 27.3 1.4 - 37.9 0.9 51.7 1.3Pakistan 0.2 100.0 0.4 75.0 0.7 14.3 0.8 58.8 1.3Somalia 0.0 .. 0.0 .. 0.2 275.0 0.8 122.7 1.7UR of Tanzania 0.1 100.0 0.2 0.0 0.2 255.0 0.7 .. ..Comoros 0.2 50.0 0.3 33.3 0.4 57.5 0.6 .. ..
Table 2 (continued)

INFORMATION ECONOMY REPORT 2005
CHAPTER 1. ICT INDICATORS FOR DEVELOPMENT: TRENDS AND MEASUREMENTS ISSUES 59
Country/territory 2000 % change 2000-2001 2001 % change
2001-2002 2002 % change 2002-2003 2003 % change
2003-2004 2004
Cameroon 0.3 7.4 0.3 31.0 0.4 63.2 0.6 .. ..Nigeria 0.1 0.0 0.1 200.0 0.3 103.3 0.6 .. ..Zambia 0.2 0.0 0.2 150.0 0.5 20.0 0.6 .. ..Guinea 0.1 100.0 0.2 150.0 0.5 4.0 0.5 .. ..Solomon Islands 0.5 0.0 0.5 0.0 0.5 4.0 0.5 .. ..Uganda 0.2 50.0 0.3 33.3 0.4 22.5 0.5 53.1 0.8Mauritania 0.2 50.0 0.3 33.3 0.4 10.0 0.4 .. ..Congo 0.0 .. 0.0 .. 0.2 115.0 0.4 .. ..Madagascar 0.2 0.0 0.2 50.0 0.3 43.3 0.4 .. ..Turkmenistan 0.1 100.0 0.2 .. .. .. 0.4 .. ..Burkina Faso 0.1 100.0 0.2 0.0 0.2 95.0 0.4 2.6 0.4Chad 0.0 25.0 0.1 280.0 0.2 94.7 0.4 .. ..Malawi 0.1 100.0 0.2 50.0 0.3 13.3 0.3 8.8 0.4Lao PDR 0.1 100.0 0.2 50.0 0.3 10.0 0.3 9.1 0.4Mali 0.1 100.0 0.2 0.0 0.2 60.0 0.3 40.6 0.5Cambodia 0.0 .. 0.1 100.0 0.2 25.0 0.3 .. ..Eritrea 0.1 100.0 0.2 0.0 0.2 15.0 0.2 404.3 1.2Burundi 0.1 0.0 0.1 0.0 0.1 100.0 0.2 .. ..Bangladesh 0.1 0.0 0.1 100.0 0.2 - 10.0 0.2 11.1 0.2Central African Rep. 0.1 0.0 0.1 0.0 0.1 40.0 0.1 64.3 0.2Ethiopia 0.0 .. 0.0 .. 0.1 10.0 0.1 .. ..Afghanistan 0.0 .. .. .. 0.0 .. 0.1 0.0 0.1Tajikistan 0.0 .. 0.1 0.0 0.1 0.0 0.1 .. ..Myanmar 0.0 .. 0.0 .. 0.1 0.0 0.1 140.0 0.1
* UNCTAD estimate for 2003Source: UNCTAD calculations based on ITU World Telecommunication Indicators Database, 2005.
Table 2 (continued)
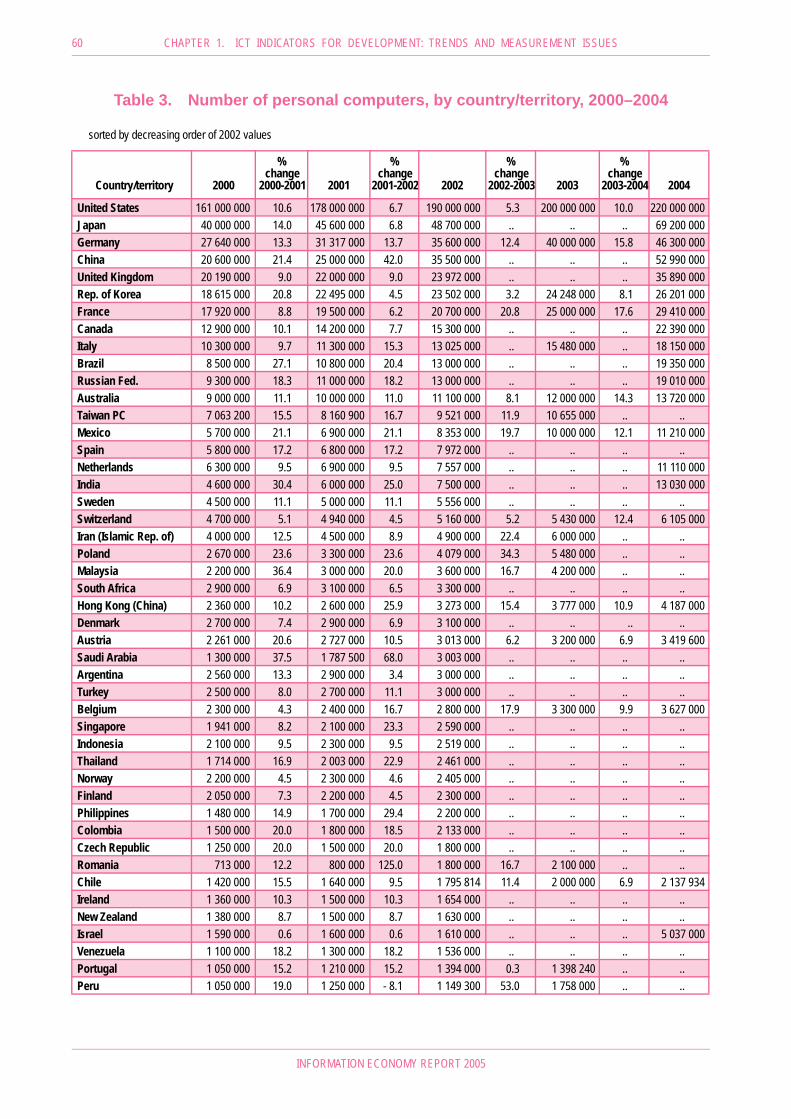
60 CHAPTER 1. ICT INDICATORS FOR DEVELOPMENT: TRENDS AND MEASUREMENT ISSUES
INFORMATION ECONOMY REPORT 2005
Table 3. Number of personal computers, by country/territory, 2000–2004
Country/territory 2000
%change
2000-2001 2001
%change
2001-2002 2002
%change
2002-2003 2003
% change
2003-2004 2004
United States 161 000 000 10.6 178 000 000 6.7 190 000 000 5.3 200 000 000 10.0 220 000 000Japan 40 000 000 14.0 45 600 000 6.8 48 700 000 .. .. .. 69 200 000Germany 27 640 000 13.3 31 317 000 13.7 35 600 000 12.4 40 000 000 15.8 46 300 000China 20 600 000 21.4 25 000 000 42.0 35 500 000 .. .. .. 52 990 000United Kingdom 20 190 000 9.0 22 000 000 9.0 23 972 000 .. .. .. 35 890 000Rep. of Korea 18 615 000 20.8 22 495 000 4.5 23 502 000 3.2 24 248 000 8.1 26 201 000France 17 920 000 8.8 19 500 000 6.2 20 700 000 20.8 25 000 000 17.6 29 410 000Canada 12 900 000 10.1 14 200 000 7.7 15 300 000 .. .. .. 22 390 000Italy 10 300 000 9.7 11 300 000 15.3 13 025 000 .. 15 480 000 .. 18 150 000Brazil 8 500 000 27.1 10 800 000 20.4 13 000 000 .. .. .. 19 350 000Russian Fed. 9 300 000 18.3 11 000 000 18.2 13 000 000 .. .. .. 19 010 000Australia 9 000 000 11.1 10 000 000 11.0 11 100 000 8.1 12 000 000 14.3 13 720 000Taiwan PC 7 063 200 15.5 8 160 900 16.7 9 521 000 11.9 10 655 000 .. ..Mexico 5 700 000 21.1 6 900 000 21.1 8 353 000 19.7 10 000 000 12.1 11 210 000Spain 5 800 000 17.2 6 800 000 17.2 7 972 000 .. .. .. ..Netherlands 6 300 000 9.5 6 900 000 9.5 7 557 000 .. .. .. 11 110 000India 4 600 000 30.4 6 000 000 25.0 7 500 000 .. .. .. 13 030 000Sweden 4 500 000 11.1 5 000 000 11.1 5 556 000 .. .. .. ..Switzerland 4 700 000 5.1 4 940 000 4.5 5 160 000 5.2 5 430 000 12.4 6 105 000Iran (Islamic Rep. of) 4 000 000 12.5 4 500 000 8.9 4 900 000 22.4 6 000 000 .. ..Poland 2 670 000 23.6 3 300 000 23.6 4 079 000 34.3 5 480 000 .. ..Malaysia 2 200 000 36.4 3 000 000 20.0 3 600 000 16.7 4 200 000 .. ..South Africa 2 900 000 6.9 3 100 000 6.5 3 300 000 .. .. .. ..Hong Kong (China) 2 360 000 10.2 2 600 000 25.9 3 273 000 15.4 3 777 000 10.9 4 187 000Denmark 2 700 000 7.4 2 900 000 6.9 3 100 000 .. .. .. ..Austria 2 261 000 20.6 2 727 000 10.5 3 013 000 6.2 3 200 000 6.9 3 419 600Saudi Arabia 1 300 000 37.5 1 787 500 68.0 3 003 000 .. .. .. ..Argentina 2 560 000 13.3 2 900 000 3.4 3 000 000 .. .. .. ..Turkey 2 500 000 8.0 2 700 000 11.1 3 000 000 .. .. .. ..Belgium 2 300 000 4.3 2 400 000 16.7 2 800 000 17.9 3 300 000 9.9 3 627 000Singapore 1 941 000 8.2 2 100 000 23.3 2 590 000 .. .. .. ..Indonesia 2 100 000 9.5 2 300 000 9.5 2 519 000 .. .. .. ..Thailand 1 714 000 16.9 2 003 000 22.9 2 461 000 .. .. .. ..Norway 2 200 000 4.5 2 300 000 4.6 2 405 000 .. .. .. ..Finland 2 050 000 7.3 2 200 000 4.5 2 300 000 .. .. .. ..Philippines 1 480 000 14.9 1 700 000 29.4 2 200 000 .. .. .. ..Colombia 1 500 000 20.0 1 800 000 18.5 2 133 000 .. .. .. ..Czech Republic 1 250 000 20.0 1 500 000 20.0 1 800 000 .. .. .. ..Romania 713 000 12.2 800 000 125.0 1 800 000 16.7 2 100 000 .. ..Chile 1 420 000 15.5 1 640 000 9.5 1 795 814 11.4 2 000 000 6.9 2 137 934Ireland 1 360 000 10.3 1 500 000 10.3 1 654 000 .. .. .. ..New Zealand 1 380 000 8.7 1 500 000 8.7 1 630 000 .. .. .. ..Israel 1 590 000 0.6 1 600 000 0.6 1 610 000 .. .. .. 5 037 000Venezuela 1 100 000 18.2 1 300 000 18.2 1 536 000 .. .. .. ..Portugal 1 050 000 15.2 1 210 000 15.2 1 394 000 0.3 1 398 240 .. ..Peru 1 050 000 19.0 1 250 000 - 8.1 1 149 300 53.0 1 758 000 .. ..
sorted by decreasing order of 2002 values

INFORMATION ECONOMY REPORT 2005
CHAPTER 1. ICT INDICATORS FOR DEVELOPMENT: TRENDS AND MEASUREMENTS ISSUES 61
Country/territory 2000
%change
2000-2001 2001
%change
2001-2002 2002
%change
2002-2003 2003
% change
2003-2004 2004
Egypt 800 000 25.0 1 000 000 12.0 1 120 000 78.6 2 000 000 15.0 2 300 000Hungary 870 000 9.2 950 000 15.8 1 100 000 .. .. .. ..Slovakia 740 000 8.1 800 000 26.3 1 010 000 25.7 1 270 000 25.4 1 593 000Ukraine 890 000 3.4 920 000 3.4 951 000 18.1 1 123 220 .. ..Greece 750 000 14.7 860 000 4.7 900 000 .. .. .. ..Nigeria 750 000 6.7 800 000 6.6 853 000 0.8 860 000 .. ..Costa Rica 600 000 16.7 700 000 16.7 817 000 11.4 910 000 .. ..Viet Nam 600 000 16.7 700 000 14.3 800 000 .. .. .. ..Croatia 498 987 24.3 620 000 22.6 760 000 .. .. .. ..Slovenia 548 000 0.4 550 000 9.1 600 000 8.3 650 000 .. ..Zimbabwe 195 000 2.6 200 000 200.0 600 000 3.3 620 000 61.3 1 000 000Morocco 350 000 14.3 400 000 25.0 500 000 20.0 600 000 3.3 620 000Bangladesh 200 000 25.0 250 000 80.0 450 000 133.3 1 050 000 57.1 1 650 000United Arab Emirates 400 000 5.0 420 000 7.1 450 000 .. .. .. ..Bulgaria 361 400 5.1 380 000 6.6 405 000 .. .. .. ..Ecuador 275 000 9.1 300 000 34.2 402 652 .. .. .. ..Latvia 340 000 5.9 360 000 11.1 400 000 9.0 436 000 14.9 501 000Lithuania 240 000 8.3 260 000 46.2 380 000 .. .. .. ..Tunisia 219 100 16.5 255 245 31.4 335 325 19.4 400 372 17.9 472 132Syrian Arab Rep. 250 000 8.0 270 000 22.2 330 000 51.5 500 000 20.0 600 000Papua New Guinea 280 000 7.1 300 000 7.0 321 000 .. .. .. ..Lebanon 175 000 42.9 250 000 20.0 300 000 16.7 350 000 14.3 400 000Serbia and Montenegro 240 000 4.2 250 000 16.0 290 000 .. .. .. ..Estonia 220 000 13.6 250 000 14.0 285 000 108.8 595 000 .. ..Kuwait 250 000 8.8 272 000 4.8 285 000 40.4 400 000 12.5 450 000Luxembourg 200 000 15.0 230 000 15.2 265 000 5.7 280 000 .. ..Cuba 135 000 63.0 220 000 13.6 250 000 8.0 270 000 11.1 300 000Myanmar 100 000 50.0 150 000 66.7 250 000 20.0 300 000 8.3 325 000Sri Lanka 135 000 29.6 175 000 42.9 250 000 30.0 325 000 63.0 529 650Algeria 200 000 10.0 220 000 10.0 242 000 9.5 265 000 .. ..Kenya 150 000 16.7 175 000 16.6 204 000 47.1 300 000 .. ..Iraq .. .. .. .. 200 000 .. .. .. ..Jordan 150 000 13.3 170 000 17.6 200 000 22.5 245 000 .. ..Paraguay 70 000 114.3 150 000 33.3 200 000 .. .. .. ..Senegal 160 000 12.5 180 000 11.1 200 000 10.0 220 000 .. ..Sudan 100 000 15.0 115 000 73.9 200 000 .. .. .. ..Cyprus 150 000 13.3 170 000 13.5 193 000 .. .. .. ..Bolivia 140 000 21.4 170 000 11.8 190 000 .. .. .. ..Mauritius 120 000 8.3 130 000 38.5 180 000 .. .. .. ..Guatemala 130 000 15.4 150 000 15.3 173 000 .. .. .. ..El Salvador 120 000 16.7 140 000 16.4 163 000 35.0 220 000 .. ..Georgia 112 000 27.7 143 000 9.1 156 000 10.3 172 000 11.6 192 000Côte d'Ivoire 90 000 30.8 117 700 30.8 154 000 .. .. .. ..Nicaragua 120 000 8.3 130 000 15.4 150 000 .. .. .. ..Togo 100 000 20.0 120 000 25.0 150 000 6.7 160 000 .. ..Yemen 35 000 5.7 37 000 291.9 145 000 37.9 200 000 50.0 300 000UR of Tanzania 100 000 20.0 120 000 20.0 144 000 38.9 200 000 .. ..Jamaica 120 000 8.3 130 000 8.5 141 000 .. .. .. ..
Table 3 (continued)

62 CHAPTER 1. ICT INDICATORS FOR DEVELOPMENT: TRENDS AND MEASUREMENT ISSUES
INFORMATION ECONOMY REPORT 2005
Country/territory 2000
%change
2000-2001 2001
%change
2001-2002 2002
%change
2002-2003 2003
% change
2003-2004 2004
Namibia 75 000 37.1 102 806 29.4 133 000 43.7 191 100 15.1 220 000Iceland 110 000 9.1 120 000 8.3 130 000 3.1 134 000 .. ..Libyan AJ .. .. .. .. 130 000 .. .. .. ..Palestine .. .. .. .. 125 000 14.4 143 000 18.2 169 000Panama 105 000 4.8 110 000 4.5 115 000 4.3 120 000 8.3 130 000Guadeloupe 90 000 11.1 100 000 11.0 111 000 .. .. .. ..Qatar 90 000 11.1 100 000 10.0 110 000 .. .. .. ..Bahrain 95 000 5.3 100 000 7.0 107 000 .. .. .. ..Trinidad & Tobago 80 000 12.5 90 000 15.0 103 500 .. .. .. ..Malta 80 000 12.5 90 000 12.2 101 000 .. .. .. ..Ethiopia 60 000 25.0 75 000 33.3 100 000 50.0 150 000 .. ..Oman 80 000 6.3 85 000 11.8 95 000 .. .. .. ..TFYR Macedonia .. .. 72 000 30.6 94 000 25.5 118 000 18.6 140 000Macao (China) 70 000 14.3 80 000 15.0 92 000 27.2 117 000 11.1 130 000Honduras 70 000 14.3 80 000 13.8 91 000 9.9 100 000 .. ..Cameroon 50 000 20.0 60 000 50.0 90 000 33.3 120 000 .. ..Nepal 70 000 14.3 80 000 6.3 85 000 17.8 100 172 .. ..Ghana 60 000 16.7 70 000 17.1 82 000 .. .. .. ..Mozambique 60 000 16.7 70 000 17.1 82 000 .. .. .. ..Uganda 60 000 16.7 70 000 17.1 82 000 25.0 102 500 17.6 120 500Zambia 70 000 7.1 75 000 6.7 80 000 18.8 95 000 .. ..Martinique 65 000 10.8 72 000 8.3 78 000 2.6 80 000 .. ..Rep. of Moldova 63 500 10.2 70 000 10.0 77 000 .. .. .. 112 200Botswana 60 000 8.3 65 000 7.7 70 000 .. .. .. ..French Polynesia 75 115 - 11.8 66 221 5.7 70 000 .. .. .. ..Madagascar 35 000 14.3 40 000 75.0 70 000 14.3 80 000 .. ..Mongolia 32 000 31.3 42 000 64.3 69 000 175.4 190 000 .. ..Kyrgyzstan 25 600 150.0 64 000 0.8 64 500 16.3 75 000 .. ..Armenia 25 000 40.0 35 000 71.4 60 000 .. .. .. 200 000Réunion 35 000 22.9 43 000 23.3 53 000 .. .. .. ..Guinea 29 000 10.3 32 000 31.3 42 000 2.4 43 000 .. ..Fiji 36 000 5.6 38 000 5.3 40 000 5.0 42 000 .. ..Albania 25 000 20.0 30 000 20.0 36 000 .. .. .. ..Belize 30 000 10.0 33 000 6.1 35 000 .. .. .. ..Cape Verde 25 000 20.0 30 000 16.7 35 000 .. .. .. ..Bermuda 30 000 6.7 32 000 6.3 34 000 .. .. .. ..French Guiana 25 000 8.0 27 000 7.4 29 000 .. .. .. ..Mauritania 25 000 8.0 27 000 7.4 29 000 20.7 35 000 .. ..Barbados 22 000 13.6 25 000 12.0 28 000 .. .. .. ..Angola 15 000 13.3 17 000 58.8 27 000 .. .. .. ..Brunei Darussalam 23 000 8.7 25 000 8.0 27 000 .. .. .. ..Cambodia 15 000 33.3 20 000 35.0 27 000 18.5 32 000 .. ..Gabon 12 000 66.7 20 000 25.0 25 000 20.0 30 000 66.7 50 000Swaziland 12 000 33.3 16 000 56.3 25 000 20.0 30 000 .. ..Guyana 22 000 4.5 23 000 4.3 24 000 8.3 26 000 3.8 27 000Saint Lucia 22 000 4.5 23 000 4.3 24 000 .. .. .. ..Maldives 10 000 50.0 15 000 33.3 20 000 .. .. .. ..Burkina Faso 15 000 13.3 17 000 11.8 19 000 36.8 26 000 10.0 28 600
Table 3 (continued)

INFORMATION ECONOMY REPORT 2005
CHAPTER 1. ICT INDICATORS FOR DEVELOPMENT: TRENDS AND MEASUREMENTS ISSUES 63
Country/territory 2000
%change
2000-2001 2001
%change
2001-2002 2002
%change
2002-2003 2003
% change
2003-2004 2004
Gambia 15 000 13.3 17 000 11.8 19 000 .. .. .. ..Lao PDR 14 000 14.3 16 000 12.5 18 000 11.1 20 000 10.0 22 000Solomon Islands 16 000 6.3 17 000 5.9 18 000 .. .. .. ..Benin 10 000 10.0 11 000 36.4 15 000 72.2 25 825 16.2 30 000Mali 13 000 7.7 14 000 7.1 15 000 66.7 25 000 .. ..Somalia .. .. .. .. 15 000 66.7 25 000 100.0 50 000Grenada 12 000 8.3 13 000 7.7 14 000 .. .. .. ..Malawi 12 000 8.3 13 000 7.7 14 000 12.9 15 800 24.7 19 710Saint Vincent 12 000 8.3 13 000 7.7 14 000 .. .. .. ..Chad 11 000 9.1 12 000 8.3 13 000 .. .. .. ..Congo 11 000 9.1 12 000 8.3 13 000 15.4 15 000 .. ..Seychelles 11 000 9.1 12 000 8.3 13 000 .. .. .. ..Bhutan 5 000 40.0 7 000 42.9 10 000 0.0 10 000 10.0 11 000Djibouti 6 500 7.7 7 000 42.9 10 000 45.0 14 500 .. ..Eritrea 6 160 13.6 7 000 42.9 10 000 20.0 12 000 25.0 15 000Saint Kitts and Nevis 7 000 14.3 8 000 12.5 9 000 .. .. .. ..Central African Rep. 6 000 16.7 7 000 14.3 8 000 25.0 10 000 10.0 11 000Dominica 5 500 9.1 6 000 16.7 7 000 .. .. .. ..Niger 5 000 20.0 6 000 16.7 7 000 .. .. .. ..Burundi 4 000 12.5 4 500 11.1 5 000 160.0 13 000 .. ..Comoros 3 000 33.3 4 000 5.0 4 200 9.5 4 600 .. ..Equatorial Guinea 2 000 25.0 2 500 40.0 3 500 .. .. .. ..Marshall Islands 2 000 25.0 2 500 20.0 3 000 .. .. .. ..Vanuatu 2 400 8.3 2 600 15.4 3 000 0.0 3 000 0.0 3 000Tonga 1 300 7.7 1 400 42.9 2 000 .. .. .. ..Samoa 1 000 10.0 1 100 9.1 1 200 .. .. .. ..Kiribati 0 800 12.5 0 900 11.1 1 000 .. .. .. ..Uruguay 350 000 5.7 370 000 .. .. .. 410 000 4.9 430 000
Source: UNCTAD calculations based on ITU World Telecommunication Indicators Database, 2005.
Table 3 (continued)

64 CHAPTER 1. ICT INDICATORS FOR DEVELOPMENT: TRENDS AND MEASUREMENT ISSUES
INFORMATION ECONOMY REPORT 2005
Country/territory 2000%
change 2000-2001
2001%
change 2001-2002
2002%
change 2002-2003
2003%
change2003-2004
2004
Afghanistan .. .. .. .. 25 000 700.0 200 000 200.0 600 000Albania 29 791 1 218.0 392 650 116.7 851 000 29.3 1 100 000 .. ..Algeria 86 000 16.3 100 000 300.0 400 000 260.4 1 441 400 224.9 4 682 690Andorra 23 543 25.0 29 429 11.4 32 790 58.3 51 893 .. ..Argentina 6 049 963 15.3 6 974 939 - 5.9 6 566 740 19.4 7 842 233 72.3 13 512 383Armenia 17 486 45.9 25 504 182.1 71 949 59.0 114 379 77.8 203 309Australia 8 562 000 30.0 11 132 000 13.0 12 575 000 14.1 14 347 000 14.7 16 449 000Austria 6 117 000 6.9 6 541 000 3.0 6 736 000 5.3 7 094 502 12.6 7 989 955Azerbaijan 420 400 73.6 730 000 19.2 870 000 21.5 1 057 000 68.7 1 782 900Bahamas 31 524 92.1 60 555 101.1 121 759 - 4.5 116 267 60.0 186 007Bahrain 205 727 46.2 300 829 29.3 388 990 13.9 443 109 46.6 649 764Bangladesh 279 000 86.4 520 000 106.7 1 075 000 27.0 1 365 000 217.0 4 327 516Barbados 28 467 86.6 53 111 83.0 97 193 44.0 140 000 22.1 171 000Belarus 49 353 180.3 138 329 234.4 462 630 141.7 1 118 000 .. ..Belgium 5 629 000 36.7 7 697 000 5.7 8 135 512 5.8 8 605 834 6.1 9 131 705Belize 16 812 132.9 39 155 32.1 51 729 16.8 60 403 61.8 97 755Benin 55 476 125.3 125 000 75.0 218 770 8.0 236 175 .. ..Bhutan .. .. .. .. .. .. 7 998 122.6 17 800Bolivia 582 620 33.9 779 917 31.5 1 025 451 24.7 1 278 844 40.8 1 800 789Bosnia 93 386 376.2 444 711 68.4 748 780 40.2 1 050 000 .. ..Botswana 200 000 58.0 316 000 37.7 435 000 20.2 522 840 7.8 563 782Brazil 23 188 171 24.0 28 745 769 21.3 34 880 964 32.9 46 373 266 41.5 65 605 000Bulgaria 738 000 110.0 1 550 000 67.6 2 597 548 34.8 3 500 869 35.1 4 729 731Burkina Faso 25 245 201.0 76 000 48.7 113 000 100.9 227 000 75.3 398 000Burundi 16 320 88.0 30 687 69.5 52 000 23.1 64 000 .. ..Cambodia 130 547 71.2 223 458 70.1 380 000 31.2 498 388 .. ..Cameroon 103 279 304.0 417 295 68.1 701 507 53.5 1 077 000 42.7 1 536 594Canada 8 880 000 21.7 10 803 000 11.1 11 997 000 10.3 13 228 000 13.3 14 984 396Cape Verde 19 729 59.7 31 507 36.3 42 949 24.2 53 342 23.3 65 780Central African Rep. 4 967 121.5 11 000 14.5 12 600 217.5 40 000 50.0 60 000Chad 5 500 300.0 22 000 55.5 34 200 90.1 65 000 .. ..Chile 3 401 525 55.0 5 271 565 22.3 6 445 698 16.7 7 520 280 27.2 9 566 581China 85 260 000 69.9 144 820 000 42.2 206 005 000 31.0 269 953 000 24.0 334 824 000Colombia 2 256 801 44.7 3 265 261 40.8 4 596 594 34.6 6 186 206 68.1 10 400 578Comoros .. .. .. .. .. .. 2 000 .. ..Congo 70 000 114.3 150 000 47.9 221 800 48.8 330 000 34.0 442 200Costa Rica 205 275 51.7 311 329 47.7 459 757 64.5 756 235 20.5 911 539Côte d'Ivoire 472 952 54.0 728 545 41.0 1 027 058 24.7 1 280 696 19.6 1 531 846Croatia 1 033 000 69.9 1 755 000 33.3 2 340 000 9.1 2 553 000 .. ..Cuba 6 536 31.3 8 579 108.1 17 851 98.1 35 356 114.4 75 797Cyprus 218 324 44.0 314 355 32.9 417 933 32.0 551 752 16.1 640 515Czech Republic 4 346 009 59.9 6 947 151 23.9 8 610 177 12.8 9 708 683 10.9 10 771 270DR Congo 15 000 900.0 150 000 273.3 560 000 78.6 1 000 000 .. ..Denmark 3 363 552 17.7 3 960 165 13.1 4 477 752 6.5 4 767 277 8.4 5 165 546
Table 4. Mobile phone subscribers by country/territory, 2000–2004
(alphabetical order)

INFORMATION ECONOMY REPORT 2005
CHAPTER 1. ICT INDICATORS FOR DEVELOPMENT: TRENDS AND MEASUREMENTS ISSUES 65
Country/territory 2000%
change 2000-2001
2001%
change 2001-2002
2002%
change 2002-2003
2003%
change2003-2004
2004
Djibouti 0 230 1 204.3 3 000 400.0 15 000 53.3 23 000 .. ..Dominican Rep. 705 431 80.0 1 270 082 33.9 1 700 609 24.8 2 122 543 19.4 2 534 063Ecuador 482 213 78.2 859 152 81.7 1 560 861 53.6 2 398 161 89.5 4 544 174Egypt 1 359 900 105.4 2 793 800 60.9 4 494 700 29.0 5 797 530 31.8 7 643 060El Salvador 743 628 15.4 857 782 3.6 888 818 29.4 1 149 790 59.4 1 832 579Equatorial Guinea 5 000 200.0 15 000 113.3 32 000 29.7 41 500 33.7 55 500Estonia 557 000 16.9 651 200 35.3 881 000 19.2 1 050 241 19.6 1 255 731Ethiopia 17 757 54.9 27 500 83.2 50 369 94.2 97 827 82.0 178 000Faeroe Islands 16 971 44.3 24 487 25.4 30 709 25.8 38 640 .. ..Fiji 55 057 47.0 80 933 11.1 89 900 22.2 109 882 .. ..Finland 3 728 625 12.0 4 175 587 8.2 4 516 772 5.1 4 747 126 5.1 4 988 000France 29 052 360 27.3 36 997 400 4.3 38 585 300 8.0 41 683 100 6.9 44 551 800Gabon 120 000 25.0 150 000 86.2 279 289 7.4 300 000 63.1 489 367Georgia 194 741 54.7 301 327 67.1 503 619 41.2 711 224 18.2 840 600Germany 48 202 000 16.4 56 126 000 5.3 59 128 000 9.6 64 800 000 10.1 71 316 000Ghana 130 045 49.0 193 773 131.9 449 435 78.0 799 873 111.9 1 695 000Greece 5 932 403 34.2 7 963 742 17.0 9 314 260 11.0 10 337 000 6.8 11 044 232Grenada 4 300 49.2 6 414 17.8 7 553 459.9 42 293 2.4 43 313Guatemala 856 831 33.8 1 146 441 37.6 1 577 085 29.0 2 034 776 55.7 3 168 256Guernsey 21 885 44.1 31 539 16.0 36 580 13.5 41 530 5.5 43 824Guinea 42 112 32.2 55 670 63.1 90 772 22.8 111 500 .. ..Guinea-Bissau .. .. .. .. .. .. 1 275 .. ..Haiti 55 000 66.4 91 500 53.0 140 000 128.6 320 000 25.0 400 000Honduras 155 271 53.0 237 629 37.4 326 508 16.2 379 362 86.4 707 201Hong Kong (China) 5 447 346 6.0 5 776 360 10.7 6 395 725 14.9 7 349 202 10.9 8 148 685Hungary 3 076 279 61.5 4 967 430 38.2 6 862 766 15.8 7 944 586 9.9 8 727 188Iceland 214 896 15.5 248 131 5.2 260 938 7.2 279 670 4.2 291 372India 3 577 095 79.8 6 431 520 97.3 12 687 637 106.1 26 154 405 80.8 47 300 000Indonesia 3 669 327 77.7 6 520 947 79.4 11 700 000 60.7 18 800 000 59.6 30 000 000Iran (Islamic Rep. of) 962 595 116.8 2 087 353 4.8 2 186 958 54.4 3 376 526 27.3 4 300 000Iraq .. .. .. .. 20 000 300.0 80 000 617.5 574 000Ireland 2 461 000 20.7 2 970 000 1.0 3 000 000 16.7 3 500 000 8.0 3 780 000Israel 4 400 000 34.1 5 900 000 7.4 6 334 000 2.6 6 500 000 10.6 7 187 500Italy 42 246 000 21.3 51 246 000 3.4 53 003 000 7.1 56 770 000 10.5 62 750 000Jamaica 366 952 73.0 635 000 120.5 1 400 000 14.3 1 600 000 37.5 2 200 000Japan 66 784 374 12.0 74 819 158 8.4 81 118 324 6.8 86 654 962 5.6 91 473 940Jordan 388 949 122.7 866 000 40.8 1 219 597 8.7 1 325 313 20.3 1 594 513Kazakhstan 197 300 195.0 582 000 76.5 1 027 000 29.6 1 330 730 107.3 2 758 940Kenya 127 404 370.9 600 000 97.9 1 187 122 34.0 1 590 785 60.1 2 546 157Kiribati 0 300 31.7 0 395 25.3 0 495 6.3 0 526 .. ..Kuwait 476 000 84.4 877 920 39.8 1 227 000 15.7 1 420 000 40.8 2 000 000Kyrgyzstan 9 000 200.0 27 000 96.6 53 084 160.5 138 279 117.0 300 000Lao PDR 12 681 133.0 29 545 86.7 55 160 103.5 112 275 81.9 204 191Latvia 401 272 63.7 656 835 39.6 917 196 33.0 1 219 550 26.0 1 536 712Lebanon 743 000 3.2 766 754 1.1 775 104 5.8 820 000 8.3 888 000Lesotho 21 600 163.9 57 000 69.9 96 843 4.8 101 474 56.7 159 000
Table 4 (continued)

66 CHAPTER 1. ICT INDICATORS FOR DEVELOPMENT: TRENDS AND MEASUREMENT ISSUES
INFORMATION ECONOMY REPORT 2005
Country/territory 2000%
change 2000-2001
2001%
change 2001-2002
2002%
change 2002-2003
2003%
change2003-2004
2004
Libyan AJ 40 000 25.0 50 000 40.0 70 000 81.4 127 000 .. ..Lithuania 524 000 94.3 1 017 999 61.6 1 645 568 31.9 2 169 866 57.7 3 421 538Luxembourg 303 274 34.9 409 064 15.6 473 000 14.0 539 000 .. ..Macao (China) 141 052 37.9 194 475 42.0 276 138 31.8 364 031 18.8 432 450Madagascar 63 094 133.8 147 500 10.5 163 010 74.0 283 666 17.7 333 888Malawi 49 000 13.7 55 730 54.4 86 047 57.0 135 114 64.4 222 135Malaysia 5 121 748 44.2 7 385 240 25.3 9 253 387 20.2 11 124 112 31.4 14 611 902Mali 10 398 336.0 45 340 16.1 52 639 365.3 244 930 63.3 400 000Malta 114 444 109.2 239 416 15.6 276 859 4.7 289 992 .. ..Marshall Islands 0 447 9.4 0 489 12.9 0 552 8.3 0 598 .. ..Mauritania 15 300 622.0 110 463 123.8 247 238 41.9 350 870 48.9 522 400Mauritius 180 000 51.3 272 416 27.8 348 137 - 6.3 326 033 56.4 510 000Mayotte .. .. .. .. 21 700 65.9 36 000 5.6 38 000Mexico 14 077 880 54.6 21 757 559 19.2 25 928 266 16.1 30 097 700 27.8 38 451 135Micronesia .. .. .. .. 0 100 5 769.0 5 869 117.8 12 782Mongolia 154 600 26.1 195 000 10.8 216 000 47.7 319 000 .. ..Morocco 2 342 000 103.7 4 771 739 29.9 6 198 670 18.7 7 359 870 26.9 9 336 878Mozambique 51 065 198.9 152 652 66.9 254 759 71.0 435 757 62.5 708 000Myanmar 13 397 69.2 22 671 111.6 47 982 38.6 66 517 38.3 92 007Namibia 82 000 30.0 106 600 40.7 150 000 49.1 223 671 27.9 286 095Nepal 10 226 69.0 17 286 26.6 21 881 130.2 50 367 255.6 179 126Netherlands 10 755 000 14.8 12 352 000 - 2.4 12 060 000 3.6 12 500 000 18.6 14 821 000New Caledonia 49 948 36.0 67 917 17.8 80 000 21.4 97 113 19.9 116 443New Zealand 1 542 000 48.4 2 288 000 7.0 2 449 000 6.1 2 599 000 16.5 3 027 000Nicaragua 90 294 82.2 164 509 44.2 237 248 96.7 466 706 58.3 738 624Niger 2 056 3.4 2 126 683.1 16 648 360.0 76 580 93.6 148 276Nigeria 30 000 1 233.3 400 000 302.0 1 607 931 95.9 3 149 473 190.4 9 147 209Norway 3 367 763 11.8 3 766 431 3.8 3 911 136 6.4 4 163 381 .. ..Oman 164 348 97.5 324 540 43.2 464 896 27.7 593 450 35.6 805 000Pakistan 349 460 132.4 812 000 52.5 1 238 602 111.9 2 624 799 91.3 5 020 000Palestine 175 941 70.5 300 000 6.7 320 000 50.0 480 000 103.0 974 345Panama 410 401 15.8 475 141 10.7 525 845 31.7 692 406 23.6 855 852Paraguay 820 810 40.1 1 150 000 45.0 1 667 018 6.2 1 770 345 - 0.1 1 767 824Peru 1 273 857 40.8 1 793 284 28.6 2 306 944 27.0 2 930 343 39.7 4 092 558Philippines 6 454 359 88.4 12 159 163 25.0 15 201 000 48.1 22 509 560 46.3 32 935 875Poland 6 747 000 48.3 10 004 661 38.9 13 898 471 25.2 17 401 222 32.7 23 096 065Portugal 6 664 951 19.7 7 977 537 6.9 8 528 900 17.6 10 030 000 2.7 10 300 000Qatar 120 856 47.2 177 929 49.9 266 703 41.2 376 535 30.2 490 333Rep. of Korea 26 816 398 8.3 29 045 596 11.4 32 342 493 3.9 33 591 758 8.9 36 586 052Rep. of Moldova 139 000 61.9 225 000 50.3 338 225 40.7 475 942 65.4 787 000Réunion 276 100 52.5 421 100 16.3 489 800 15.4 565 000 .. ..Romania 2 499 000 53.9 3 845 116 32.9 5 110 591 37.8 7 039 898 45.1 10 215 388Russia 3 263 200 137.5 7 750 499 127.2 17 608 756 107.3 36 500 000 103.9 74 420 000Rwanda 39 000 66.7 65 000 70.4 110 762 21.0 134 000 11.9 150 000S. Tome & Principe .. .. .. .. 1 980 143.4 4 819 .. ..Samoa 2 500 0.0 2 500 8.0 2 700 288.9 10 500 .. ..
Table 4 (continued)

INFORMATION ECONOMY REPORT 2005
CHAPTER 1. ICT INDICATORS FOR DEVELOPMENT: TRENDS AND MEASUREMENTS ISSUES 67
Country/territory 2000%
change 2000-2001
2001%
change 2001-2002
2002%
change 2002-2003
2003%
change2003-2004
2004
Saudi Arabia 1 375 881 83.8 2 528 640 98.0 5 007 965 44.5 7 238 224 26.8 9 175 764Senegal 250 251 20.6 301 811 51.0 455 645 26.4 575 917 78.5 1 028 061Serbia and Montenegro 1 303 609 53.3 1 997 809 37.7 2 750 397 32.1 3 634 613 30.1 4 729 629
Seychelles 25 961 41.3 36 683 21.9 44 731 10.1 49 229 0.0 49 230Singapore 2 747 400 8.9 2 991 600 11.8 3 344 800 4.0 3 477 100 11.0 3 860 600Slovakia 1 109 888 93.5 2 147 331 36.1 2 923 383 25.8 3 678 774 16.2 4 275 164Slovenia 1 215 601 20.9 1 470 085 13.4 1 667 234 4.3 1 739 146 .. ..Solomon Islands 1 151 - 16.0 0 967 3.3 0 999 48.9 1 488 .. ..South Africa 8 339 000 29.4 10 787 000 27.0 13 702 000 23.0 16 860 000 15.7 19 500 000Spain 24 265 059 22.2 29 655 729 13.1 33 530 997 11.0 37 219 839 .. ..Sri Lanka 430 202 55.2 667 662 39.5 931 580 49.6 1 393 403 58.7 2 211 158St. Vincent 2 361 217.3 7 492 33.2 9 982 530.2 62 911 - 9.5 56 950Sudan 23 000 351.5 103 846 83.7 190 778 176.4 527 233 98.9 1 048 558Suriname 41 048 111.9 87 000 24.6 108 363 55.5 168 522 26.3 212 819Swaziland 33 000 66.7 55 000 23.6 68 000 25.0 85 000 32.9 113 000Sweden 6 372 300 12.6 7 177 000 10.8 7 949 000 10.7 8 801 000 5.7 9 302 000Switzerland 4 638 519 13.7 5 275 791 8.7 5 736 303 7.9 6 189 000 1.4 6 275 000Syrian Arab Rep. 30 000 566.7 200 000 100.0 400 000 196.3 1 185 000 97.9 2 345 000Taiwan PC 17 873 829 21.9 21 786 384 12.0 24 390 520 5.8 25 799 839 - 11.8 22 760 144Tajikistan 1 160 40.5 1 630 709.8 13 200 260.7 47 617 .. ..TFYR Macedonia 115 748 92.9 223 275 63.6 365 346 112.4 776 000 .. ..Thailand 3 056 000 147.1 7 550 000 113.5 16 117 000 54.3 24 864 019 12.6 28 000 000Togo 50 000 90.0 95 000 78.9 170 000 29.4 220 000 .. ..Trinidad & Tobago 161 860 58.2 256 106 41.3 361 911 34.3 485 871 33.3 647 870Tunisia 119 165 226.6 389 208 47.6 574 334 233.9 1 917 530 85.8 3 562 970Turkey 16 133 405 21.3 19 572 897 19.2 23 323 118 19.6 27 887 535 24.5 34 707 549Turkmenistan 7 500 9.0 8 173 0.0 8 173 12.4 9 187 .. ..Uganda 126 913 123.4 283 520 38.7 393 310 97.3 776 169 50.1 1 165 035Ukraine 818 524 171.8 2 224 600 66.0 3 692 700 76.0 6 498 423 111.4 13 735 000United Arab Emirates 1 428 115 33.7 1 909 303 27.2 2 428 071 22.4 2 972 331 23.9 3 683 117United Kingdom 43 452 000 6.5 46 283 000 7.3 49 677 000 6.7 52 984 000 15.3 61 100 000United States 109 478 031 17.3 128 374 512 9.7 140 766 842 12.8 158 721 981 14.1 181 105 135UR of Tanzania 180 200 136.9 426 964 78.0 760 000 36.9 1 040 640 57.6 1 640 000Uzbekistan 53 128 141.0 128 012 46.0 186 900 71.7 320 815 69.6 544 100Vanuatu 0 365 - 4.1 0 350 1 300.0 4 900 59.2 7 800 34.7 10 504Venezuela 5 447 172 18.8 6 472 584 - 0.1 6 463 561 8.5 7 015 735 20.0 8 420 980Viet Nam 788 559 58.7 1 251 195 52.0 1 902 388 44.1 2 742 000 80.9 4 960 000Yemen 32 000 375.0 152 000 170.4 411 083 70.3 700 000 53.1 1 072 000Zambia 98 853 22.6 121 200 14.8 139 092 73.3 241 000 24.5 300 000Zimbabwe 309 000 6.4 328 669 3.1 338 779 7.3 363 365 9.4 397 500
Source: UNCTAD calculations based on ITU World Telecommunication Indicators Database, 2005.
Table 4 (continued)

68 CHAPTER 1. ICT INDICATORS FOR DEVELOPMENT: TRENDS AND MEASUREMENT ISSUES
INFORMATION ECONOMY REPORT 2005
Country/territory 2000% change 2000-2001 2001
% change 2001-2002 2002
% change 2002-2003 2003
% change 2003-2004 2004
Afghanistan .. .. .. .. 0.1 829.2 1.0 141.7 2.4Albania 1.0 1 220.9 12.7 117.2 27.6 29.6 35.8 .. ..Algeria 0.3 14.6 0.3 294.2 1.3 255.1 4.5 219.0 14.5Andorra 30.2 22.1 36.9 8.5 40.0 54.1 61.6 .. ..Argentina 16.9 14.1 19.3 - 7.8 17.8 16.6 20.7 67.8 34.8Armenia 0.5 45.9 0.7 182.2 1.9 59.0 3.0 .. ..Australia 44.7 28.5 57.4 11.4 64.0 12.8 72.2 14.5 82.6Austria 76.4 6.7 81.4 2.7 83.6 5.1 87.9 12.0 98.4Azerbaijan 5.4 70.4 9.1 17.0 10.7 19.7 12.8 65.1 21.1Bahamas 10.3 90.8 19.7 97.8 39.0 - 6.0 36.7 60.0 58.7Bahrain 32.4 42.7 46.2 25.2 57.9 10.3 63.8 37.7 87.9Bangladesh 0.2 83.6 0.4 103.7 0.8 25.1 1.0 186.1 2.9Barbados 10.6 86.0 19.8 82.5 36.1 43.7 51.9 21.6 63.1Belarus 0.5 181.4 1.4 235.8 4.7 142.5 11.3 .. ..Belgium 54.8 36.1 74.7 5.2 78.6 5.6 83.0 6.4 88.3Belize 7.0 117.4 15.2 23.3 18.8 9.0 20.5 83.0 37.5Benin 0.9 118.1 1.9 69.4 3.2 4.5 3.4 .. ..Bhutan .. .. .. .. .. .. 1.1 - 29.4 0.8Bolivia 7.1 32.8 9.4 30.4 12.3 23.7 15.2 36.1 20.7Bosnia 2.5 374.1 11.7 67.6 19.6 39.6 27.4 .. ..Botswana 12.2 54.4 18.8 34.5 25.3 17.5 29.7 5.7 31.4Brazil 13.7 22.5 16.7 19.9 20.1 31.1 26.3 38.2 36.3Bulgaria 9.1 111.1 19.1 74.2 33.3 34.8 44.9 34.6 60.4Burkina Faso 0.2 193.7 0.7 45.1 0.9 95.8 1.9 60.5 3.0Burundi 0.2 84.3 0.4 66.4 0.7 20.8 0.9 .. ..Cambodia 1.0 66.9 1.7 65.8 2.8 27.7 3.5 .. ..Cameroon 0.7 295.4 2.7 63.7 4.4 49.4 6.6 42.4 9.4Canada 28.8 20.4 34.7 10.0 38.2 9.1 41.7 13.3 47.2Cape Verde 4.5 56.9 7.1 33.9 9.5 22.0 11.6 19.9 13.9Central African Rep. 0.1 111.7 0.3 9.5 0.3 204.6 1.0 57.7 1.5Chad 0.1 289.5 0.3 51.4 0.4 85.1 0.8 .. ..Chile 22.4 53.1 34.2 25.1 42.8 15.3 49.4 25.7 62.1China 6.6 67.6 11.0 45.4 16.0 30.3 20.9 22.0 25.5Colombia 5.3 43.1 7.6 39.2 10.6 33.1 14.1 63.9 23.2Comoros .. .. .. .. .. .. 0.3 .. ..Congo 2.4 102.7 4.8 39.4 6.7 40.3 9.4 22.8 11.6Costa Rica 5.1 48.3 7.6 46.6 11.1 63.3 18.1 18.4 21.5Côte d'Ivoire 3.2 39.3 4.5 39.8 6.2 23.6 7.7 17.8 9.1Croatia 23.1 73.7 40.1 33.3 53.5 9.1 58.4 .. ..Cuba 0.1 30.8 0.1 107.4 0.2 95.8 0.3 116.1 0.7Cyprus 32.2 41.8 45.6 28.2 58.4 27.3 74.4 6.7 79.4Czech Republic 42.3 60.6 67.9 24.9 84.9 13.6 96.5 9.2 105.3DR Congo 0.0 883.5 0.3 272.5 1.1 78.2 1.9 .. ..
Table 5. Mobile phone penetration, by country/territory 2000–2004
Mobile phone subscribers per 100 inhabitants(alphabetical order)

INFORMATION ECONOMY REPORT 2005
CHAPTER 1. ICT INDICATORS FOR DEVELOPMENT: TRENDS AND MEASUREMENTS ISSUES 69
Country/territory 2000% change 2000-2001 2001
% change 2001-2002 2002
% change 2002-2003 2003
% change 2003-2004 2004
Denmark 63.1 17.2 74.0 12.7 83.3 6.0 88.3 8.8 96.1Djibouti 0.0 1 180.0 0.5 390.9 2.3 50.6 3.4 .. ..Dominican Rep. 8.2 77.6 14.6 41.0 20.7 18.4 24.5 17.8 28.8Ecuador 3.8 74.9 6.7 88.5 12.6 45.6 18.3 88.1 34.4Egypt 2.1 102.0 4.3 54.3 6.7 26.5 8.4 29.3 10.9El Salvador 11.8 13.1 13.4 2.7 13.8 25.8 17.3 60.0 27.7Equatorial Guinea 1.1 189.1 3.2 98.5 6.3 20.6 7.6 43.3 11.0Eritrea .. .. .. .. .. .. .. .. 0.5Estonia 38.7 17.7 45.5 42.8 65.0 19.6 77.7 23.5 96.0Ethiopia 0.0 50.4 0.0 77.8 0.1 88.6 0.1 77.3 0.3Faeroe Islands 37.7 44.1 54.3 18.4 64.4 18.9 76.5 .. ..Fiji 6.8 46.5 9.9 10.2 11.0 21.3 13.3 .. ..Finland 72.0 11.6 80.4 7.9 86.7 4.9 91.0 5.1 95.6France 49.3 26.4 62.3 3.8 64.7 7.6 69.6 5.9 73.7Gabon 9.8 21.4 11.9 80.8 21.5 4.4 22.4 61.3 36.2Georgia 3.9 56.0 6.1 68.5 10.2 42.4 14.5 14.0 16.6Germany 58.6 16.2 68.1 5.2 71.6 9.6 78.5 10.1 86.4Ghana 0.6 43.9 0.9 124.0 2.1 71.9 3.6 122.5 7.9Greece 56.2 33.8 75.2 12.5 84.5 6.7 90.2 11.5 100.6Grenada 4.6 40.9 6.4 11.1 7.1 428.1 37.6 11.8 42.1Guatemala 7.5 30.3 9.8 34.0 13.1 25.7 16.5 51.4 25.0Guinea 0.6 30.7 0.7 61.2 1.2 21.5 1.4 .. ..Guinea-Bissau .. .. .. .. .. .. 0.1 .. ..Haiti 0.7 63.8 1.1 52.5 1.7 127.8 3.8 23.3 4.7Honduras 2.5 46.9 3.6 34.1 4.9 14.5 5.6 81.0 10.1Hong Kong (China) 81.7 5.1 85.9 9.7 94.2 14.5 107.9 6.1 114.5Hungary 30.7 62.0 49.8 35.7 67.6 16.2 78.5 13.0 88.8Iceland 76.5 13.1 86.5 4.8 90.6 6.8 96.8 2.8 99.4India 0.4 77.2 0.6 94.5 1.2 103.2 2.5 76.6 4.4Indonesia 1.8 75.2 3.1 76.9 5.5 58.5 8.7 54.2 13.5Iran (Islamic Rep. of) 1.5 113.7 3.2 3.5 3.3 52.2 5.1 21.0 6.2Iraq .. .. .. .. 0.1 289.2 0.3 591.5 2.2Ireland 65.0 19.0 77.4 - 1.4 76.3 15.3 88.0 7.5 94.5Israel 70.2 29.2 90.7 5.3 95.5 0.6 96.1 9.0 104.7Italy 73.7 19.8 88.3 6.3 93.9 10.1 103.3 5.9 109.4Jamaica 14.2 71.3 24.4 118.9 53.3 13.6 60.6 35.7 82.2Japan 52.6 11.7 58.8 8.3 63.7 6.7 67.9 5.4 71.6Jordan 7.7 116.5 16.7 36.9 22.9 5.7 24.2 17.4 28.4Kazakhstan 1.2 197.3 3.6 77.9 6.4 30.6 8.4 113.2 17.9Kenya 0.4 361.5 1.9 96.6 3.8 33.1 5.0 56.5 7.9Kiribati 0.4 29.5 0.5 23.3 0.6 4.5 0.6 .. ..Kuwait 21.7 77.5 38.6 34.5 51.9 10.1 57.2 34.8 77.1Kyrgyzstan 0.2 193.6 0.5 92.4 1.0 163.9 2.8 109.5 5.8Lao PDR 0.2 127.1 0.5 81.9 1.0 98.6 2.0 78.3 3.5Latvia 16.6 68.8 27.9 41.0 39.4 33.5 52.6 27.8 67.2Lebanon 22.6 1.2 22.9 - 0.8 22.7 3.2 23.4 6.8 25.0
Table 5 (continued)

70 CHAPTER 1. ICT INDICATORS FOR DEVELOPMENT: TRENDS AND MEASUREMENT ISSUES
INFORMATION ECONOMY REPORT 2005
Country/territory 2000% change 2000-2001 2001
% change 2001-2002 2002
% change 2002-2003 2003
% change 2003-2004 2004
Lesotho 1.0 163.0 2.6 69.4 4.5 4.4 4.7 89.2 8.8Libya AJ 0.7 25.6 0.9 40.6 1.3 82.2 2.3 .. ..Lithuania 14.2 94.9 27.7 71.8 47.5 32.2 62.8 58.1 99.3Luxembourg 69.2 34.6 93.1 14.0 106.1 12.6 119.4 .. ..Macao (China) 32.1 38.9 44.5 40.4 62.5 29.8 81.2 14.1 92.6Madagascar 0.4 127.6 1.0 7.6 1.0 69.4 1.7 7.7 1.9Malawi 0.5 13.2 0.5 53.6 0.8 56.3 1.3 39.7 1.8Malaysia 22.0 40.4 30.9 22.1 37.7 17.1 44.2 32.9 58.7Mali 0.1 328.8 0.4 13.6 0.5 355.3 2.3 59.7 3.6Malta 29.3 108.1 61.1 14.5 69.9 3.7 72.5 .. ..Marshall Islands 0.9 7.8 0.9 11.2 1.0 6.7 1.1 .. ..Mauritania 0.6 603.7 4.2 118.1 9.2 38.3 12.7 37.5 17.5Mauritius 15.1 50.5 22.7 26.7 28.8 - 7.2 26.7 54.9 41.4Mayotte .. .. .. .. 13.5 59.2 21.6 5.5 22.8Mexico 14.2 54.1 21.9 17.4 25.8 14.4 29.5 24.3 36.6Micronesia .. .. .. .. 0.1 5 752.7 5.4 111.8 11.5Mongolia 6.5 24.7 8.1 9.5 8.9 46.0 13.0 .. ..Morocco 8.2 100.5 16.4 27.8 20.9 16.8 24.4 23.0 30.1Mozambique 0.3 189.5 0.9 63.0 1.4 61.7 2.3 63.8 3.7Myanmar 0.0 67.1 0.0 109.0 0.1 27.6 0.1 36.0 0.2Namibia 4.6 26.7 5.8 37.1 8.0 45.3 11.6 22.4 14.2Nepal 0.0 65.6 0.1 24.0 0.1 125.6 0.2 229.1 0.7Netherlands 67.3 14.0 76.7 - 2.9 74.5 3.1 76.8 19.0 91.3New Caledonia 23.3 33.1 31.0 15.3 35.7 18.7 42.4 18.4 50.2New Zealand 40.0 47.5 59.0 5.4 62.2 4.3 64.8 19.6 77.5Nicaragua 1.8 77.6 3.2 44.2 4.6 86.8 8.5 55.1 13.2Niger 0.0 - 1.2 0.0 648.4 0.1 339.6 0.6 91.0 1.2Nigeria 0.0 1 198.4 0.3 291.4 1.3 90.7 2.6 181.9 7.2Norway 74.8 11.1 83.1 1.5 84.4 7.7 90.9 .. ..Oman 6.8 91.4 13.1 39.9 18.3 24.6 22.8 20.2 27.4Pakistan 0.3 126.7 0.6 48.8 0.8 106.8 1.8 81.8 3.2Palestine 5.6 62.8 9.1 1.8 9.3 43.2 13.3 99.3 26.4Panama 14.5 13.4 16.4 6.7 17.5 27.0 22.2 21.4 27.0Paraguay 14.9 36.6 20.4 41.3 28.8 3.5 29.9 - 1.6 29.4Peru 5.0 38.5 6.9 25.5 8.6 24.0 10.7 38.9 14.9Philippines 8.4 84.2 15.5 23.0 19.1 45.2 27.8 43.5 39.9Poland 17.5 48.3 25.9 39.0 36.0 25.3 45.1 32.9 59.9Portugal 66.5 16.1 77.2 6.9 82.5 16.8 96.4 6.1 102.3Qatar 19.9 40.0 27.9 42.5 39.7 34.2 53.3 48.6 79.2Rep. of Korea 58.3 5.2 61.4 10.7 67.9 3.4 70.2 8.4 76.1Réunion 39.5 45.8 57.6 14.4 65.9 13.4 74.7 .. ..Rep. of Moldova 3.8 62.3 6.2 50.8 9.3 41.2 13.2 39.9 18.5Romania 11.1 54.1 17.2 36.6 23.5 38.5 32.5 41.2 45.9Russian Fed. 2.2 137.8 5.3 127.5 12.0 107.5 24.9 107.0 51.6Rwanda 0.5 62.1 0.8 65.8 1.4 17.7 1.6 10.9 1.8S. Tome & Principe .. .. .. .. 1.3 141.8 3.2 .. ..
Table 5 (continued)

INFORMATION ECONOMY REPORT 2005
CHAPTER 1. ICT INDICATORS FOR DEVELOPMENT: TRENDS AND MEASUREMENTS ISSUES 71
Country/territory 2000% change 2000-2001 2001
% change 2001-2002 2002
% change 2002-2003 2003
% change 2003-2004 2004
Samoa 1.4 - 1.0 1.4 6.9 1.5 285.0 5.8 .. ..Saudi Arabia 6.6 79.1 11.8 93.0 22.8 40.8 32.1 14.7 36.8Senegal 2.6 17.2 3.1 46.9 4.5 23.0 5.6 78.8 9.9Serbia andMontenegro 12.3 52.7 18.7 37.2 25.7 31.7 33.8 33.1 45.0
Seychelles 32.0 41.2 45.2 18.3 53.4 11.3 59.5 2.2 60.8Singapore 68.4 5.9 72.4 9.9 79.6 4.1 82.9 8.0 89.5Slovakia 20.5 94.3 39.9 36.2 54.4 6.1 57.7 37.1 79.1Slovenia 61.1 20.6 73.7 13.4 83.5 4.3 87.1 .. ..Solomon Islands 0.3 - 18.3 0.2 0.5 0.2 38.8 0.3 .. ..South Africa 19.1 26.8 24.2 24.5 30.1 20.6 36.4 18.6 43.1Spain 60.5 21.3 73.4 12.4 82.4 5.8 87.2 .. ..Sri Lanka 2.3 53.0 3.6 37.9 4.9 47.9 7.3 57.8 11.5Saint Vincent 2.1 213.0 6.5 31.0 8.5 519.7 52.9 - 11.0 47.1Sudan 0.1 339.1 0.3 78.7 0.6 172.1 1.6 92.4 3.0Suriname 9.5 109.1 19.8 13.9 22.5 42.2 32.0 51.3 48.5Swaziland 3.3 64.7 5.4 22.2 6.6 23.5 8.1 28.1 10.4Sweden 71.8 12.3 80.5 10.3 88.9 10.3 98.0 5.3 103.2Switzerland 64.3 13.2 72.8 8.2 78.8 7.4 84.6 3.6 87.6Syrian Arab Rep. 0.2 545.5 1.2 95.2 2.3 189.2 6.8 90.6 12.9Taiwan PC 80.2 21.2 97.2 11.4 108.3 5.4 114.1 - 12.4 100.0Tajikistan 0.0 38.6 0.0 689.2 0.2 251.5 0.7 .. ..TFYR Macedonia 5.7 91.0 10.9 62.0 17.7 110.3 37.2 .. ..Thailand 5.0 144.5 12.3 111.3 26.0 51.4 39.4 11.9 44.1Togo 1.1 85.2 2.0 74.4 3.5 26.1 4.4 .. ..Trinidad & Tobago 12.5 57.5 19.7 41.2 27.8 34.1 37.3 32.9 49.6Tunisia 1.2 222.9 4.0 45.9 5.9 230.6 19.4 84.8 35.9Turkey 24.7 15.6 28.6 17.5 33.6 17.5 39.4 21.7 48.0Turkmenistan 0.2 0.5 0.2 - 0.3 0.2 12.0 0.2 .. ..Uganda 0.6 115.6 1.2 33.9 1.6 90.4 3.0 43.8 4.4Ukraine 1.6 184.5 4.6 66.7 7.7 77.4 13.7 108.9 28.5United Arab Emirates 44.0 24.5 54.7 18.2 64.7 13.7 73.6 15.1 84.7United Kingdom 72.7 6.0 77.0 9.1 84.1 8.4 91.2 12.8 102.8United States 38.9 15.7 45.0 8.6 48.9 11.7 54.6 11.7 61.0UR of Tanzania 0.6 130.3 1.3 73.6 2.2 33.7 3.0 47.5 4.4Uruguay 12.3 25.7 15.5 24.5 19.3 - 20.0 15.4 20.2 18.5Uzbekistan 0.2 137.9 0.5 44.2 0.7 69.5 1.3 63.7 2.1Vanuatu 0.2 - 6.6 0.2 1 263.3 2.4 55.0 3.8 28.9 4.8Venezuela 22.5 16.2 26.2 - 2.1 25.6 6.5 27.3 17.8 32.2Viet Nam 1.0 56.1 1.5 51.8 2.3 43.9 3.4 78.4 6.0Yemen 0.2 362.1 0.8 161.7 2.1 64.8 3.5 48.8 5.2Zambia 1.0 19.2 1.1 11.6 1.3 68.2 2.2 27.9 2.8Zimbabwe 2.7 5.2 2.9 6.2 3.0 2.2 3.1 0.0 3.1
Source: UNCTAD calculations based on ITU World Telecommunication Indicators Database, 2005.
Table 5 (continued)
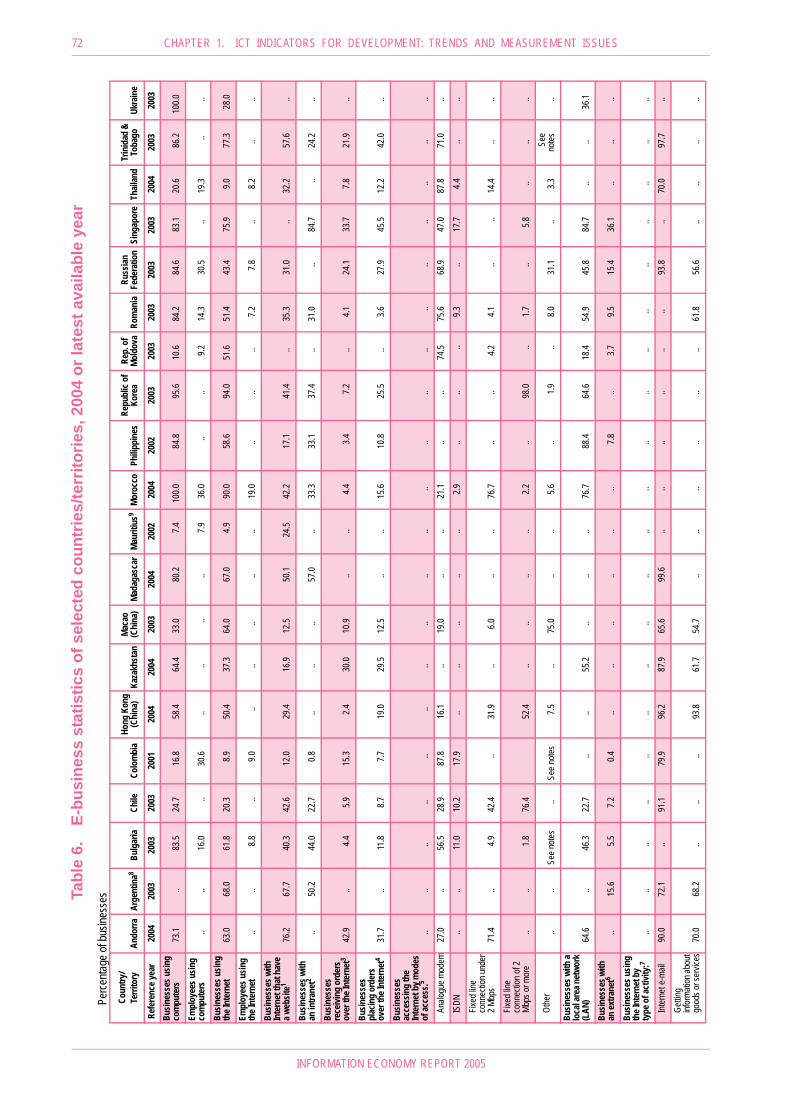
72 CHAPTER 1. ICT INDICATORS FOR DEVELOPMENT: TRENDS AND MEASUREMENT ISSUES
INFORMATION ECONOMY REPORT 2005
Tabl
e 6.
E-bu
sine
ss s
tatis
tics
of s
elec
ted
coun
trie
s/te
rrito
ries,
200
4 or
late
st a
vaila
ble
year
Perce
ntage
of bu
sines
ses
Coun
try/
Terri
tory
Ando
rraAr
gent
ina8
Bulg
aria
Chile
Colo
mbi
aHo
ng K
ong
(Chi
na)
Kaza
khst
anMa
cao
(Chi
na)
Mada
gasc
arMa
uriti
us9
Moro
cco
Philip
pine
sRe
publ
ic of
Ko
rea
Rep.
of
Mold
ova
Rom
ania
Russ
ian
Fede
ratio
nSi
ngap
ore
Thail
and
Trin
idad
&
Toba
goUk
rain
e
Refe
renc
e yea
r20
0420
0320
0320
0320
0120
0420
0420
0320
0420
0220
0420
0220
0320
0320
0320
0320
0320
0420
0320
03Bu
sines
ses u
sing
com
pute
rs73
.1..
83.5
24.7
16.8
58.4
64.4
33.0
80.2
7.410
0.084
.895
.610
.684
.284
.683
.120
.686
.210
0.0Em
ploy
ees u
sing
com
pute
rs
....
16.0
..30
.6..
....
..7.9
36.0
....
9.214
.330
.5..
19.3
....
Busin
esse
s usin
g th
e Int
erne
t63
.068
.061
.820
.38.9
50.4
37.3
64.0
67.0
4.990
.058
.694
.051
.651
.443
.475
.99.0
77.3
28.0
Empl
oyee
s usin
g th
e Int
erne
t ..
..8.8
..9.0
....
....
..19
.0..
....
7.27.8
..8.2
....
Busin
esse
s with
In
tern
et th
at h
ave
a web
site1
76.2
67.7
40.3
42.6
12.0
29.4
16.9
12.5
50.1
24.5
42.2
17.1
41.4
..35
.331
.0..
32.2
57.6
..Bu
sines
ses w
ith
an in
trane
t2..
50.2
44.0
22.7
0.8..
....
57.0
..33
.333
.137
.4..
31.0
..84
.7..
24.2
..Bu
sines
ses
rece
iving
ord
ers
over
the I
nter
net3
42.9
..4.4
5.915
.32.4
30.0
10.9
....
4.43.4
7.2..
4.124
.133
.77.8
21.9
..Bu
sines
ses
plac
ing
orde
rs
over
the I
nter
net4
31.7
..11
.88.7
7.719
.029
.512
.5..
..15
.610
.825
.5..
3.627
.945
.512
.242
.0..
Busin
esse
s ac
cess
ing
the
Inte
rnet
by m
odes
of
acce
ss.5
....
....
....
....
....
....
....
....
....
....
Analo
gue m
odem
27.0
..56
.528
.987
.816
.1..
19.0
....
21.1
....
74.5
75.6
68.9
47.0
87.8
71.0
..IS
DN..
..11
.010
.217
.9..
....
....
2.9..
....
9.3..
17.7
4.4..
..Fix
ed lin
e co
nnec
tion u
nder
2 M
bps
71.4
..4.9
42.4
..31
.9..
6.0..
..76
.7..
..4.2
4.1..
..14
.4..
..Fix
ed lin
e co
nnec
tion o
f 2
Mbps
or m
ore
....
1.876
.452
.4..
....
..2.2
..98
.0..
1.7..
5.8..
....
Othe
r..
..Se
e note
s..
See n
otes
7.5..
75.0
....
5.6..
1.9..
8.031
.1..
3.3Se
eno
tes..
Busin
esse
s with
a lo
cal a
rea n
etwo
rk
(LAN
)64
.6..
46.3
22.7
....
55.2
....
..76
.788
.464
.618
.454
.945
.884
.7..
..36
.1Bu
sines
ses w
ith
an ex
trane
t6..
15.6
5.57.2
0.4..
....
....
..7.8
..3.7
9.515
.436
.1..
....
Busin
esse
s usin
g th
e Int
erne
t by
type
of a
ctivi
ty:7
....
....
....
....
....
....
....
....
....
....
Inter
net e
90.0
72.1
..91
.179
.996
.287
.965
.699
.6..
....
....
..93
.8..
70.0
97.7
..Ge
tting
infor
matio
n abo
ut go
ods o
r ser
vices
70.0
68.2
....
..93
.861
.754
.7..
....
....
..61
.856
.6..
....
..

INFORMATION ECONOMY REPORT 2005
CHAPTER 1. ICT INDICATORS FOR DEVELOPMENT: TRENDS AND MEASUREMENTS ISSUES 73
Tabl
e 6
(con
tinue
d)
Notes
:1
Or w
eb pr
esen
ce w
here
the b
usine
ss ha
s con
trol o
ver t
he co
ntent.
2Mo
rocc
o: Int
rane
t is us
ed fo
r adm
inistr
ation
12.4
per c
ent; i
ntern
al me
ssag
ing 4.
4 per
cent;
even
ts inf
orma
tion 3
.3 pe
r cen
t; pro
ducti
on m
anag
emen
t 3.6
per c
ent; r
esou
rce m
anag
emen
t 2 pe
r cen
t; sale
s man
agem
ent 2
per c
ent; d
ocum
ent
exch
ange
2 pe
r cen
t; hum
an re
sour
ce m
anag
emen
t 0.5
per c
ent; a
nd in
forma
tion m
anag
emen
t 0.4
per c
ent.
3Ph
ilippin
es: R
eceiv
ing or
ders
is ba
sed o
n pro
portio
n of e
nterp
rises
with
onlin
e sale
s/rev
enue
.4
Philip
pines
: Plac
ing or
ders
is ba
sed o
n pro
portio
n of e
nterp
rises
with
onlin
e pur
chas
es.
Russ
ian F
eder
ation
: Plac
ing or
ders
over
all g
lobal
infor
matio
n netw
orks
, inclu
ding t
he In
terne
t.5
Bulga
ria: O
ther b
road
band
conn
ectio
n, e.g
. cab
le etc
. 25.6
per c
ent; w
ireles
s, e.g
. sate
llite,
mobil
es, 8
.9 pe
r cen
t.Co
lombia
: Wire
less 0
.6 pe
r cen
t and
XDS
L 0.8
per c
ent.
Hong
Kon
g (Ch
ina):
Fixed
line c
onne
ction
is m
easu
red a
t 3Mb
ps or
unde
r and
over
3Mbp
s; oth
er m
ode o
f acc
ess r
efers
to mo
bile n
etwor
k.Ma
cao (
China
): Fix
ed lin
e con
necti
on w
as re
porte
d ind
istinc
tly of
spee
d; oth
er m
odes
of ac
cess
refer
s to X
DSL.
Repu
blic o
f Mold
ova:
Fixed
line c
onne
ction
was
repo
rted i
rresp
ectiv
e of s
peed
.Mo
rocc
o: Ot
her m
odes
of ac
cess
refer
to m
obile
phon
e.Re
publi
c of K
orea
: Fixe
d line
conn
ectio
n of 2
Mbps
or m
ore i
nclud
es xD
SL, d
edica
ted lin
e and
cable
mod
em; n
o exp
lanati
on gi
ven f
or ot
her m
odes
of ac
cess
.Ru
ssian
Fed
erati
on: O
ther m
odes
of ac
cess
refer
to de
dicate
d com
munic
ation
lines
.Tr
inida
d and
Toba
go: O
ther m
odes
of ac
cess
inclu
de le
ased
lines
4.7 p
er ce
nt; bo
th dia
l-up a
nd le
ased
lines
4.7 p
er ce
nt; an
d wire
less 4
.7 pe
r cen
t.6
Russ
ian F
eder
ation
: Refe
rs to
globa
l infor
matio
n netw
orks
othe
r tha
n the
Inter
net.
7Ho
ng K
ong (
China
): Ge
tting i
nform
ation
on go
ods a
nd se
rvice
s inc
ludes
othe
r infor
matio
n sea
rches
and r
esea
rch; g
etting
infor
matio
n fro
m Go
vern
ment
includ
es tr
ansa
cting
with
Gov
ernm
ent.
Maca
o (Ch
ina):
Gettin
g info
rmati
on on
good
s and
servi
ces r
efers
to ge
tting i
nform
ation
in ge
nera
l; pro
viding
custo
mer s
ervic
es in
clude
s pur
chas
es an
d sale
s.Ru
ssian
Fed
erati
on: E
refer
s not
only
to Int
erne
t e-m
ail; p
rovid
ing cu
stome
r ser
vices
refer
s to a
fter-s
ales s
ervic
es.
Thail
and:
Also
repo
rted m
onito
ring t
he m
arke
t 40 p
er ce
nt; co
mmun
icatio
n othe
r tha
n e-m
ail 11
.1 pe
r cen
t; adv
ertis
ing of
own g
oods
and s
ervic
es 16
.7 pe
r cen
t; tra
nsac
tions
or co
mmun
icatio
ns w
ith tr
ading
partn
ers 1
7.8 pe
r cen
t; othe
r5.6
per c
ent.
8Ar
genti
na su
rvey o
n man
ufactu
ring s
ector
only.
9Ma
uritiu
s cen
sus/s
urve
y con
ducte
d only
in m
icroe
nterp
rises
(1–9
emplo
yees
).
Sour
ce: U
NCTA
D e-
busin
ess d
ataba
se (2
005)
.
Coun
try/
Terri
tory
Ando
rraAr
gent
ina8
Bulg
aria
Chile
Colo
mbi
aHo
ng K
ong
(Chi
na)
Kaza
khst
anMa
cao
(Chi
na)
Mada
gasc
arMa
uriti
us9
Moro
cco
Philip
pine
sRe
publ
ic of
Ko
rea
Rep.
of
Mold
ova
Rom
ania
Russ
ian
Fede
ratio
nSi
ngap
ore
Thail
and
Trin
idad
&
Toba
goUk
rain
e
Refe
renc
e yea
r20
0420
0320
0320
0320
0120
0420
0420
0320
0420
0220
0420
0220
0320
0320
0320
0320
0320
0420
0320
03
Gettin
g inf
orma
tion f
rom
gove
rnme
nt or
ganiz
ation
s/pu
blic a
uthor
ities
....
59.1
....
58.5
....
....
....
....
56.1
....
....
..Ot
her in
forma
tion
sear
ches
and
rese
arch
....
....
....
86.1
..64
.2..
....
....
....
..85
.683
.7..
Inter
net b
ankin
g or
acce
ssing
oth
er fin
ancia
l se
rvice
s62
.0..
41.7
....
34.1
....
....
....
....
43.4
....
5.6..
..Tr
ansa
cting
with
go
vern
ment
orga
nizati
ons/
publi
c auth
oritie
s25
.0..
61.0
....
....
9.4..
....
....
..12
.6..
....
....
Prov
iding
cu
stome
r se
rvice
s34
.021
.0..
....
17.3
45.0
23.4
....
....
....
..5.1
....
36.2
..De
liver
ing
prod
ucts
onlin
e22
.0..
....
..21
.8..
....
....
....
....
5.7..
....
..Ot
her
20.0
....
....
48.8
92.0
3.116
.4..
....
....
....
..Se
e note
sSe
e note
s..

74 CHAPTER 1. ICT INDICATORS FOR DEVELOPMENT: TRENDS AND MEASUREMENT ISSUES
INFORMATION ECONOMY REPORT 2005
Level ofDevelopment
RegionDeveloped economies Developing economies
South-East Europe and Commonwealth of Independent States
North America Canada, USA (includes Puerto Rico and Guam)
Latin America and the Caribbean,
other America
Anguilla, Antigua and Barbuda, Argentina, Aruba, Bahamas, Barbados, Belize, Bolivia, Br. Virgin Isds, Brazil, Cayman Isds, Chile, Colombia, Costa Rica, Cuba, Dominica, Dominican Rep., Ecuador, El Salvador, Falkland Isds (Malvinas), French Guiana, Grenada, Guadeloupe, Guatemala, Guyana, Haiti, Honduras, Jamaica, Martinique, Mexico, Montserrat, Neth. Antilles, Nicaragua, Panama, Paraguay, Peru, Saint Kitts and Nevis, Saint Lucia, Saint Vincent and the Grenadines, Suriname, Trinidad and Tobago, Turks and Caicos Isds, Uruguay, US Virgin Isds, Venezuela
Africa
Algeria, Angola, Benin, Botswana, Burkina Faso, Burundi, Cameroon, Cape Verde, Central African Rep., Chad, Comoros, Congo, Côte d'Ivoire, Dem. Rep. of the Congo, Djibouti, Egypt, Equatorial Guinea, Eritrea, Ethiopia, Gabon, Gambia, Ghana, Guinea, Guinea-Bissau, Kenya, Lesotho, Liberia, Libyan Arab Jamahiriya, Madagascar, Malawi, Mali, Mauritania, Mauritius, Mayotte, Morocco, Mozambique, Namibia, Niger, Nigeria, Réunion, Rwanda, Saint Helena, Sao Tome and Principe, Senegal, Seychelles, Sierra Leone, Somalia, South Africa, Sudan, Swaziland, Togo, Tunisia, Uganda, United Rep. of Tanzania, Zambia, Zimbabwe
Asia
Israel, Japan Afghanistan, Bahrain, Bangladesh, Bhutan, Brunei Darussalam, Cambodia, China, Dem. People's Rep. of Korea, Hong Kong SAR, India, Indonesia, Islamic Rep. of Iran, Iraq, Jordan, Kuwait, Lao People's Dem. Rep., Lebanon, Macao SAR, Malaysia, Maldives, Mongolia, Myanmar, Nepal, Palestinian Territory, Oman, Pakistan, Philippines, Qatar, Rep. of Korea, Saudi Arabia, Singapore, Sri Lanka, Syrian Arab Rep., Thailand, Timor-Leste, Turkey, United Arab Emirates, Viet Nam, Yemen
Armenia, Azerbaijan, Georgia, Kazakhstan, Kyrgyzstan, Tajikistan, Turkmenistan, Uzbekistan
Europe
Andorra, Austria, Belgium, Belgium-Luxembourg, Cyprus, Czech Rep., Denmark, Estonia, Faeroe Isds, Finland, France, Germany, Gibraltar, Greece, Hungary, Iceland, Ireland, Italy, Latvia, Lithuania, Luxembourg, Malta, Netherlands, Norway, Poland, Portugal, Slovakia, Slovenia, Spain, Sweden, Switzerland, United Kingdom
Albania, Belarus, Bosnia and Herzegovina, Bulgaria, Croatia, Rep. of Moldova, Romania, Russian Federation, Serbia and Montenegro, TFYR of Macedonia, Ukraine
OceaniaAustralia, New Zealand Cook Isds, Fiji, French Polynesia, FS Micronesia, Kiribati,
Marshall Isds, N. Mariana Isds, Nauru, New Caledonia, Niue, Palau, Papua New Guinea, Samoa, Solomon Isds, Tokelau, Tonga, Tuvalu, Vanuatu, Wallis and Futuna Isds
Source: UNCTAD Handbook of Statistics, 2004
Annex IIDistribution of countries
The distribution of countries by regional groups and type of development is based on UNCTAD’s distribution of countries as set out in the UNCTADHandbook of Statistics, 2004.

INFORMATION ECONOMY REPORT 2005
CHAPTER 1. ICT INDICATORS FOR DEVELOPMENT: TRENDS AND MEASUREMENTS ISSUES 75
Annex III
Classification of ICT goods
ICT goods classification, based on HS 1996, proposed by OECD
Computer and related equipment
847110 Analogue or hybrid automatic data processing machines847130 Portable digital automatic data processing machines, weighing not more than 10 kg, consisting of at least a central processing
unit, a keyboard and a display847141 Digital automatic data processing machines comprising in the same housing at least a central processing unit and an input and
output unit, whether or not combined847149 Other digital automatic data processing machines, presented in the form of systems847150 Digital processing units other than those of subheadings 8471.41 and 8471.49, whether or not containing in the same housing
one or two of the following types of unit: storage units, input units, output units847160 Automatic data processing machines, input or output units, whether or not containing storage units in the same housing847170 Automatic data processing machines, storage units847180 Other units of automatic data processing machines847190 Magnetic or optical readers, machines for transcribing data onto data media in coded form and machines for processing such
data, not elsewhere specified or included847330 Parts and accessories of the machines of heading No. 84.71
Telecommunications equipment
851711 Line telephone sets with cordless handsets851719 Other telephone sets, video phones851721 Facsimile machines851722 Teleprinters851730 Telephonic or telegraphic switching apparatus851750 Other apparatus, for carrier-current line systems or for digital line systems851780 Other electrical apparatus for line telephony or line telegraphy851790 Parts for other electrical apparatus for line telephony or line telegraphy852020 Telephone answering machines852510 Transmission apparatus for radiotelephony, radiotelegraphy, radiobroadcasting or television not incorporating reception
apparatus852520 Transmission apparatus for radiotelephony, radiotelegraphy, radiobroadcasting or television incorporating reception apparatus852530 Television cameras852610 Radar apparatus852790 Reception apparatus for radiotelephony, radiotelegraphy or radiobroadcasting, whether or not combined, in the same housing,
with sound recording or reproducing apparatus or a clock, n.e.s852910 Aerials and aerial reflectors of all kinds; parts suitable for use therewith853110 Burglar or fire alarms and similar apparatus (2)854420 Co-axial cable and other co-axial electric conductors854470 Optical fibre cables

76 CHAPTER 1. ICT INDICATORS FOR DEVELOPMENT: TRENDS AND MEASUREMENT ISSUES
INFORMATION ECONOMY REPORT 2005
Electronic components
850431 Electrical transformers having a power handling capacity not exceeding 1 kVA (2) 850450 Inductors (2) 850490 Parts of: electrical transformers, static converters (for example, rectifiers) and inductors (2) 852330 Cards incorporating a magnetic stripe, unrecorded (2) 852460 Cards incorporating a magnetic stripe, recorded (2) 852990 Parts suitable for use solely or principally with the apparatus of headings Nos. 85.25 to 85.28 except aerials and aerials reflectors 853221 Capacitors, fixed, tantalum having a reactive power handling capacity of less than 0.5 kvar 853224 Capacitors, fixed, ceramic dielectric, multilayer having a reactive power handling capacity of less than 0.5 kvar 853230 Variable or adjustable (pre-set) capacitors 853310 Fixed carbon resistors, composition or film types 853321 Electrical resistors, fixed, (including rheostats and potentiometers), other than heating resistors, for a power handling capacity
<= 20 W 853329 Electrical resistors, fixed, (including rheostats and potentiometers), other than heating resistors, n.e.s.. 853331 Wirewound variable resistors, for a power handling capacity <= 20 W 853339 Wirewound variable resistors, for a power handling capacity <= 20 W 853340 Other variable resistors, including rheostats and potentiometers 853390 Parts for electrical resistors (including rheostats and potentiometers), other than heating resistors 853400 Printed circuits 854011 Cathode-ray television picture tubes, including video monitor tubes, colour 854012 Cathode-ray television picture tubes, including video monitor tubes, black and white or other monochrome 854020 Television camera tubes; image converters and intensifiers; other photo-cathode tubes 854040 Data/graphic display tubes, colour, with a phosphor dot screen pitch smaller than 0.4 mm 854050 Data/graphic display tubes, black and white or other monochrome 854060 Other cathode-ray tubes 854071 Microwave tubes, magnetrons, excluding grid-controlled tubes 854072 Microwave tubes klystrons, excluding grid-controlled tubes 854079 Microwave tubes, other, excluding grid-controlled tubes 854081 Receiver or amplifier valves and tubes 854089 Valve and tubes, n.e.s. 854091 Parts of cathode-ray tubes 854099 Parts of thermionic or photo-cathode, valve and tubes, other than cathode-ray tubes 854110 Diodes, other than photosensitive or light emitting diodes 854121 Transistors, other than photosensitive, dissipation rate < 1 W 854129 Transistors, other than photosensitive transistors, n.e.s. 854130 Thyristors, diacs and triacs, other than photosensitive devices 854140 Photosensitive semiconductor devices, including photovoltaic cells whether or not assembled in modules or made up into panels;
light emitting diodes854150 Other semiconductor devices854160 Mounted piezo-electric crystals854190 Parts for semiconductor devices854212 Cards incorporating electronic integrated circuits ("smart" cards)854213 Metal oxide semiconductors (MOS technology)854214 Circuits obtained by bipolar technology854219 Integrated circuits monolitihic non-digital854230 Other monolithic integrated circuits854240 Hybrid integrated circuits854250 Electronic microassemblies 854290 Parts for electronic integrated circuits and microassemblies

INFORMATION ECONOMY REPORT 2005
CHAPTER 1. ICT INDICATORS FOR DEVELOPMENT: TRENDS AND MEASUREMENTS ISSUES 77
Audio and video equipment
851810 Microphones and stands therefor 851821 Single loudspeakers, mounted in their enclosures 851822 Multiple loudspeakers, mounted in the same enclosure 851829 Other loudspeakers, n.e.s 851830 Headphones and earphones, whether or not combined with a microphone, and sets consisting of a microphone and one or more
loudspeakers 851840 Audio-frequency electric amplifiers 851850 Electric sound amplifier sets 851890 Parts of microphones, loudspeakers, headphones, earphones, combined microphone/loudspeaker sets, audio-frequency electric
amplifiers and electric sound amplifier sets 851910 Coin- or disc-operated record-players 851921 Record-players, without loudspeaker 851929 Record-players, n.e.s. 851931 Turntables with automatic record changing mechanism 851939 Turntables, n.e.s. 851940 Transcribing machines 851992 Pocket-size cassette-players 851993 Other sound reproducing apparatus, cassette-type 851999 Sound reproducing apparatus, not incorporating a sound recording device, n.e.s. 852010 Dictating machines not capable of operating without an external source of power 852032 Other magnetic tape recorders incorporating sound reproducing apparatus, digital audio type 852033 Other magnetic tape recorders incorporating sound reproducing apparatus, cassette-type 852039 Other magnetic tape recorders incorporating sound reproducing apparatus 852090 Magnetic tape recorders and other sound recording apparatus, whether or not incorporating a sound reproducing device, n.e.s. 852110 Video recording or reproducing apparatus, whether or not incorporating a video tuner magnetic tape type 852190 Video recording or reproducing apparatus, whether or not incorporating a video tuner other type 852210 Parts and accessories suitable for use solely or principally with the apparatus of headings Nos. 85.19 to 85.21 pick-up cartridges 852290 Parts and accessories suitable for use solely or principally with the apparatus of headings Nos. 85.19 to 85.21 other 852311 Magnetic tapes, unrecorded, width <= 4 mm (1/6 in.) (2) 852312 Magnetic tapes, unrecorded, width > 4 mm (1/6 in.) but <= 6.5 mm (1/4 in.) (2) 852313 Magnetic tapes, unrecorded, width > 6.5 mm (1/4 in.) (2) 852320 Magnetic discs, unrecorded (2) 852390 Other prepared unrecorded media for sound recording or similar recording of other phenomena, other than products of
Chapter 37 852540 Still image video cameras and other video camera recorders, digital cameras 852712 Pocket-size radio cassette-players capable of operating without an external source of power 852713 Radio-broadcast receivers, capable of operating without an external source of power, combined with sound recording or
reproducing apparatus 852719 Other radio-broadcast receivers, capable of operating without an external source of power, not combined with sound recording or
reproducing apparatus 852721 Radio-broadcast receivers with sound recording or reproducing apparatus, for motor vehicles, requiring external source of power 852729 Other radio-broadcast receivers for motor vehicles, not combined with sound recording or reproducing apparatus 852731 Other radio-broadcast receivers, including apparatus capable of receiving also radio-telephony or radiotelegraphy, combined with
sound recording or reproducing apparatus 852732 Other radio-broadcast receivers, including apparatus capable of receiving also radio-telephony or radiotelegraphy, not combined
with sound recording or reproducing apparatus but combined with a clock 852739 Other radio-broadcast receivers, including apparatus capable of receiving radio-telephony or radiotelegraphy, n.e.s. 852812 Reception apparatus for television, whether or not incorporating radio-broadcast receivers or sound or video recording or
reproducing apparatus, colour

78 CHAPTER 1. ICT INDICATORS FOR DEVELOPMENT: TRENDS AND MEASUREMENT ISSUES
INFORMATION ECONOMY REPORT 2005
852813 Reception apparatus for television, whether or not incorporating radio-broadcast receivers or sound or video recording orreproducing apparatus, black and white or other monochrome
852821 Video monitors, colour 852822 Video monitors, black and white or other monochrome 852830 Video projectors
Other ICT goods
846911 Word-processing machines 847010 Electronic calculators capable of operation without an external source of electric power and pocket-size data recording,
reproducing and displaying machines with calculating functions 847021 Other electronic calculating machines incorporating a printing device 847029 Other electronic calculating machines 847040 Accounting machines 847050 Cash registers 847310 Parts and accessories (other than covers, carrying cases and the like) suitable for use solely or principally with machines of
heading No. 84.69 847321 Parts and accessories of the electronic calculating machines of subheading No. 8470.10, 8470.21 or 8470.29 847350 Parts and accessories equally suitable for use with machines of two or more of the headings Nos. 84.69 to 84.72 852691 Radio navigational aid apparatus 852692 Radio remote control apparatus 901041 Apparatus for the projection or drawing of circuit patterns on sensitised semiconductor materials – direct write-on-wafer apparatus 901042 Apparatus for the projection or drawing of circuit patterns on sensitised semiconductor materials – step and repeat aligners 901049 Apparatus for the projection or drawing of circuit patterns on sensitised semiconductor materials other 901410 Direction finding compasses 901420 Instruments and appliances for aeronautical or space navigation (other than compasses) 901480 Other navigational instruments and appliances 901490 Parts and accessories of direction finding compasses, other navigational instruments and appliances 901540 Photogrammetrical surveying instruments and appliances 901580 Other surveying instruments and appliances 901811 Electro-cardiographs 901812 Ultrasonic scanning apparatus 901813 Magnetic resonance imaging apparatus 901814 Scintigraphic apparatus 901819 Other electro-diagnostic apparatus (including apparatus for functional exploratory examination or for checking physiological
parameters) 902212 Computed tomography apparatus 902213 Other apparatus based on the use of X-rays, for dental uses 902214 Other apparatus based on the use of X-rays, for medical, surgical or veterinary uses 902219 Other apparatus based on the use of X-rays, for other uses 902410 Machines and appliances for testing the hardness, strength, compressibility, elasticity or other mechanical properties of materials,
metals 902480 Other machines and appliances for testing the hardness, strength, compressibility, elasticity or other mechanical properties of
materials 902490 Parts and accessories for machines and appliances for testing the hardness, strength, compressibility, elasticity or other
mechanical properties of materials 902620 Instruments and apparatus for measuring or checking the pressure of liquids or gases, excluding instruments and apparatus of
heading Nos. 9014, 9015, 9028 or 9032 902710 Instruments and apparatus for physical or chemical analysis, gas or smoke analysis apparatus 902730 Spectrometers, spectrophotometers and spectrographs using optical radiations (UV, visible, IR) 902740 Instruments and apparatus for measuring or checking quantities of heat, sound or light, exposure meters 902750 Other instruments and apparatus using optical radiations (UV, visible, IR)

INFORMATION ECONOMY REPORT 2005
CHAPTER 1. ICT INDICATORS FOR DEVELOPMENT: TRENDS AND MEASUREMENTS ISSUES 79
902780 Other instruments and apparatus for physical or chemical analysis 902810 Gas meters 902820 Liquid meters 902830 Electricity meters 902890 Parts for gas, liquid or electricity supply or production meters, including calibrating meters therefor 902910 Revolution counters, production counters, taximeters, mileometers, pedometers and the like 902920 Speed indicators and tachometers; stroboscopes 902990 Parts and accessories for revolution counters, production counters, taximeters, mileometers, pedometers and the like; speed
indicators and tachometers, other than those of heading No. 90.14 or 90.15; stroboscopes 903010 Instruments and apparatus for measuring or detecting ionising radiations 903020 Cathode-ray oscilloscopes and cathode-ray oscillographs 903031 Multimeters without a recording device 903039 Other instruments and apparatus for measuring or checking voltage, current, etc. without a recording device 903040 Other instruments and apparatus, specially designed for telecommunications (for example, cross-talk meters, gain measuring
instruments, distortion factor meters, psophometers) 903082 Other instruments for measuring or checking semiconductor wafers or devices 903083 Other instruments for measuring or checking semiconductor wafers or devices with a recording device 903110 Measuring or checking instruments, appliances and machines n.e.s, machines for balancing mechanical parts 903120 Measuring or checking instruments, appliances and machines n.e.s, test benches 903130 Measuring or checking instruments, appliances and machines n.e.s, profile projectors 903141 Other optical instruments and appliances, for inspecting semiconductor wafers or devices or for inspecting photomasks or reticles
used in manufacturing semiconductor devices 903180 Other measuring or checking instruments, appliances and machines, n.e.s. 903190 Parts and accessories for measuring or checking instruments, appliances and machines, n.e.s. 903210 Thermostats 903220 Manostats 903289 Other automatic regulating or controlling instruments and apparatus, n.e.s. 903290 Parts and accessories for automatic regulating or controlling instruments and apparatus
Notes1. Titles are according to the 2002 Harmonized System. Some have been changed slightly in the interests of clarity and space.2. Industry of origin not in the OECD ICT sector. 3. HS 1996 and HS 2002 codes differ.

80 CHAPTER 1. ICT INDICATORS FOR DEVELOPMENT: TRENDS AND MEASUREMENT ISSUES
INFORMATION ECONOMY REPORT 2005
Annex IV
Core list of ICT indicators
Agreed at the WSIS Thematic Meeting on Measuringthe Information Society
(Geneva, 7–9 February 2005)
Basic core
A-1 Fixed telephone lines per 100 inhabitants
A-2 Mobile cellular subscribers per 100 inhabitants
A-3 Computers per 100 inhabitants
A-4 Internet subscribers per 100 inhabitants
A-5 Broadband Internet subscribers per 100 inhabitants
A-6 International Internet bandwidth per inhabitant
A-7 Percentage of population covered by mobile cellular telephony
A-8 Internet access tariffs (20 hours per month), in US$, and as a percentage of per capita income
A-9 Mobile cellular tariffs (100 minutes of use per month), in US$, and as a percentage of per capita income
A-10 Percentage of localities with public Internet access centres (PIACs) by number of inhabitants (rural/urban)
Extended coreA-11 Radio sets per 100 inhabitantsA-12 Television sets per 100 inhabitants
Basic core
HH-1 Proportion of households with a radioHH-2 Proportion of households with a TVHH-3 Proportion of households with a fixed line telephoneHH-4 Proportion of households with a mobile cellular telephoneHH-5 Proportion of households with a computerHH-6 Proportion of individuals that used a computer (from any location) in the last 12 monthsHH-7 Proportion of households with Internet access at homeHH-8 Proportion of individuals that used the Internet (from any location) in the last 12 monthsHH-9 Location of individual use of the Internet in the last 12 months
Response categories:• At home• At work• Place of education• At another person’s home• Community Internet access facility (specific denomination depends on national practices)• Commercial Internet access facility (specific denomination depends on national practices)• Others
Core indicators on infrastructure and access
Core indicators on access and use of ICTs by households and individuals

INFORMATION ECONOMY REPORT 2005
CHAPTER 1. ICT INDICATORS FOR DEVELOPMENT: TRENDS AND MEASUREMENTS ISSUES 81
HH-10 Internet activities undertaken by individuals in the last 12 months:Response categories:• Getting information
❑ About goods or services ❑ Related to health or health services❑ From government organisations/public authorities via websites or e-mail❑ Other information or general Web browsing
• Communicating• Purchasing or ordering goods or services• Internet banking• Formal education or training activities• Dealing with government organisations/public authorities• Leisure activities
❑ Playing/downloading video or computer games❑ Downloading movies, music or software ❑ Reading/downloading electronic books, newspapers or magazines❑ Other leisure activities
Extended core
HH-11 Proportion of individuals with use of a mobile telephoneHH-12 Proportion of households with access to the Internet by type of access
• Response categories should allow an aggregation to narrowband and broadband, where broadband excludes slowerspeed technologies, such as dial-up modem, ISDN and most 2G mobile phone access. Broadband will usually have anadvertised download speed of at least 256 Kbps.
HH-13 Frequency of individual access to the Internet in the last 12 months (from any location)Response categories:• At least once a day• At least once a week but not every day• At least once a month but not every week• Less than once a month
Reference indicatorHH-R1 Proportion of households with electricity*
* Electricity is not specifically an ICT commodity, but is an important prerequisite for developing countries to use ICTs therefore it is not includedin the core list, but it is a reference indicator, just like the number of households, population, GDP etc.
Basic core
B-1 Proportion of businesses using computers
B-2 Proportion of employees using computers
B-3 Proportion of businesses using the Internet
B-4 Proportion of employees using the Internet
B-5 Proportion of businesses with a web presence
B-6 Proportion of businesses with an intranet
B-7 Proportion of businesses receiving orders over the Internet
B-8 Proportion of businesses placing orders over the Internet
Core indicators on use of ICTs by businesses

82 CHAPTER 1. ICT INDICATORS FOR DEVELOPMENT: TRENDS AND MEASUREMENT ISSUES
INFORMATION ECONOMY REPORT 2005
Extended core
B-9 Proportion of businesses using the Internet by type of access• Response categories should allow an aggregation to narrowband and broadband, where broadband excludes slower
speed technologies, such as dial-up modem, Integrated Services Digital Network (ISDN) and most second generation(2G) mobile phone access. Broadband will usually have an advertised download speed of at least 256 kbps.
B-10 Proportion of businesses with a Local Area Network (LAN)B-11 Proportion of businesses with an extranetB-12 Proportion of businesses using the Internet by type of activity
Response categories:Proportion of businesses using the Internet by type of activity• Sending and receiving email• Getting information
❑ About goods or services ❑ From government organisations/public authorities via websites or email❑ Other information searches or research activities
• Performing Internet banking or accessing other financial services• Dealing (interacting) with government organisations/public authorities• Providing customer services• Delivering products online
ICT sector and trade basic core
ICT-1 Proportion of total business sector workforce involved in the ICT sectorICT-2 Value added in the ICT sector (as a percentage of total business sector value added)ICT-3 ICT goods imports as percentage of total importsICT-4 ICT goods exports as percentage of total exports
Core indicators on the ICT sector and trade in ICT goods

INFORMATION ECONOMY REPORT 2005
CHAPTER 1. ICT INDICATORS FOR DEVELOPMENT: TRENDS AND MEASUREMENTS ISSUES 83
References
Departamento Administrativo Nacional de Estadística (DANE) (2003). Modelo de la medición de las tecnologías de la información ylas comunicaciones –TIC, Resumen ejecutivo, http://www.dane.gov.co/inf_est/tics/Diciembre2003/resumen_ ejecutivo.pdf.
European Commission (2005). eEurope 2005 Action Plan.
Eurostat (2005). Statistics in focus : Industry, trade and services - population and social conditions - science and technology, 18/2005.
Infocomm Development Authority of Singapore (IDA) (2001). Summary of findings and follow-up to industry consultation: A frame-work on building trust and confidence in electronic commerce, http://www.ida.gov.sg/idaweb/doc/download/I888/Rel_of_findg_Trust_&_Confidence_in_EC_(final).pdf.
Infocomm Development Authority of Singapore (IDA) (2002a). Survey on Broadband and Wireless Usage in Singapore 2002,Summary Report, http://www.ida.gov.sg/idaweb/doc/download/I2389/Survey_on_BB_and_wireless_usage_in_Spore_2002.pdf.
Infocomm Development Authority of Singapore (IDA) (2002b). Survey on Infocomm Literacy for 2002, Executive Summary, http://www.ida.gov.sg/idaweb/doc/download/I2533/Survey_on_InfocommLiteracy_for_2002.pdf.
Infocomm Development Authority of Singapore (IDA) (2003a). Annual Survey on Infocomm Manpower for 2003, Executive Sum-mary, http://www.ida.gov.sg/idaweb/doc/download/I3015/2003_MPExecSummaryFinalv1_1.pdf.
Infocomm Development Authority of Singapore (IDA) (2003b). Annual Survey on Infocomm Usage in Businesses for 2003, Execu-tive Summary, http://www.ida.gov.sg/idaweb/doc/download/I3018/Annual_Survey_on_Infocomm_Usage_in_Businesses_for_2003_Executive_Summary_.pdf.
Infocomm Development Authority of Singapore (IDA) (2003c). Singapore: A snapshot of the Infocomm sector, http://www.ida.gov.sg/idaweb/doc/download/I2235/Snapshot.pdf.
ITU (2001). The e-city: Singapore Internet case study, http://www.itu.int/ITU-D/ict/cs/singapore/material/Singapore.pdf.
ITU (2003). World Telecommunications Development Report.
ITU (2004). The fifth pillar: Republic of Mauritius ICT case study, http://www.itu.int/ITU-D/ict/cs/mauritius/material/CS_MUS.pdf.
Ministry of Public Administration and Information of Trinidad and Tobago (2003a). National ICT Benchmarking Study: Trinidad and Tobago versus Selected Comparator Countries, http://www.nict.gov.tt/downloads/National_ICT_Benchmarking_Study-Full_Report.pdf.
Ministry of Public Administration and Information of Trinidad and Tobago (2003b). National ICT Strategy Development: Draft E-readiness Assessment - Examining Trinidad and Tobago’s Current State of ICT Development, http://www.nict.gov.tt/downloads/National_e-Readiness_Assessment-FullReport.pdf.
National Computer Board of Mauritius (2001). ICT Usage Survey 2001: A survey on the ICT adoption of businesses in Mauritius, http://ncb.intnet.mu/ncb/downloads/Downloads/Reports%20and%20surveys/ictusagesurvey2001.pdf.
National Computer Board of Mauritius (2002). Information and Communications Technology (ICT) Outlook: ICT Indicators For Mauritius. Request for proposal for assessment (tender), http://ncb.intnet.mu/ncb/downloads/Downloads/Reports%20and%20surveys/ICT%20Outlook2002.pdf.
OECD (2004). Information Technology Outlook, 2004.
OECD (2005). Methodologies and Model Questions: Business Core ICT Use Indicators. Paper presented at the WSIS Thematic Meeting held from 7 to 9 February 2005 in Geneva.
Partnership on Measuring ICT for Development (2005a). Core ICT indicators.
Partnership on Measuring ICT for Development (2005b). Measuring ICT: the global status of ICT indicators.

84 CHAPTER 1. ICT INDICATORS FOR DEVELOPMENT: TRENDS AND MEASUREMENT ISSUES
INFORMATION ECONOMY REPORT 2005
Sridhar KS and V Sridhar (2004). Telecommunications infrastructure and economic growth: Evidence from developing countries. Working paper, National Institute of Public Finance and Policy, New Delhi.
Torero M, S Chowdhury and V Galdo (2002). Telecommunications infrastructure and economic growth: A cross-country analysis. Mimeo.
UNCTAD (2003a). Information society measurements: The case of e-business. Background paper for Expert Meeting on Measuring Electronic Commerce as an Instrument for the Development of the Digital Economy, Geneva, 8–10 September 2003.
UNCTAD (2002), E-Commerce and Development Report 2002.
UNCTAD (2003b), E-Commerce and Development Report 2003.
UNCTAD (2004), E-Commerce and Development Report 2004.
UNCTAD (2005). Stocktaking of ICT business indicators. Paper prepared for the WSIS Thematic Meeting on Measuring the Information Society, Geneva, 7–9 February 2005.
Waverman L, Meschi M and M Fuss (2005). The impact of telecoms on economic growth in developing countries, in Vodaphone Policy Paper Series, Number 2, March 2005, pp. 10–23, http://www.vodafone.com/assets/files/en/GPP%20SIM%20paper.pdf.
World Bank (2005). Financing Information and Communication Infrastructure Needs in the Developing World: Public and Private Roles, draft prepared for the WSIS Task Force on Financing ICT, February 2005.
World Trade Organization (2004). International Trade Statistics 2004.Notes

INFORMATION ECONOMY REPORT 2005
CHAPTER 1. ICT INDICATORS FOR DEVELOPMENT: TRENDS AND MEASUREMENTS ISSUES 85
11. According to the ITU definition, broadband refers to connections with a speed of at least 256 Kbps covering bothfixed and wireless access. See http://www.itu.int/ITU-D/ict/material/Top50_e-WTIM-2005-8June.doc
12. Shipment data generally include laptops. However, they do not include mobile devices.
13. There are some comparability issues related to the reporting of mobile subscribers. These arise primarily from the factthat in some countries, inactive prepaid subscribers or prepaid double subscribers are included. This may occur incountries with a relatively large number of prepaid subscribers (mainly in Asia).
14. Shyam Telecom as reported at http://news.bbc.co.uk/2/hi/technology/3256516.stm.
15. See chapter 7 of UNCTAD (2004).
16. Economist, The real digital divide, 12 March 2005. The article describes Coca-Cola vendors in a market in Zambia beingpaid by mobile phone.
17. In 2004, 23 countries were surveyed, and this resulted in limited comparable data for 10 countries. In 2005, 39 countrieswere surveyed, the survey resulting in limited comparable data for 19 countries.
18. Broadband refers to speeds equal to, or greater than, 256 Kbps. ADSL broadband will carry over 512 Kbps, while SDSLcan carry from 256 Kbps to 2 Mbps. ISDN can carry up to 128 Kbps (two high-speed lines capable of running at 64Kbps each), which can be sufficient for most home users and small enterprises. For comparison, a standard analogmodem's speed is 56 Kbps.
19. For a definition of e-commerce, see OECD (2004).
10. This information is available in the website of the US Bureau of Census. See http://www.census.gov/eos/www/ebusiness614.htm.
11. This information is available in the website of Statistics Canada. See http://www.statcan.ca/Daily/English/050420/d050420b.htm.
12. Data available only for Denmark, Germany, Greece, Spain, Italy, Luxembourg, Portugal, Finland, the United Kingdomand Norway as at 16 June 2005. See http://epp.eurostat.cec.eu.int/.
13. Singapore and Trinidad and Tobago data are from 2003. Colombia data are from 2001.
14. Full electronic case handling: public service dealt with entirely via the website, including decision and delivery.
15. An intranet is a network using the same protocol as the Internet and allowing communication within an organization. Itis typically set up behind a firewall to control access.
16. An extranet is a private, secure extension of the intranet running on Internet protocol that allows external users to accesssome parts of an organization's intranet.
17. A draft classification of trade in ICT services is currently under discussion in the OECD Working Party on Indicatorsfor the Information Society (WPIIS). For further information, see OECD (2004).
18. In 2003, exports of ICT goods amounted to $1126 billion, while exports of agriculture ($674 billion), textiles ($169 bil-lion) and clothing ($226 billion) amounted to $1069 billion (WTO, 2004).
19. It is worth noting that the above figures are based on current prices and, as ICT goods have experienced declining prices,do not fully reflect the changes in terms-of-trade volume.
20. Both Malaysia and Singapore experienced in 2001 a fall in their level of ICT goods exports and, while during 2002 and2003 exports of ICT goods grew again, they have not reached their 2000 levels.
21. A detailed description of these indicators and their calculation is provided in chapter nine of the E-Commerce and Devel-opment Report 2002 (UNCTAD, 2002). The revealed comparative advantage (RCA) index, defined as a country’s share ofworld exports of ICT goods divided by its share of total world trade, measures the relative export performance of acountry in the ICT manufacturing industry. Countries with RCA indices above one and positive RCA growth rates arethose most competitive in exporting ICT goods. On the other hand, the study of the world market shares in ICT goodsof individual countries over time highlights which are the countries that are gaining ground in the international ICT mar-

86 CHAPTER 1. ICT INDICATORS FOR DEVELOPMENT: TRENDS AND MEASUREMENT ISSUES
INFORMATION ECONOMY REPORT 2005
ket. As in the case of the RCA index, a WMS index above one and a positive WMS growth rate shows that a country isexpanding its market share in the global ICT goods market.
22. Data cover only the 15 LDCs that reported their exports of ICT goods for 2003.
23. Data cover only the 18 LDCs that reported their imports of ICT goods for 2003.
24. A detailed list of the ICT goods covered under each category is provided in annex III.
25. A number of regional meetings on ICT statistics were held in the second part of 2004 for Western Asia (Beirut,October 2004), Africa (Gaborone, October 2004), and Latin America and the Caribbean (Santiago, November 2004).There was also an ICT statistics meeting in Wellington, New Zealand (December 2004) for some of the Asia-Pacificcountries. Each of these meetings resulted in a regional core list of ICT indicators. These lists, together with the resultsof the stocktaking inventory and the experience of the Partners working with NSOs in both developed and developingcountries, were used as an input into the finalization of an initial core list of ICT indicators.
26. The model surveys can be downloaded from the OECD website on “Measuring the Information Economy” at http://www.oecd.org/document/22/0,2340,en_2649_34449_34508886_1_1_1_1,00.html.
27. Within the framework of the Partnership on "Measuring ICT for Development", a global stocktaking exercise wascarried out to measure the availability of official information society statistics. In July 2004, a metadata questionnaireon ICT statistics was sent by ECA, ECLAC, ESCAP, ESCWA and UNCTAD/ECE to NSOs of all developingcountries and a number of Central and Eastern European countries. The questionnaire aimed to provide an overviewof the types of surveys that NSOs have in place to collect data and statistics on ICTs and the actual indicators collected.It consisted of four sections covering general aspects of ICT statistics and surveys, household statistics, businessstatistics and other areas of ICT statistics. In the business statistics section, NSOs were asked to respond to questionsabout which indicators they already collect, which they are planning to collect in the next year or three years and thosewhich they do not plan to collect at this stage. They were also asked to indicate the type of collections used to gatherthis information and the level of demand for ICT business indicators in their countries.
28. For a complete presentation of the results, see UNCTAD (2005).
29. While the stocktaking survey was carried out only in non-OECD countries, OECD members, in a separate exercise, wereasked to provide information on the list of 20 household and business indicators.
30. For further information on WPIIS, see http://www.oecd.org/document/22/0,2340,en_2649_37441_34508886_1_1_1_37441,00.html.
31. See http://www.fastforward.tt, http://vision2020.info.tt/about/, and http://nict.gov.tt/.
32. The survey also fed into an e-Readiness Assessment (Ministry of Public Administration and Informatio of Trinidad andTobago, 2003b) that was an integral part of Trinidad & Tobago’s National ICT Strategy development.
33. 2003 National Survey of E-Commerce Usage and Awareness among Businesses.
34. The corresponding International Standard Industrial Classification (ISIC) tabulation category is H (Hotels and Restau-rants).
35. See http://nict.gov.tt/plan/documents/Chapter_Four.pdf.
36. Its 1998 E-Commerce Master Plan had a target of 50 per cent of businesses conducting e-commerce by the year 2003(ITU, 2001). IDA reported achieving 42 per cent (IDA, 2003b).
37. Singapore has a decentralized statistical system, and official statistics are collected and compiled by the DOS as well asby other research and statistical units, government departments and statutory boards.
38. The “Collaborative High-Tech Manufacturing Plan” was launched in 2004. See http://www.ida.gov.sg/idaweb/ebusiness/infopage.jsp?infopagecategory=&infopageid=I2852&versionid=1.
39. A consultation sought feedback from the industry and public as to the level of trust in e-commerce in order to raise thelevel of such activities. See IDA (2001).

INFORMATION ECONOMY REPORT 2005
CHAPTER 1. ICT INDICATORS FOR DEVELOPMENT: TRENDS AND MEASUREMENTS ISSUES 87
40. Singapore also periodically collects more in-depth information on ICT “manpower”, i.e. employees that work withICTs, by occupational groups and by sector (ICT-related or end-user), and ICT literacy or savvy among the workforce.See http://www.ida.gov.sg/idaweb/manpower/ and IDA (2002b, 2003a).
41. See http://www.e-cybercity.mu/bpml.asp. See also the ITU case study on Mauritius (ITU, 2004).
42. “L’Etat mènera le progrès des Tics”, article in the Express newspaper of Mauritius, 5 April 2005, http://www.lexpress.mu/display_search_result.php?news_id=39181.
43. The tender background document includes a detailed description of the comprehensive set of indicators to be collectedand their rationale.
44. See http://www.agenda.gov.co/.
45. http://www.agenda.gov.co/documents/files/ComparativoIndices.PDF.
46. Presentation by Colombia’s Minister of Communications, April 2005, available at http://www.agenda.gov.co/.