Embed Size (px)
Citation preview

Master’s thesis in Economics
30 Credits
Spring 2018
Supervisor: Joseph Vecci
Information Dissemination and Active Citizenship:
Experimental Evidence from Uganda
Petter Sundqvist

Abstract
Information constraints are seen as serious impediments to the ability of citizens to hold
politicians accountable. In this thesis, I study an intervention in Uganda where scorecards
describing the performance of local politicians are disseminated to the constituencies of
randomly selected local politicians. I test the effects of the scorecard dissemination on
citizens’ participation and demand for improved public services. I find that the information
has no effect on the number of citizens reporting service delivery problems and that the effect
is negative on the number citizens attending community meetings and speaking at community
meetings called by local governments. By studying a unique set of participation outcomes, the
thesis contributes to the scarce literature investigating the link between information about
politicians and citizen participation in forms other than voting.
Keywords: Social Accountability, Participation, Information, Public Service Delivery,
Difference-in-Difference, Propensity Score Matching

Acknowledgements
I would like to thank the Swedish International Development Cooperation Agency (Sida) for,
through financial support, enabling me to travel to Uganda and conduct research for this
thesis. I am grateful to the ACODE team for assisting me in my research. My special thanks
to (in no particular order) Walter Akena, Naomi Asimo, Arthur Bainomugisha, Ronald
Ogwhan, Chealcious Scarlet, Eugene Ssemakula and Lillian Tamale. I would also like to
thank Johan Bergqvist at the Swedish Embassy in Kampala for assisting me with
arrangements and providing valuable insights into the Ugandan context. Finally, I would like
to thank my supervisor, Joseph Vecci, for his encouragement and many valuable comments.

Table of Contents
1. Introduction ............................................................................................................................ 1
2. Context and Intervention ........................................................................................................ 4
2.1 The Ugandan Context ....................................................................................................... 4
2.2 Intervention and treatment ................................................................................................ 7
3. Theoretical framework and empirical literature ................................................................... 11
3.1 Empirical literature ......................................................................................................... 11
3.2 Theoretical framework ................................................................................................... 14
3.2.1 Accountability .......................................................................................................... 14
3.2.2 Conditions under which information affects citizen behavior ................................. 16
3.3 Hypotheses ...................................................................................................................... 18
4. Data ...................................................................................................................................... 21
4.1 Measurements of active citizenship ................................................................................ 21
4.2 Control variables ............................................................................................................. 24
5. Research design and empirical strategy .............................................................................. 25
5.1 Difference-in-difference ................................................................................................. 27
5.2 Propensity Score Matching ............................................................................................. 29
5.3 Discussion of the main assumptions of DID and PSM in this context ........................... 31
6. Results .................................................................................................................................. 31
6.1 Difference-in-Difference ................................................................................................ 32
6.2 Propensity Score Matching ............................................................................................. 34
6.3 Heterogeneous treatment effects..................................................................................... 35
7. Conclusion ............................................................................................................................ 37
References ................................................................................................................................ 40
Appendix A. Variable descriptions .......................................................................................... 46
A1. Control variables ............................................................................................................ 46
A2. Variables used for heterogeneous treatment effect assessment .................................... 47
Appendix B. Tests for propensity score matching ................................................................... 48

List of figures and tables
Figures
Figure 1: Structure of scorecard ................................................................................................. 9
Figure 2. Map of Uganda indicating ACODE districts and districts in the SLRC dataset ...... 26
Figure B1 Propensity scores before and after matching using NN5 ........................................ 48
Figure B2. Propensity scores before and after matching using NN without replacement ....... 49
Figure B3. Propensity scores before and after matching using NN with a caliper of 0.003 .... 49
Tables
Table 1. Summary of outcome variables .................................................................................. 24
Table 2. Manual calculation of DID estimate .......................................................................... 27
Table 3. Difference-in-Difference with placebo outcomes ...................................................... 29
Table 4. Difference-in-Difference results using general participation outcomes .................... 33
Table 5. Difference-in-Difference results using local government participation outcomes .... 34
Table 6. Propensity score matching results .............................................................................. 35
Table 7. Heterogeneous treatment effects of citizen attributes ................................................ 37
Table B1. T-tests of differences in means for the different matching techniques.................... 50

1
1. Introduction
The poor and vulnerable often do not get much attention from politicians, partly because they
are less informed and generally less inclined to participate politically than citizens higher up
on the socioeconomic ladder (Besley and Burgess, 2002). This is especially problematic since
this group is the most dependent on public services and hence has the most to gain from
holding politicians and service providers accountable (Malena et al., 2004).
One of the main identified obstacles to the ability of citizens to hold politicians accountable is
information asymmetries (cf. Besley and Burgess, 2002; Devarajan et al., 2013; Paul, 1992).
When citizens lack information, they can with difficulty evaluate the quality and efficiency of
public service delivery and their ability to hold governments accountable is reduced (Keefer
and Khemani, 2005). Correcting information asymmetries through information campaigns has
been found to increase voter turnout (Banerjee et al., 2011; Strömberg, 2004), improve public
service delivery (Bjorkman and Svensson, 2009; Casey et al., 2011), reduce leakages of
public funds (Reinikka and Svensson, 2005) and increase government responsiveness (Besley
and Burgess, 2002). However, as numerous scholars have shown, providing citizens with
information does not always result in (positive) actions being taken by citizens (Banerjee et
al., 2010; Chong et al., 2010; Lieberman et al., 2014), causing uncertainty about the
widespread assumption that information will leverage accountability through increased
pressure from citizens (Fox, 2015).
In this thesis, I test the effects of providing citizens with information about the performance of
their locally elected politicians (district councilors) and ask whether such information induces
more citizens to actively participate and demand better public services. To address this
question, I exploit a unique randomized field experiment in Uganda creating geographical
variations in citizens’ exposure to scorecards describing how well district councilors perform
their legally defined duties. The scorecard dissemination was designed to make the scorecards
common knowledge within the constituencies of randomly selected district councilors,
thereby creating an opportunity to make comparisons between individuals in constituencies
where the scorecards were disseminated and individuals in constituencies where they were
not.

2
Drawing on individual level data from the Secure Livelihoods Research Consortium (SLRC)
Panel Survey, I create six participation outcomes. The first three measurements concern
whether an individual has attended any community meeting in which a public service was
discussed, spoken at such a community meeting and reported a service delivery problem to
any actor. The last three measurements are alternative versions of the first three and only
concern actions more directly connected to local governments: attending a community
meeting and speaking at a community meeting called by local government and reporting a
service delivery problem to local government. I refer to the first three measurements as
general participation outcomes and the last three as local government participation outcomes.
The foundation for the experiment (scorecard dissemination) was laid out in 2009 when a
Ugandan civil society organization (CSO), ACODE, initiated a program named the Local
Government Councils Scorecard Initiative (LGCSCI) and began constructing annual
scorecards describing the performance of local politicians in a few selected districts. The
experiment was conducted in 20 districts where ACODE implements LGCSCI, meaning that
individuals in these districts were randomly assigned to either a treatment group or a control
group. Since the 20 districts partly were selected to achieve national representativeness, only
4 districts found in the SLRC dataset (covering northern Uganda) were subject to the
experiment. Hence, exploiting the full sample means that treatment is unlikely to be random.
Assessing the effects of the scorecard dissemination therefore necessitates resorting to
empirical methods accounting for this potential non-randomness. The main method used in
this thesis is difference-in-difference (DID), which has the advantage that it accounts for
unobservable fixed effects. I employ Propensity Score Matching (PSM) as a robustness check,
which I argue is less credible in this context since data limitations could make the fulfillment
of the main identifying assumption (conditional independence assumption) unlikely. In
addition to assessing the impact as a whole, the fact that whole geographical areas are
considered treated allows me to test for heterogeneous treatment effects on individuals with
different characteristics and attitudes.
The main finding, using the DID method, is that the scorecard dissemination has negative
effects on the number of people attending community meetings and speaking at community
meetings, but only for meetings called by local governments. The results using PSM,
however, partly contradicts these findings. While both methods fail to find any treatment
effects for the more general forms of participation, the PSM results show that, among the
local government participation outcomes, reporting a service delivery problem is the only one

3
on which the treatment effect is negative and significant. In addition, I find evidence of some
heterogeneity in treatment impact, but only for the local government participation outcomes.
Individuals who believe that local governments are responsive to their opinions are more
likely to attend community meetings and speak at community meetings. In contrast,
individuals that are dissatisfied with government priorities are more likely to participate in all
three forms.
The contributions of the thesis are threefold. First, there is an ongoing debate on whether
information by itself is sufficient or if it needs to be accompanied by other interventions, such
as the creation of channels through which citizens can use their voice, to instigate behavioral
changes and strengthen accountability. Few papers have investigated campaigns that solely
rely on information dissemination. Banerjee et al (2010) find that providing information alone
is not sufficient while Barr et al. (2012) shows positive effects of disseminating scorecards but
that the effects are larger if the construction of the scorecard is a participatory process where
the community is involved. Both these papers study the education sector. Bruns et al. (2011)
point out that information in certain settings needs to be accompanied by other interventions
in order to escape the status quo of citizen disengagement in public services, while it in other
settings might be sufficient to solely provide citizens with information to increase their
participation rates. They go on to conclude that, if effective, solely relying on information is a
cost-efficient approach to strengthen accountability and that research into that area is likely to
be valuable. The intervention studied in this thesis was unaccompanied by civic education and
did not provide any information on how citizens could take action. The findings of the thesis
hence lend support to the literature arguing that information by itself is not enough.
Second, there are very few papers that have investigated the effects of informing citizens
about politicians’ performance on outcomes other than related to voting (e.g. voter turnout,
voting for the incumbent). Within the literature focusing on developing countries, I only
managed to find two such papers. Krishna (2006) investigates the relationship between
citizens’ access to information and an index of participation which includes campaigning,
attending public meetings and voting. Gottlieb (2016) looks at the effect of information, in the
form of a civic education course, on citizens’ challenges to politicians in town hall meeting.
Both these papers differ from my thesis in the form of information considered and the
participation outcomes. Non-institutionalized forms of participation, such as participating in
meetings, are by researchers increasingly seen as an important link through which formal
political outcomes can be influenced (Coffé and Bolzendahl, 2010). Contributions to the

4
scarce literature investigating whether information can have an effect on such forms of
participation could hence be of value.
Third, the literature examining the effects of information related to public services on citizen
engagement has largely focused on one single public service, such as education (Banerjee et
al., 2010; Bruns et al., 2011; Lieberman et al., 2014; Reinikka and Svensson, 2005), health
(Bjorkman and Svensson, 2009) and roads (Olken, 2007), overlooking the important role of
governments to monitor service delivery and ensure the sufficient quality of services. To the
best of my knowledge, no previous research has investigated the effect of information that can
be tied to politicians’ performance in ensuring the quality of public services on citizens’
efforts to hold politicians accountable for their performance in this respect. The field
experiment studied in this thesis, as well as the Ugandan context, provide a good opportunity
to investigate this effect for three reasons: local governments in Uganda are responsible for
the delivery of most major services (Mitchinson, 2003), it is the legally defined duty of local
politicians to monitor these services and monitoring service delivery makes up 45% of the
total scorecard score.
The thesis proceeds as follows. Section 2 gives an overview of the Ugandan context and
describes the intervention studied. Section 3 provides the theoretical framework of the thesis,
reviews the previous literature and formulates the hypotheses. Section 4 describes the data
used and the constructed measurements of participation. Section 5 describes the research
design and the empirical strategy. Section 6 reports the results and section 7 concludes.
2. Context and Intervention
2.1 The Ugandan Context
When the National Resistance Movement (NRM) led by Yoweri Museveni came to power in
1986 after 5 years of civil war, it was by many seen as a welcome hiatus from chaos (Tripp,
2010). At that time, the economy was in ruins, public service delivery was insufficient and
corruption was widespread (Meyers, 2014). Under the NRM, Uganda has seen a period of
relative stability with increased market liberalization through the removal of price controls,
high economic growth and reduced poverty, which has contributed to Uganda being seen as a
donor-darling (Francis and James, 2003).

5
Brief history of local government in Uganda
In 1992, NRM initiated a far-reaching decentralization reform which was adopted into
legislation in the 1995 constitution and the 1997 Local Government Act (LGA). With these
acts, local councils were given extensive responsibilities and powers in areas such as revenue
collection, legislation, planning and budgeting and service delivery (Green, 2010). At that
time, NRM saw local councils as an important component in its strategy to build democracy
from the grassroots and increase citizen participation (Tripp, 2010). Recently, however,
scholars have argued that the decentralization process has been captured by NRM to reaffirm
control. Key positions at district level are appointed by the central government, often based on
loyalty rather than merit, serving as an extended arm of government (Lewis, 2014). More
opportunities to appoint NRM loyalist to key positions within local governments have also
arisen with the rapid proliferation of districts (112 today compared to 33 in 1990) enabling the
government to expand its patronage networks (Booth et al., 2014; Green, 2010).
Local government structure
The local government structure in Uganda consists of 5 tiers: district (LC5), county (LC4),
sub-county (LC3), parish (LC2) and village (LC1). Districts and sub-counties are corporate
bodies, similarly structured with a local parliament of elected representatives. The remaining
levels are administrative units with no focal role in delivering public services (Steiner, 2006).
The district council (DC), which is the governing body of interest to this thesis, consists of
councilors representing each sub-county within a district and is headed by a chairman,
equivalent to a governor in many countries (Saito, 2003). The councilors and the chairman are
elected at the local government elections by universal adult suffrage. The DC also consists of
administrative staff appointed by the central government.
In addition to directly elected (regular) councilors, a position of ―woman councilor‖ has been
established in order to achieve the statuary requirement that a third of the district councilors
should be female. Woman councilors represent one to three sub-counties, depending on
population size, and are the units to which the scorecard dissemination was randomized
(Grossman and Michelitch, 2018).
Local governments are responsible for a wide range of public services in Uganda, such as
health services except for referral hospitals; feeder roads; water, education, except tertiary;
land administration; and extension services (Awortwi, 2011). In line with the principle of

6
subsidiary, the idea is that the lowest tier of government capable of delivering a service
should be charged with doing so (Steiner, 2008).
Media and Civil Society
The media and civil society has enjoyed relative freedom in Uganda under the NRM regime
compared to previous regimes and other countries in the region (Booth et al., 2014). More
recently, however, the number of newspapers has declined drastically and the NRM is today
far less accepting of direct criticism than upon coming to power, using threats of revoking
media licenses and taking legal measures towards individual journalists as means to silence
the critical voices (Booth et al., 2014). Similarly, NGOs focusing on issues interfering with
the government’s agenda face the threat of de-registration and closure. NGOs focusing on
development issues, however, have been welcomed by the government, reflecting its reliance
on NGOs to improve social development and service delivery, which in turn indirectly
strengthens the legitimacy of the government. NGOs and media addressing issues at the lower
tiers of government also tend to be less controversial and are allowed to operate more freely
(Sjögren, 2013).
The main media consumed in Uganda is local radio which plays an important role in
strengthening local accountability. Local radio stations inform citizens about local issues and
regularly hold phone-in programs where citizens can call to ask questions and issue
complaints to invited local politicians (Devas and Grant, 2003). In the 2014 census 55% of
respondents named radio as their primary source of information, which largely surpassed
other sources such as word of mouth (20%), Internet (7,3%), TV (7.2%) and print media
(2.1%) (UBOS, 2016). Unlike newspapers and TV, which are almost exclusively in English
and are unaffordable by many, radio stations have a large potential to reach the rural poor
(Chibita and Fourie, 2007)
Civic Participation
While the local government system was designed to promote citizens’ participation in local
development and strengthen the accountability relationship between citizens and politicians,
these objectives have only been achieved to a limited extent (Kiyaga-Nsubuga and Olum,
2009)
The low information environment has been a serious impediment to citizens’ participation in
Uganda. While citizens are largely dissatisfied with the state of service delivery and
corruption in the public sector, they are often unaware of how to confront these issues

7
(Deininger and Mpuga, 2005). Citizens also tend to be unaware of who is responsible and the
source of financing for local projects that benefit the communities. This creates space for local
politicians to take credit for these projects and generate a perception that it is them and not
agencies, NGOs or local governments, that bring improved public services through their
support and lobbying (Steiner, 2008).
Low levels of development in Uganda serve as additional constraints to citizen participation.
Poor citizens might be reluctant to participate in community meetings due to the high
opportunity costs in terms of forgone income, the incomprehensibility of issues discussed and
the little resources at stake (Steiner, 2007). The possibility for citizens to affect allocations of
funds at the local level is limited. First, a high proportion, if not all, of locally generated
revenues go to councilor salaries. Second, the government grants, which constitute the main
share of the local budgets, are often subject to conditions which limits the discretion of local
governments (Francis and James, 2003). It may hence seem futile for citizens to attempt to
influence local budget allocations.
Cultural factors may equally prevent citizens from participating. Among Ugandan citizens
there is an expectation that it is the elite groups and not the poor that should participate in
local development (Steiner, 2008). Public services are also often seen as personalized and
believed to be used as patronage to citizens in the same political camp or network of
politicians (Titeca, 2006). Citizens identifying with other groups may hence be discouraged
from voicing their concerns over public services. The role of the state in delivering services
might also not be fully understood by citizens due to Uganda’s history of poor or nonexistent
public services. Saito (2003) notes that health problems are widely believed to be a family
problem rather than a community issue in Uganda, which may prevent people from
collectively seeking to improve health services.
2.2 Intervention and treatment
Background
The Local Government Councils Scorecard Initiative (LGCSCI) is implemented by a
Ugandan CSO, ACODE, in partnership with Uganda Local Governments Association
(ULGA). The initiative is financed by a broad based coalition of donors through the
8
Democratic Governance Facility (DGF) program. Within the framework of LGCSCI,
ACODE has since 2009 constructed annual scorecards describing how well local leaders have
performed the responsibilities vested in them under the Local Government Act (LGA). The
scorecard implementation districts were selected by ACODE to ensure a mix of geographical
areas, old and new districts, rich and poor districts and influential and marginalized districts
(Bainomugisha et al., 2017).
The scorecard
According to the LGA of 1997, the elected representatives of the district council (DC) have
four legally defined duties: participating with lower tier governments (e.g. attending meetings,
forwarding issues to DC), contact with the electorate (e.g. meeting with electorate, setting up
public office), monitoring public service delivery (e.g. visits to service delivery units,
preparing reports) and legislative duties (e.g. participating in committees, moving motions)1.
Each legally defined area is assessed by various parameters given weights so that the total
score adds up to 100. The score of each indicator is decided by a threshold approach, where
the evaluated politician receives full points if the threshold is achieved (e.g. prepare at least
two monitoring reports). Figure 1 provides an overview of the scorecard structure.
To assess the level of fulfillment of the coucilors’ duties, qualitative data is collected through,
inter alia, documentary reviews, interviews, personal diaries and field visits (observations and
photos). When collected, the data is cleaned and reviewed centrally at ACODE to ensure
accuracy and completeness and entered into Atlas.ti and EpiData for analysis (Grossman and
Michelitch, 2018).
1 The examples inside parentheses are parameters on which ACODE assess the fulfillment of the legally defined
duties, as described in ACODE’s ―Researcher’s manual‖ (which is not a public document).

9
Figure 1: Structure of scorecard
Source: Grossman and Michelitch (2018)
Intense Dissemination (treatment)
The scorecards have been diffused among citizens at two occasions between the 2011 and
2016 elections through sets of community meetings on parish level (354 meetings with a total
attendance of 12,939 in 2013 and 339 meetings with a total attendance of 14,520 in 2014).
This is by ACODE referred to as the Intense Dissemination (ID) treatment. The ID treatment
was put in place in collaboration with a team of external researchers in order to create an
experimental setting for quantitatively evaluating the program. The description of the
treatment in this subsection is based on the paper by Grossman and Michelitch (2018) who
were a part of this team.
The ID treatment consists of several components, all aiming to make the scorecards common
knowledge in the implementation sub-counties. As a first step to inform citizens about the
scorecards, ACODE sent out invites to community meetings, targeting lower-tier government
officials (at village and sub-county level), religious leaders, public service providers (e.g.
teachers and health workers) and leaders within civil society. The meetings were open to the
public and district councilors were invited to get a chance to comment on their scores as well
10
as on the initiative as a whole. In these meetings, on average 40 community members
participated. Attendees were there educated on the scorecard initiative, its goals, the legally
stated duties of councilors and the legally defined public service delivery standards.
Following the meetings, attendees were tasked with disseminating the information to the
communities. For this purpose, they were handed fliers, posters and calendars with key
information of the scorecard to distribute and hang up in prominent places. In the
disseminated scorecards, the councilors’ scores were benchmarked against those of other
politicians in the LGCSCI implementation districts. In addition, the attendees received
periodic text-messages reinforcing the key information delivered at the meeting and
encouraging them to sign up others for receiving text messages with the scores of their
councilors.
Facilitators employed by ACODE were tasked with delivering the information at the
dissemination meetings. To track their compliance, in terms of delivering their specifically
assigned meeting content, the research team employed enumerators to all meetings. A short
poll was also conducted on random attendees to estimate the comprehension and retention of
the information. Among the sampled attendees (n=1766), 56% recalled the councilors’ score,
98% could name at least one public service delivery standard and each individual recalled on
average 2.75 councilor duties. The attendees’ compliance regarding the information
dissemination tasks was however not investigated, which is why we cannot be entirely sure of
the extent to which the scorecards actually became common knowledge in the communities,
i.e., to what extent the individuals in the treatment areas actually were treated.
Evaluated positions
The district council positions evaluated in the scorecards are the regular councilors (directly
elected representatives of each sub-county within a district) and woman councilors (elected by
the women, representing 1-3 sub-counties). While there are also councilors representing the
youth and people with disabilities, these positions were not included in the scorecard since
they have a whole district as a constituency (Grossman and Michelitch, 2018). That woman
councilors are the units of randomization should make treatment spillovers implausible since
the regular councilors in the constituencies of the treated woman councilors also were treated.
The untreated sub-counties hence received no information on any of their elected councilors
and should be unlikely to react to information about councilors from other sub-counties,
which it is also unlikely that they received.

11
Weak Dissemination
In the between-elections period, 2011-2015, scorecards were annually presented to
incumbents, district officials and party representatives in dissemination events held at the
district headquarters where also local stakeholders, such as journalists, civil society
organizations and traditional leaders, were invited. Following Grossman and Michelitch
(2018) I refer to this as ―weak dissemination‖ (WD), since information about the scorecards
only might trickle down to ―ordinary‖ citizens who did not participate in these events through,
for instance, word of mouth or media reporting. Since the WD occurred at district level in all
ACODE districts, all sub-counties assigned to the ID treatment were also subject to the WD.
SMS treatment
Another treatment implemented parallel to the ID was a SMS platform where citizens, for free
or for a small cost (depending on the operator), could send text messages directly to their
district councilors informing them about issues related to public services. Politicians were
informed about and trained to use the SMS platform at community meetings while the public
received information through radio adverts. Similarly to the ID treatment, the SMS treatment
was randomly assigned to sub-counties within the ACODE districts (ibid. 2018). This means
that sub-counties within ACODE district either received the ID treatment, the SMS treatment
or both.
3. Theoretical framework and empirical literature
While the relationship between information and forms of participation other than voting is
under-theorized, there exists a large pool of empirical literature investigating this relationship
(Fox, 2015; Gaventa and McGee, 2013). In this section, I first review the previous literature
and discuss how it relates to the thesis. I then provide a theoretical framework of concepts
relevant to understand the intervention studied and the mechanisms linking information to
behavioral changes among citizens. Finally, I formulate testable hypotheses.
3.1 Empirical literature
This thesis aims to study the premise that information will leverage accountability through
increased pressure from citizens. That is also the central premise of the program studied,
LGCSCI (Bainomugisha et al., 2017). If citizens do not act as a result of the information, the

12
accountability relationship between citizens and politicians will not be strengthened. It is thus
useful to look to some of the empirical work examining the information-accountability link,
what lessons can be drawn from previous research and how it relates to this thesis.
One of the most influential studies demonstrating the potential for information to strengthen
accountability is Björkman and Svensson’s (2009) field experiment in Uganda. Studying a
community scorecard initiative targeting the health sector the authors find that treated
communities saw substantial improvements in child mortality, immunization rates, service
utilization, waiting times and absenteeism. This effect was achieved not through increased
health sector spending but through disseminating information about the communities’
collective views of the performance in the different components of health services.
Like Björkman and Svensson, many studies that investigate the effects of information
overlook the behavioral channels and focus directly on public service delivery outcomes.
Besley and Burgess (2002) find that areas where media access is high see greater government
responsiveness to calamities and drops in food production. Reinikka and Svensson (2005)
examine a newspaper campaign informing citizens about officials’ handling of public grant,
finding that areas with higher newspaper penetration saw both higher enrollment rates and test
scores. In both these studies it remains unclear whether the improved outcomes were the
result of increased pressure from citizens or if it was the awareness of government officials
and service providers that their actions were being monitored.
The literature examining behavioral responses to information is less optimistic, which
indicates that bottom-up pressure might not have been the main factor leading to the improved
outcomes in the aforementioned papers. The two areas in which behavioral responses to
political information have been most widely studied are perhaps education and voting.
Within the field of education, scholars have investigated the potential of information to trigger
actions to improve schooling among students, teachers and parents. The outcomes
investigated include teacher and student absenteeism (Barr et al., 2012); literacy and private
investments into children’s education (Keefer and Khemani, 2011); parental involvement and
school performance (Banerjee et al., 2010); student test scores and enrollment (Andrabi et al.,
2017); and a range of public and private actions taken by parents (Lieberman et al., 2014).
Among these papers, Andrabi et al. (2017) is the sole paper to find unambiguosly positive
effects of information.
13
A large part of the information-voting literature has studied how information affects
preferences for candidates, such as left-wing or right-wing and incumbent or challenger. The
most relevant outcome for this thesis is however voter turnout since it is a question of
participating or not participating, as is attending community meetings and reporting problems.
In a quasi-experiment in Benin, Fujiwara and Wantchekon (2013) find that groups that in
town hall meetings discussed politicians’ policy platforms of broad-based public provision
saw no difference in voting turnout relative to groups receiving standard clientelist campaign
messages. In another experiment, closely related to the one in this thesis, citizens in Indian
slums received report cards on the performance, wealth, education and criminal record of the
incumbent and the two major challengers in a jurisdiction prior to an election. The findings
showed that voter turnout was 3.5% higher in slums that received the information compared
to slums receiving no such information (Banerjee et al., 2011).
Very few papers have studied the effects of information on non-institutionalized forms of
public participation. This is a surprise considering the great magnitude of donor support to
programs focused on mitigating informational constraints believed to hamper citizens’
participation in developing countries (Lieberman et al., 2014). Within the scarce literature
studying effects of information on public participation outside of voting and not directed
towards improving a specific public service, Krishna (2006) creates an index of individuals’
participation, which includes participating in meetings, campaigning and voting, based on
survey answers. He finds that individuals that have greater access to information (measured as
the number of information sources regularly accessed by a respondent, such as newspapers,
radio, neighbors and leaders) see higher levels of participation. In another paper, Gottlieb
(2016) finds that civic education meetings providing citizens with information on
performance standards of local governments led to more citizen challenges of politicians in
town hall meetings.
Out of the literature discussed so far, these two papers are perhaps of the greatest relevance
for this thesis, but differ nevertheless. The Krishna paper does not look at any particular
information content but rather general access to information. The participation outcomes are
also general and not tied to a specific issue, such as service provision. This is also true for the
paper by Gottlieb, which only looks at general challenges to local leaders. She also limits her
investigation subjects to only including meeting participants and do not ask whether the
information had any impact on meeting attendance. This thesis, in contrast, looks at
participation, in the form of attending and speaking at meeting and reporting problems,

14
directly tied to public service delivery issues and asks whether such participation is triggered
by information specific to the performance of locally elected leaders.
There are many explanations to why information about politicians might not have the desired
effect of stimulating positive action. It might be that citizens are indifferent to the
performance of politicians and are instead mainly influenced by ethnic politics or clientelistic
arrangements (Humphreys and Weinstein, 2012). Increased transparency could also lead to
corruption or shirking being hidden in ways that citizens cannot detect, reducing or offsetting
the positive impact of information (Olken, 2009). Scholars studying the effects of corruption
information has found that the information, if negative, can lead to adverse behavioral
changes, such as staying away from the voting booth (Chong et al., 2010) or engage in corrupt
behavior (Corbacho et al., 2016). Similarly, better informed citizens have been shown to be
more reluctant to participate in authoritarian settings since it may seem futile or serve to
legitimize the regime (Croke et al., 2016).
In summary, by looking at some of the areas in which behavioral responses to information
have most widely been studied, this section has shown that the effects of providing citizens
with information are uncertain and can go in either direction depending on the type of
information and the outcome considered. While I have failed to find any literature examining
the specific outcomes used in this thesis, there are nevertheless lessons to be drawn from the
literature. Authors have emphasized the cost for citizens to use their voice as an important
determinant of participation (Banerjee et al., 2011; Krishna, 2006; Paul, 1992). This could be
a potential explanation to why the voter turnout-literature appears to be more optimistic than
the literature on education. The effort associated with outcomes such as higher test scores or
parental involvement in children’s learning and the school system should be higher than
casting a vote on a single occasion. Similarly attending meetings is more time-consuming
than voting and the opportunity costs of participating can be high, especially for poor people.
However, as we shall see, the cost associated with participation is only one of many possible
explanations to why an information campaign succeeds or not.
3.2 Theoretical framework
3.2.1 Accountability
To strengthen the accountability relationship between citizens and local politicians is the main
aim of the intervention studied. This is because accountability widely is seen as a pivotal

15
component in good governance as well as in effective delivery of public services (Besley and
Ghatak, 2003). To understand what accountability means, we can imagine a scenario where
there are two actors: A is the locally elected politicians and B is the citizens. According to
Fearon (1999), there are two conditions that need to be met for accountability to be in place.
First, A is required to act on behalf of B in some sense. Second, B is empowered to sanction
or reward A for her activities or performance in this capacity.
A useful distinction when talking about accountability is that between horizontal and vertical
accountability. Horizontal accountability mechanisms are located within the state apparatus
and requires government officials and agencies to report to other officials and agencies
(Ackerman, 2004). Examples of such agencies include ombudsmen, corruption control
agencies and administrative courts. Vertical accountability, in contrast, refers to the ways in
which citizens and civil society organizations can hold governments accountable. Freedom of
press, speech and association provides channels through which citizens can articulate their
voice and strengthens vertical accountability (O'Donnell, 1998).
One of the most applauded vertical accountability mechanisms is free and fair elections where
citizens elect representatives and, based on their performance, reward or sanction them at the
ballot box. Recently, however, researchers have begun to acknowledge the deficiencies in
elections as an accountability instrument (Ackerman, 2004; Gaventa and McGee, 2013).
Malena et al. (2004), for instance, argue that elections are a blunt accountability instrument
since citizens there cannot fully express their preferences and views, nor do they allow
citizens to hold public officials accountable between elections or for specific decisions and
behaviors.
This has led a new type of accountability initiatives to emerge, collectively termed social
accountability initiatives, which do not suffer from the above-mentioned limitations of
elections. These initiatives, of which the initiative evaluated in this thesis is an example, are
also referred to as citizen led, bottom-up or demand-side accountability initiatives and
encompass a broad range of actions and mechanisms made available for citizens to interface
with actors, such as governments, in ways that are social rather than political, institutional or
bureaucratic (Gaventa and McGee, 2013). The idea is to promote participation beyond voting
among citizens and societal actors in order to hold governments and other power-holders
within the state accountable. According to Brinkerhoff and Wetterberg (2016), social
accountability initiatives have three instrumental aims: increasing the effectiveness of service

16
delivery, improving the quality of governance and democracy and increasing citizen
empowerment. Out of these interlinked instrumental aims, the initiative studied in this thesis
primarily aims to increase citizen empowerment and, in particular, empower citizens to
participate and demand improved public services. In summary, social accountability
initiatives serve to both compliment and enforce horizontal and vertical accountability
mechanisms (Malena et al., 2004).
3.2.2 Conditions under which information affects citizen behavior
For information to have any effect on citizen behavior, certain conditions regarding the
information, the citizens and the political environment need to be fulfilled. Below I propose
conditions upon which information provided by a CSO to induce behavioral change among
citizens is contingent, as suggested in the literature.
First, the information needs to be reliable, which means that the issuer or disseminator of
information must be credible and legitimate (O'Meally, 2013). Credible and rich information
can incentivize individuals and communities to use their own resources to call for change
(Barr et al., 2012). If citizens do not trust the information to be accurate they might not see a
behavioral change or choose inactivity (De Figueiredo et al., 2011).
Second, citizens need to understand the content of the information. If citizens are unable to
interpret the available information they are unlikely to take action (Banerjee et al., 2011). To
facilitate citizens’ understanding, the information must be clear. Fox (2007) makes a
distinction between clear and opaque transparency. Programs that report reliable information
about institutional performance fall into the former category and allow the concerned actors,
such as the public, to act on the information and pursue strategies of constructive change.
Opaque transparency, in contrast, implies to provide information distorted from the practical
reality. Training and education can help citizens internalize the information (Krishna, 2006).
Third, the attitudes and prior beliefs of citizens play an important role in determining the
impact of the information. Citizens must be dissatisfied with the current state of affairs and
want an improvement (Kosack and Fung, 2014). However, information describing the poor
performance political performance could also lead to a reluctancy to participate among
citizens if, for instance, the expected benefits of participating is reduced (Banerjee et al.,
2011). Furthermore, if information about local government performance merely confirms
what an individual already thinks, any behavioral change is unlikely. It is thus important to
raise citizens’ expectations about what is an acceptable performance. The way to do this, as
17
suggested by Gottlieb (2016), is to make sure that citizens have accurate reference points
regarding the performance of governments and politicians to use as evaluative criteria. These
reference points could either be a general performance standard or a benchmark against the
performance of other politicians.
Fourth, the political environment could be a serious impediment to citizens’ voice. An
enabling environment needs to reduce fear of reprisals for citizen action. When possible,
channels where citizens anonymously can use their voice should be promoted (Fox, 2015).
The political environment needs to allow citizens to easily identify who is responsible for the
service delivery performance, whether it is frontline service providers, politicians or
bureaucrats. In developing countries with multiple levels of government, there can also be
uncertainties regarding which level is responsible for the provision of a specific service
(Chong et al., 2010; Gottlieb, 2016) . These issues are especially prevalent in public service
environments characterized by what Booth (2010) refers to as institutional incoherence.
Common features of these environments are ill-defined mandates, overlapping jurisdictions,
the pursuit of impractical policies and distorted incentives among actors within implementing
organizations.
Fifth, citizens need to be able to and willing to act on the information. Without sufficient
skills and resources citizens are unlikely to have capacity or be motivated to act (Brinkerhoff
and Wetterberg, 2016). Prior knowledge of the political system, what concrete impact can be
sought and what channels can be used to effectively demand change, facilitates taking action.
If the information has a clear connection to citizens’ well-being a reaction is more likely.
Banerjee et al. (2011), for instance, show that voters react to legislators’ attendance record in
oversight committees but not in the legislature and that citizens are concerned with public
goods spending in areas where they live but not in general. Similarly, a person that spends a
substantial portion of her time and income on a public service is more likely to voice potential
concerns (Paul, 1992). That is, it is important that citizens care about the information (Kosack
and Fung, 2014). Seeking to influence government decisions requires of citizens both a belief
in their own capacity and in a government responsive to pressure (McLeod et al., 1999).
Sixth, to facilitate collective action, citizens need to expect others to act towards a common
good (Ostrom, 1998). Therefore, attention to citizens’ incentives, both for individual or
collective action, is important (Booth, 2012). Coordination among citizens becomes more
likely when citizens know that others are receiving the information as well (Lieberman et al.,

18
2014) and when groups, such as a constituency, share interests and moral obligations (Tsai,
2007). Participation in meetings can also facilitate learning about politicians’ performance
through common understandings of benchmarks (Fujiwara and Wantchekon, 2013) and what
the expectations and targets are (Barr et al., 2012).
While these conditions for information to trigger behavioral responses from citizens are not
exhaustive, they nevertheless provide some insights into the mechanisms that can link
information to behavioral changes among citizens.
3.3 Hypotheses
I first expect the scorecard dissemination to have positive effects on citizen participation.
While this is far from obvious, I argue that it is likely that many of the conditions listed in the
previous subsection are fulfilled in the context studied. This factor, together with the positive
findings in the papers by Gottlieb (2016) and Krishna (2006), which I previously argued are
the papers most related to this thesis, lead me to expect positive effects. I discuss below each
condition and, based on the context, offer conjectures in regards to whether a condition is
likely to be fulfilled or unfulfilled.
First, the disseminator of information (ACODE) needs to be perceived as legitimate by
citizens. ACODE’s assessment of politicians is intended to be non-political, fair and objective
(Bainomugisha et al., 2017), which should contribute to ACODE being seen as legitimate and
credible.
Second, citizens need to understand the information. While I am unable to assess this for the
majority of the treated who solely were exposed to the scorecards, the attendees of the ID
meetings appear to have understood the information to some extent. Following the meetings,
98% of the attendees could mention at least one public service delivery standard and 56%
recalled their councilor’s score.
Third, citizens’ attitudes toward local government might not favor participation. At baseline,
60% of respondents in the SLRC survey believed that local government does not care about
their opinions. If citizens do not believe that a government is responsive to their pressure, a
reaction is less likely (McLeod et al., 1999). For the information to have any effect, it needs
to make citizens update their prior beliefs. This appears to be the case. Grossman and
Michelitch (2018) find in a baseline survey that only 9% of respondents had heard about the
scorecard initiative prior to the ID treatment. They also find that respondents’ assessments of

19
councilors’ performance along the four legally defined duties were uncorrelated with the
actual scorecard scores. Furthermore, the information needs to be clear on what is an
acceptable performance. The disseminated scorecards not only described the scores of
citizens’ own councilors, but also the scores of councilors representing other sub-counties.
These benchmarks should make it clear to citizens what they can expect from their councilors.
Fourth, the political environment needs to favor citizens’ use of voice. As observed by Titeca
(2005), citizens in Uganda do not appear to be afraid to confront government officials at
meetings. If a government official would blatantly lie about some issue, the meeting attendees
often do not hesitate to speak up and confront the official. Furthermore, it needs to be clear to
citizens what level of government is responsible for delivery of a service. The scorecards
describe the services that the councilors are responsible for monitoring and it should hence be
clear to citizens that they can hold the councilors accountable for the performance in that
respect.
Fifth, citizens need to be able to and willing to act on the information. The low level of
development in Uganda is an impediment to this condition. The opportunity costs of
participating can be discouraging, especially for poor people (Steiner, 2007). The dataset used
shows that 68% of respondent households are unable to meet the household needs and
sometimes or often need to rely on others for help. These individuals might be reluctant to
participate even after receiving the new information.
It has been suggested that citizens in low-income settings might be relatively indifferent to the
performance of politicians and instead have greater preferences for clientelistic arrangements
or private transfers (Humphreys and Weinstein, 2012; Pande, 2011). If this is the case,
citizens might not observe an increased motivation to act as a result of the ID treatment, given
that it does not compromise the set arrangements. Grossman and Michelitch (2018) report in
the baseline survey that 41% of respondents believed paying personal handouts is a legal
responsibility of councilors, which indicates that clientelistic arrangements do occur.
However, I cannot assess the importance citizens give to such arrangements relative to the
performance indicators in the scorecard. Furthermore, citizens’ ability to act is facilitated by
some prior knowledge of the political system and channels through which they can influence
politicians. The dataset shows that 53% of respondents were unaware of any official channels
through which they can report a service delivery problem and 51% were unaware of any
community meeting having been held.
20
Sixth, the unawareness of influence channels and meetings held can also be an impediment to
collective action. If citizens that are aware of how to take action believe that few others are
informed of how to act, the transaction costs for collective action might appear too high for
the informed citizens (Buntaine et al., 2018).
As we have seen, it is far from clear that all of the conditions are fulfilled and, in fact, it
appears rather unlikely. However, several conditions seem likely to have been fulfilled. The
information should be new to citizens and update their prior beliefs, meeting participants
seem to have understood the information and the political environment is not characterized by
fear among citizens to use their voice. In addition, the scorecard dissemination itself could
assist in the fulfillment of other conditions by clarifying the responsibilities of district
councilors; moving citizens’ evaluative criteria of councilors from paying handouts and
private transfers to performing their legal duties; and creating a buzz around councilors’
performance which could facilitate collective action. The somewhat large degree to which the
conditions appears to be fulfilled, together with the positive information effects found in the
previous literature most relevant for this thesis (Gottlieb, 2016; Krishna, 2006), leads me to
hypothesize that the scorecard dissemination should have a positive effects on the six
participation outcomes.
Hypothesis 1: The scorecard dissemination will induce more citizens to attend meetings,
speak at meetings and report service delivery problems.
In addition to this main hypothesis, I make several testable predictions regarding
heterogeneity in impact for individuals with different attributes, which I base on previously
made arguments in the thesis. First, citizens need to be dissatisfied with service delivery
quality and local government service delivery efforts in order to react to information (Kosack
and Fung, 2014). Second, a belief that local government is responsive to the voice of citizens
should facilitate citizen pressure on local governments to improve performance (McLeod et
al., 1999). Third, information might have lesser impact on poor citizens in Uganda due to
higher opportunity costs of participating (Steiner, 2007) and a perception that it is the elite
group and not the poor that should participate (Steiner, 2008). Fourth, educated citizens
should be more likely to participate due to their larger capacity to internalize the information
as well as their better knowledge of the political system and how to act. These arguments are
summarized my second hypothesis:
Hypothesis 2: The scorecard dissemination will have a larger effect for individuals that:
21
- believe that local government is responsive their opinions
- are dissatisfied with local government decisions
- are dissatisfied with the quality of public services
- have higher living standards
- are better educated
4. Data
The main data used in this study comes from the Secure Livelihoods Research Consortium
(SLRC) Panel Survey - a multi-year survey carried out in the northern Ugandan sub-regions
Acholi and Lango in 2013 (January-February) and 2015 (January-February). The first round
of scorecard dissemination occurred between June and August 2013 and the second round
between March and July 2014, meaning that the survey rounds took place roughly 6 months
before and after the treatment period. The SLRC dataset contains modules on livelihood
sources, food security, security, shocks, basic services, social protection, livelihood services
and governance. For the purpose of this thesis, the wide range of questions included in the
survey can be seen as an advantage since this should reduce the risk of priming the
respondents.
At baseline 1853 individuals were surveyed, out of which 1553 remained in the second wave,
meaning an attrition rate of 16%. The sampling method, proportional to size systematic
sampling (PPSSys), means that larger sub-counties have a higher likelihood of being selected
in order to equalize each respondent’s probability of selection. To address these two concerns
of (non-random) attrition and unequal probabilities of selection, the observations in both
waves are assigned design weights. For a more detailed description of the survey
methodology, see Marshak et al. (2017).
In addition, I collect data on the ID and SMS treatments from Grossman and Michelitch
(2018). The ID and SMS treatments were randomly assigned to sub-counties within the 20
districts where ACODE is active.
4.1 Measurements of active citizenship
From the SLRC dataset I construct six participation measurements, out of which three are
more general and three are more strongly connected to local governments. I begin by

22
describing the general participation outcomes and then explain how these differ from the local
government (LG) participation outcomes.
The variables used to capture citizen participation and demand for improved public services
are attended meeting, spoke at meeting and reported problem. Out of these, the first two are
more related to collective action and the third to individual action. Depending on the context,
individual and collective action can be perceived as more or less appealing and it is thus
useful to investigate these separately (Dawes, 1980).
Attended meeting is a dummy variable taking the value 1 if an individual answered yes to
having attended a community meeting regarding any public service in the last 12 months. This
question was asked for each of the public services: health, education, water, livelihood
assistance, social protection, security and other services. I code this variable as taking the
value 1 if a respondent answers ―yes‖ to having attended a meeting regarding any of those 7
public services. Hence, the variable captures whether an individual participates or not, but not
the level of activity of an individual. Since it has been suggested that the level of activity
among citizens vary largely between low participators and high participators, with the former
being generally inactive and the latter participating in a number of different political activities
(Krishna, 2006; McLeod et al., 1999), and that effective participation requires collective
action by a substantial number (Booth, 2012; Ostrom, 1998), I argue that focusing on the
transition from being a non-participant to a participant perhaps is more meaningful than
looking at the overall level of activity of individuals when measuring active citizenship in this
context. All dependent variables are hence coded in the same fashion.
Spoke at meeting is a dummy variable indicating whether the respondent has spoken at a
community meeting (regarding any of the public services mentioned above) in the last 12
months.
Reported problem is constructed in the same way as the previous two variables, taking the
value 1 if the respondent answers yes to have reported a problem regarding any of the 7 public
services in the last 12 months.
The LG participation outcomes differ from the above described general participation
outcomes in that, for an individual to be consider a participant, he/she is required to answer
yes to a follow-up question, given that the answer was yes to having attended a community
meeting or reported a service delivery problem. A respondent that answered yes to having

23
attended a community meeting was subsequently asked who called the meeting, whether it
was an NGO, a local clan leader, a government official, a health worker, a religious leader, a
local extension worker, a community group or a community security group. The most
straightforward response to the ID treatment would be to attend or speak at a meeting called
by a government official. Therefore, the new variables for attending a community meeting
and speaking at a community meeting are coded as 1 if an individual took each action (spoke
and attended) for any public service at a community meeting called by a government official.
Since it is unlikely that central government officials call community meetings in northern
Uganda, the government official in question should pertain to a local government. Hence, to
avoid confusion, I refer to meetings called by government officials as local government
meetings.
For the variable reported problem, the follow-up question was to whom the problem was
reported, with the options: the local council, the community, an international agency, a local
non-governmental organization (NGO), a religious institution, a private provider or other. The
alternative version of reported problem is coded as 1 if an individual reported a problem to a
local council.
Since the participation measurements are meant to capture actions that citizens take to exert
pressure on local governments to improve service delivery, the local government participation
outcomes can appear as more straightforward. However, there are other ways in which
citizens can exert pressure than taking actions directly directed towards local government.
Actors such as religious leaders, NGOs or clan leaders can serve as a communication link
between citizens and local governments, amplifying the voices of citizens. As pointed out by
Titeca (2005), NGOs are a prominent link between citizens and local governments in Uganda.
They hold meetings where citizens can express their grievances to local government officials.
NGOs also visit the communities, gather citizens’ views on issues and compile reports to be
presented to local government officials. One could also argue that, since local governments
are responsible for the majority of public services in Uganda, any meeting attended where
public services are discussed can be a way of indirectly pressuring local government to
improve public services by, for instance, facilitating collective action and mobilization for
future attempts to influence local government decisions. However, it is possible that the role
of frontline service providers rather than the role of local governments is discussed at these
meetings. Perhaps citizens see deficiencies in the local health centre as being the fault of the
staff and make no connection to local government efforts. Therefore, I argue that it is useful

24
to separate general participation outcomes from local government participation outcomes. The
former outcomes are a black box in the sense that I cannot be entirely sure if the participation
they capture is related to local government, whereas the latter more certainly is related. It is
hence likely that the treatment effect is larger for the local government outcomes since they
provide a clearer link to the ID treatment. Table 1 summarizes the outcome variables and
provides the count of untreated and treated observations for each variable. The table shows
that roughly half of the individuals that attended a community meeting and spoke at a
community meeting did so at a local government meeting. 905 out of the 1405 individuals
that reported a service delivery problem did so to the local council.
Table 1. Summary of outcome variables
Participation outcome
Count of
untreated
observations
Count of
treated
observations
Count of
total
observations
Attended meeting 2004 1405 3409
Spoke at meeting 2362 1047 3409
Reported problem 2039 1370 3409
Attended LG meeting 2686 723 3409
Spoke at LG meeting 2895 514 3409
Reported problem to LG 2504 905 3409
4.2 Control variables
The covariates include individual characteristics (age, sex), education (highest level of
education completed), indicators of living situation (living standard, food security),
connectivity (owns phone, owns radio), health (household member experienced long term
health problems) and social capital (able to borrow money from friends/family). NRM
councilor is a sub-county characteristic indicating whether a sub-county is represented by a
member of the National Resistance Movement at the district council. These variables are
described in Appendix A1.
SMS treatment is a binary variable indicating whether a sub-county was assigned an SMS
platform where citizens can make direct contact with their elected local politicians (see
section 2.2). Out of the outcomes investigated, this treatment is only believed to influence
whether a citizen has reported a problem, since the purpose of the SMS platform was to allow
citizens to express grievances regarding public services to district councilors.
25
Weak dissemination is a variable taking the value 1 if an individual belongs to a district where
ACODE-activities are conducted. Recall that ACODE, in all districts where present, holds
annual scorecard dissemination events where politicians and other stakeholders are invited.
Since the scorecard information through these events might trickle down to citizens, the effect
of the ID treatment might be overestimated if the variable is not controlled for.
Both variables attended meeting and spoke at meeting are contingent on a community meeting
being held in the last 12 months. Therefore community meeting held is a considered control
variable. By similar reasoning, to have experienced a service delivery problem is necessary
for having reported a service delivery problem. Both variables experienced a problem and
community meeting held are perception-based and might not accurately reflect the true state,
but they should nevertheless be considered as controls.
5. Research design and empirical strategy
This thesis is predominantly interested in the Intense Dissemination (ID) component of the
Local Government Councils Scorecard Initiative (LGCSCI) where scorecard information is
disseminated to citizens. The ID treatment is randomly assigned to sub-counties within the
districts in which the LGCSCI is implemented by ACODE. The reason why focus is on the ID
treatment and not on the Weak Dissemination is the uncertainty regarding the extent to which
the annual dissemination events garnered attention from the media and, in case it did, to what
degree citizens took part in the media reporting. Given the Ugandan context with low levels
of connectivity among citizens and a relatively scarce number of media outlets, it appears
unlikely that these events should have any considerable effects on citizens’ awareness of the
scorecards. The ID treatment, in contrast, was designed make citizens in the treated sub-
counties aware of the program and the score of their local councilors, which makes it a more
suitable treatment to investigate given the purpose of the thesis.
An issue with estimating the causal effect of the program is that individuals are not entirely
randomly selected into treatment and control groups. ACODE is present in 20 Ugandan
districts, out of which 4 are included in the SLRC survey (see Figure 2). Since the ID
treatment was randomly assigned to sub-counties within the ACODE districts, only a part of
the sub-counties in the sample was eligible for ID treatment. The question is then if the
districts chosen for ACODE-activities are different in characteristics from districts without

26
ACODE presence. This could plausibly be the case since ACODE needs the approval and
cooperation of the politicians within a district to conduct their activities, which suggests that
the political environment, as well as other characteristics, could be different in non-ACODE
districts. Should the political environment in the districts chosen by ACODE particularly
favor participation, the treatment effect is likely to be biased upward and treatment
assignment cannot be considered random.
When one does not have the benefit of a setting where treatment is randomly assigned there
are, however, empirical methods available to ensure that treatment is ―as good as random‖.
Two such methods frequently used in the impact evaluation literature are difference-in-
difference (DID) and propensity score matching (PSM). Both these methods can be used to
estimate causal effects when one has a group of treated individuals and a group of untreated
individuals observed at two time periods. Since these methods rely on different assumptions
and have different advantages, they can be seen as compliments. Hence, to assess the
robustness of the findings, I estimate results using both DID and PSM. In addition, I estimate
heterogeneous treatment effects using the DID method as base.
Figure 2. Map of Uganda indicating ACODE districts and districts in the SLRC dataset

27
5.1 Difference-in-difference
The difference-in-difference (DID) method compares outcomes over time between a group
subject to treatment and an untreated group. The first difference, assessing differences over
time in the two groups, accounts for time-constant effects since each group here is compared
with itself. This leaves time-varying factors the only remaining source of bias. Given that
time-varying factors affect the treatment and control group in the same way, comparing the
first differences between the two groups (second differences) accounts for these time-varying
factors. Hence, by subtracting the second difference from the first difference we have, in
theory, removed time-constant and time-variant effects (Gertler et al., 2016). The intuition
behind the DID estimation technique is illustrated in Table 2, using the data of this thesis as
an example. Note that design weights are not applied which gives the estimate little credibility
as the actual treatment effect.
Table 2. Manual calculation of DID estimate
Mean of variable attended community meeting
Group After=2015 Before=2013 Change After-Before
Treated 0.4260 0.3802 0.0458
Control 0.4231 0.4063 0.0168
Difference-in-difference estimate: 0.0290
The first difference for the treated group is calculated by subtracting the average of the variable
attended community meeting in 2013 from the average of the variable in 2015 (0.2460-
0.3802=0.0458). After calculating the first difference for the control group in the same way, the
second difference is calculated by subtracting the first difference of the control group (0.0168) from
the first difference of the treated group (0.0458). This gives the difference-in-difference estimate
0.0290.
If the differences between the treatment and the control group vary over time, the DID fails to
account for this. Therefore, the method requires the assumption that treatment and control
groups would follow the same trends (conditional or unconditional on covariates) in absence
of treatment. This is the parallel trends assumption and it is the key identifying assumption in
DID.
There are both pros and cons for including covariates in a DID framework. If different trends
among the treated and control group are driven by the characteristics of the two groups,
relevant variables can be included to account for this. On the other hand, additional variables
28
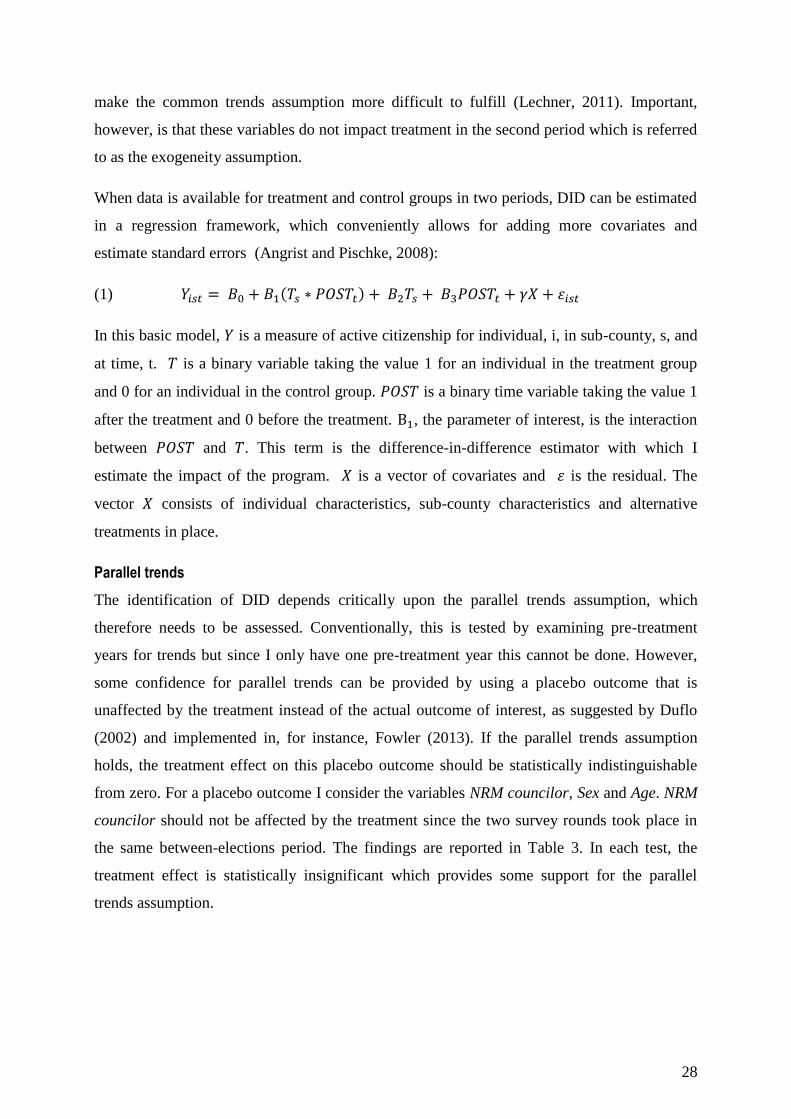
make the common trends assumption more difficult to fulfill (Lechner, 2011). Important,
however, is that these variables do not impact treatment in the second period which is referred
to as the exogeneity assumption.
When data is available for treatment and control groups in two periods, DID can be estimated
in a regression framework, which conveniently allows for adding more covariates and
estimate standard errors (Angrist and Pischke, 2008):
(1) ( )
In this basic model, is a measure of active citizenship for individual, i, in sub-county, s, and
at time, t. is a binary variable taking the value 1 for an individual in the treatment group
and 0 for an individual in the control group. is a binary time variable taking the value 1
after the treatment and 0 before the treatment. , the parameter of interest, is the interaction
between and . This term is the difference-in-difference estimator with which I
estimate the impact of the program. is a vector of covariates and is the residual. The
vector consists of individual characteristics, sub-county characteristics and alternative
treatments in place.
Parallel trends
The identification of DID depends critically upon the parallel trends assumption, which
therefore needs to be assessed. Conventionally, this is tested by examining pre-treatment
years for trends but since I only have one pre-treatment year this cannot be done. However,
some confidence for parallel trends can be provided by using a placebo outcome that is
unaffected by the treatment instead of the actual outcome of interest, as suggested by Duflo
(2002) and implemented in, for instance, Fowler (2013). If the parallel trends assumption
holds, the treatment effect on this placebo outcome should be statistically indistinguishable
from zero. For a placebo outcome I consider the variables NRM councilor, Sex and Age. NRM
councilor should not be affected by the treatment since the two survey rounds took place in
the same between-elections period. The findings are reported in Table 3. In each test, the
treatment effect is statistically insignificant which provides some support for the parallel
trends assumption.

29
Table 3. Difference-in-Difference with placebo outcomes
Dependent variable Treatment effect Standard error p-value
Sex -0.002 0.012 0.889
NRM councilor 0.015 0.012 0.184
Age 0.438 0.284 0.127
In each row, the treatment effect is the DID estimator regressed on the dependent variable at the left, with time
fixed-effects and sub-county fixed-effects. NRM councilor and Sex are binary variables while Age is discrete.
Standard errors are clustered by sub-county. Design weights are applied.
5.2 Propensity Score Matching
The idea of propensity score matching (PSM) is to compare individuals that are as similar as
possible in characteristics but differ in treatment status. Imagine that there are two individuals,
both identical in characteristics, with one receiving the treatment and one being a control.
Comparing the two individuals’ outcomes would then show the causal effect of the treatment
since being treated is the only way in which the two differ. Similarly, when there are two
groups, one treated and one untreated, the average difference in outcome of these groups
show the causal effect.
Matching individuals with the exact same characteristics one-to-one is referred to as exact
matching and is believed to result in the most credible inference (Imbens, 2004). This,
however, can result in dimensionality problems, i.e. difficulties to get matches when there are
many covariates on which the matching is done (Caliendo and Kopeinig, 2008). The solution
to this problem, proposed in Rosenbaum and Rubin (1983), is to instead match individuals on
the probability of being treated, conditional on their observed characteristics unaffected by the
treatment.
In PSM, the common trends assumption is not required, but instead it is assumed that all
differences between treatment and control groups are identified, i.e., treatment only depends
on observables. This is the Conditional Independence Assumption (CIA) which is the main
identifying assumption in PSM. This contrasts the method to DID which, as previously
described, allows for selection on time-constant unobservables.
A second important assumption in PSM is the ―overlap assumption‖, which requires
participants and non-participants to have a positive probability of being selected for treatment.
This assumption ensures that treatment observations and controls have a sizeable overlap in
propensity scores (common support) so that suitable matches can be found (Heinrich et al.,

30
2010). The overlap assumption can be tested by visually inspecting the densities of propensity
scores for the treated and the controls, before and after matching. This is done in Figure B1 to
B3 in Appendix B and shows that the densities for both groups coincide well after matching.
If the CIA and overlap assumption hold, we have what Rosenbaum and Rubin (1983) refers to
as a situation of ―strong ignorability‖ of treatment assignment.
In this thesis, the propensity scores (or probabilities of being treated) are estimated with a
probit model, where relevant covariates are included. The parameter of interest in the PSM is
the average treatment effect of the treated (ATT). ATT is defined at the difference in the
expected outcomes of being treated and untreated for the individuals that actually participated
in the treatment (Caliendo and Kopeinig, 2008). This can be expressed in terms of potential
outcomes as:
(2) ( | ) ( | ) ( | ).
There are a variety of matching techniques to choose from when estimating propensity scores.
I make use of the most common technique, Nearest Neighbor (NN) matching. When sample
sizes are small, results can be especially sensitive to the choice of matching algorithm
(Heckman et al., 1997). Therefore, to test the consistancy of the propensity score estimates, I
use three different NN matching techniques.
In NN matching, treatment units are matched with the control units with the most similar
propensity scores. This can be done with or without replacement. NN matching with
replacement allows each non-participant to be matched several times with a non-participant,
should it be the closest. The choice of whether to use replacement involves a trade-off
between bias and variance (Caliendo and Kopeinig, 2008). While replacement will result in
better matches it will also increase bias as a result of the reduction in unique nonparticipants. I
estimate results using both NN with and without replacement.
In NN-matching with replacement the number of control units to be matched with each
treated unit needs to be decided. To use more than one NN is referred to as ―oversampling‖
and has the advantage that more information is being used. In the NN with replacement
estimation, I allow for 5 controls units to be matched with each treated unit, which I refer to
as NN5.
A risk in NN matching is to get poor matches. The nearest neighbor might not be so near,
should there be large heterogeneity in the treatment and control groups. A solution is then to
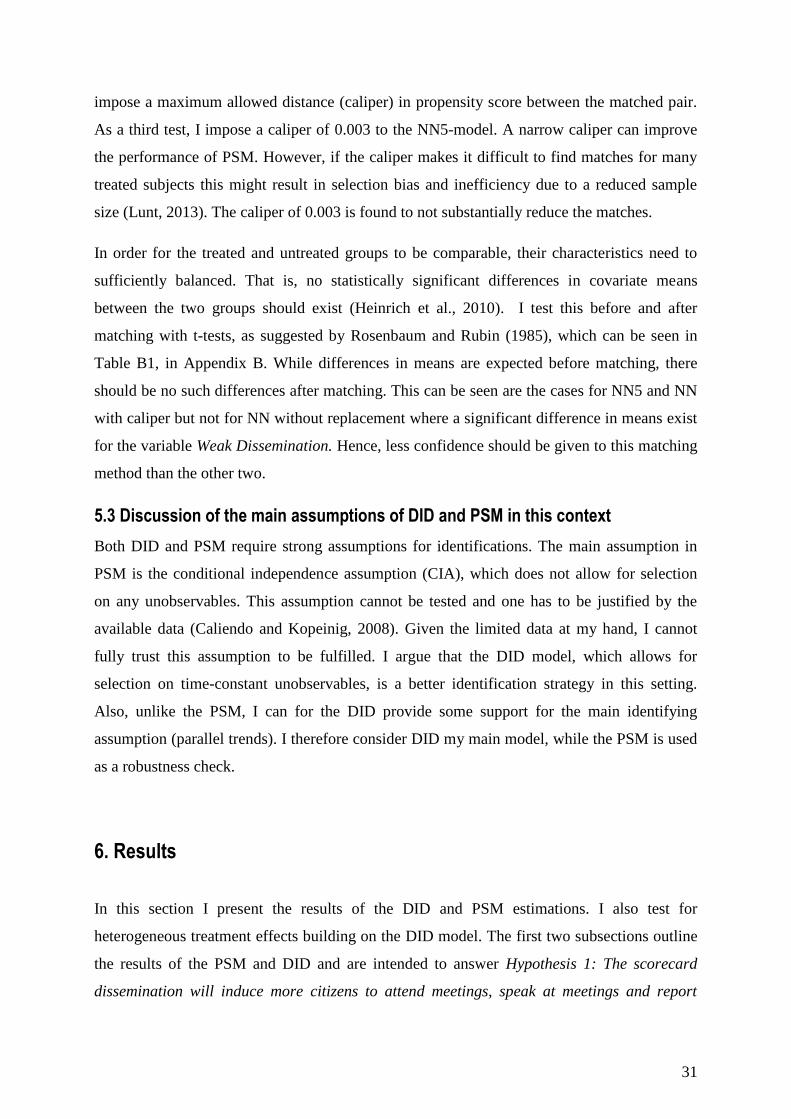
31
impose a maximum allowed distance (caliper) in propensity score between the matched pair.
As a third test, I impose a caliper of 0.003 to the NN5-model. A narrow caliper can improve
the performance of PSM. However, if the caliper makes it difficult to find matches for many
treated subjects this might result in selection bias and inefficiency due to a reduced sample
size (Lunt, 2013). The caliper of 0.003 is found to not substantially reduce the matches.
In order for the treated and untreated groups to be comparable, their characteristics need to
sufficiently balanced. That is, no statistically significant differences in covariate means
between the two groups should exist (Heinrich et al., 2010). I test this before and after
matching with t-tests, as suggested by Rosenbaum and Rubin (1985), which can be seen in
Table B1, in Appendix B. While differences in means are expected before matching, there
should be no such differences after matching. This can be seen are the cases for NN5 and NN
with caliper but not for NN without replacement where a significant difference in means exist
for the variable Weak Dissemination. Hence, less confidence should be given to this matching
method than the other two.
5.3 Discussion of the main assumptions of DID and PSM in this context
Both DID and PSM require strong assumptions for identifications. The main assumption in
PSM is the conditional independence assumption (CIA), which does not allow for selection
on any unobservables. This assumption cannot be tested and one has to be justified by the
available data (Caliendo and Kopeinig, 2008). Given the limited data at my hand, I cannot
fully trust this assumption to be fulfilled. I argue that the DID model, which allows for
selection on time-constant unobservables, is a better identification strategy in this setting.
Also, unlike the PSM, I can for the DID provide some support for the main identifying
assumption (parallel trends). I therefore consider DID my main model, while the PSM is used
as a robustness check.
6. Results
In this section I present the results of the DID and PSM estimations. I also test for
heterogeneous treatment effects building on the DID model. The first two subsections outline
the results of the PSM and DID and are intended to answer Hypothesis 1: The scorecard
dissemination will induce more citizens to attend meetings, speak at meetings and report

32
service delivery problems. The third section reports the results of the heterogeneous treatment
effect assessment and is meant to answer my second hypothesis.
6.1 Difference-in-Difference
Difference-in-difference models are estimated for two versions of the outcome variables. In
the first version, I investigate the effects of the ID treatment on the general participation
outcomes and in the second version on the local government participation outcomes. The
results of the first and second versions are reported in Table 4 and Table 5, respectively. For
each of the 6 outcomes I estimate a model i) without covariate adjustment, ii) with the full set
of covariates, and iii) excluding the conditioning variables (experienced a service delivery
problem or community meeting held). The reasons for excluding the conditioning variables
are that they 1) might violate the exogeneity assumption, i.e., be influenced by treatment in
the second period and 2) are highly correlated with the respective outcome, which might be
due to incorrect answers. On the other hand, an individual cannot attend a meeting if no
meeting is held and is unlikely to report a service delivery problem if all public services are
infallible. In all models, standard errors are clustered at the sub-county level allowing for
serial correlation within, but not between, sub-counties. Design weights are applied to
observations in both years.
From estimating the first version, using general participation outcomes, I find the treatment
effect to be negative but insignificant in all models, which can be seen in Table 4. However,
in the second version, reported in Table 5, I find some evidence of negative treatment effects.
The treatment effect is negative and significant for the outcomes spoke at LG meeting (p-
value=0.014) and attended LG meeting (p-value=0.028) when I include the full set of controls
(column 2 and 5). In these models, we see that the inclusion of the conditioning variable
reduces the standard errors of the DID coefficients, compared to column 3 and 6 where the
conditioning variable is excluded, making the estimates significant at the 5% level.
Based on these key results for the thesis, I reject Hypothesis 1.Rather than having a positive
effect on participation, the scorecard information appears to lead to disengagement or, at best,
to maintaining the status quo.
Among the included covariates Age, Sex and Living Standard are significant predictors of
participation in most models. Individuals that are older, male and better-off appear to be more
likely to participate. Noteworthy is that the coefficient of SMS treatment is negative and
significant in both versions (model 8 and 9, both tables). This is surprising considering that

33
the purpose of that treatment was to facilitate contact between politicians and citizens by
establishing a platform for interaction through text messaging. Hence, if a citizen experiences
a service delivery problem, it should require less effort to report it for citizens in sub-counties
where the platform is implemented. It is possible that the radio adverts had limited outreach.
Only 57% of respondents live in a household that owns a radio. Households that own a radio
might also not have heard the radio advert or, if they have heard it, did not understand or
believe in the idea of the SMS platform. The negative coefficient is, however, still difficult to
explain.
Table 4. Difference-in-Difference results using general participation outcomes
(1) (2) (3) (4) (5) (6) (7) (8) (9)
Attended
meeting
Attended
meeting
Attended
meeting
Spoke at
meeting
Spoke at
meeting
Spoke at
meeting
Reported
problem
Reported
problem
Reported
problem
DiD -0.042 -0.028 -0.044 -0.030 -0.019 -0.031 -0.068 -0.080 -0.067
(0.069) (0.021) (0.070) (0.065) (0.032) (0.067) (0.066) (0.058) (0.063)
Treated 0.014 0.024 0.044 0.075 0.082** 0.097 0.065 0.004 0.048
(0.051) (0.015) (0.068) (0.058) (0.033) (0.074) (0.081) (0.062) (0.082)
After 0.035* 0.001 0.009 0.002 -0.025** -0.020 -0.052** -0.050*** -0.036
(0.019) (0.009) (0.021) (0.018) (0.011) (0.019) (0.024) (0.018) (0.025)
Age 0.001*** 0.002*** 0.002*** 0.003*** 0.001 0.000
(0.000) (0.001) (0.000) (0.001) (0.001) (0.001)
Sex -0.028** -0.051** -0.107*** -0.125*** -0.064*** -0.079***
(0.014) (0.024) (0.016) (0.020) (0.017) (0.023)
Living -0.022*** -0.064*** -0.022** -0.054*** -0.028** -0.002
standard (0.007) (0.011) (0.009) (0.011) (0.012) (0.012)
Education 0.001 0.008** 0.002 0.007** -0.004 -0.005
(0.001) (0.003) (0.002) (0.003) (0.002) (0.003)
Health -0.017 -0.060*** -0.018 -0.051** 0.017 -0.006
(0.012) (0.020) (0.021) (0.023) (0.017) (0.019)
Social Capital 0.012 0.013 0.020* 0.021 0.009 0.010
(0.009) (0.020) (0.011) (0.019) (0.015) (0.019)
Owns radio -0.007 0.037* -0.004 0.029 -0.011 0.010
(0.011) (0.020) (0.016) (0.022) (0.017) (0.020)
Owns phone 0.002 -0.008 0.030* 0.022 0.025 0.059***
(0.012) (0.022) (0.017) (0.024) (0.016) (0.020)
Food security -0.001 -0.038** -0.000 -0.027* -0.014 0.024
(0.007) (0.016) (0.008) (0.015) (0.013) (0.017)
Weak 0.007 -0.051 0.002 -0.041 0.080** 0.053
Dissemination (0.014) (0.039) (0.017) (0.036) (0.036) (0.040)
NRM -0.004 0.004 -0.003 0.003 0.043 0.033
Councilor (0.011) (0.029) (0.015) (0.029) (0.029) (0.033)
Community 0.829*** 0.623***
meeting held (0.011) (0.016)
SMS -0.083** -0.123**
treatment (0.039) (0.055)
Experienced 0.544***
problem (0.019)
Constant 0.407*** 0.036 0.559*** 0.311*** 0.035 0.428*** 0.440*** 0.110** 0.419***
(0.017) (0.029) (0.052) (0.016) (0.038) (0.055) (0.015) (0.048) (0.054)
Observations 3405 3321 3321 3405 3321 3321 3405 3321 3321
R2 0.001 0.718 0.037 0.002 0.487 0.056 0.005 0.248 0.018
Standard errors, clustered at sub-county level, in parentheses * p < 0.10, ** p < 0.05, *** p < 0.01
34
Table 5. Difference-in-Difference results using local government participation outcomes
(1) (2) (3) (4) (5) (6) (7) (8) (9)
Attended
LG
meeting
Attended
LG
meeting
Attended
LG
meeting
Spoke at
LG
meeting
Spoke at
LG
meeting
Spoke at
LG
meeting
Reported
to LG
Reported
to LG
Reported
to LG
DiD -0.109* -0.103** -0.111* -0.089* -0.088** -0.093* -0.052 -0.049 -0.041
(0.065) (0.046) (0.066) (0.050) (0.035) (0.050) (0.048) (0.044) (0.052)
Treated 0.025 0.032 0.042 0.045 0.049* 0.056 0.032 -0.024 0.005
(0.034) (0.027) (0.045) (0.030) (0.027) (0.041) (0.045) (0.039) (0.047)
After 0.082*** 0.060*** 0.064*** 0.041** 0.022 0.025 -0.044** -0.041** -0.031
(0.022) (0.020) (0.024) (0.017) (0.016) (0.018) (0.019) (0.016) (0.020)
Age 0.001** 0.002*** 0.002*** 0.002*** 0.000 -0.000
(0.001) (0.001) (0.001) (0.001) (0.001) (0.001)
Sex -0.026 -0.037* -0.048*** -0.057*** -0.097*** -0.108***
(0.017) (0.019) (0.017) (0.018) (0.015) (0.017)
Living -0.012 -0.033*** -0.016 -0.031*** -0.020* -0.003
standard (0.010) (0.010) (0.010) (0.010) (0.011) (0.011)
Education 0.000 0.004 0.002 0.004* -0.007*** -0.008***
(0.002) (0.002) (0.002) (0.002) (0.002) (0.002)
Health -0.022 -0.044*** -0.020 -0.036** 0.026 0.011
(0.013) (0.015) (0.014) (0.015) (0.016) (0.017)
Social Capital 0.004 0.005 0.004 0.004 -0.001 -0.001
(0.016) (0.016) (0.013) (0.012) (0.015) (0.017)
Owns radio 0.013 0.036** 0.016 0.032** -0.030 -0.016
(0.015) (0.016) (0.014) (0.015) (0.018) (0.019)
Owns phone 0.003 -0.002 0.013 0.010 0.021 0.044**
(0.014) (0.017) (0.014) (0.016) (0.019) (0.019)
Food security -0.015 -0.034*** -0.010 -0.023* -0.005 0.020
(0.010) (0.012) (0.010) (0.012) (0.013) (0.015)
Weak 0.002 -0.027 0.004 -0.017 0.065* 0.047
Dissemination (0.018) (0.028) (0.018) (0.025) (0.038) (0.043)
NRM -0.002 0.003 -0.001 0.002 0.024 0.017
Councilor (0.012) (0.019) (0.014) (0.019) (0.030) (0.032)
Community 0.426*** 0.302***
meeting held (0.011) (0.013)
SMS -0.078** -0.104**
treatment (0.038) (0.047)
Experienced 0.358***
problem (0.019)
Constant 0.185*** -0.012 0.256*** 0.139*** -0.023 0.168*** 0.305*** 0.164*** 0.368***
(0.012) (0.044) (0.043) (0.009) (0.039) (0.043) (0.015) (0.043) (0.045)
Observations 3405 3321 3321 3405 3321 3321 3405 3321 3321
R2 0.009 0.288 0.032 0.003 0.202 0.036 0.004 0.140 0.020
Standard errors, clustered at sub-county level, in parentheses * p < 0.10, ** p < 0.05, *** p < 0.01
6.2 Propensity Score Matching
I estimate the average treatment effect of the treated (ATT) using three different variants of
nearest neighbor (NN) matching: NN without replacement, NN with 5 nearest neighbors
(NN5) and NN5 with a caliper of 0.003 (NN5 caliper).

35
Consistent with the DID estimations, I find no treatment effects for the general participation
outcomes, which can be seen in the first three rows of Table 6. However, I find that the
treatment effects on the local government participation outcomes contradict the findings in the
DID method. While no significant treatment effects are found on the outcomes attended LG
meeting and spoke at LG meeting, reported to LG is significant using all matching techniques.
These results are consistent across the three matching methods used.
Using NN without replacement, all treated individuals are matched with one control. NN5
means exploiting the full sample since no observations are outside the common support and in
NN5 with caliper, no matches are found for 14 treated observations.
Table 6. Propensity score matching results
Dependent Matching method
variable
NN without NN5 NN5
replacement caliper
Attended 0.0063 0.0140 0.0137
meeting (0.0299) (0.0424) (0.0338)
Spoke at 0.0338 0.0368 0.0391
meeting (0.0343) (0.0357) (0.0380)
Reported -0.0529 -0.0372 -0.0633
problem (0.0353) (0 .0297) (0.0411)
Attended LG -0.0170 -0.0051 -0.0920
meeting (0.0223) (0.0317) (0.0358)
Spoke at LG -0.0021 0.0076 -0.0110
meeting (0.0300) (0.0384) (0.0324)
Reported to LG -0.0846***
-0.0757**
-0.0944**
(0.0316) (0.0338) 0.0380
Matching is done on the following variables: Age, Sex, Living standard, Education, Health, Social
Capital, Owns radio, Owns phone, Food security, Weak dissemination and NRM councilor. SEs,
bootstrapped using 50 replications, in parentheses. * p < 0.10,
** p < 0.05,
*** p < 0.01
6.3 Heterogeneous treatment effects
It is possible that exposure to the scorecard information had heterogeneous impact on people
with different characteristics and attitudes. In Hypothesis 2, I postulated that information will
have a larger effect for individuals that: believe local government to be responsive to their
voice; are dissatisfied with local government’s decisions and the quality of public services;
have higher living standard; and are better educated. Table 7 reports heterogeneous treatment

36
effects along these dimensions. The results are estimated with a triple difference approach
where the parameter of interest is the DID estimator interacted with the potential source of
heterogeneity in impact. I estimate the following model:
(3) ( ) ( ) ( )
( )
In this model, is a potential source of heterogeneous impact and the remaining variables are
defined according to (1). to are interaction terms and to are linear terms. The
description and coding of the variables in are detailed in Appendix A2.
The first observed heterogeneous impact is found in individuals’ attitudes toward local
government. Individuals who believe that local government is responsive to their opinions are
more likely to attend and speak at meetings, but only at meetings called by local government.
This heterogeneous treatment effect is significant for the outcomes spoke at LG meeting (p-
value=0.026) and Attended LG meeting (p-value=0.020).
The second observed heterogeneous impact provides some support for the hypothesis that
individuals that are unhappy with the current state of affairs are more likely to participate.
Individuals who do not feel that local government decisions reflect their own priorities are
more likely to participate in local government meetings, but not in meetings held by other
actors. This is significant at the 10% level for the outcomes Attended LG meeting (p-
value=0.098), Spoke at LG meeting (p-value=0.084) and Reported problem to LG (p-
value=0.097). Also, Individuals that are less satisfied with public services are more inclined to
report problems to local government. For Reported problem to LG, the effect is significant at
the 10% level (p-value=0.099).
While no evidence of heterogeneous treatment effects is found for individuals’ level of
education, a higher living standard appears to positively affect individuals’ likeliness to speak
at local government meetings (p-value=0.073).

37
Table 7. Heterogeneous treatment effects of citizen attributes
(1) (2) (3) (4) (5) (6)
Attended
meeting
Attended
LG
meeting
Spoke at
meeting
Spoke at
LG
meeting
Reported
problem
Reported
to LG
LG cares about me 0.106 -0.211**
0.113 -0.151**
-0.010 0.070
and my opinions (0.114) (0.089) 0.0951 (0.067) (0.141) (0.060)
LG decisions reflect -0.028 -0.071* -0.036 -0.061
* -0.044 -0.084
*
my priorities (0.053) (0.042) (0.053) (0.035) (0.050) (0.050)
Service satisfaction 0.058 -0.017 0.099 0.035 0.145 0.200*
(0.079) (0.075) (0.089) (0.053) (0.132) (0.120)
Living standard -0.067 -0.067 -0.105 -0.065* -0.001 -0.018
(0.058) (0.038) (0.047) (0.035) (0.094) (0.065)
Education 0.011 0.005 0.006 0.008 -0.002 -0.012
(0.008) (0.010) (0.010) (0.011) (0.011) (0.012)
Reported coefficients are the DID estimator interacted with the term at the left. All specifications
include the following control variables: Age, Sex, Living standard, Education, Health, Social Capital,
Owns radio, Owns phone, Food security, Weak dissemination and NRM councilor. Design weights
are applied. Standard errors, clustered at sub-county level, in parentheses. * p < 0.10,
** p < 0.05,
*** p
< 0.01
7. Conclusion
Providing citizens with enough information to assess the performance of their elected
politicians is widely seen as prerequisite for accountability (Keefer and Khemani, 2005). This
thesis does not question this assumption but argues that information alone is not sufficient to
strengthen the accountability relationship between citizens and their elected politicians.
In this thesis, I test the effects of providing citizens with information about the performance of
their locally elected politicians and ask whether such information induces more citizens to
actively participate and demand better public services. Contrary to my main hypothesis that
the scorecard dissemination will have positive effects on participation, I find that information
is not only insufficient to activate citizens but leads to disengagement in the participation
forms of attending community meetings and speaking at community meetings. This negative
effect of the scorecard dissemination is, however, only found on meetings called by local
governments. I argued that the treatment effects should be larger on the local government
participation outcomes due to their more straightforward connection to the ID treatment,
which is also found to be the case. The results using PSM, however, cast some doubts on
these findings by showing that the treatment effect is negative and significant on citizens’
reporting of service delivery problems to local government while no treatment effects are

38
found on citizens’ participation (attending and speaking) at local government meetings. I
argue that DID provides a better estimation strategy in this setting where data limitations are a
factor. This is because DID unlike PSM allows for some selection on unobservables.
A potential explanation for the negative findings is that the scorecard scores fell short of
citizens’ expectations of how well their district councilors perform (Gottlieb, 2016). If
citizens overestimates the performance of their district councilors, the expected benefits of
participating might be reduced, leading more citizens to not participate (Banerjee et al., 2011).
Low scores might also make salient features of district councilors that exclude citizens from
the decision-making process, which could lead more citizens to disengage (Buntaine et al.,
2018). For instance, if district councilors score low on legislative duties, they are unlikely to
provide an efficient channel through which citizens can influence service delivery outcomes.
That is, if citizens perceive a councilor as unlikely to influence the work and decisions of the
district council, citizens might refrain from seeking to influence this councilor. If being
exposed to low scores makes more citizens reluctant to participate, this effect should be
stronger for attending meetings and speaking at meetings since these outcomes are likely to
require more effort than reporting a service delivery problem. This is also found to be the
case. Unfortunately, data limitations prevent me from further investigating low scores as a
potential explanation of the negative effects.
An important driver of the negative results appears to be the relatively widespread perception
among citizens that local governments do not care about them or their opinions; at baseline
(2013), 60% of respondents had this perception. Investigating heterogeneity in treatment
impact among citizens with different attributes, I find that individuals who do not believe that
the government cares about them or their opinions are less likely to participate. In contrast, I
find that individuals who do not feel that local government decisions reflect their priorities are
more likely to participate. These seemingly contradictory findings suggest that attempts to
influence local government decisions are more likely for citizens that perceive local
government as an actor that is benevolent and care about the citizens but also as an actor
whose priorities and decisions could be improved.
These results point to the need of raising citizens’ esteem for their own ability to influence
local government decisions. This could be achieved, for instance, by education or by focusing
on facilitating collective actions for citizens that are more unlikely to participate (Buntaine et
al., 2018). While increasing government responsiveness is goal of many transparency

39
initiatives (Gaventa and McGee, 2013), the results suggest that this could trigger a virtuous
circle where government responsiveness and citizen participation reinforce one another.
Furthermore, the results highlight the need to further raise citizens’ expectations of what is an
acceptable performance of politicians, which could contribute to more citizens participating.
The most important limitation of this thesis is that I am unable to assess to what extent
individuals in the treated areas actually were treated (received the scorecard information).
While on average 40 people attended the two information dissemination meetings at parish
level in 2013 and 2014, these individuals should not be able to reach all citizens in a parish
even if they have prominent positions in society, such as being religious or civil society
leaders. Instead, the experiment relies on a sufficient buzz around scorecards having been
created throughout the communities. The information dissemination tools (flyers, posters,
calendars) need to have reached a sufficient number of people and, importantly, citizens need
to have talked about and discussed the scorecards with each other. That ACODE had been
working in the districts subject to the experiment for at least two years prior to the treatment
should have made some people aware of who stands behind the information and hence give
some credibility to it. Chances of a good outreach are also improved by the fact that there
were two dissemination rounds. If an individual received a flyer about the scorecards the first
time and paid no attention to it, she might develop some curiosity the next time she hears
about it.

40
References
Ackerman, J. (2004). Co-governance for accountability: beyond ―exit‖ and ―voice‖. World
Development, 32(3), 447-463.
Andrabi, T., Das, J., and Khwaja, A. I. (2017). Report cards: The impact of providing school
and child test scores on educational markets. American Economic Review, 107(6), 1535-
1563.
Angrist, J. D., and Pischke, J.-S. (2008). Mostly harmless econometrics: An empiricist's
companion: Princeton university press.
Awortwi, N. (2011). An unbreakable path? A comparative study of decentralization and local
government development trajectories in Ghana and Uganda. International Review of
Administrative Sciences, 77(2), 347-377.
Bainomugisha, A., Muyomba-Tamale, L., Winstons, W. M., Cunningham, K., Ssemakula, E.
G., Bogere, G., . . . Atukunda, P. (2017). Local Government Councils Scorecard Assessment
2016/17: Civic Engagement: Activating the Potentials of Local Governance in Uganda.
ACODE Policy Research Series, 83. Kampala, Uganda.
Banerjee, A., Banerji, R., Duflo, E., Glennerster, R., and Khemani, S. (2010). Pitfalls of
participatory programs: Evidence from a randomized evaluation in education in India.
American Economic Journal: Economic Policy, 2(1), 1-30.
Banerjee, A., Kumar, S., Pande, R., and Su, F. (2011). Do informed voters make better
choices? Experimental evidence from urban India. Unpublished manuscript.
Barr, A., Mugisha, F., Serneels, P., and Zeitlin, A. (2012). Information and collective action
in the community monitoring of schools: Field and lab experimental evidence from Uganda.
Unpublished manuscript.
Besley, T., and Burgess, R. (2002). The political economy of government responsiveness:
Theory and evidence from India. The Quarterly Journal of Economics, 117(4), 1415-1451.
Besley, T., and Ghatak, M. (2003). Incentives, choice, and accountability in the provision of
public services. Oxford Review of Economic Policy, 19(2), 235-249.
Bjorkman, M., and Svensson, J. (2009). Power to the people: evidence from a randomized
field experiment on community-based monitoring in Uganda. Quarterly Journal of
Economics, 124(2), 735-769.
Booth, D. (2010). Towards a theory of local governance and public goods' provision in Sub-
Saharan Africa. Overseas development institute (ODI). Africa power and politics programme
(APPP).
Booth, D. (2012). Development as a collective action problem. Africa Power and Politics
Programme. Policy Brief, 9.
Booth, D., Cooksey, B., Golooba-Mutebi, F., and Kanyinga, K. (2014). East African
Prospects: An update on the political economy of Kenya, Rwanda, Tanzania, and Uganda.
41
Brinkerhoff, D. W., and Wetterberg, A. (2016). Gauging the effects of social accountability
on services, governance, and citizen empowerment. Public Administration Review, 76(2),
274-286.
Bruns, B., Filmer, D., and Patrinos, H. A. (2011). Making schools work: New evidence on
accountability reforms: World Bank Publications.
Buntaine, M. T., Daniels, B., and Devlin, C. (2018). Can information outreach increase
participation in community-driven development? A field experiment near Bwindi National
Park, Uganda. World Development, 106, 407-421.
Caliendo, M., and Kopeinig, S. (2008). Some practical guidance for the implementation of
propensity score matching. Journal of economic surveys, 22(1), 31-72.
Casey, K., Glennerster, R., and Miguel, E. (2011). Reshaping institutions: Evidence on
external aid and local collective action: National Bureau of Economic Research.
Chibita, M., and Fourie, P. J. (2007). A socio-history of the media and participation in
Uganda. Communication, 33(1), 1-25.
Chong, A., De La O, A., Karlan, D., and Wantchekon, L. (2010). Information dissemination
and local governments’ electoral returns, evidence from a field experiment in Mexico. Paper
presented at the Annual Meeting of the American Political Science Association, Seattle.
Coffé, H., and Bolzendahl, C. (2010). Same game, different rules? Gender differences in
political participation. Sex roles, 62(5-6), 318-333.
Corbacho, A., Gingerich, D. W., Oliveros, V., and Ruiz‐Vega, M. (2016). Corruption as a
Self‐Fulfilling Prophecy: Evidence from a Survey Experiment in Costa Rica. American
journal of political science, 60(4), 1077-1092.
Croke, K., Grossman, G., Larreguy, H. A., and Marshall, J. (2016). Deliberate disengagement:
how education can decrease political participation in electoral authoritarian regimes.
American Political Science Review, 110(3), 579-600.
Dawes, R. M. (1980). Social dilemmas. Annual review of psychology, 31(1), 169-193.
De Figueiredo, M. F., Hidalgo, F. D., and Kasahara, Y. (2011). When do voters punish
corrupt politicians? Experimental evidence from Brazil. Unpublished manuscript, UC
Berkeley.
Deininger, K., and Mpuga, P. (2005). Does greater accountability improve the quality of
public service delivery? Evidence from Uganda. World Development, 33(1), 171-191.
Devarajan, S., Khemani, S., and Walton, M. (2013). Can civil society overcome government
failure in Africa? The World Bank Research Observer, 29(1), 20-47.
Devas, N., and Grant, U. (2003). Local government decision‐making—citizen participation
and local accountability: some evidence from Kenya and Uganda. Public Administration and
Development: The International Journal of Management Research and Practice, 23(4), 307-
316.

42
Duflo, E. (2002). Empirical methods. Handout of courses MIT, 14. Unpublished manuscript.
Fearon, J. D. (1999). Electoral accountability and the control of politicians: Selecting good
types versus sanctioning poor performance. Democracy, accountability, and representation, 55
(61).
Fowler, A. (2013). Electoral and policy consequences of voter turnout: Evidence from
compulsory voting in Australia. Quarterly Journal of Political Science 8(2), 159-182
Fox, J. (2007). The uncertain relationship between transparency and accountability.
Development in practice, 17(4-5), 663-671.
Fox, J. (2015). Social accountability: what does the evidence really say? World Development,
72, 346-361.
Francis, P., and James, R. (2003). Balancing rural poverty reduction and citizen participation:
The contradictions of Uganda’s decentralization program. World Development, 31(2), 325-
337.
Fujiwara, T., and Wantchekon, L. (2013). Can informed public deliberation overcome
clientelism? Experimental evidence from Benin. American Economic Journal: Applied
Economics, 5(4), 241-255.
Gaventa, J., and McGee, R. (2013). The impact of transparency and accountability initiatives.
Development Policy Review, 31(1).
Gertler, P. J., Martinez, S., Premand, P., Rawlings, L. B., and Vermeersch, C. M. (2016).
Impact evaluation in practice: The World Bank.
Gottlieb, J. (2016). Greater expectations: A field experiment to improve accountability in
mali. American journal of political science, 60(1), 143-157.
Green, E. (2010). Patronage, district creation, and reform in Uganda. Studies in comparative
international development, 45(1), 83-103.
Grossman, G., and Michelitch, K. (2018). Information Dissemination, Competitive Pressure,
and Politician Performance between Elections: A Field Experiment in Uganda. American
Political Science Review, 1-22.
Heckman, J. J., Ichimura, H., and Todd, P. E. (1997). Matching as an econometric evaluation
estimator: Evidence from evaluating a job training programme. The review of economic
studies, 64(4), 605-654.
Heinrich, C., Maffioli, A., and Vazquez, G. (2010). A primer for applying propensity-score
matching.
Humphreys, M., and Weinstein, J. (2012). Policing politicians: citizen empowerment and
political accountability in Uganda preliminary analysis. Columbia Universities. Unpublished
manuscript.
Imbens, G. W. (2004). Nonparametric estimation of average treatment effects under
exogeneity: A review. Review of Economics and statistics, 86(1), 4-29.

43
Keefer, P., and Khemani, S. (2005). Democracy, public expenditures, and the poor:
understanding political incentives for providing public services. The World Bank Research
Observer, 20(1), 1-27.
Keefer, P., and Khemani, S. (2011). Mass media and public services: the effects of radio
access on public education in Benin. Policy Research Working Paper Series 5559, The World
Bank
Kiyaga-Nsubuga, J., and Olum, Y. (2009). Local Governance and Local Democracy in
Uganda. Commonwealth Journal of Local Governance(2), 26-43.
Kosack, S., and Fung, A. (2014). Does transparency improve governance? Annual Review of
Political Science, 17, 65-87.
Krishna, A. (2006). Poverty and democratic participation reconsidered: Evidence from the
local level in India. Comparative Politics, 439-458.
Lechner, M. (2011). The estimation of causal effects by difference-in-difference methods.
Foundations and Trends® in Econometrics, 4(3), 165-224.
Lieberman, E. S., Posner, D. N., and Tsai, L. L. (2014). Does information lead to more active
citizenship? Evidence from an education intervention in rural Kenya. World Development,
60, 69-83.
Lunt, M. (2013). Selecting an appropriate caliper can be essential for achieving good balance
with propensity score matching. American journal of epidemiology, 179(2), 226-235.
Malena, C., Forster, R., and Singh, J. (2004). Social accountability: an introduction to the
concept and emerging practice. Washington, DC:
Marshak, A. M., D. Opio, J. Gordon, R. and Atim, T. (2017). Tracking change in livelihoods,
service delivery and governance: evidence from a 2013-2015 panel survey in Uganda.
Working paper 59. London: Secure Livelihoods Research Consortium.
McLeod, J. M., Scheufele, D. A., and Moy, P. (1999). Community, communication, and
participation: The role of mass media and interpersonal discussion in local political
participation. Political communication, 16(3), 315-336.
Meyers, G. E. (2014). Decentralization in Uganda: Towards Democratic Local Governance or
Political Expediency? In Challenges to Democratic Governance in Developing Countries (pp.
95-110): Springer.
Mitchinson, R. (2003). Devolution in Uganda: An experiment in local service delivery. Public
Administration and Development, 23(3), 241-248.
O'Donnell, G. A. (1998). Horizontal accountability in new democracies. Journal of
democracy, 9(3), 112-126.
O'Meally, S. C. (2013). Mapping context for social accountability: A resource paper. World
Bank, Washington, DC

44
Olken, B. A. (2007). Monitoring corruption: evidence from a field experiment in Indonesia.
Journal of political Economy, 115(2), 200-249.
Olken, B. A. (2009). Corruption perceptions vs. corruption reality. Journal of Public
economics, 93(7-8), 950-964.
Ostrom, E. (1998). A behavioral approach to the rational choice theory of collective action:
Presidential address, American Political Science Association, 1997. American Political
Science Review, 92(1), 1-22.
Pande, R. (2011). Can informed voters enforce better governance? Experiments in low-
income democracies. Annu. Rev. Econ., 3(1), 215-237.
Paul, S. (1992). Accountability in public services: exit, voice and control. World
Development, 20(7), 1047-1060.
Reinikka, R., and Svensson, J. (2005). Fighting corruption to improve schooling: Evidence
from a newspaper campaign in Uganda. Journal of the European economic association, 3(2-
3), 259-267.
Rosenbaum, P. R., and Rubin, D. B. (1983). The central role of the propensity score in
observational studies for causal effects. Biometrika, 70(1), 41-55.
Rosenbaum, P. R., and Rubin, D. B. (1985). Constructing a control group using multivariate
matched sampling methods that incorporate the propensity score. The American Statistician,
39(1), 33-38.
Saito, F. (2003). Decentralization and development partnership: lessons from Uganda:
Springer Science and Business Media.
Sjögren, A. (2013). Between Militarism and Technocratic Governance: state formation in
contemporary Uganda: Fountain Pub Limited.
Steiner, S. (2006). Decentralisation in Uganda: Exploring the constraints for poverty
reduction. GIGA Working Paper No. 31
Steiner, S. (2007). Decentralisation and poverty: conceptual framework and application to
Uganda. Public Administration and Development: The International Journal of Management
Research and Practice, 27(2), 175-185.
Steiner, S. (2008). Constraints on the implementation of decentralisation and implications for
poverty reduction – The case of Uganda. In decentralisation in africa: a pathway out of
poverty and conflict? Amsterdam University Press.
Strömberg, D. (2004). Radio's impact on public spending. The Quarterly Journal of
Economics, 119(1), 189-221.
Titeca, K. (2005). The political economy of civil society organisations on a local level. Case
study Kasese District, Uganda. Paper presented at the AEGIS Conference.

45
Titeca, K. (2006). Political patronage and political values: the developmental role of political
patronage and its impact on shaping political values in rural Uganda. Afrika Focus, 19(1/2),
43-67.
Tripp, A. M. (2010). Museveni's Uganda: paradoxes of power in a hybrid regime (Vol. 6):
Lynne Rienner Publishers. Boulder, CO.
Tsai, L. L. (2007). Solidary groups, informal accountability, and local public goods provision
in rural China. American Political Science Review, 101(2), 355-372.
Uganda Bureau of Statistics (UBOS, 2016). The National Population and Housing Census
2014 - Main Report. Kampala, Uganda.
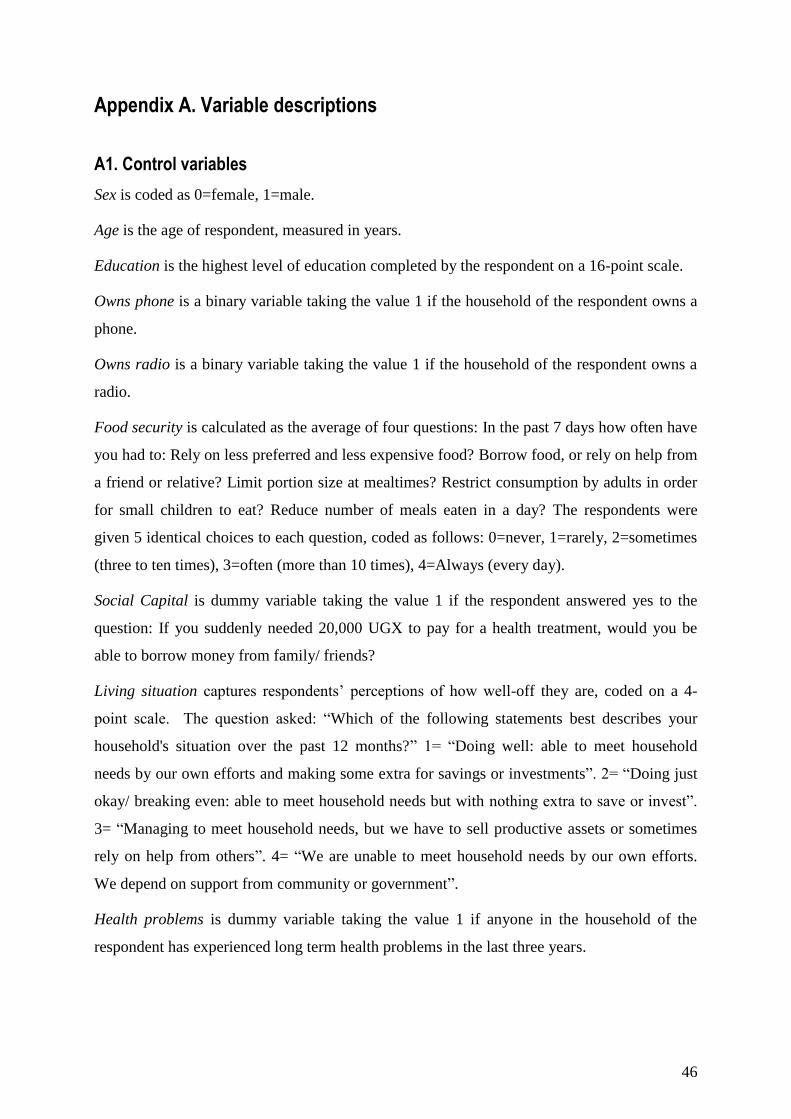
46
Appendix A. Variable descriptions
A1. Control variables
Sex is coded as 0=female, 1=male.
Age is the age of respondent, measured in years.
Education is the highest level of education completed by the respondent on a 16-point scale.
Owns phone is a binary variable taking the value 1 if the household of the respondent owns a
phone.
Owns radio is a binary variable taking the value 1 if the household of the respondent owns a
radio.
Food security is calculated as the average of four questions: In the past 7 days how often have
you had to: Rely on less preferred and less expensive food? Borrow food, or rely on help from
a friend or relative? Limit portion size at mealtimes? Restrict consumption by adults in order
for small children to eat? Reduce number of meals eaten in a day? The respondents were
given 5 identical choices to each question, coded as follows: 0=never, 1=rarely, 2=sometimes
(three to ten times), 3=often (more than 10 times), 4=Always (every day).
Social Capital is dummy variable taking the value 1 if the respondent answered yes to the
question: If you suddenly needed 20,000 UGX to pay for a health treatment, would you be
able to borrow money from family/ friends?
Living situation captures respondents’ perceptions of how well-off they are, coded on a 4-
point scale. The question asked: ―Which of the following statements best describes your
household's situation over the past 12 months?‖ 1= ―Doing well: able to meet household
needs by our own efforts and making some extra for savings or investments‖. 2= ―Doing just
okay/ breaking even: able to meet household needs but with nothing extra to save or invest‖.
3= ―Managing to meet household needs, but we have to sell productive assets or sometimes
rely on help from others‖. 4= ―We are unable to meet household needs by our own efforts.
We depend on support from community or government‖.
Health problems is dummy variable taking the value 1 if anyone in the household of the
respondent has experienced long term health problems in the last three years.

47
NRM councilor is a dummy variable taking the value 1 if an individual lives in a sub-county
that is represented by a regular councilor from the National Resistance Movement at the
district council.
A2. Variables used for heterogeneous treatment effect assessment
Education and living situation follow the description and coding above.
Local government cares about me and my opinions is a binary variable taking the value 1 if
the respondent answered yes to the question: ―Do you agree with the following statement: The
local government cares about me and my opinions?‖
LG decisions reflect my priorities is based on the question: ―To what extent do you feel that
the decisions of the Government in the District and sub-country reflect your own priorities?‖
Respondents were given the options: 1=‖Never‖, 2=‖Almost never‖, 3=‖Only in some areas‖,
4=‖Very much, to a large extent‖, 5= ―Absolutely, always‖.
Service satisfaction only concern health and education services and is based on the questions:
Overall, how satisfied are you with the education services you use? Overall, how satisfied are
you with the quality of service you received in your most recent visit to the health centre or
clinic? In these two questions the respondents were given identical choices: 1=Satisfied,
2=Fairly satisfied, 3=Dissatisfied.

48
Appendix B. Tests for propensity score matching
Figure B1 Propensity scores before and after matching using NN5

49
Figure B2. Propensity scores before and after matching using NN without replacement
Figure B3. Propensity scores before and after matching using NN with a caliper of 0.003
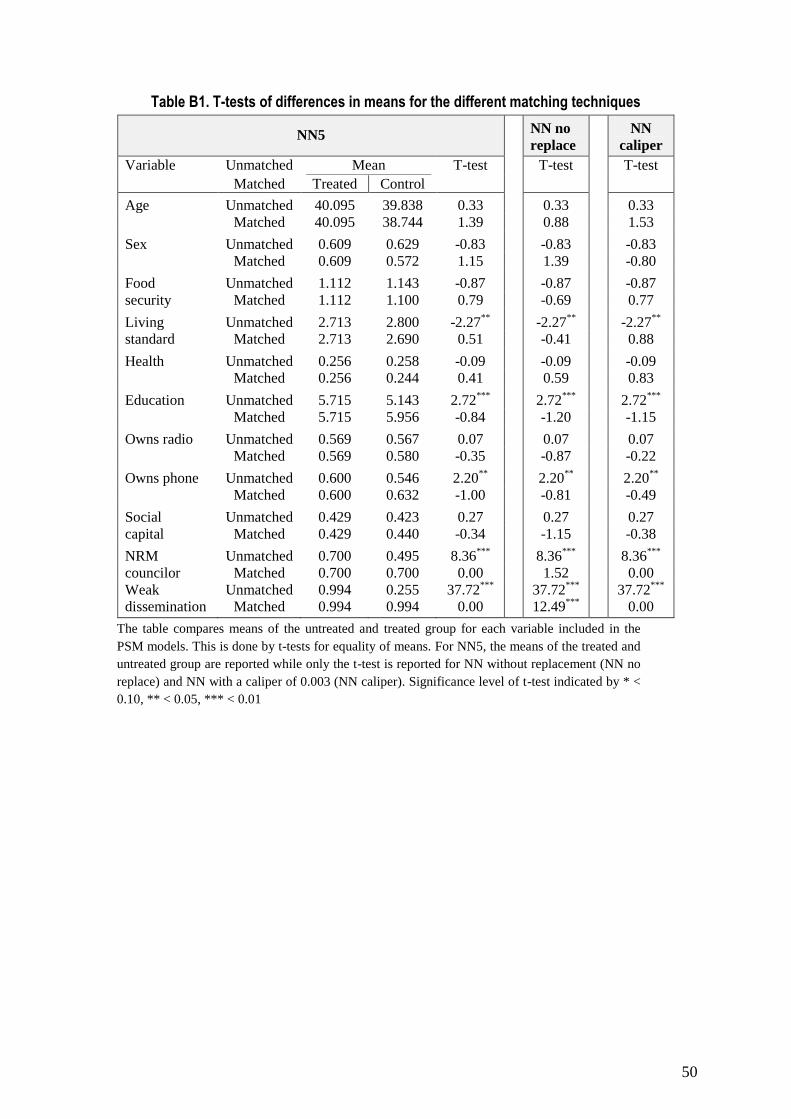
50
Table B1. T-tests of differences in means for the different matching techniques
NN5 NN no
replace
NN
caliper
Variable Unmatched Mean T-test T-test T-test
Matched Treated Control
Age Unmatched 40.095 39.838 0.33 0.33 0.33
Matched 40.095 38.744 1.39 0.88 1.53
Sex Unmatched 0.609 0.629 -0.83 -0.83 -0.83
Matched 0.609 0.572 1.15 1.39 -0.80
Food Unmatched 1.112 1.143 -0.87 -0.87 -0.87
security Matched 1.112 1.100 0.79 -0.69 0.77
Living Unmatched 2.713 2.800 -2.27**
-2.27**
-2.27**
standard Matched 2.713 2.690 0.51 -0.41 0.88
Health Unmatched 0.256 0.258 -0.09 -0.09 -0.09
Matched 0.256 0.244 0.41 0.59 0.83
Education Unmatched 5.715 5.143 2.72***
2.72***
2.72***
Matched 5.715 5.956 -0.84 -1.20 -1.15
Owns radio Unmatched 0.569 0.567 0.07 0.07 0.07
Matched 0.569 0.580 -0.35 -0.87 -0.22
Owns phone Unmatched 0.600 0.546 2.20**
2.20**
2.20**
Matched 0.600 0.632 -1.00 -0.81 -0.49
Social Unmatched 0.429 0.423 0.27 0.27 0.27
capital Matched 0.429 0.440 -0.34 -1.15 -0.38
NRM Unmatched 0.700 0.495 8.36***
8.36***
8.36***
councilor Matched 0.700 0.700 0.00 1.52 0.00
Weak Unmatched 0.994 0.255 37.72***
37.72***
37.72***
dissemination Matched 0.994 0.994 0.00 12.49***
0.00
The table compares means of the untreated and treated group for each variable included in the
PSM models. This is done by t-tests for equality of means. For NN5, the means of the treated and
untreated group are reported while only the t-test is reported for NN without replacement (NN no
replace) and NN with a caliper of 0.003 (NN caliper). Significance level of t-test indicated by * <
0.10, ** < 0.05, *** < 0.01