Embed Size (px)
Citation preview

Powerco Limited Asset Management Plan – Electricity Networks 2006 - 2020
INFORMATION DISCLOSURE
ASSET MANAGEMENT PLAN
ELECTRICITY NETWORKS
2006 – 2020

Powerco Limited Asset Management Plan – Electricity Networks 2006 - 2020
Disclaimer: This document has been prepared to comply with Section 24 of the Commerce Commission’s
Electricity Information Disclosure Requirements 2004. The information in this document has been prepared
in good faith and represents Powerco Limited’s intentions and opinions at the date of issue. Powerco
Limited does not give any assurance, either express or implied, about the accuracy of the information or
whether Powerco Limited will actually implement the plan or undertake any work mentioned in the
documents. None of Powerco Limited, its directors, officers, shareholders or representatives accepts any
liability whatsoever by reason of, or in connection with, any information in this document or any actual or
purported reliance on it by any person. Powerco Limited may change any information in this document at
any time.

Section TOC
Subject Contents
Date Issued 30 June 2005
Page 3
Powerco Limited Asset Management Plan – Electricity Networks 2006 - 2020
CONTENTS
1 Executive Summary ......................................................................................................................................... 5 1.1 Purpose of the Plan ........................................................................................................................ 5 1.2 Period Covered............................................................................................................................... 5 1.3 Asset Management Performance Drivers and Stakeholders Consideration.................................. 5 1.4 Asset Information Systems............................................................................................................. 7 1.5 Asset Description............................................................................................................................ 7 1.6 Performance Level Objectives........................................................................................................ 9 1.7 Maintenance, Renewal and Development Plans.......................................................................... 10 1.8 Performance Measurement, Evaluation and Improvement.......................................................... 11
2 Key Definitions ............................................................................................................................................... 14
3 Background and Objectives .......................................................................................................................... 19 3.1 Purpose of the Plan ...................................................................................................................... 19 3.2 Period Covered by the Plan.......................................................................................................... 19 3.3 Interaction with Corporate Planning and Objectives .................................................................... 19 3.4 Future Review of this Plan............................................................................................................ 20 3.5 Asset Management Overview and Key Drivers............................................................................ 20 3.6 Responsibilities and Accountabilities for Asset Management ...................................................... 23 3.7 Asset Management Process......................................................................................................... 25 3.8 Asset Management Information Systems..................................................................................... 25
4 Details of the Assets ...................................................................................................................................... 30 4.1 Infrastructure Assets..................................................................................................................... 30 4.2 Subtransmission Network Configuration ...................................................................................... 30 4.3 Zone Substation Configuration ..................................................................................................... 34 4.4 Distribution Network Configuration............................................................................................... 34 4.5 Protection and Control .................................................................................................................. 36 4.6 Justification for Assets.................................................................................................................. 38 4.7 The Assets By Category, Age and Condition ............................................................................... 40
5 Performance Levels ....................................................................................................................................... 49 5.1 Introduction ................................................................................................................................... 49 5.2 Levels of Consumer Service Performance................................................................................... 49 5.3 Target Performance for Economic Efficiency............................................................................... 56 5.4 Performance of Contractors ......................................................................................................... 60 5.5 Target Performance for Safety ..................................................................................................... 61 5.6 Target Performance for Environmental Responsibility................................................................. 62 5.7 Risk Management......................................................................................................................... 62
6 Network Development and Lifecycle Asset Management Plan .................................................................. 64 6.1 Introduction ................................................................................................................................... 64 6.2 Planning Criteria – Long Term (Subtransmission) Planning ........................................................ 64 6.3 Planning Criteria – Medium Term (Distribution) Planning ............................................................ 66 6.4 Planning Criteria - Short term (Reticulation) Planning ................................................................. 68 6.5 Load Demand Forecast ................................................................................................................ 69 6.6 Non-Asset Solutions and Distributed Generation......................................................................... 78 6.7 Adoption of New Technology........................................................................................................ 79

Section TOC
Subject Contents
Date Issued 30 June 2005
Page 4
Powerco Limited Asset Management Plan – Electricity Networks 2006 - 2020
6.8 Acquisition of New Assets ............................................................................................................ 79 6.9 Redeployment, Upgrade and Disposal of Existing Assets ........................................................... 79 6.10 Long Term Development Plan (Subtransmission Development Plan) ..................................... 80 6.11 Medium Term Development Plan (Distribution)...................................................................... 107 6.12 Reticulation Planning .............................................................................................................. 110 6.13 Protection and Control System Development Plan ................................................................ 110 6.14 Lifecycle Asset Plan (Maintenance and Renewal Plan) ......................................................... 113 6.15 Statutory Compliance.............................................................................................................. 128 6.16 Development, Renewal and Maintenance Expenditure Forecasts......................................... 129 6.17 Network Service Provision Activities....................................................................................... 133
7 Risk Management......................................................................................................................................... 136 7.1 Risk Management Charter.......................................................................................................... 136 7.2 Risk Management Profiles.......................................................................................................... 136 7.3 Risk Management Process......................................................................................................... 138 7.4 Conclusions from Risk Analysis ................................................................................................. 144
8 Performance Measurement and Review..................................................................................................... 148 8.1 Introduction ................................................................................................................................. 148 8.2 Review of Previous Plans........................................................................................................... 148 8.3 Review of Service Performance Against Targets....................................................................... 148 8.4 Review of Economic Efficiency Performance Against Targets .................................................. 165 8.5 Review of Safety Performance................................................................................................... 168 8.6 Review of Environmental Performance...................................................................................... 168 8.7 Review of Physical Performance Against Plan .......................................................................... 168 8.8 Review of Financial Progress Against Plan................................................................................ 171 8.9 Review of Progress Against Risk Management Activities.......................................................... 172 8.10 Improvement Initiatives ........................................................................................................... 172
Appendix 1: Excerpts from Risk Management Charter ........................................................................................ 174 Background........................................................................................................................................... 174 Risk Management Policy ...................................................................................................................... 174 Risk Management Overview................................................................................................................. 175 Plans, Monitoring and Reporting .......................................................................................................... 178
Appendix 2: Subtransmission Maps ...................................................................................................................... 184
Section 1
Subject Executive Summary
Date Issued 30 June 2005
Page 5
Powerco Limited Asset Management Plan – Electricity Networks 2006 - 2020
1 EXECUTIVE SUMMARY
1.1 Purpose of the Plan Powerco’s electricity network assets range in age from new to over 50 years old. The
management of these assets is critical for Powerco to provide an efficient and effective
electricity distribution service to its consumers and customers. This asset management plan
intends to demonstrate responsible management of the electricity network assets by Powerco
on behalf of its customers, consumers and shareholders.
A fundamental requirement for effective development and management of an electricity
network is effective network planning. The Asset Management Plan (AMP) is the documented
output of network planning, and provides short and long range planning direction for network
development, renewal and maintenance.
The objective of the Asset Management Plan and the asset management process is to ensure
that the needs of all stakeholders are properly considered and incorporated into the long term
development, maintenance and operating strategies, and to ensure that the plans prepared
provide the optimum balance between the level of service and economic efficiency (asset
investment/utilisation and maintenance and operating costs).
The Asset Management Plan is a key input into the corporate planning process. Conversely,
key corporate objectives influence the direction of the asset management process.
1.2 Period Covered This Asset Management Plan covers a period of 15 years from the financial year beginning on
1 April 2005 until the year ending 31 March 2020. It updates the July 2004 issue of the Asset
Management Plan. The main focus of analysis is the first three to five years. Beyond this
general forecasts are made which are reviewed annually. Expenditure forecasts cover a ten-
year period from FY2006 to FY2015.
1.3 Asset Management Performance Drivers and Stakeholders Consideration The primary purpose of the asset management process at Powerco is to deliver the required
level of service in an economically efficient manner that meets the needs of stakeholders. A
balancing of the key drivers is required to achieve this purpose.
The key asset management drivers are:
Service performance: the delivery of “electricity line function” service. The key elements of
this service are:
• Reliability of supply: The frequency and duration of supply interruptions;

Section 1
Subject Executive Summary
Date Issued 30 June 2005
Page 6
Powerco Limited Asset Management Plan – Electricity Networks 2006 - 2020
• Capacity of supply: The ability of the network to supply the load required; and,
• Quality of the supply: Voltage level, waveform quality and momentary fluctuations.
Economic efficiency: the delivery of the service through the best use of capital and other
resources, considering the opportunity cost of doing so. The key factors that drive economic
efficiency are:
• Asset investment: The level of capital investment in the assets required to deliver the
service. The key performance driver is the level of asset utilisation; and,
• Cost: The overhead, operating and maintenance costs associated with the network
assets.
Safety, environmental responsibility and risk management: important drivers for
delivering long term value to the owners and maintaining the integrity of the network.
Productivity and commercial efficiency: delivery of the “asset management” service in a
productive, efficient and commercially prudent manner. This is an inherent driver that has
been separated out for clarity and focus.
To deliver on the primary purpose of asset management, the asset manager needs to balance
service, cost and asset investment. Figure 1.1 below illustrates the relationship between the
main stakeholders, drivers, and the asset management process.
Asset Management Process
Economic Efficiency
Development, RenewalMaintenance, Operation
Assets
SafetyEnvironmental
Risk Management
ProductivityCommercial Efficiency
Service[Price]
Long Term ValueEconomic Efficiency
Asset Performance
Consumers OwnersGovernment
Figure 1.1: The Asset Management Process Overview and Key Drivers
During FY2004 and FY2005 Powerco undertook consultation with its customers, consumers
and consumer groups. The needs of these stakeholders are being considered and
incorporated into the planning process and the Asset Management Plan.

Section 1
Subject Executive Summary
Date Issued 30 June 2005
Page 7
Powerco Limited Asset Management Plan – Electricity Networks 2006 - 2020
Powerco has also been actively participating in the development of the electricity industry
structure and consultation on government/regulator direction. The Asset Management Plan
has been reviewed to ensure these industry drivers are properly considered.
1.4 Asset Information Systems Powerco’s asset management information systems consist of its geographical information
system (GIS), maintenance and works management system, financial system, SCADA system
and ancillary systems.
The asset management information system development has continued during FY2005 and
further enhancements are proposed during FY2006.
1.5 Asset Description For the purposes of this plan the network assets are the electricity infrastructure assets.
These include all network fixed assets, subtransmission network, zone substations, high
voltage distribution networks, distribution substations, switchgear and transformers, low
voltage (LV) distribution networks including consumer service connections, protection,
SCADA, load control injection systems and communication systems. Excluded from the
network assets are land and buildings, except zone substation land and buildings, most
consumer revenue meters and most load control relays, which are currently owned by Energy
Retailers, non-network fixed assets such as motor vehicles, furniture and office equipment,
plant, tools, net financial assets, stores and spares.
Powerco has extensive urban and rural networks serving Taranaki, Wanganui, Rangitikei,
Manawatu, Tararua, Wairarapa, Tauranga and western Bay of Plenty, Coromandel and
Thames Valley south to Tokoroa.
The network comprises a subtransmission network, mostly 33kV but with some 66kV,
supplying 101 zone substations. These are mostly 33/11kV, but a few are 33/6.6kV or
66/11kV. Some supply 22kV from 11/22kV transformers. A radial feeder network runs from
the zone substations throughout the service area. Zone substation transformer capacities
range from 1.25MVA to 24MVA.
The majority of the networks are of overhead construction, on wood or concrete poles, but
there are some cabled routes or sections of routes. Short lengths of 33kV cable are used at
some zone substations.
The 11kV networks in the Tauranga, New Plymouth, Wanganui, Palmerston North and
Masterton Central Business Districts consist of highly interconnected radial feeders and the
400V networks consist of radial circuits with a high degree of interconnection.

Section 1
Subject Executive Summary
Date Issued 30 June 2005
Page 8
Powerco Limited Asset Management Plan – Electricity Networks 2006 - 2020
Both high voltage and 400V urban distribution networks are interconnected radial systems.
The level of interconnection is moderate, commensurate with reliability requirements. The
network configuration for large industrial consumers is commensurate with the nature of the
consumer’s operation and capacity demand.
The rural network consists mainly of distribution voltage networks with isolators installed every
few kilometres. There is some interconnection between feeders to allow backfeeding in
maintenance and fault situations. Typically, around 70-80% of the feeder load can be supplied
by backfeeding from adjacent feeders.
The remote rural feeders are radial with limited interconnection between adjacent feeders.
There is a significant highly interconnected distribution network owned and operated by
Powerco supplying Carter Holt Harvey’s mill at Kinleith.
The condition of all infrastructure assets is maintained to a level commensurate with the
nature of the asset, the environmental conditions and the consumers’ reliability requirements.
Table 1.1 summarises the average standard life and average age for different asset
categories. An average standard life is given for each asset category as there are assets with
different standard lives included in the general asset categories.
Table 1.1: Average Age of Assets
Asset Category Average Design Life (Weighted by Cost)
Average Age at 31/03/04 (Weighted by Cost)
Distribution Transformer 55 23 Underground Cable 50 21 Overhead Line 57 27 Zone Substation Assets 45 33 Subtransmission & Distribution Switchgear 37 22
The age profile for the entire infrastructure asset base, presented as a nine year moving
average, is given in Figure 1.2 below. This figure has been revised since last year’s AMP
using the 2004 ODV values. It reflects the ODV valuation handbook requirements for valuing
assets. Actual replacement cost will vary from these projections due to additional costs
associated with piece meal replacement (rather than Greenfield construction) and conditions
specific to the work undertaken.

Section 1
Subject Executive Summary
Date Issued 30 June 2005
Page 9
Powerco Limited Asset Management Plan – Electricity Networks 2006 - 2020
Total Asset Replacement Cost vs Age
$0
$10,000
$20,000
$30,000
$40,000
$50,000
$60,000
0 1 2 3 4 5 6 7 8 9 10 11 12 13 14 15 16 17 18 19 20 21 22 23 24 25 26 27 28 29 30 31 32 33 34 35 36 37 38 39 40 41 42 43 44 45 46 47 48 49 50 51 52 53 54 55 56 57 58 59 60 61 62 63 64 65 66 67 68 69O
DL
Age (Years)
Rep
lace
men
t C
ost
($0
00)
SubstationsSwitchesTransformersCableOverhead Line
Figure 1.2: Total Asset Replacement Cost vs Age
1.6 Performance Level Objectives The levels of service adopted by Powerco for its asset management plan are based on the
internationally recognised measurements, SAIDI, CAIDI, and SAIFI and accepted New
Zealand lines companies’ ‘best practice’. These criteria, which are described below, have
been adopted as a starting point for asset management planning.
The target levels of service chosen are based on a balance of past practice; consultation with
end user groups, economic factors, recognised international best practice and safety
considerations. These criteria have been refined over recent years to reflect the direction
indicated by government reviews involving all facets of the industry, consumer groupings, and
individual submissions, conducted during the industry restructuring process. In setting these
criteria Powerco believes it achieves an appropriate balance between legislative, regulatory,
owner requirements and consumer expectations.
For the purpose of this plan, it is assumed that the consumer’s needs will be satisfied if
Powerco meets its Service Performance targets. Service Performance is defined as:
“Delivery of electricity line function services to meet consumer load
requirements within targeted quality and reliability limits”.
The values set for the reliability indicators SAIDI, CAIDI and SAIFI are given in Table 1.2
below. The near-term targeted level of reliability has increased over previous years to reflect a
more realistic target given current weather patterns.

Section 1
Subject Executive Summary
Date Issued 30 June 2005
Page 10
Powerco Limited Asset Management Plan – Electricity Networks 2006 - 2020
Table 1.2: Reliability Performance Targets
SAIFI (B+C) SAIDI (B+C) CAIDI (B+C) 2.50 150 60
Note: (B + C) refers to total distributor reliability; including planned
outages (class B) and unplanned outages (class C).
The economic efficiency driver is arguably the most significant of all asset management
drivers and consideration and balance between service and economic efficiency (asset
investment/utilisation and maintenance and operating costs) needs to be considered in asset
management decision making. Powerco has processes in place to ensure the economic
efficiency and other stakeholder needs are properly considered in decision making.
1.7 Maintenance, Renewal and Development Plans This Asset Management Plan describes the plans for the development, renewal, maintenance
management, reliability assessment, and associated lifecycle management processes of the
network asset.
Development of the subtransmission network, distribution network and 400V distribution
network over the planning period is determined from the asset management drivers, planning
criteria and forecast load growth. Where drivers or planning criteria are not satisfied,
development options are evaluated and programmed. Development plans have been
prepared for the long and medium term planning periods.
Powerco’s maintenance and renewal policy is based on balancing the cost of repair and
replacement against the consequences of failure. The maintenance and renewal planning
process determines the most cost-effective method for reducing the risk of the asset not
achieving the required performance level.
Powerco’s maintenance and renewal comprises:
• Routine inspections and condition monitoring;
• Routine servicing;
• Evaluation of inspection and condition monitoring results to determine maintenance and
renewal requirements;
• Evaluating faults to predict maintenance and renewal requirements; and,
• Performing maintenance (repairs), or renewal.
The decision to continue to maintain an asset or to renew it is made considering the ongoing
costs of maintaining the existing assets versus the cost of renewing the asset, including the
risks of not meeting performance requirements in each case.

Section 1
Subject Executive Summary
Date Issued 30 June 2005
Page 11
Powerco Limited Asset Management Plan – Electricity Networks 2006 - 2020
Individual asset lifecycle plans are prepared for each asset type, and the schedules for
maintenance and renewal of the network assets are derived from these.
The forecast expenditure, including development, renewal, operating and maintenance, over
the planning period, is given in Table 1.3 below.
The network development expenditure forecasts are similar to those made in the July 2004
AMP, with the following differences:
• Revision of renewal expenditure between FY2010 and FY2015 to better reflect the age
profile;
• Eastern Region Customer Initiated Work expenditures remain at similar levels throughout
the planning period to reflect a rapid growth scenario that is forecast to be long term
rather than short lived;
• Real operational expenditures increase after FY2010 because of the need to carry out
more maintenance on the aging asset base;
• Reduction in utility rating costs; and,
• Alignment of maintenance expenditure to Powerco’s revised maintenance standards and
schedule.
Table 1.3: Network Expenditure Summary
Expenditure 2006 2007 2008 2009 2010 Capital Expenditure 44,633,895 44,824,472 46,220,362 47,694,455 49,393,632 Operations & Maintenance 21,330,971 22,147,504 22,995,350 23,875,713 24,789,842 Total 65,964,866 66,971,975 69,215,712 71,570,168 74,183,473
Expenditure 2011 2012 2013 2014 2015 Capital Expenditure 52,663,929 55,342,375 58,301,767 61,585,962 65,246,972 Operations & Maintenance 25,523,441 26,278,817 27,056,618 27,857,512 28,682,186 Total 78,187,370 81,621,192 85,358,386 89,443,474 93,929,158
Note: 1. The year refers to financial year-end 30 June. The expenditure has been stated in nominal terms (CPI=2%). 2. Operations and maintenance expenditures include Asset Management, network operating centre and utility
rates as well as network maintenance.
1.8 Performance Measurement, Evaluation and Improvement Powerco’s overall network reliability performance as measured by SAIDI was 32% above
target (unfavourable), partly due to a number of extreme weather events. However, with the
exclusion of the three extreme weather events Powerco’s network reliability was only 10%
above target, which is a very good result considering the sustained periods of poor weather
throughout FY2005, (refer to section 3.4 of Powerco Limited Threshold Compliance Statement
2005, 20 May 2005). This is also an improvement of the post-extreme weather performance
over FY2004.
The three extreme weather events experienced during FY2005 were:

Section 1
Subject Executive Summary
Date Issued 30 June 2005
Page 12
Powerco Limited Asset Management Plan – Electricity Networks 2006 - 2020
• Tornado near Waitara on 15 August 2004: with its severe and wide destruction path;
• Snow storms in the Taihape area from 17 August to 24 August 2004, containing rime ice.
The snow and ice caused damage to the network and transport and access were
adversely affected; and,
• Downbursts near Te Puke on 25 March 2005. Downbursts are enormously powerful
vertical gusts of wind from within a thunderstorm, exploding downwards and accelerating
horizontally along the ground when they hit the earth surface.
Powerco’s network in the Taihape and Waiouru areas experienced significant damage to
equipment and some consumers were without power for extended periods of time. The
customer minutes lost due to this storm are illustrated in Figure 1.3 below:
Significant Effects on SAIDI
0
2
4
6
8
10
12
14
16
18
1-A
pr
15-A
pr
29-A
pr
13-M
ay
27-M
ay
10-J
un
24-J
un
8-Ju
l
22-J
ul
5-A
ug
19-A
ug
2-S
ep
16-S
ep
30-S
ep
14-O
ct
28-O
ct
11-N
ov
25-N
ov
9-D
ec
23-D
ec
6-Ja
n
20-J
an
3-F
eb
17-F
eb
3-M
ar
17-M
ar
31-M
arFortnight Ending
SA
IDI (
Cu
sto
mer
min
s/to
tal I
CP
s)
High winds and snow storms predominantly in Eastern and Central districts
Lightning storm and tornado in Eastern Region
Equipment failure on 66kV feeder in Coromandel region
High winds causing many tree/line contacts
High winds causing tree contacts in Wanganui region and equipment failure in Masterton
High winds, tornado and lightning in Taranaki region
Tree fell onto 66kV line in Coromandel region
Strong winds, tornado and poles down in Eastern region
Major fault on 33kV line in Putaruru
Equipment failure in Valley and Eastern regions
Figure 1.3: SAIDI Performance vs Time
In addition, the individual feeder performance has improved with 86% of feeders performing
within target, an improvement of 12% over FY2004. Improving network reliability remains a
key theme of development projects throughout the network.
Powerco’s ODRC/ICP for FY2005 was $3,085/ICP compared to Powerco’s target ODV/ICP
of $3000 / ICP.
Asset utilisation is a key driver of long-term asset efficiency. Powerco performance against its
targets was good. The load factor and substation transformer utilisation were in the good
performing range when compared to national and international benchmarks.

Section 1
Subject Executive Summary
Date Issued 30 June 2005
Page 13
Powerco Limited Asset Management Plan – Electricity Networks 2006 - 2020
Powerco’s preliminary direct cost performance for FY2005 was $1052/km (the final figure has
yet to be audited). Powerco is in the good performing category when compared to the
industry whose average direct costs per km is $1,181/km.
In FY2005, capital expenditure was 28% behind planned budget at year-end. Traction on
completing the capital programme was poor due to field resources constraints. These
constraints are not just a Powerco issue but are an industry issue and will be given specific
attention during coming year with uncompleted projects being incorporated into the FY2006
plan.

Section 2
Subject Key Definitions
Date Issued 30 June 2005
Page 14
Powerco Limited Asset Management Plan – Electricity Networks 2006 - 2020
2 KEY DEFINITIONS
Adequacy means the ability of the electrical power network to meet the load demands under
varying steady state conditions whilst not exceeding component ratings and voltage limits.
AMP means Asset Management Plan.
Availability means the fraction of time a component is able to operate as intended, either
expressed as real fraction, or as hours per year.
CAIDI (Consumer Average Interruption Duration Index) means the average duration of an
interruption of supply per consumer who experienced an interruption in the period under
consideration. The classes of CAIDI are: class A, Transpower planned outages; class B,
Powerco planned outages; class C, Powerco unplanned outages; and class D, Transpower
unplanned outages. CAIDI is measured in minutes per interruption.
Capital Expenditure (Capex) means the expenditure used to create new assets or to
increase the service performance or service potential of existing assets beyond the original
design service performance or service potential. Capex increases the value of the asset stock,
and is capitalised in accounting terms. It is subdivided into two classes, development
expenditure and renewal expenditure, as defined below.
Class Capacity means the capacity of the lowest rated incoming supply to a substation plus
the capacity that can be transferred to alternative supplies on the distribution network within
the time frame required by the substation security classification.
Consumer means an entity that receives electricity supply through a connection to Powerco’s
network, but is charged for the connection by an electricity retailer.
Contingency means the state of a system in which one or more primary components are out
of service. The contingency level is determined by the number of primary components out of
service. A "k-Level'' contingency is thus the state of a system in which exactly k primary
components are out of service.
Customer means an electricity retailer or a consumer who obtains an electricity network
connection directly from Powerco rather than through an electricity retailer. In this plan, the
title consumer is generally used, and can for the most part be considered to be inclusive of
customers.

Section 2
Subject Key Definitions
Date Issued 30 June 2005
Page 15
Powerco Limited Asset Management Plan – Electricity Networks 2006 - 2020
Cyclic Loading is defined in IEC 354 as “Loading with cyclic variations (the duration of the
cycle usually being one day), which is regarded in terms of the average amount of ageing that
occurs during the cycle. The cyclic loading may either be a normal loading, or a long-time
emergency loading”.
Development means activities to either create a new asset or to materially increase the
service performance or potential of an existing asset.
Design Life means the period of time over which the future economic benefits (service
performance or potential) embodied in an asset is designed to be consumed, or the total
economic benefits, expressed in terms of production or similar units, that are designed to be
obtained.
Distribution Transformer means a transformer which steps distribution voltage, generally
11kV but in some cases 6.6kV or 22kV, to 400/230 volts. It has no forced cooling or on-load
tap changing.
Eastern Region is the part of Powerco’s electricity network supplying Tauranga, Western Bay
of Plenty, Coromandel Peninsula and the area immediately to the west of the Kaimai and
Mamaku ranges as far south as Kinleith (refer to Appendix 2).
Economic Life means the period from the acquisition of the asset to the time when the asset,
while still capable of providing a service, ceases to be the lowest cost alternative to satisfy a
particular level of service.
Failure means an event in which a component does not operate or ceases to operate as
intended. An example of the first kind is a circuit breaker that fails to trip; an example of the
second kind is a transformer that is tripped by its Buchholz relay.
FIDI (Feeder Interruption Duration Index) means the total duration of interruptions of supply
that a consumer experiences in the period under consideration on a distribution feeder. FIDI is
measured in minutes per customer per year.
Firm Capacity means the capacity of the lowest rated alternative incoming supply to a
substation (in the case of a single supply substation it is zero).
Forced Outage means the unplanned loss of electricity supply due to one or more network
component failures.
GXP means any transmission grid exit point from which Powerco takes supply.

Section 2
Subject Key Definitions
Date Issued 30 June 2005
Page 16
Powerco Limited Asset Management Plan – Electricity Networks 2006 - 2020
ICP means installation control point, which is the point of connection of a consumer to the
Powerco network.
Interruption means an unplanned loss of electricity supply of one minute or longer, affecting
three or more ICPs, due to an outage on the network.
Maintenance means activities necessary for retaining an asset as near as practical to its
original condition, but excluding renewal of the asset. Replacement of sub-components of an
asset can be considered maintenance in this context.
Long-time Emergency Cyclic Loading is defined in IEC 354 as “Load resulting from the
prolonged outage of some system elements that will not be reconnected before a steady state
temperature rise is reached in the transformer. This is not a normal operating condition and
its occurrence is expected to be rare, but it may persist for weeks or even months and can
lead to considerable ageing. However, it should not be the cause of breakdown due to
thermal distribution or reduction of dielectric strength”.
Outage means a loss of electricity supply.
Redundant Unit means a component whose outage will not lead to a loss of electricity
supply, but for which at least one contingency state exists for which its outage will lead to a
loss of electricity supply.
Refurbishment means activities to rebuild or replace parts or components of an asset, to
restore it to a required functional condition and extend its life beyond that originally expected
(which may incorporate some modification). Refurbishment is a renewal activity.
Reliability Assessment means determining the optimum solution to any required network
reinforcement by quantifying the benefits of proposed works and/or enabling a quantitative
comparison of alternative system configurations.
Renewal means activities to replace an existing asset with one of equivalent service
performance capability.
Repair means the restoration of the functionality of a network component, either by replacing
parts or by rectifying faults.
Repair Time means the time taken to restore an unserviceable network component to
satisfactory performance.

Section 2
Subject Key Definitions
Date Issued 30 June 2005
Page 17
Powerco Limited Asset Management Plan – Electricity Networks 2006 - 2020
Replacement means the complete replacement of an asset that has reached the end of its
life, to provide a similar or agreed alternative level of service.
SAIDI (System Average Interruption Duration Index) means the average total of interruptions
of supply that a consumer experiences in the period under consideration. The classes of
SAIDI are: class A, Transpower planned outages; class B, Powerco planned outages; class C,
Powerco unplanned outages; and class D, Transpower unplanned outages.
SAIFI (System Average Interruption Frequency Index) means the average number of
interruptions of supply that a consumer experiences in the period under consideration. The
classes of SAIFI are: class A, Transpower planned outages; class B, Powerco planned
outages; class C, Powerco unplanned outages; and class D, Transpower unplanned outages.
Scheduled Outage or Planned Outage means a planned loss of electricity supply.
Security means the ability of the network to meet the service performance demanded of it
during and after a transient or dynamic disturbance of the network or an outage to a
component of the network.
Service Performance means the level of electricity supply service delivered in terms of
quality, capacity and reliability.
Service Potential means the total expected future service performance of an asset. It is
normally determined by reference to the service performance and economic life of similar
assets.
Service Provider means a contractor or business that supplies a service to Powerco.
Short-time Emergency Loading is defined in IEC 354 as “Unusually heavy loading due to
the occurrence of one or more unlikely events which seriously disturb normal system loading,
causing the conductor hot spots to reach dangerous levels and, possibly, a temporary
reduction in the dielectric strength. However, acceptance of this condition for a short time may
be preferable to other alternatives. This type of loading is expected to occur rarely, and it must
be rapidly reduced or the transformer disconnected within a short time in order to prevent its
failure. The permissible duration of this load is shorter than the thermal time constant of the
transformer and depends on the operating temperature before the increase in the loading;
typically, it would be less than half an hour”.
Switching Time means the time delay between a forced outage and restoration of power by
switching on the network.

Section 2
Subject Key Definitions
Date Issued 30 June 2005
Page 18
Powerco Limited Asset Management Plan – Electricity Networks 2006 - 2020
Western Region is the part of Powerco’s network supplying the Taranaki, Wanganui,
Manawatu and Wairarapa areas (refer to Appendix 2).

Section 3
Subject Background and Objectives
Date Issued 30 June 2005
Page 19
Powerco Limited Asset Management Plan – Electricity Networks 2006 - 2020
3 BACKGROUND AND OBJECTIVES
3.1 Purpose of the Plan Powerco’s electricity network assets range in age from new to over 50 years old. The
management of these assets is critical to Powerco providing an efficient and effective service
to its consumers. This asset management plan is intended to demonstrate responsible
management of the electricity network assets by Powerco on behalf of its customers,
consumers, owners and other stakeholders.
A fundamental requirement for effective development and management of an electricity
network is effective network planning. The Asset Management Plan (AMP) is the documented
output of network planning, and provides short and long range planning direction for network
development, renewal and maintenance.
The objective of the Asset Management Plan and the asset management process is to ensure
that the needs of all stakeholders are properly considered and incorporated into the long term
development, renewal, maintenance and operating strategies, and to ensure that the plans
prepared provide the optimum balance between the level of service and economic efficiency
(asset investment/utilisation and maintenance and operating costs).
3.2 Period Covered by the Plan This Asset Management Plan covers a period of fifteen years beginning on 1 April 2005 and
continuing to 31 March 2020. It updates the July 2004 issue of the Asset Management Plan.
It no longer coincides with Powerco’s financial year which now runs from 1 July to 30 June.
The main focus of analysis is the first three to five years. Beyond this general forecasts are
made which are reviewed annually. Expenditure forecasts cover a ten-year period from
FY2006 to FY2015.
3.3 Interaction with Corporate Planning and Objectives
The Asset Management Plan is a key input into the corporate planning process. Conversely,
key corporate objectives influence the direction of the asset management process. The
interface between corporate planning and asset management planning occurs at executive
team and Board level. The executive team and the Board review both the Asset Management
Plan and the company business plan. The General Manager Network Assets or other
members of the executive team address any issues or conflicts between the two plans.
The objectives of this Asset Management Plan are aligned to Powerco’s corporate vision,
mission and strategy.

Section 3
Subject Background and Objectives
Date Issued 30 June 2005
Page 20
Powerco Limited Asset Management Plan – Electricity Networks 2006 - 2020
3.4 Future Review of this Plan This plan is continuously reviewed and updated as fresh data becomes available. Formal
reviews are carried out annually, in line with other Powerco business plans. The development
strategies are reviewed to ensure that they keep pace with changing load patterns, and the
maintenance strategies are reviewed as technology and techniques develop.
3.5 Asset Management Overview and Key Drivers
3.5.1 Purpose of Asset Management
The primary purpose of the asset management process at Powerco is to deliver a high
standard of service from the infrastructure assets in an economically efficient manner that
meets the needs of the stakeholders. A balance between the key drivers is required to
achieve this purpose (refer to figure 3.1).
3.5.2 Asset Management Performance Drivers
A summary of the key asset management drivers is given below:
Service performance is the delivery of “electricity line function” service. The key elements of
service in this context are:
• Reliability of supply: The frequency and duration of supply interruptions;
• Capacity of supply: The ability of the network to supply the load required; and,
• Quality of the supply: Voltage level, waveform quality and momentary fluctuations.
Economic efficiency: The delivery of the service through the best use of capital and other
resources, considering the opportunity cost of doing so. The key factors that drive economic
efficiency are:
• Asset investment: The level of capital investment in the assets to deliver the service. The
key performance driver is the level of asset utilisation; and,
• Cost: The overhead, operating and maintenance costs associated with the network
assets.
Safety, environmental responsibility and risk management: important drivers to maintain
long-term value to shareholders and the integrity of the network.
Productivity and commercial efficiency: The delivery of the “asset management” service in
a productive/efficient and commercially prudent manner. This is an inherent driver that has
been separated out for clarity and focus.
To deliver the primary purpose of asset management, the asset manager must balance
service, cost and asset investment to best meet stakeholder needs.

Section 3
Subject Background and Objectives
Date Issued 30 June 2005
Page 21
Powerco Limited Asset Management Plan – Electricity Networks 2006 - 2020
3.5.3 Stakeholder Interests in the Asset Management Process
The diagram below illustrates the relationship between the main stakeholders and drivers and
the asset management process. Each of the key stakeholder groups is discussed below.
Asset Management Process
Economic Efficiency
Development, RenewalMaintenance, Operation
Assets
SafetyEnvironmental
Risk Management
ProductivityCommercial Efficiency
Service[Price]
Long Term ValueEconomic Efficiency
Asset Performance
Consumers OwnersGovernment
Figure 3.1: Asset Management Process Overview and Key Drivers
3.5.3.1 Powerco’s Customers and End-Use Consumers
Powerco’s consumers are the people, organisations and businesses that rely on Powerco for
the delivery of electricity. They wish to receive a safe, reliable, high quality supply of electricity
at the lowest possible price.
Except for new connection work and certain large consumers having direct connection
contracts with Powerco, the energy retailers manage the interests of the consumers. Service
levels, pricing and other consumer issues are addressed in the retailer Use of System
Agreements agreed between retailers and Powerco. Powerco consults with retailers and end-
use customers over price and service trade-offs. These processes will be particularly relevant
when step changes in services are possible in conjunction with renewal or development
projects.
For new connection work the consumer deals with an approved contractor, and any planning
related issues are addressed between the contractor, consumer and Powerco.
3.5.3.2 Powerco Owners
Powerco’s owners wish to ensure that their financial returns are commensurate with the risk of
their investment. This is achieved by ensuring that the development, operation and
maintenance of the network are optimised to enable an appropriate level of return, while
maintaining an acceptable risk profile for the investment.

Section 3
Subject Background and Objectives
Date Issued 30 June 2005
Page 22
Powerco Limited Asset Management Plan – Electricity Networks 2006 - 2020
3.5.3.3 Government
The key government regulatory agencies that have jurisdiction over Powerco’s activities
include the Commerce Commission, the Ministry of Economic Development and the Electricity
Commission. The key driver from the Government is outlined in the following government
policy statement.
“The Government's overall objective is to ensure that electricity is
delivered in an efficient, fair, reliable and environmentally sustainable
manner to all classes of consumer. Industry arrangements should
promote the satisfaction of consumers' electricity requirements in a
manner which is least cost to the economy as a whole and is consistent
with sustainable development”.
The Commerce Commission is responsible for the administration of the Information Disclosure
Regime. The Commerce Commission has also adopted a price path threshold and a quality
threshold, which apply from 1 April 2004 for a 5-year regulatory period. These thresholds are
intended to provide incentives for lines businesses to maintain the quality of their services
while reducing prices in real terms.
The Electricity Commission now has jurisdiction over Powerco’s activities as they relate to the
electricity industry structure, including terms of access to the grid, use of system agreements
with retailers and pricing methodology. It is the Government’s stated intention to transfer the
responsibility for electricity distribution economic regulation from the Commerce Commission
to the Electricity Commission at some point in the future dependant on certain conditions
being met.
The Ministry of Economic Development maintains responsibility for promotion of safety in the
electricity industry through the Energy Safety Service and registration of ongoing competence
of electrical workers.
3.5.3.4 Other Stakeholders
Other stakeholders with an interest in Powerco’s asset management include employees and
service providers who work on the network, the public over whose land the distribution
network is built, the electricity industry and any local and central government authorities that
have jurisdiction over Powerco’s activities. The input these parties have into the Asset
Management Plan is addressed at various stages of the planning process. Powerco is also
involved in a range of different community projects and activities.

Section 3
Subject Background and Objectives
Date Issued 30 June 2005
Page 23
Powerco Limited Asset Management Plan – Electricity Networks 2006 - 2020
3.5.4 Balancing Conflicting Interests Between Stakeholders
At times, different stakeholders can have opposing interests. The natural question arises, how
do we balance the needs of different stakeholders?
At a strategy level, the needs and interests are evaluated and considered as part of the
corporate planning process. The output of this and investment policy that is applied during the
planning process (refer Figure 3.3).
At a tactical and operational level, the investment policy and asset strategy shapes Powerco’s
multi-stakeholder assessment process for projects, that is, criteria and weighting is amended
based on corporate strategy. (Which has been influence by the various stakeholder drivers).
Hence, the use of the multi-stakeholder assessment on projects (all projects >$20,000)
mandates an evaluation and balancing of stakeholder needs. This process is further
described in Section 5.3.
3.6 Responsibilities and Accountabilities for Asset Management
3.6.1 Powerco’s Business Owner – Asset Manager – Service Provider Relationship
Powerco operates a business model where the ownership, management and service provision
activities are separated by contractual interfaces. This business model has been implemented
to provide the best objective incentives and focus on performance through the value chain.
The relationship between Powerco’s Business Owner, Asset Manager and Service Provider is
shown in Figure 3.2.
3.6.2 Asset Management Responsibilities at Powerco
Powerco’s Asset Management Group is the custodian for Powerco’s utility assets. The Group
is part of Powerco Network Management Services Limited, a wholly owned subsidiary of
Powerco Limited. It provides asset management services under contract to Powerco Limited,
the owner of the assets. The Asset Management Group is responsible for ensuring that the
utility assets are developed, renewed, maintained, operated and used on a long-term
sustainable basis to meet the needs of all stakeholders. Monitoring performance, making
investment decisions, managing network information, establishing standards, operating the
network, managing work on the network and risk management are included in this work. The
Asset Management Group is the responsibility of the General Manager Network Assets.

Section 3
Subject Background and Objectives
Date Issued 30 June 2005
Page 24
Powerco Limited Asset Management Plan – Electricity Networks 2006 - 2020
Medium-Long TermAlliance Style Contracts
Business OwnerManage revenue
and profit requirements
Set and monitor asset
performance
Manage regulatory
compliance
Governance and stakeholder
management
Pricing and customer
management
Asset Manager
Manage asset strategy
Delivery asset planning
Manage network operation
Manage service provision
Maintain asset information
Service Provider
Procure materialsProvide construction
and maintenance services
Manage and schedule field work
and resources
Prepare detailed design
Long TermAlliance Contracts
Traditional Principal-Contractor Contracts
Figure 3.2: Powerco Business Owner - Asset Manager - Service Provider relationship.
Within the Asset Management Group there are five teams that address electricity network
planning, gas network planning, electricity service delivery, gas service delivery and network
operations.
Day to day operation and access to the network is managed by the Network Operations
Centre, which forms part of the Asset Management Group.
External consultants are used by the Asset Management Group’s planning team and the
service delivery team for expert advice on detailed design issues, performing detailed studies
and peer review.
Construction and maintenance work is carried out by Powerco Energy Services Limited, a
subsidiary of Powerco Limited, and other service providers. Approximately 85% of the work is
carried out by Powerco Energy Services and Energex under partnership style agreements.
3.6.3 Asset Management Reporting
The General Manager Network Assets provides monthly reporting against the Asset
Management Plan to the Chief Executive and Board of Directors. The asset management
activities are reported against a balanced scorecard of performance measures. The
scorecard reflects financial, customer, process and improvement/learning areas of the Asset
Management Group.
Major requests for capital are approved by the Board to ensure that appropriate economic
viability investigation has been undertaken and that the proposed project considers the needs
of the stakeholders.
Section 3
Subject Background and Objectives
Date Issued 30 June 2005
Page 25
Powerco Limited Asset Management Plan – Electricity Networks 2006 - 2020
Future planned projects mentioned in the AMP are required to undergo a phase of concept
design followed by the multi stakeholder evaluation and economic justification processes. If
the projects pass these hurdles, then they are recommended for approval at the appropriate
designated authority level.
3.7 Asset Management Process The Asset Management Process is shown diagrammatically in Figure 3.3. It includes the
following processes:
• Governance and Management: This process provides direction, governance and
management to ensure that the Asset Management Group’s objectives are met and
delegated responsibilities are properly executed.
• Manage Asset Strategy: This process provides long-term strategic direction for the
management of the assets and the business operations and is the key interface for
customer/consumer consultation and corporate strategy.
• Deliver Asset Planning: This process involves planning for the renewal, development,
maintenance and operation of the assets.
• Manage Service Provision: This process involves the delivery of construction,
maintenance and operating services on the network assets.
• Manage Network Operations: This process involves the management of the real-time
operation of the networks and the access to the network by service providers.
• Maintain Asset Information: This process involves the maintenance and reporting from
the asset information databases.
3.8 Asset Management Information Systems Asset management information systems have been developed at Powerco to support the
asset management processes. The information system consists of the following main
systems:
• The Geonet Geographical Information System (GIS);
• The Peoplesoft Maintenance, Work Management and Financial System;
• The Electrical Network System (ENS);
• SCADA data and PI system;
• TVD dispatch system and Outdef outage recording system;
• Ancillary databases; and,
• Manual Records and drawing management system.

Section 3
Subject Background and Objectives
Date Issued 30 June 2005
Page 26
Powerco Limited Asset Management Plan – Electricity Networks 2006 - 2020
Figure 3.3: Asset Management Process Review.

Section 3
Subject Background and Objectives
Date Issued 30 June 2005
Page 27
Powerco Limited Asset Management Plan – Electricity Networks 2006 - 2020
The Asset Management Group business plan contains the strategic direction and proposed
projects for asset management information systems. The Asset Management Group business
plan was last updated in June 2005. A summary of each system is provided below.
3.8.1 Geographical Information System (GIS)
Powerco operates a GIS for the management of spatial asset information. The software
product used is Geonet. The system has been implemented although some data and
connectivity enhancement projects are still in progress. The system contains various levels of
detail for the different areas that make up the Powerco network.
The GIS contains spatial and attribute information on the following assets and types:
• Overhead lines (66, 33, 22, 11, 6.6, 0.4kV);
• Underground cables (66, 33, 22, 11, 6.6, 0.4kV);
• Distribution transformers;
• Switches and fusing (66, 33 and 22, 11, 6.6kV); and,
• Associated distribution equipment (pillar boxes, stay wires, etc).
GIS functionality is provided by full Geonet Licences for full users, Citrix based viewers for mid
range users, and intranet viewers for other users. The GIS is the master systems for current
distribution system assets. The Peoplesoft maintenance, work management and financial
systems operate as slave systems off the GIS asset information. Some “master” asset data
presently stored in ENS is being transferred to GIS, following this, ENS will be
decommissioned.
The GIS allows accurate calculation of line lengths and asset types for calculating the network
optimised depreciated replacement cost (ODRC). The asset spatial information is a key input
into maintenance scheduling where geographical factors are considered.
Non-spatial information relating to zone substations is contained in Geonet and the Asset
Master System, a module of Geonet, and in other proprietary databases. A project is under
way to complete all zone substation information across the entire Powerco footprint and to
include this in Geonet.
3.8.2 Maintenance, Works Management and Financial System
Powerco operates a Peoplesoft maintenance and works management system to schedule
maintenance activities and manage defect repairs and planned work on the network. The
Peoplesoft system went live in February 2005 and replaced the previous Mainsaver system.
Presently, the maintenance management functionality has not been fully implemented and this
is scheduled to occur in October 2005. It is intended than on the completion of the project the
Peoplesoft will be the master repository for asset condition and maintenance information.

Section 3
Subject Background and Objectives
Date Issued 30 June 2005
Page 28
Powerco Limited Asset Management Plan – Electricity Networks 2006 - 2020
Presently only some maintenance and condition information is captured electronically in the
field.
The Peoplesoft system provides comprehensive reporting on capital and maintenance
expenditure across the network as well as for Asset Management Group activities.
3.8.3 SCADA Data and PI System
The PI system specialises in the collection, processing, storage and display of time series
data. Powerco will use PI to store the SCADA tag values from, initially, all analogue SCADA
points. The current SCADA control systems, Abbey Systems & Foxboro, feed the tag data to
PI, which stores and processes the data. A strong feature of PI is the way large amounts of
data are stored and retrieved with quick response time. The client tools for PI, ‘Data Link’ and
‘Process Book’ are available over the Citrix portal. These are for viewing data and graphs in
customisable interactive displays.
3.8.4 Ancillary Databases
Powerco operates ancillary electronic databases for control and issuing of installation
connection point (ICP) information to retailers, and to control manual drawings and
documents. Where necessary these databases are reconciled to the GIS either monthly or
quarterly.
Powerco also maintains a comprehensive protection database for the management of settings
in numerical and electromechanical protection relays.
3.8.5 Manual Record Systems
In addition to the electronic systems, several manual recording systems are maintained, these
include:
• Zone substation drawings;
• Standard construction drawings;
• Equipment operating and service manuals;
• Manual maintenance records;
• Network operating information (system capacity information and operating policy);
• Policy documentation; and,
• HV and LV schematic drawings.
3.8.6 Drawing Management System
The drawing management system is based on AutoManager (AM) Workflow and works in
conjunction with AutoCad drawing software to make up the complete drawing management
system. It is a database of all engineering drawings including substation schematics, structure

Section 3
Subject Background and Objectives
Date Issued 30 June 2005
Page 29
Powerco Limited Asset Management Plan – Electricity Networks 2006 - 2020
drawings, wiring diagrams, regulator stations, and metering stations. In addition there is a
separate environment that contains legal documents.
AM Workflow has the ability to attach an electronic copy of the drawing/document to the index
card. It also allows the user to “red line”, control revisions and print. All drawings are indexed
into the AM Workflow system.
3.8.7 Information Integrity and Improvement Actions
Extensive effort is made to ensure the integrity of the asset information. This includes auditing
of as-built information against the physical work, checking of GIS additions against the as-built
information and formal auditing. A comprehensive data management plan is being developed
to ensure the quality of the asset data.
A number of significant data and system rationalisation projects are continuing. These
projects are detailed in the Asset Management Group business plan and have been
summarised below:
• The centralisation of asset location and attribute data into the GIS. A key feature of the
project is to make the GIS system the master for all asset records. The project involves
the transfer of information from ENS, the zone substation database and other ancillary
databases. Other systems such as Peoplesoft will contain a synchronised copy of
essential asset information from GIS systems;
• The centralisation of condition and maintenance data into Peoplesoft. Peoplesoft will be
the master for all maintenance and condition information. Inspection and maintenance
information is being captured but is presently analysed in ancillary databases;
• The capture of age data for assets of unknown age;
• A full review of the Geonet GIS system and user needs for spatial information;
• “As-building” and redrawing critical zone substation drawings;
• The complete implementation of the maintenance management functionality within
Peoplesoft including the implementation of field mobility solution for all maintenance data
capture.

Section 4
Subject Details of the Assets
Date Issued 30 June 2005
Page 30
Powerco Limited Asset Management Plan – Electricity Networks 2006 - 2020
4 DETAILS OF THE ASSETS
4.1 Infrastructure Assets This plan covers the infrastructure assets owned by Powerco Limited. These are all network
fixed assets:
• Subtransmission network;
• Zone substations, including buildings;
• High voltage distribution networks;
• Distribution substations, transformers and switchgear;
• Low voltage distribution networks including consumer service connections;
• SCADA, protection and communication systems; and,
• Load control injection system.
The infrastructure assets do not include:
• Land and buildings, apart from substation land and buildings;
• Consumer revenue meters and load control relays, which are owned by energy retailers;
• Non-network fixed assets such as motor vehicles, furniture and office equipment, plant
and tools;
• Net financial assets; and,
• Stores and spares.
4.2 Subtransmission Network Configuration Powerco’s electricity network has extensive urban and rural networks serving Taranaki,
Wanganui, Rangitikei, Manawatu, Tararua, Wairarapa, Tauranga, western Bay of Plenty,
Coromandel, and east and south Waikato to Kinleith.
The network comprises a subtransmission network, mostly at 33kV but with some 66kV,
supplying 101 zone substations. These are mostly 33/11kV, but a few are 33/6.6kV or
66/11kV. Some supply 22kV from 11/22kV transformers. A radial feeder network runs from
the zone substations throughout the service area.
Powerco’s network connects to Transpower’s grid at 66kV, 33kV and 11kV via 25 Transpower
grid exit points (GXPs). It also connects to several of Trustpower’s hydro power stations and
one wind farm, to two privately owned hydro power stations, and to Genesis Energy’s Haunui
wind farm.
The majority of the rural networks are of overhead construction, on wood or concrete poles,
but there are some cabled routes or sections of routes. Short lengths of 33kV cable are used

Section 4
Subject Details of the Assets
Date Issued 30 June 2005
Page 31
Powerco Limited Asset Management Plan – Electricity Networks 2006 - 2020
at some zone substations. The load density in the service areas is relatively low and thus
many conductor sizes are light.
The subtransmission networks are shown geographically in Appendix 2.
4.2.1 Manawatu Network
The Manawatu region has three areas, based on the electricity supply authorities that used to
operate them. These are Manawatu, Palmerston North and Tararua.
The Manawatu rural subtransmission network consists of an open 33kV ring feeding four
substations around the periphery of Palmerston North and 33kV radial feeders to Sanson and
Kimbolton via Feilding. The Feilding substation supplies all Feilding load. The 33kV circuits
are predominately overhead construction on concrete poles.
Outlying suburbs and rural areas close to Palmerston North are supplied from the Kelvin
Grove, Milson, Kairanga and Turitea substations. These substations are located on the
periphery of Palmerston North. All of these substations are supplied by two 33kV circuits from
either Linton GXP or Bunnythorpe GXP.
Turitea Substation has neutral earthing resistors to limit fault levels.
The Palmerston North urban subtransmission network comprises three 33/11kV zone
substations. Keith Street substation, at the north-eastern periphery of the urban area of
Palmerston North, is supplied by two 33kV circuits from Bunnythorpe and an interconnection
to Kelvin Grove substation. Pascal Street substation, at the western end of the City, takes
supply via 33kV circuits from Bunnythorpe and Linton. Two circuits from Keith Street and a
single circuit from Pascal Street supply Main Street substation. All 33kV subtransmission
circuits are underground in the city area. 33kV circuits outside this area are of overhead
construction on concrete poles.
The Tararua network, formerly operated by the Tararua Electric Power Board, consists of four
zone substations supplied from Mangamaire GXP. It has two 33kV rings, one feeding
Mangamutu substation, the other feeding three zone substations in the area south to
Eketahuna and east to Pongaroa.
4.2.2 Taranaki Network
The Taranaki region has three areas, based on the electricity supply authorities that used to
operate them. These are New Plymouth, Taranaki and Egmont.
The New Plymouth subtransmission network consists of two 33kV cables supplying City
Substation from Carrington GXP, two 33kV lines from Carrington GXP and one 33kV line from
Huirangi GXP supplying Bell Block Substation, two 33kV cables from New Plymouth Power

Section 4
Subject Details of the Assets
Date Issued 30 June 2005
Page 32
Powerco Limited Asset Management Plan – Electricity Networks 2006 - 2020
Station (NPPS) GXP to Moturoa GXP, but owned by Powerco, and two 33kV lines from
Huirangi GXP to Mamaku Rd Substation.
The Taranaki subtransmission network is an interconnected network supplying eleven zone
substations from Huirangi GXP and Stratford GXP.
The Egmont subtransmission network supplies the south Taranaki area and consists of
Cambria Substation supplied via two oil filled 33kV cables, and four other zone substations
supplied via a 33kV closed ring line network from Hawera GXP. It also supplies three zone
substations from Opunake GXP via an interconnected 33kV line network.
4.2.3 Tauranga Network
Tauranga has two areas based on the supply authorities that used to operate them. These are
the ex Tauranga Electricity Limited network supplying the CBD and surrounding area, and the
Tauranga EPB network, which supplies the remainder.
The subtransmission network in the Tauranga area is connected to the grid via Transpower
GXPs at Tauranga, Mt Maunganui, where supply is taken at 33kV and 11kV and Te Matai,
where supply is at 33 kV. It also connects to generation from Trustpower’s Kaimai scheme.
Mt Maunganui GXP supplies Papamoa and Triton substations at 33kV by a double circuit lines
and cables. This GXP also provides 11kV supply for the local Mt Maunganui area. A harbour
bridge cable links Triton with Tauranga City substation at 33kV.
Tauranga GXP supplies the substations at Waihi Rd, City, Otumoetai and Matua, Omokoroa,
Aongatete, Kauri Point and Welcome Bay by a network of lines and cables at 33kV.
Trustpower’s Kaimai generation feeds into the 33kV network at Greerton switching station. At
11kV, the GXP supplies a large suburban and surrounding rural area including Greerton, Pyes
Pa and Bethlehem out to the Kaimai Range.
Te Matai GXP supplies Te Puke and Pongakawa substations. A 33 kV line connects
Welcome Bay and Te Puke substations.
4.2.4 Valley Network
The Valley region has five grid exit points supplying Powerco’s network at 66, 33 and 11kV.
Kopu GXP supplies six substations on the Coromandel Peninsula and the Hauraki Plains at
66kV with a mixture of ring and radial feeds.
From Waikino GXP, 33kV lines run to Waihi, Whangamata, Waihi Beach and Paeroa also in a
mixture of ring and radial feeds.
Waihou GXP supplies the Piako area. This includes Tahuna, Walton, Te Aroha, Morrinsville
and the Waitoa dairy factory. From Waihou GXP a 33kV meshed network supplies

Section 4
Subject Details of the Assets
Date Issued 30 June 2005
Page 33
Powerco Limited Asset Management Plan – Electricity Networks 2006 - 2020
Morrinsville, Waitoa, Farmer Rd, Piako and Walton, although Walton and Morrinsville are
operated in radial configuration. Tahuna is a supplied via a radial spur directly from Waihou
GXP. Mikkelsen Rd, adjacent to Waihou GXP, is supplied by twin 33 kV connections.
Hinuera GXP supplies the area around Matamata, Tirau and Putaruru. The network consists
of single radial feeds to Tower Rd, Browne St and Putaruru. This network can be partially
backed up via a 33 kV line between Walton and Browne St.
Kinleith GXP supplies at 33kV and 11kV. The 33kV network supplies the substations at
Tokoroa, Maraetai Rd and Baird Rd, and the two substations associated with the water
pumping stations at Midway and Lakeside.
Supply at 11kV is taken from Kinleith GXP for Carter Holt Harvey’s (CHH) Kinleith site. A
cogeneration plant is connected to the Kinleith GXP.
4.2.5 Wairarapa Network
The Wairarapa subtransmission network is supplied from Masterton GXP and Greytown GXP.
Masterton GXP supplies Akura and Te Ore Ore zone substations in a ring. A single line
eastwards from Te Ore Ore supplies Awatoitoi and Tinui zone substations. Masterton GXP
also supplies Norfolk and Chapel zone substations on a ring, which is part line and part cable.
It also supplies Clareville substation via two lines and Gladstone substation via a single line.
Greytown GXP supplies an interconnected line network which supplies Featherston and
Martinborough zone substations by two lines each, and Kempton, Hau Nui and Tuitarata zone
substations by one line each.
4.2.6 Wanganui Network
The Wanganui network consists of three areas, Wanganui, Marton and Taihape.
The Wanganui area is supplied from two Transpower GXPs at opposite sides of the city,
Wanganui GXP and Brunswick GXP. A 33kV line runs between these, passing through zone
substations at Peat St, Castlecliff, Beach Rd and Taupo Quay on the way. Hatricks Wharf
substation is connected by 33kV line to Wanganui GXP and by 33kV cable and line to Peat St.
A radial line connects Peat St to Kai Iwi zone substation, and another connects Brunswick
GXP to Roberts Ave zone substation. A radial line connects Wanganui GXP to Wanganui
East zone substation, and two short radial lines connect Wanganui GXP to the adjacent Blink
Bonnie zone substation.

Section 4
Subject Details of the Assets
Date Issued 30 June 2005
Page 34
Powerco Limited Asset Management Plan – Electricity Networks 2006 - 2020
The Marton area is supplied from Marton GXP. One line connects Marton GXP to Bulls zone
substation. Another line connects Marton GXP to Arahina and Rata zone substations, and a
short cable connects Marton GXP to the adjacent Pukepapa substation.
The Taihape area is supplied from Mataroa GXP. It is connected to Taihape zone substation
by three lines, two of which are in parallel, to form two circuits, and it is connected to Waiouru
zone substation by a single line. Until the mid 1970’s, Taihape Borough Council supplied
Taihape town, which means that some of this network has a different architecture.
4.3 Zone Substation Configuration Powerco has 101 zone substations, the majority being 33/11kV, but some in the Valley area
are 66/11kV, and some in Taranaki are 33/6.6kV. There is some 22kV distribution in the
Rangitikei area, which is supplied via 11/22kV transformers.
Zone substation transformer capacities range from 1.25MVA to 24MVA.
The substations supplying urban/industrial loads typically have two transformers, two incoming
33kV feeders and anywhere between 4 and 15 outgoing distribution voltage feeders, except in
the Wanganui and Valley areas where single transformer substations are generally used.
For rural substations only one transformer is normally provided, and there are typically three to
six distribution voltage feeders.
There are two vector groups in use, Dy11 in Tauranga city, the Valley region and the old
Taranaki EPB area, and Yy0 in the other regions. In the Tararua area, some Yy0 auto
transformers exist. The different vector groups limit interconnection between regions, and
restrict the interchanging of transformers. Conversion of the Tauranga city area to Yy0 is in
progress.
Details of security of supply classes are given in Section 5 of this document.
4.4 Distribution Network Configuration
4.4.1 Central Business District Network Configuration
The networks in the Tauranga, Palmerston North, New Plymouth, Wanganui, Tokoroa and
Masterton Central Business Districts (CBDs) consist of highly interconnected 11kV radial
feeders. Switching points are provided at most 11kV/400V transformer locations. There is a
high level of interconnection between adjacent 11kV feeders. The reticulation in the CBDs is
100% underground with cable sizes ranging from 70mm2 to 300 mm2, aluminium or copper.
11kV switch automation is being progressively introduced in key locations, and provision for
future automation is being provided at less critical locations. This configuration allows quick
restoration of supply in fault situations.

Section 4
Subject Details of the Assets
Date Issued 30 June 2005
Page 35
Powerco Limited Asset Management Plan – Electricity Networks 2006 - 2020
The 400V network consists of radial circuits with a high degree of interconnection. The
interconnection between distribution substations is made at junction boxes located along the
400V circuits. The cable sizes are typically large (up to 0.5 sq inch copper). The 400V
network is 100% underground in the CBDs. Load can be transferred across the 400V network
in some locations.
The main streets of most towns in Powerco’s network have a typical urban network
configuration. In these towns the business district is largely or completely underground.
4.4.2 Urban Network Configuration
Both 11kV and 400V urban distribution networks are interconnected radial networks. The level
of interconnection is moderate, commensurate with the reliability requirements. In some
urban areas, the distance and/or load between switching points is such that Powerco’s
planning criteria are not fully met. Load can be transferred across the 400V network in some
locations.
4.4.3 Industrial and Commercial Consumer Network Configuration
The network configuration for large industrial customers is commensurate with the nature and
capacity of the customer’s load. Typically, for customers with a demand above 3MVA, dual
11kV feeders are available, providing a no-break supply for maintenance or in the event of a
single fault. Automated or remote control of 11kV switching is provided for some major
customers. The cable and conductor sizes reflect the load size.
Due to the higher load currents, there is limited load transfer capacity through the 400V
network. Typically radial 400V feeders from the transformer to the consumer are provided. In
some industrial subdivisions 400V interconnection between feeders is provided using either
240mm2 or 185mm2 aluminium cable, but load transfer is limited.
4.4.4 Rural Network Configuration
The rural network consists of 11kV lines with isolators installed every 1-2 km in some regions.
This enables flexibility of switching, but presents a maintenance and reliability liability. A
number of 11kV spur lines are fused with dropout fuses. There is some interconnection
between feeders to allow backfeeding in maintenance and fault situations. Feeders are
overhead lines on wooden or concrete poles.
Line reclosers and sectionalisers are used in rural areas. Typically reclosers are placed at the
transition between urban and rural loads and between rural and remote rural loads.
Sectionalisers are used on some spur lines. Many reclosers are SCADA controlled.

Section 4
Subject Details of the Assets
Date Issued 30 June 2005
Page 36
Powerco Limited Asset Management Plan – Electricity Networks 2006 - 2020
4.4.5 Remote Rural Network Configuration
Remote rural feeders are generally radial, with limited or no interconnection between adjacent
feeders. In some areas, 11kV isolators and 11kV dropout fuses are used to provide
discrimination and sectionalising under fault conditions. Feeders are overhead lines on
wooden or concrete poles. Some remote areas are supplied by two phase lines, and a small
number are supplied by single wire earth return (SWER).
Due to the scattered nature of the population there are no significant rural 400V networks.
Typically, the 400V network extends 100-200m under the main distribution voltage lines from
the distribution transformer to supply nearby loads.
4.4.6 Kinleith Paper Mill
There is a significant distribution network owned and operated by Powerco supplying Carter
Holt Harvey’s pulpad paper mill at Kinleith near Tokoroa. It is a highly interconnected 11kV
network consisting of 58 km of overhead lines, 35 air break switches, 28 km of cable, 166
distribution transformers and 243 indoor circuit breakers and switches.
4.5 Protection and Control
4.5.1 Protection Assets
Protection relays or integrated controllers are used to detect, measure and initiate the
clearance of faults on a high voltage electricity network.
Protection systems include auxiliary equipment such as current and voltage measuring
transformers, communication interfaces, special function relays, auxiliary relays and
interconnecting wiring. They also include circuit breakers and auto-reclosers.
Protection equipment on Powerco’s network falls into the following categories:
4.5.1.1 Electromechanical protection devices
These are devices in which fault current or voltage operate moving components such as
rotating discs and attracted-armature relays, which in turn operate the output contacts.
4.5.1.2 Electronic protection devices
These devices replicate the operation of the electro-mechanical relays based on the analogue
value of the measured current or voltage. They use discrete electronic or microprocessor
components to operate the output contacts. Their functional capability is superior to that of
their electro-mechanical counterparts.

Section 4
Subject Details of the Assets
Date Issued 30 June 2005
Page 37
Powerco Limited Asset Management Plan – Electricity Networks 2006 - 2020
4.5.1.3 Digital protection devices
Digital or numerical protection devices convert measured analogue values into digital signals.
They are extremely configurable in their protection capability and have multiple control inputs
and relay outputs available. They are also capable of recording event history, have remote
access capability and can be integrated directly into the SCADA system.
4.5.1.4 Integrated protection devices
A range of outdoor circuit breakers, auto-reclosers and sectionalisers are equipped with
integrated proprietary protection devices, generally referred to as controllers because they
also incorporate local manual control and indication functions. Some early model devices also
incorporate hydraulically controlled mechanisms.
4.5.2 SCADA and Communication Systems
The system control and data acquisition (SCADA) equipment is used to control and monitor
the networks remotely from the Network Operations Centre in New Plymouth. As a result of
the acquisition of the assets in the Tauranga and Thames Valley regions, Powerco operates
two SCADA systems one supplied by Abbey Systems and the other by Foxboro. They
comprise:
• SCADA master stations located at the Network Operations Centre;
• Remote terminal units (RTUs) located at major substations;
• RTUs located on the distribution network. This includes pole mounted and ground
mounted units; and,
• Communication systems consisting of VHF, UHF, optical fibre and TelstraClear/Telecom
leased circuits.
Communication hubs for the Abbey Systems SCADA in New Plymouth, at Hawera, Wanganui,
Palmerston North and Masterton, are connected through a wide area network (WAN) to the
master station located at the Network Operations Centre. Communication hubs for the
Foxboro SCADA system in the Eastern Region in Te Aroha and Tauranga are linked via a
WAN to an operator station in the Network Operations Centre.
The SCADA master station provides load control equipment operating for automatic control of
peak demands, and tariff switching signals if required, to the various networks.
4.5.3 Load Control Systems
The load control system manages the electricity network by controlling network demand,
which can assist in deferring capacity related capital expenditure on the network. The load
control system comprises two main parts – the injection plant and the receivers.

Section 4
Subject Details of the Assets
Date Issued 30 June 2005
Page 38
Powerco Limited Asset Management Plan – Electricity Networks 2006 - 2020
Powerco’s injection plants vary in type, technology and age, but generally they are operated
under the control of the SCADA system and inject signals across the electrical network to
control the receivers in the field. Injection plants are installed throughout Powerco’s network.
The receivers are located at the point where the controllable load is connected. They receive
the signal from the injection plant and switch the load accordingly. They are generally owned
by a third party, not Powerco.
The load control system is used to control water heating and other controllable loads, to
manage system peak demand, to provide load smoothing, to operate public lighting and to
meet other customer requirements.
4.5.4 Energy Measurement Systems
Powerco’s network includes metering voltage and current transformers at approximately 50
installations. The voltage transformers’ secondary voltages and the current transformers’
secondary currents are used as inputs to power measurement devices and, in some cases, as
inputs to other substation protection and control devices. The metering units are embedded in
the distribution network and comprise:
• Outdoor metering units, pole mounted or ground mounted, which are part of the network
switching equipment; and,
• Components of zone substations, including current transformers mounted on high voltage
bus bars, and voltage transformers forming part of the substation’s auxiliary voltage
supply.
4.6 Justification for Assets 4.6.1 General
Assets are required to deliver electricity from the generating source to the consumer. They
range from subtransmission assets down to low voltage reticulation along a residential street.
Powerco uses several voltages to optimise the cost of construction versus the cost of losses
for different distribution distances.
4.6.2 Subtransmission Assets
Subtransmission assets carry electricity at 66kV or 33kV from the Transpower or generating
company connection points to zone substations, although this does not preclude using other
standard voltages in the future. To provide a reliable supply of electricity to the zone
substations redundancy is built into the network in many locations by means of duplicated or
interconnected lines. As a large area loses supply if a zone substation fails, a highly reliable
subtransmission network is required.
4.6.3 Zone Substation Assets
Zone substations convert the electricity voltage from 66kV or 33kV to 22kV, 11kV or 6.6kV.
They are required because voltages above 22kV are not an economically viable means of

Section 4
Subject Details of the Assets
Date Issued 30 June 2005
Page 39
Powerco Limited Asset Management Plan – Electricity Networks 2006 - 2020
distributing electricity to individual consumers or groups of consumers unless a single
customer has a load above about 8MVA.
Equipment redundancy is often provided at zone substations, to enable supply to be
maintained in the event of an equipment failure and maintenance to be performed without a
supply interruption.
4.6.4 High Voltage Distribution Assets
Electricity is distributed to consumers or groups of consumers using 22kV, 11kV or 6.6kV lines
or cables. These provide an economical means for distribution of electricity to groups of
consumers. As low voltage reticulation is limited to around 300-400m, distribution feeders
constitute the highest percentage of the total network’s assets.
Some interconnection is provided between adjacent feeders, and switches are installed at
intervals along feeders, to allow supply to be restored in the event of a fault or to minimise
supply interruptions for maintenance.
4.6.5 Distribution Substation Assets
Distribution substations convert electricity from the distribution voltage to 230/400V for
consumers’ use. They are located close to groups of consumers, as these voltages cannot be
distributed more than about 400m without excessive voltage drop.
4.6.6 Low Voltage Reticulation Assets
Low Voltage (LV) assets consist of 400V lines, cables, link boxes and pillar-boxes. Consumers
connect to Powerco’s network at pillar-boxes located on the boundary of their property or by
an overhead service line from a pole mounted fuse. Ownership of service lines varies
depending on the policy in place at the time of installation, but they are generally owned by
consumers.
4.6.7 Protection, Control and Communication Assets
Other network assets are Powerco’s Protection, SCADA, radio, microwave and cable
communication systems. These systems are used to protect, monitor and control the status of
the network and to enable some assets to be operated remotely.
4.6.8 Load Control Assets
Load control equipment benefits the entire electricity industry by improving the load factor of
electricity demand. An improved load factor means less need for expensive peaking
generation and lower installed capacity of plant in the transmission and distribution networks.
Unfortunately with the electricity industry being fragmented, upgrading load control systems
are often put in the “too hard” basket and all too often the benefits of it tend to arrive in the
hands of those who are not investing in it. With Demand Side Management (DSM) taking an

Section 4
Subject Details of the Assets
Date Issued 30 June 2005
Page 40
Powerco Limited Asset Management Plan – Electricity Networks 2006 - 2020
increasing role in the transmission versus generation investment debate, the need for effective
and reliable load control systems will become increasingly important.
4.7 The Assets By Category, Age and Condition
4.7.1 Assets Categories
The major categories of assets are:
• Distribution transformers;
• Underground cables;
• Overhead lines;
• Zone substation assets; and,
• Subtransmission and distribution switchgear.
Total network replacement costs by asset category are shown in Figure 4.1 below. The asset
replacement costs used are the ODV handbook standard replacement costs including
replacement cost multipliers and traffic management allowances. The figure does not include:
• Land;
• Central control equipment; and,
• Stores and spares.
Replacement Cost by Asset Category
$0
$100,000
$200,000
$300,000
$400,000
$500,000
$600,000
$700,000
Zone Substation Equipment HV Switchgear Distribution Transformers Underground Cable Overhead Line
Asset Category
Rep
lace
men
t C
ost
($0
00)
Figure 4.1: Replacement Cost by Asset Category.
4.7.2 The Assets By Age
The average Design Life and age of the distribution network is shown Table 4.1. Note that
these averages are weighted by age, which gives a more meaningful result than straight
averaging. Also note that due to the 2004 ODV review and associated data improvement has

Section 4
Subject Details of the Assets
Date Issued 30 June 2005
Page 41
Powerco Limited Asset Management Plan – Electricity Networks 2006 - 2020
resulted in the average design life and average age differing from those disclosed in July
2004. The rules that the ODV Handbook uses for determining equipment age have been
applied, for example, line age equates to pole age.
Table 4.1: Average Age of Assets Asset Category Average Design Life
(Weighted by Cost) Average Age at 31/03/04
(Weighted by Cost) Distribution Transformer 55 23 Underground Cable 50 21 Overhead Line 57 27 Zone Substation Assets 45 33 Subtransmission & Distribution Switchgear 37 22
Asset replacement cost versus age graphs are presented below and indicate the overall age
of the assets. Certain groups of assets have unknown ages on the network. This is common
among network companies, where installation records have been lost or installations were
never recorded.
Age profiles give some insight into asset condition from a macro perspective, although actual
asset replacement is normally driven from known asset condition.
The age profiles have been derived from the electricity network ODV using standard
replacement costs and multipliers. It should be borne in mind while interpreting these age
profiles that the ODV replacement costs are based on certain optimum conditions that are
rarely achieved in practice. These include mass scale construction of the full asset under fully
competitive conditions by an efficient new entrant under brownfield site conditions. Actual
construction conditions are almost always more adverse than this:
• Piecemeal replacement - almost all of Powerco's renewal projects are of piecemeal type.
This is usually because it is not economically efficient to replace assets that have not
reached the end of their lives.
• Work complications - these may involve constraints on shut down times or the need to do
the work live. Severe complications can arise for zone substation switchboard
replacements or for pole replacements involving multiple circuits.
• Non competitive costs - in some rural areas Powerco is unable to obtain the degree of
competition amongst its contractors that is available in other areas.
• Low asset Capital Efficiency - Certain work types by their nature have a low capital
efficiency. An example is line reconductoring projects - while these tend to have a capital
efficiency of between only 15 to 40%, they can still represent the best renewal or
development option.
Further work will be done in the coming year to assess the implication of capital efficiency on
renewal capex.

Section 4
Subject Details of the Assets
Date Issued 30 June 2005
Page 42
Powerco Limited Asset Management Plan – Electricity Networks 2006 - 2020
In this AMP, Figure 4.2 is a nine year moving average, and the Western region unknown age
assets can be seen in the nine bars that are higher than the rest. Note the predominance of
distribution switchgear in these bars, as the installation dates of much switchgear were never
recorded.
In Figures 4.3 to 4.7, the bar graphs show raw data, and the red line is a nine-year moving
average. How the unknown age assets have been assigned can be clearly seen. A single bar
at the right hand end of the graphs represents assets over their standard design life. It should
be noted that equipment with different design lives are included in these graphs. The year 0
replacement costs relate to assets installed in FY2005 (from 1 October 2004 to 31 March
2005). Likewise, year 1 replacement costs relate to assets installed from 1 October 2003 to
30 September 2004. Due to delays in as-building work the expenditure level (adjusted for any
optimisation and standard valuation differences) has been used.
Graphs showing replacement cost against year of replacement are included in Section 6.13.
Total Asset Replacement Cost vs Age
$0
$10,000
$20,000
$30,000
$40,000
$50,000
$60,000
0 1 2 3 4 5 6 7 8 9 10 11 12 13 14 15 16 17 18 19 20 21 22 23 24 25 26 27 28 29 30 31 32 33 34 35 36 37 38 39 40 41 42 43 44 45 46 47 48 49 50 51 52 53 54 55 56 57 58 59 60 61 62 63 64 65 66 67 68 69O
DL
Age (Years)
Rep
lace
men
t C
ost
($0
00)
SubstationsSwitchesTransformersCableOverhead Line
Figure 4.2: Total Asset Replacement Cost vs Age.
Figure 4.3 shows a graph of overhead line replacement cost by age. It includes overhead
lines and their replacement cost multipliers, overhead service connections and overhead
traffic management. A large hump of replacement value amongst line assets with an age of
between 15 years and 35 years exists. Lines have a standard useful life of between 45 and
60 years and the graph indicates that a wave of line renewal activity is coming over the next
20 years. This is in common with many other line companies in New Zealand, Australia and
the UK.

Section 4
Subject Details of the Assets
Date Issued 30 June 2005
Page 43
Powerco Limited Asset Management Plan – Electricity Networks 2006 - 2020
Overhead Line Replacement Cost vs Age
$0
$5,000
$10,000
$15,000
$20,000
$25,000
$30,000
$35,000
0 1 2 3 4 5 6 7 8 9 10 11 12 13 14 15 16 17 18 19 20 21 22 23 24 25 26 27 28 29 30 31 32 33 34 35 36 37 38 39 40 41 42 43 44 45 46 47 48 49 50 51 52 53 54 55 56 57 58 59O
DL
Age (Years)
Rep
lace
men
t C
ost
($0
00)
Overhead LineReplacement Cost9yr Average
Figure 4.3: Overhead Line Replacement Cost vs Age
Underground Cable Replacement Cost vs Age
$0
$4,000
$8,000
$12,000
$16,000
0 1 2 3 4 5 6 7 8 9 10 11 12 13 14 15 16 17 18 19 20 21 22 23 24 25 26 27 28 29 30 31 32 33 34 35 36 37 38 39 40 41 42 43 44 45 46 47 48 49 50 51 52 53 54 55 56 57 58 59 60 61 62 63 64 65 66 67 68 69O
DL
Age (Years)
Rep
lace
men
t C
ost
($0
00)
Underground CableReplacement Cost9yr Average
Figure 4.4: Underground Cable Replacement Cost vs Age
Figure 4.4 shows a graph of underground replacement cost by age. It includes underground
cables and their replacement cost multipliers, underground service connections and
associated traffic management. Prior to 35 years ago, Figure 4.4 shows that little cable had
been installed. The age profiles show that little cable replacement will be required as cables
have a standard life of 40 to 70 years. However some early XLPE insulated cables need to be
replaced prior to the expiry of their standard life because of water treeing in the insulation or
because of defects during manufacture.

Section 4
Subject Details of the Assets
Date Issued 30 June 2005
Page 44
Powerco Limited Asset Management Plan – Electricity Networks 2006 - 2020
Distribution Transformer Replacement Cost vs Age
$0
$1,000
$2,000
$3,000
$4,000
$5,000
$6,000
$7,000
$8,000
$9,000
$10,000
0 1 2 3 4 5 6 7 8 9 10 11 12 13 14 15 16 17 18 19 20 21 22 23 24 25 26 27 28 29 30 31 32 33 34 35 36 37 38 39 40 41 42 43 44 45 46 47 48 49 50 51 52 53 54
OD
L
Age (Years)
Rep
lace
men
t Cos
t ($0
00)
TransformerReplacement Costs9yr Average
Figure 4.5: Distribution Transformer Replacement Cost vs Age.
Figure 4.5 includes distribution transformers and associated substations. It shows that the
distribution transformer population is relatively young, and few will require replacement in the
near future. Most distribution transformer replacement occurs due to changed capacity
requirements. The large bars are years into which assets of unknown age have been
assigned.
Switchgear Replacement Cost vs Age
$0
$2,000
$4,000
$6,000
$8,000
$10,000
$12,000
0 1 2 3 4 5 6 7 8 9 10 11 12 13 14 15 16 17 18 19 20 21 22 23 24 25 26 27 28 29 30 31 32 33 34 35 36 37 38 39
OD
L
Age (Years)
Rep
lace
men
t C
ost
($0
00)
SwitchgearReplacement Costs9yr Average
Figure 4.6: Switchgear Replacement Cost vs Age.
Network switchgear exhibits a constant age profile over its population as shown in Figure 4.6,
except for the years into which switchgear of unknown age has been assigned. It can be seen
that over the years a large quantity of distribution switchgear, particularly overhead
switchgear, has been installed without its date of installation being recorded.

Section 4
Subject Details of the Assets
Date Issued 30 June 2005
Page 45
Powerco Limited Asset Management Plan – Electricity Networks 2006 - 2020
Substation Equipment Replacement Cost vs Age
$0.00
$2,000.00
$4,000.00
$6,000.00
$8,000.00
$10,000.00
$12,000.00
$14,000.00
$16,000.00
$18,000.00
0 1 2 3 4 5 6 7 8 9 10 11 12 13 14 15 16 17 18 19 20 21 22 23 24 25 26 27 28 29 30 31 32 33 34 35 36 37 38 39 40 41 42 43 44 45 46 47 48 49 50 51 52 53 54 55 56 57 58 59O
DL
Age (Years)
Rep
lace
men
t C
ost
($0
00)
SubstationReplacement Costs9yr Average
Figure 4.7: Zone Substation Equipment Replacement Cost vs Age.
The age profile in Figure 4.7 includes all zone substation equipment and buildings but
excludes land. The large amount of over design life asset is largely load control and other
electronic equipment with a short standard life.
4.7.3 Asset Condition
4.7.3.1 Summary
The condition of all infrastructure assets is maintained to a level commensurate with the
nature of the asset, the environmental conditions and the required reliability.
Asset condition is monitored through inspection and condition monitoring techniques.
Maintenance strategies are based on a combination of time based, condition based and
reliability based maintenance techniques. The strategies differ between asset types
depending on the amount of historical information that is available, but as condition monitoring
and failure mode data is gathered, time-based maintenance will become less common.
4.7.3.2 Overhead Line Condition
Condition monitoring shows that most lines are in the condition expected for their age,
although some in harsh coastal areas have deteriorated more quickly than expected. Steel
core corrosion in ASCR conductors occurs in coastal areas, and some older copper
conductors have become work hardened by wind movement and load cycling.
Part of the Tauranga network was constructed using poles manufactured in-house. The top-
load strength of these poles is not clearly established and is believed to be inconsistent, and
as a result, conductor upgrades require existing poles to be replaced. This work is ongoing.

Section 4
Subject Details of the Assets
Date Issued 30 June 2005
Page 46
Powerco Limited Asset Management Plan – Electricity Networks 2006 - 2020
A tendency to fail has been noted on kidney strain insulators, although wholesale replacement
is not considered justified. These insulators tend to be located on older wood poles and
programmed pole replacement will eventually phase them out. Polymer strain insulators are
used on replacement structures.
Crossarm and insulator replacement has been undertaken to maintain the condition at the
overall line asset.
Snow storms over the past 3-4 years in the Taihape and northern Manawatu region have
stressed some aging assets. A significant renewal program has been initiated for this region.
4.7.3.3 Subtransmission Cable Condition
Subtransmission cables and distribution cables are generally in good condition commensurate
with their age. The majority of failures are caused by third party damage by contractors
excavating in road reserves. Some failures have been attributed to joint failure, poor
manufacture of early XLPE cables and poor installation.
The 33kV cables from Carrington GXP to City substation have suffered three internal cable
faults in recent times, and have been found to have corroding aluminium conductors and
screens, voids under the semi-conducting layers, and water treeing in the insulation. Detailed
condition investigation is at an advanced stage, and budgetary provision has been made for
replacing these cables in the 2006 financial year if necessary.
The 33kV oil filled cables in Palmerston North are more than thirty years old. Design
shortcomings in joints of the type used on these cables have been identified elsewhere, and
an investigation is still in progress to determine whether the cables need derating to protect
the joints. They may need to be replaced prematurely if the cost of fault repairs becomes
uneconomic or if the derating required is too severe.
For other 33kV cables no replacement due to age or condition is expected during the period
covered by this plan.
4.7.3.4 Distribution Cable Condition
Distribution cables are generally in good condition, commensurate with their age.
Underground construction commenced in the 1950s. The early cables were paper insulated
lead covered (PILC) type, which have a life expectancy of seventy years provided they are not
moved. Some early 11kV PILC cables in the New Plymouth area have brittle lead sheaths,
prone to cracking. These cannot be moved, and where cables are grouped in a common
trench, jointing is difficult.

Section 4
Subject Details of the Assets
Date Issued 30 June 2005
Page 47
Powerco Limited Asset Management Plan – Electricity Networks 2006 - 2020
Other cables that may require early replacement are aluminium XLPE cables installed in the
late 1960s and 1970s. These were first generation XLPE cables, manufactured using tape
semi-conducting layers and water-curing. This, coupled with a lack of knowledge and
subsequent poor handling of cables during installation, has resulted in some cable failures.
Early 11kV XLPE cables, installed prior to 1975 in the Tauranga area, especially smaller
25mm cables, have a tendency to fail. A replacement programme is proceeding for circuit
segments where the reliability impact of a failure is expected to be significant. The problem
appears to be poor installation methods and exposure to fault level above their rating rather
than a cable manufacturing fault.
In the CBDs of main centres such as Tauranga and Palmerston North, the sustained levels of
load growth mean that many of the distribution cables do not now have adequate capacity to
provide a full N-1 security level. This was highlighted in the Tauranga CBD events of August
2004 and with the cubicle failure in the Pascal St switchboard in May 2005. The Tauranga
CBD distribution network is being upgraded and the means of upgrading the Palmerston North
CBD network architecture needs to be considered to avoid overloading and damage to cables.
4.7.3.5 LV Cable Condition
No 400V cables were installed prior to the 1950s. Early cables were PILC construction with a
70 year expected total life.
Powerco’s inspection of older 400V cables during excavation works indicates that they are not
ageing more than expected. It is not expected that any significant replacement will be
required prior to 2010.
Powerco has some single core Aluminium conductor cable with only a single layer of
insulation. It is possible that the insulation breakdown may require its replacement prior to the
forecast replacement date. This is being monitored.
4.7.3.6 Distribution Transformer Condition
Condition monitoring shows that most transformers are in the condition to be expected for
their age, although some in harsh coastal areas have deteriorated faster than expected. The
condition of urban ground-mounted transformers is monitored frequently to ensure both
service performance and public safety. These assets are maintained to a high-standard of
condition, appropriate for their location and age.

Section 4
Subject Details of the Assets
Date Issued 30 June 2005
Page 48
Powerco Limited Asset Management Plan – Electricity Networks 2006 - 2020
4.7.3.7 33kV and 11kV Switchgear Condition
Overhead 33kV and 11kV switchgear is inspected in conjunction with line or transformer
inspections. These assets are in the condition to be expected for their age and location.
Greater maintenance or earlier replacement is undertaken in costal areas when necessary.
The condition of urban ground-mounted switchgear is monitored frequently to ensure
serviceability and public safety. Other than the exceptions noted below, these assets are in
good condition as appropriate for their location and age.
Several failures of one type of oil filled ring main unit have occurred as a result of apparent
poor design, poor assembly or water ingress. Some remedial work has been carried out in
accordance with the manufacturer’s instructions. Operating restrictions are in place for this
switchgear, and a renewal program has been established in advance of its design life.
A significant amount of Magnefix resin insulated switchgear is in service, but the majority is in
good condition and is housed in dry, clean environments. Replacement is planned only where
the Magnefix current rating is causing operating restrictions or where the units are open points
between feeders.
4.7.3.8 Zone Substation Condition
Significant condition monitoring is undertaken on the zone substation assets, and most are in
good condition. Older switchboards or individual circuit breakers have been identified as
requiring replacement due to condition, lack of earthing equipment or lack of replacement
spare parts.

Section 5
Subject Performance Levels
Date Issued 30 June 2005
Page 49
Powerco Limited Asset Management Plan – Electricity Networks 2006 - 2020
5 PERFORMANCE LEVELS
5.1 Introduction This section of the plan outlines the performance levels required from the network assets. It
deals with consumer related service requirements and other requirements relating to the
business drivers.
Key performance drivers were described briefly in Section 3. Each aspect of performance is
described in detail in the following sections.
5.2 Levels of Consumer Service Performance
5.2.1 Overview The levels of service adopted by Powerco for its asset management plan are based on the
internationally recognised measurements, SAIDI, CAIDI, and SAIFI and accepted New
Zealand lines companies’ “best practice”. These criteria, which are described below, have
been adopted as a starting point for asset management planning.
The target levels of service chosen are based on a balance of past practice, consultation with
customer and consumer groups, economic factors, recognised international best practice and
safety considerations. These criteria have been refined over recent years to reflect the
direction indicated by government reviews involving all facets of the industry, consumer
groupings and individual submissions, conducted during the industry restructuring process. In
setting these criteria Powerco believes it achieves an appropriate balance between legislative,
regulatory, owner requirements and consumer expectations.
5.2.2 Consumer Consultation - Price Quality Trade-off
Throughout FY2004 and FY2005, Powerco has been involved in specific discussion with focus
interest groups, most notably groups representing local branches of the Chambers of
Commerce and Federated Farmers. The discussions have embraced the quality of supply
issues encountered in differing locations including the impact of adverse weather events and
changing climate on reliability. The “Cost of Non Supply” has been a topic of attention
amongst certain industrial users. Rural consumers, particularly dairy farmers, have been
concerned with their growing need for better reliability and quality of supply and the
implications of an inevitably higher cost of supply to more remote locations and alternative
arrangements for ensuring ongoing availability that might be feasible. Powerco intends to
continue to liaise with consumer interests in order to help in identifying the most appropriate
responses to such issues.
In FY2004 Powerco received the results of a telephone survey of consumer views on the
reliability of the electricity supply received from Powerco and their willingness to pay for an
improvement to it.

Section 5
Subject Performance Levels
Date Issued 30 June 2005
Page 50
Powerco Limited Asset Management Plan – Electricity Networks 2006 - 2020
The main conclusions were:
• Most customers are satisfied with the present quality of supply, with 76% considering it
most satisfactory or quite satisfactory. Only 10% were dissatisfied with the present quality
of supply;
• Slightly fewer customers, 70%, were satisfied with Powerco’s supply quality targets.
Slightly more, 13%, were dissatisfied with the targets;
• 57% of respondents would not be prepared to meet a price increase for a halving of
likelihood of disruption in electricity supply;
• 40% respondents would be willing to pay a 5% or larger increase in price for a halving in
likelihood of disruption of electricity supply; and,
• Respondents in the industrial category were most likely to be willing to pay 5% extra for
an improvement of two thirds in the reliability of supply.
5.2.3 Definition of Consumer Service and Service Performance
For the purpose of this plan, it is assumed that the consumer’s needs will be satisfied if
Powerco meets its Service Performance targets. Service Performance is defined as:
“Delivery of electricity line function services to meet consumer load requirements
within targeted quality limits, and within targeted levels of reliability”.
The three key elements of the service performance definition are:
5.2.3.1 Reliability
The reliability service component is a function of:
• Asset design, the most important mechanism being built-in equipment redundancy,
referred to as the security level, so that the failure of any one component does not lead to
a non-restorable supply outage. Powerco has developed security criteria for the
subtransmission and distribution network and these are key inputs into the planning
process. The security criteria are discussed in Section 6 of this plan;
• Asset type, that is, the inherent reliability of the asset;
• Asset condition where this affects the likelihood of failure of a component; and,
• Operation and maintenance practices minimising the effects of planned equipment
outages.
Powerco uses all endeavours as a reasonable and prudent network operator to provide
continuous service within the limitations of the network design.
5.2.3.2 Capacity
The capacity service component needs to be considered in two parts.

Section 5
Subject Performance Levels
Date Issued 30 June 2005
Page 51
Powerco Limited Asset Management Plan – Electricity Networks 2006 - 2020
Firstly, for medium term network planning, consumer load requirements are taken as the
present load on the network plus provision for load growth over five years. The load is taken
at the network distribution feeder level. Five years is chosen as this is the lead time in which
most network additions can be planned, designed and implemented. The network must be
capable of meeting the demand until any necessary reinforcements or additions can be
brought into service. The capacity targets are discussed as a planning criterion for network
development planning in Section 6 of this plan.
Secondly, for an individual consumer connection the ‘consumer load requirement’ is the
present consumers’ load, typically measured at point of common coupling on the 400V
network. Powerco aims to meet this requirement. In most parts of the network there is spare
capacity available in the 400V network to accommodate individual consumer load growth,
however, changes to individual consumers load (or the addition of new consumers) is subject
to Powerco’s investment policy.
5.2.3.3 Supply Quality
The elements of supply quality are:
• Voltage: Maintenance of the voltage at the consumers’ point of connection within statutory
voltage limits;
• Momentary voltage fluctuations: Momentary variation of voltage outside statutory limits;
and,
• Harmonics: Distortion of the voltage waveform.
Maintenance of frequency is not presently under the control of Powerco except for under
frequency load shedding relays at zone substations.
5.2.4 Reliability Targets
Powerco’s reliability targets vary according to the perceived needs and preferences of the
different types of consumer and what is practical to achieve within the constraints of economic
and technical feasibility. The reliability targets are quantified by indices of interruption duration
(SAIDI) and frequency of interruption (SAIFI). Fault response and repair times affect the
duration of interruptions. The reliability targets assume normal weather conditions.
Powerco sets reliability targets at a network and feeder level based on five different types of
consumer. Of these, four types concern small to medium sized consumers:
• Commercial/CBD;
• Urban residential;
• Rural; and,

Section 5
Subject Performance Levels
Date Issued 30 June 2005
Page 52
Powerco Limited Asset Management Plan – Electricity Networks 2006 - 2020
• Remote rural.
The fifth category embraces large industrial users who consume large quantities of electricity.
For these consumers, special needs such as reliability and voltage stability can be
accommodated by negotiation.
Each distribution feeder is assigned a feeder class that best encompasses the types of
consumers connected to the feeder. In some instances the feeder class changes from a
higher to lower class along the feeder. Where this occurs, a distribution recloser or other
protection element is often used. Feeder level reliability targets are an approximation of
individual consumer reliability needs.
Acceptable reliability performance is performance equal to or better than the performance
indices stated in Table 5.1 below. This table indicates the average and maximum (worst case)
thresholds for feeder class reliability performance.
Table 5.1: Reliability Performance Targets by Feeder (Consumer) Type.
Typical Consumer Type
Large Industrial
Commercial Urban Rural Remote Rural
Unit
Powerco Feeder Class F1 F2 F3 F4 F5
Average number of consumers on feeder class
5 100 800 500 250
SAIFI (average for class)
0.33 0.33 0.5 2 3 interruptions per year
CAIDI (average for class)
45 45 45 90 150 minutes per interruption
SAIDI (average for class)
15 15 23 180 450 minutes per consumer per
year Maximum No. of auto-recloses
- - - 16 24 reclose shots per year
Maximum No. of Interruptions
0.5 1.0 1.5 4 6 interruptions per year
Maximum average outage duration
60 60 120 150 180 minutes per interruption
Feeder interruption duration index (FIDI)
30 60 180 600 1080 minutes per feeder per
year
Note: The reliability performance stated in the table above excludes the performance of the network upstream of the feeder.
The network reliability targets have been further disaggregated by outage class for the next
four years and this is shown in Table 5.2 below. Class B outages relate to planned outages
on the Powerco network and class C outages relate to unplanned outages (faults) on the
Powerco network. The near term reliability targets have been set to more realistic levels given
present weather patterns and actual reliability performance. The performance of the
transmission network and generators is excluded from Table 5.2 below. The targets represent
what is considered good performance for the types of consumers served and the terrain
covered. The targets across coming years are maintained at the same level in
acknowledgement that reliability performance has been short of target in recent years.

Section 5
Subject Performance Levels
Date Issued 30 June 2005
Page 53
Powerco Limited Asset Management Plan – Electricity Networks 2006 - 2020
Reliability performance of worst performing feeders is monitored every month on a twelve
month rolling basis as part of the performance engineering process. Actions to improve
network performance are incorporated into the works plan each year or during the year when
required.
Table 5.2: Network Reliability Performance by Class and Year.
Year Measure Outage Class 2006 2007 2008 2009
Unit
B 20 20 20 20 SAIDI C 130 130 130 130
Minutes per consumer per year
B 0.14 0.14 0.14 0.14 SAIFI C 2.36 2.36 2.36 2.36
Interruptions per year
B 143 143 143 143 CAIDI C 55 55 55 55
Minutes per interruption
SAIFI B+C 2.5 2.5 2.5 2.5 Interruptions per year SAIDI B+C 150 150 150 150 Minutes per consumer per year CAIDI B+C 60 60 60 60 Minutes per interruption
5.2.5 Capacity Targets
Capacity management at distribution level is an integral part of the planning process. Closely
associated with the concepts of asset utilisation (Section 5.3.3), load vs capacity targets are
key planning criteria that drive the need to spend development capex.
There are four perspectives that determine capacity in an electricity distribution network:
• The normal operational capacity of an asset (usually this is dictated by the temperature
that the asset is allowed to operate at under normal conditions);
• The ability of the asset to maintain adequate voltage;
• The fault capacity of an asset, either thermal or mechanical; and,
• The asset’s economic capacity (that is where the marginal cost of increasing the
conductor size equates to the marginal cost of NPV of losses).
Network asset capacity is usually dictated by the operational temperatures set out in Table
5.3:
Table 5.3: Target Maximum Temperatures for Capacity Constraints.
Asset Normal Operation - Maximum Temperatures
Fault Conditions – Maximum Temperatures
XLPE cable conductor 90oC 250oC PILC cable conductor 65oC 160oC AAAC Overhead Line 50oC 250oC PVC Covered Overhead Line 50oC 160oC ACSR Overhead Line 50oC 600oC Transformer Hot Spot (Emergency) 115oC -
Network capacity is monitored through the Long Term, Medium Term and Short Term
planning process with improvement initiatives included in the works plan.

Section 5
Subject Performance Levels
Date Issued 30 June 2005
Page 54
Powerco Limited Asset Management Plan – Electricity Networks 2006 - 2020
5.2.6 Quality Targets
Quality of supply targets are considered in the context of:
• Voltage regulation;
• Momentary voltage fluctuations; and,
• Harmonics.
Powerco’s voltage regulation targets are in line with statutory requirements, which are that the
voltage shall be maintained within ±6% at the consumer’s point of connection. Performance
outside the target is usually indicated by low voltage complaints from consumers. Corrective
action is taken as soon as possible after the performance gap is identified.
Presently there are no statutory requirements in respect of transient fluctuations from the
statutory voltage limits.
Increasing use of electronic devices is resulting in a progressive deterioration of waveform
quality and it is likely that further measures will need to be introduced and enforced to monitor
and control harmonics over the next decade. Harmonics also affect neutral and transformer
ratings.
5.2.7 Target Levels for Additional Service Performance Elements
There are other performance targets that are lead indicators for the consumer service aspects
of service performance. They provide insight into the underlying performance of the network,
which ultimately delivers the various elements of service performance.
Security of supply is a key lead indicator of service performance and targets are discussed in
Section 6 of this plan.
5.2.8 Targeted Number of Faults per km of line
This measure, considered with demographic factors, helps to identify reliability improvement
options that are worth pursuing, such as line segmentation, upgrades and additional feeders.
Regionally, comparing results identifies where improvements can be made through
researching the cause of poor fault/km performance.
Table 5.4: Targeted Future Average Number of Faults per 100 km per year.
Average No. of Faults per 100km per year Voltage 2006 2007 2008 2009
6.6kV 10.63 10.63 10.63 10.63 11kV 11.3 11.3 11.3 11.3 22kV 11.0 11.0 11.0 11.0 33kV 6.9 6.9 6.9 6.9 66kV 5.5 5.5 5.5 5.5

Section 5
Subject Performance Levels
Date Issued 30 June 2005
Page 55
Powerco Limited Asset Management Plan – Electricity Networks 2006 - 2020
5.2.9 Targeted Number of Interruptions
The targeted number of interruptions is given below in Table 5.5.
Table 5.5: Targeted Average Number of Interruptions.
Average No of Interruptions Interruption Type 2006 2007 2008 2009
Planned Interruption by Powerco (class B)
831 831 831 831
Unplanned interruptions by Powerco (class C)
1830 1830 1830 1830
5.2.10 Fault Reporting and Dispatch Processes
Although the Fault Recording and Dispatch process is not precisely a target, it does dictate
how consumer service performance is achieved. Arrangements with the Retailers provide for
the Retailer to be the first point of contact in respect to any query or complaint from small
consumers – except where there is an emergency situation (in which case there is an 0800
number available through which the consumer or member of the public can advise Powerco
direct). This arrangement is intended to minimise confusion about the roles of the Retailers,
as distinct from the distribution companies. Large consumers may contact Powerco directly
via either the 0800 number of their Key Account Manager.
The Retailers are expected to advise Powerco’s Network Operations Centre (NOC) of any
concerns regarding the performance of the network on a regular daily basis. Field staff will be
dispatched to attend faults while maintaining liaison with the NOC to ensure that any
inspection or remedial work is carried out in complete safety an in coordination with other
activities on the network. In the case of an outage affecting several consumers, close liaison
with the NOC also ensures that field work is prioritised in a way that ensures that faults
affecting the greatest number of consumers (or economically significant) are restored first.
5.2.11 Electricity Supply Continuity Planning Process
Powerco has established an Electricity Supply Continuity Plan that provides for larger
numbers of field staff (with appropriate local knowledge and qualifications) to be brought into
the field in he event that there is widespread damage to a part of the network. The Electricity
Supply Continuity Plan also provides for increasing levels of readiness as weather (or other
conditions) deteriorate.
The Electricity Supply Continuity Plan provides for the field staff to be supported and
supervised by Site Control Officers from the immediate locality. In this situation the
communication mechanisms initiated allow for a greater level of local autonomy for making
decisions ensuring that safe practices continue to be maintained while power is restored as
quickly as possible. Communication mechanisms are escalated further in the event that
particularly adverse events lead to declaration of a civil defence emergency (by local territorial
planning authorities).

Section 5
Subject Performance Levels
Date Issued 30 June 2005
Page 56
Powerco Limited Asset Management Plan – Electricity Networks 2006 - 2020
5.2.12 Customer Initiated Works Process
The Customer Initiated Works process is another key process for ensuring good customer
service performance. Requests for new or existing customers to carry out work on Powerco’s
network are covered by Powerco’s Customer Initiated Works process. This process places
importance on providing new and existing consumers with a choice of prequalified contractors
that they can engage to carry out work at their connection point(s). The process adopted
ensures that the integrity of the overall local network and the quality of supply to adjacent
consumers is retained while making the Customer Initiated Work contestable.
A Customer Works Engineer provides the contact point between the customer, or customer’s
representative, and Powerco. An Approved Contractor working in accordance with Powerco’s
Contract Works Manual can usually complete routine or simple work. Moderately complex or
medium sized works have their design details assessed before approval by the Customer
Works Engineer. Complex or large works are referred to the Asset Management Planning
team for scoping and review. Works of this nature may require high levels of planning and
design input before work can commence.
5.3 Target Performance for Economic Efficiency Economic efficiency is the most significant of all asset management drivers, and a balance
between service and economic efficiency (asset investment/utilisation and maintenance and
operating costs) needs to be considered in asset management decision making. This section
describes how the economic efficiency driver is integrated into the asset management
process.
To determine whether economically efficient decisions have been made and whether a
network operation is economically efficient requires measurement of a number of factors.
Powerco makes the following economic efficiency measurements:
• Asset efficiency;
• Asset utilisation (physical asset capacity utilisation and load factor); and,
• Cost performance.
Performance targets for these measures are presented below.
5.3.1 Integration of Economic Efficiency Drivers into Asset Management
5.3.1.1 Asset Replacement Economic Assessment
Economic efficiency is an important driver for maintenance, renewal and development work.
A large proportion of repair work, refurbishment and asset replacements are undertaken only
after economic analysis to determine the most cost-effective solution. This frequently involves
the choice between replacement and continued maintenance.

Section 5
Subject Performance Levels
Date Issued 30 June 2005
Page 57
Powerco Limited Asset Management Plan – Electricity Networks 2006 - 2020
The decision making process for asset replacement is shown in Figure 5.1 below.
To calculate the Marginal Cost of Continued Ownership the following items are considered:
• Risk of failure (annualised risk cost);
• Asset maintenance and operating costs;
• Asset disposal cost; and,
• Asset market value.
Figure 5.1: The Asset Replacement Decision Process
To calculate the Life-Cycle Cost of Ownership of New Asset the following items are
considered:
• Risk of failure (annualised risk cost);
• Asset maintenance and operating costs;
• Asset disposal cost (this is typically negligible due to the long time to disposal); and,
• Asset purchase cost.
If there are significant “over-riding” risks such as reliability (i.e. imminent failure), safety,
environmental impact or capacity, a project economic analysis may not be necessary.

Section 5
Subject Performance Levels
Date Issued 30 June 2005
Page 58
Powerco Limited Asset Management Plan – Electricity Networks 2006 - 2020
There is an inherent economic viability in the safety, environmental and general planning
criteria. That is, the standards set under these areas have already been tested for economic
sustainability; therefore repeating the economic testing does not add any value.
5.3.1.2 Planning Criteria Economic Assessment
Economic viability testing is performed when planning criteria are set or reviewed. The life
cycle cost of ownership of a notional network or portion of a network constructed using the
planning criteria is determined. This cost-of-ownership is tested against other network
scenarios to ensure the most economically viable criteria are selected.
In setting the planning criteria, the balance between service, economic efficiency and reliability
needs to be considered. There are significant “trade-offs” to be made with the level of assets
employed to provide security and the resulting reliability performance. That is, in general, an
increased quantity of assets, providing greater redundancy and security, provides increased
service performance, but increases the price of the service, due to the asset investment return
requirements and costs, and reduces utilisation.
5.3.1.3 Maintenance Techniques Economic Assessment
When maintenance techniques are reviewed or changed, the effect on long-term asset
ownership cost is considered, rather than the short-term effects on maintenance expenditure.
The economic analysis consists of a comparison of the marginal annualised cost of the
maintenance, risk costs and disposal over the remaining life of the asset.
5.3.1.4 Consumer Initiated Developments Economic Assessment
When determining investment into consumer initiated network developments such as
subdivisions and network extensions for new consumers, the expected financial return is
weighed against the life-cycle cost of ownership of the new assets. Powerco’s investment into
new consumer-initiated works is set at the level that will provide the required commercial
return given the projected revenue and costs. The payback period considered in the NPV
analysis may be adjusted to account for risk of connected business (es).
5.3.2 Asset Efficiency Performance Targets
Asset efficiency is a measure of the value of assets employed to provide the service. To allow
benchmarking against other electricity lines companies the common measure of Optimised
Depreciated Replacement Cost per Consumer (ODRC/ICP) has been used. The measure of
ODRC/ICP accounts for the age of the asset (i.e. the depreciated asset cost is used) and
hence there can be some distortion when comparing networks with different average ages.

Section 5
Subject Performance Levels
Date Issued 30 June 2005
Page 59
Powerco Limited Asset Management Plan – Electricity Networks 2006 - 2020
A more consistent measure of asset efficiency is the measure of Replacement cost per
Consumer (RC/ICP), which removes the depreciation factor. Similar measures are developed
per MWh delivered.
Powerco’s asset efficiency targets are presented in Table 5.6 below: These have been
updated from the previous AMP to account for the increased ODV replacement costs.
Table 5.6: Asset Efficiency Performance Targets.
KPI Description Unit 2006 2007 2008 Asset Efficiency (ODRC/ICP) $/ICP <3000 <3000 <3000 Asset Efficiency (RC/ICP) $/ICP <6000 <6000 <6000 Asset Efficiency (ODRC/MWh) $/MWh <225 <225 <225 Asset Efficiency (RC/MWh) $/MWh <450 <450 <450 Capital Efficiency % 100 100 100 Change in asset service potential % >0 >0 >0
Notes: 1. Asset efficiency (ODRC/MWh) is the ratio of network optimised depreciated replacement cost over input
network MWh. 2. Asset efficiency (RC/MWh) is the ratio of network replacement cost over input network MWh. 3. Capital efficiency is the annual network Capital Expenditure over the change in ODRC as a percentage. It will
only be calculated when both start and end ODRC values are known. It excludes the reduction due to depreciation and any gain due to asset revaluation during the period.
4. Change in Asset Service Potential is the change in ODRC from year start to year-end. It will only be calculated when both start and end ODRC values are known. It includes the reduction due to depreciation but excludes any gain due to asset revaluation during the period.
5.3.3 Asset Utilisation Performance Targets
Asset utilisation is the measurement of the physical utilisation of the assets employed. The
utilisation measurements used focus on the utilisation of capacity of the assets. The following
utilisation targets, based on international data, are used:
Table 5.7: Asset Utilisation Performance Targets
KPI Description 2006 Zone Substation Transformer 60% Distribution Transformer by supply MD 30% Distribution Transformer by disaggregated feeder MD 38% Distribution Feeder 65% Load Factor 60%
Notes: 1. Zone Substation Transformer utilisation is the substation maximum demand over total substation ONAN rating. 2. Distribution transformer utilisation is calculated for both aggregated and disaggregated demand. 3. Aggregated: Network kW MD over distribution transformer capacity. 4. Disaggregated: Sum of disaggregated feeder MDs over distribution transformer capacity. 5. Distribution Feeder utilisation is the disaggregated feeder maximum demand over the winter 6 pm capacity of
the smallest section of distribution feeder.
5.3.4 Direct Cost Performance Targets
For the efficient operation of an electricity network company the direct costs need to be
monitored and carefully controlled. The Asset Management Plan considers network
expenditures. Total organisation cost has not been considered because corporate costs are
not under the control of the asset management process. Direct network expenditures include:
• Asset management;

Section 5
Subject Performance Levels
Date Issued 30 June 2005
Page 60
Powerco Limited Asset Management Plan – Electricity Networks 2006 - 2020
• Network operating and maintenance; and,
• Network control function (Powerco’s Network Operations Centre)
The targeted performance for direct cost per km of line is given in Table 5.8 below:
Table 5.8: Direct Cost Performance Targets
KPI Description 2006 2007 2008 Direct Cost per km of line ($/km) 1,130 1,160 1,192
Notes: 1. The direct cost targets include utility rates and network operating. 2. Direct Costs expressed in nominal terms.
5.3.4.1 Network Loss Performance Targets
Network losses occur due to resistance as electricity passes through lines and other network
elements. Losses can be minimised through good engineering but never eliminated entirely,
and it is not usually economic to minimise them. Although not directly charged to lines
companies, losses are an operating cost to be controlled and balanced against other costs.
The economic lifetime costs to pass electricity through lines vary according to the amount of
current a line carries, with the cost of losses increasing in proportion to the square of the
current carried.
Network losses can be determined by calculating the difference between energy flowing into
the network and energy flowing out. This relies on information provided from Retailers. The
targeted level of network losses is 6%.
5.4 Performance of Contractors
5.4.1 Prequalification of Contractors
Potential contractors for work on the network are given the opportunity to prequalify as
competent to perform work on Powerco’s network. This is one way that Powerco uses to
ensure that work performed has adequate quality, and that contractors have the capabilities to
attend faults in a timely manner and make repairs efficiently and effectively, in a way that
meets Powerco’s own compliance standards and legislated requirements.
5.4.2 Maintenance Scheduling
When maintenance is required on the network, contractors have to schedule a shutdown with
the Network Operations Centre in advance. The contractors prepare their own switching plan
that is considered and approved by the Network Operations Centre. In determining the
suitability of a scheduled shutdown (depending on the length of the shutdown, the types and
numbers of consumers affected) the Network Operations Centre considers the following:
• Feedback from Retailers with affected consumers;
Section 5
Subject Performance Levels
Date Issued 30 June 2005
Page 61
Powerco Limited Asset Management Plan – Electricity Networks 2006 - 2020
• The effect on special connections (for instance Powerco has a list of connections that rely
on electricity for providing dialysis treatment or who rely on electricity supply for medical
needs);
• The impact on large or electricity dependant consumers. For instance, shutdowns in
dairying areas are scheduled not to coincide with milking times;
• The period available to inform consumers of the shutdowns; and,
• Alternative arrangements that may be available for consumers, including the availability of
generators.
5.4.3 Monitoring Quality of Workmanship
Powerco has a well developed contracts work audit process directed to ensuring that the work
carried out on the network meets Powerco’s standards in terms of workmanship and safe
working practices. Although engaged by Powerco’s Asset Management Group, the auditors
are charged with carrying out their duties on a completely independent basis.
The audit process involves:
• Regular inspection of the work during construction for workmanship and safe working
practices. The auditors prepare independent reports and the findings are passed on to the
Asset Management Group;
• Copies of the audit reports are forwarded to the contractors on the understanding that any
necessary remedial work will be completed within a fixed period of time. In respect of safe
working practices any required change should normally be implemented immediately; and,
• A final inspection of the completed work is undertaken, if required to receive a satisfactory
audit report before “close off”.
5.5 Target Performance for Safety Electrical plant and equipment are capable of causing serious harm and measures must be
taken to ensure, as far as practicable, the safety of employees and the public.
For the safety of staff and the public, the network must be maintained in a way that meets
statutory requirements, follows good engineering practice, and is considered safe in
accordance with recognised industry standards.
Safety is determined by a combination of:
• Asset design;
• Maintaining the assets in a safe condition; and,
• Safe operating and work practices.
The statutory safety drivers are:

Section 5
Subject Performance Levels
Date Issued 30 June 2005
Page 62
Powerco Limited Asset Management Plan – Electricity Networks 2006 - 2020
• The Electricity Regulations, Electrical Codes of Practice and the Australian / New Zealand
Standard Wiring Rules. These contain the general framework for Powerco’s safety
related asset management. They require existing assets to be maintained in good order
and repair to protect from danger;
• The Safety Manual – Electricity Industry (SM-EI). SM-EI contains the framework for
Powerco’s safety related network operation. Powerco has now implemented its network
operating procedures to comply with the requirements of SM-EI;
• Safe Practices for Low Voltage Electrical Work. This is a safe working code for work on
Low Voltage equipment;
• The Building Act. This puts in place a building maintenance regime which is aimed at
ensuring the existence of essential safeguards for the users of buildings; and,
• The Health and Safety in Employment Act. This is a key item of safety legislation. While
not overriding safety requirements found in other electrical Acts and Regulations, this Act
requires all hazards associated with assets to be identified, assessed, and controlled if
found to be significant. This is achieved by duties set on all parties associated with
design, construction, maintenance and operation of assets.
• The Hazardous Substances and New Organisms Act 1996: This is relevant as it sets out
requirements for handling certain chemicals that are used from time to time during
equipment maintenance and construction.
Powerco has adopted the practice of working as a reasonable and prudent operator as a
guide to safe asset management practices. Its health and safety policy and procedures are
set out in documents in the Powerco Business Management Network (BMS).
Powerco’s targeted health & safety performance is zero injuries to Asset Management
personnel, contractors or the public.
5.6 Target Performance for Environmental Responsibility Powerco’s policy is to act as a good corporate citizen, in an environmentally responsible
manner, and in accordance with legislation. Environmental assessments for Powerco
development proposals will continue to be prepared by independent consultants for
compliance with the Resource Management Act 1991.
Powerco’s targeted environmental management performance is zero environmental incidents.
5.7 Risk Management Powerco’s risk management strategy and techniques are explained in Section 7 of this plan.
In summary, risk management is implemented to reduce the likelihood of the targeted
performance not being achieved and to reduce the consequences to the company and its
stakeholders if this happens.

Section 5
Subject Performance Levels
Date Issued 30 June 2005
Page 63
Powerco Limited Asset Management Plan – Electricity Networks 2006 - 2020
Measurement of risk management is achieved through monitoring of key performance
indicators and verification that risks are being considering in the decision-making processes.

Section 6
Subject Network Performance and Lifecycle Asset Management Plan
Date Issued 30 June 2005
PaPage 64
Powerco Limited Asset Management Plan – Electricity Networks 2006 - 2020
6 NETWORK DEVELOPMENT AND LIFECYCLE ASSET MANAGEMENT PLAN
6.1 Introduction This section of the plan describes network development, analysis, maintenance management,
reliability assessment and associated lifecycle management processes of network assets.
The planning criteria in the following sections describe the factors considered when preparing
the long and medium term development plans.
6.2 Planning Criteria – Long Term (Subtransmission) Planning The long-term development plan deals with the subtransmission network and zone
substations. Key issues taken into account in subtransmission network planning are:
• Forecast growth rate for electrical load at existing zone substations;
• The horizon year load densities within the supply area related to zone substation
utilisation;
• Development of the subtransmission system with particular reference to the total number
and size of zone substations foreseen in the horizon year;
• The need for effective utilisation of capital investment on the network;
• The need to meet objectives for supply reliability, quality and safety; and,
• Reinforcement strategy beyond the horizon year.
6.2.1 Security Of Supply Standards
Security of supply requirements for zone substations are as follows:
Table 6.1: Zone Substation Security Classification
Substation Classification
Average Duration for First Interruption
Average Duration for Second Interruption
AAA None 50% to 100% load, 60 minutes Remainder, repair time
AA+ 15 seconds 50% to 100% load, 60 minutes Remainder, repair time
AA 45 minutes Repair time A1 Isolation time Repair time A2 Repair time Repair time
Details of the classifications are as follows:
AAA Supply is uninterrupted in the event of the outage of one major element of the
network. Load can be transferred to other substations without interruption by
switching on the network if necessary to avoid exceeding ratings. If two lines or
cables supplying a zone substation are in sufficient proximity for a single event to
Section 6
Subject Network Performance and Lifecycle Asset Management Plan
Date Issued 30 June 2005
PaPage 65
Powerco Limited Asset Management Plan – Electricity Networks 2006 - 2020
cause the failure of both, at least 50% of the load can be supplied from an alternative
source.
AA+ Supply may be lost in the event of the outage of one major element of the network.
Supply is restored automatically within 15 seconds by automatic switching at
subtransmission or distribution level. If two lines or cables supplying a zone
substation are in sufficient proximity for a single event to cause the failure of both, at
least 50% of the load can be supplied from an alternative source. (However, this is
infrequent for AA+ supplies).
AA Supply may be lost in the event of the outage of one major element of the network.
Supply can be restored in 45 minutes by switching at subtransmission or distribution
level.
A1 Supply may be lost in the event of the outage of one major element of the
subtransmission network. Supply can be restored by switching after the faulted
element is isolated.
A2 Supply may be lost in the event of the outage of one major element of the
subtransmission network. Supply cannot be restored until the faulty element is
repaired or replaced.
Where a group of AAA or AA+ security zone substations supply a population centre of 40,000
or more, they should be supplied at least partially from more than one GXP.
Table 6.2 below sets out the criteria and selection process for zone substation security levels
and feeder classification. It is applied subject to economic and technical feasibility. The levels
of customer satisfaction expressed in the Powerco Price / Quality Trade-off Study have been
taken into consideration in confirming these security levels.
The security criteria are tested to ensure that they result in an economic network
configuration, and Powerco has some zone substations where provision of this security level
is not economically feasible. In these cases, particular care is taken to ensure that the critical
components of the supply system are as reliable as possible.
There are a number of substation buses requiring AAA security, where the design of the
network makes its provision technically infeasible. These have been or will be upgraded to
AA+ security.

Section 6
Subject Network Performance and Lifecycle Asset Management Plan
Date Issued 30 June 2005
PaPage 66
Powerco Limited Asset Management Plan – Electricity Networks 2006 - 2020
Table 6.2: Zone Substation Security Level Selection
Zone Substation Maximum Demand Load Type < 1MVA 1 – 5MVA 5 – 12MVA >12MVA
F1 AA AA AA+ AAA F2 AA AA AA+ AAA F3 AA AA AA AA F4 A1 A1 A1 n/a F5 A2 A2 n/a n/a
Table 6.3: Distribution Feeder Classifications
Classification Description F1 Large Industrial F2 Commercial / CBD F3 Urban Residential F4 Rural F5 Remote Rural
Security levels for large customers are agreed upon by negotiation. For example, Kinleith
Paper Mill requires a high supply reliability level and this is to some extent reflected in the
levels of security provided at the site. In these cases the security criteria are tested to ensure
they result in an economic network configuration.
Powerco’s security criteria are deterministic rather than probabilistic in nature. At the concept
design stage however larger projects are required to pass an economic assessment as well as
a multi-stakeholder assessment, with little value from a probabilistic planning perspective
would be unlikely to pass both assessments. Generally projects that meet deterministic
criteria would also fulfil probabilistic criteria but this is not always the case (refer to Section
6.10) Projects.
6.3 Planning Criteria – Medium Term (Distribution) Planning This section describes the key planning criteria that have been adopted to guide the
development of the distribution network. Key distribution system planning issues are as
follows:
• Area forecast load growth;
• Asset utilisation;
• Loss optimisation through optimal conductor selection and optimised open point
configuration;
• Industrial, commercial and residential developments affecting specific areas of supply;
• Demand side management (DSM) initiatives;
• The results of Powerco’s Price / Quality consultation;
• Legislation allowing non-economic supplies to be discontinued after 2013;
• Service criteria met; and,
• Distribution standards review.

Section 6
Subject Network Performance and Lifecycle Asset Management Plan
Date Issued 30 June 2005
PaPage 67
Powerco Limited Asset Management Plan – Electricity Networks 2006 - 2020
Medium term distribution planning is undertaken within the framework of the long term network
development plan typically on 5 year rolling cycles. This shorter time frame is suitable for
budgeting of capital works at distribution level.
6.3.1 General Feeder Loading Principles
With distribution at 11kV, the load per feeder averages 3MVA but this could go up to 4MVA.
Working on the "two thirds" principle of design, feeders are generally rated for 6MVA
maximum load. Lower loadings are used in rural areas where lower load densities and
capacities are expected to apply in the long term. The 22kV and 6.6kV feeders are in lower
load density areas, and do not normally carry loads of this magnitude.
Generally when the number of consumers on a feeder exceeds 1500, efforts will be made to
split the feeder, either by shifting open points or by adding a new feeder.
6.3.2 Underground vs. Overhead Construction
Powerco's policy on overhead vs. underground construction is as follows:
• Overhead lines in urban areas will be replaced with underground circuits at the end of
their economic life, provided that funding for the uneconomic portion can be obtained from
an outside source;
• New urban circuits shall be constructed underground in accordance with the district plan;
and,
• New rural circuits will be constructed overhead unless there is a specific consumer
request for underground, such as a rural lifestyle block subdivision. In this case the design
must be in line with Powerco standards, and the full additional cost must be met by the
consumer.
6.3.3 Feeder Configuration
When considering the configuration of feeders, the ability of the feeder to meet the reliability
performance targets, assuming it is properly maintained, is the overriding objective. The
factors that affect reliability are the probability of a fault and the typical repair or restoration
time. As the reliability of the equipment is governed by its condition and thus influenced by
maintenance, the maintenance criteria have been set to ensure the repair or restoration time
is sufficiently short to meet the required reliability given the inherent equipment reliability. An
ongoing project to identify the worst performing feeders and carry out improvements on them
is described in Section 8.
6.3.4 Carter Hold Harvey Kinleith Mill
Development planning of the electrical distribution assets at Kinleith is dependant on and
coupled with the plans for developing the plant. These in turn are coupled to the forestry
industry, world pulp and paper markets and the value of the New Zealand dollar. Regular
meetings are held with Carter Holt Harvey Kinleith to discuss long term plans.

Section 6
Subject Network Performance and Lifecycle Asset Management Plan
Date Issued 30 June 2005
PaPage 68
Powerco Limited Asset Management Plan – Electricity Networks 2006 - 2020
6.3.5 Uneconomic Supplies After 2013
Under Section 62 (6) of the Electricity Act 1992, Powerco will not be required to supply
uneconomic loads after 2013. The Government has however signalled that it intends to
review this part of the Act in 2007. Powerco has commenced initial consideration of this
matter, and while no policy has yet been determined, it is certain that the possibility of supply
being discontinued from 2013 will be heavily influenced by the regulatory environment of the
day. Discontinuation would most likely be considered in its economic evaluation at the time of
asset renewal or when significant vegetation control is needed. In particular, consideration is
being given to the following:
• The use of softwood poles and low cost conductor on marginally economic lines;
• Distributed generation for non-economic loads;
• Need for tree trimming;
• Setting up a register of uneconomic loads;
• Negotiation with consumers about continued Powerco ownership vs. consumer
ownership; and,
• Alternative pricing regimes.
6.4 Planning Criteria - Short term (Reticulation) Planning Key reticulation system planning issues are as follows:
• Upgrading existing supplies to existing customers;
• Connecting new customers;
• Loading of distribution substations;
• Legislation on non economic supplies after 2013;
• Voltage and other quality of supply complaints; and,
• The economics of standard reticulation designs.
Reticulation planning is undertaken with a 2 year planning horizon. Typically this is combined
with capital works planning at all levels.
The economics of LV system coverage, conductor sizes and distribution substation size for
different load densities are reviewed periodically to accommodate changes in unit costs and
new construction techniques. The cost efficiency of standard implementation associated with
LV networks will also be assessed.

Section 6
Subject Network Performance and Lifecycle Asset Management Plan
Date Issued 30 June 2005
PaPage 69
Powerco Limited Asset Management Plan – Electricity Networks 2006 - 2020
6.5 Load Demand Forecast
6.5.1 Load Forecasting Process
Powerco’s demand forecasts are based on a mixture of historical load growth trends and
econometric and population trend data from Department of Statistics and territorial local
authority growth forecasts.
Changing load patterns in the residential sector are likely to impact on future growth in peak
demand, particularly given the Electricity Commission’s recent interest in energy efficiency as
a means of deferring transmission investments. Energy efficient appliances may reduce the
rate of growth. This has been taken into account in the forecast. The future pattern of load
control use may also affect load growth, and this will be monitored for future revisions of this
plan.
The effects of a reduction of gas supply could be considered in the load forecast. However,
with the heavy investment made in the gas network and being made in gas exploration, a run
down in gas supply for reticulation purposes is not expected to occur within the forecast
period. If evidence shows that a rundown in gas supply is imminent, it can be accommodated
within future revisions of the plan.
Also of potential significance is the prospect of further changes in the major industries in
Powerco's service area. Such changes are hard to predict and will be monitored and taken
into account in future plans, as the changes occur.
The forecast has been based on the use of load control equipment. In some cases, faulted
load control relays have been bypassed, reducing the controllable load. This can affect the
substation maximum demand.
Variations between forecast demand and actual demand can be easily accommodated: Faster
than forecast growth can be catered for forecast growth can be dealt with by deferral. To
minimise the risks of having to unexpectedly advance works, the zone substation peak
demand forecast errors towards the high side.
6.5.2 Forecast Summary
Annual volume, ICP numbers and peak load growth forecasts for the years 2006 to 2008 are summarised in Table 6.4 below.
Table 6.4: Forecast growth rates in electricity volume, ICP numbers and peak growth demand (2006 – 2008)
Item Eastern Region Western Region Annual kWh Consumption Growth Rate 3.7% 1.0% ICP Number Growth Rate 2.2% 1.1% Average GXP Peak Demand Growth Rate 3.2% 0.8%

Section 6
Subject Network Performance and Lifecycle Asset Management Plan
Date Issued 30 June 2005
PaPage 70
Powerco Limited Asset Management Plan – Electricity Networks 2006 - 2020
Eastern region energy demand (in terms of volume) has grown at an average rate of 3.7% per
annum since 1999. This rate of growth is expected to continue for the next three years, then to
reduce to 3.0% per annum from 2009 to 2012 and 2.5% per annum beyond 2012. This
expectation is in line with the work done by SmartGrowth, who predict a continuation of rapid
population growth in Tauranga.
Growth of 1% is projected for the Western Region. This is a slight moderation from previous
forecasts and reflects a recent lessening in demand from some more rural locations.
Western Region ICP growth of 1.1% has occurred during the last five years. The increase
reported on in the last AMP appears to be fluctuating – although continues to be positive.
Medium term growth in ICP’s in the Eastern Region is forecast at 2.2%. Growth has been
moderating in the Valley Sub-region though accelerating in the Tauranga Sub-region.
Nonetheless, some planning agencies foresee very strong growth in household numbers in
the eastern Coromandel as well as Tauranga. ICP growth rates of around 2.5% for the
Eastern Region continue to be expected toward the end of the decade.
The peak demand growth rates for the Eastern Region have declined from those being
reported until recently, particularly in Tauranga. Although still considerable, the more recently
observed trends have been generally lower than for the volume consumption rates – as has
continues to be the case in the Western Region. Given the effects of ongoing increases in
migration into Tauranga and the service enhancements resulting from the SmartGrowth
strategy the long term peak demand rate into that sub-region is expected to be somewhat
higher than more recently observed. Transpower has forecast a peak demand commensurate
with the figure currently observed for volume growth (3.7%) through to the year 2010. Peak
demand rates for the last 3 years are as given in Figure 6.1 below.
Figure 6.1: Per Annum Peak Load Growth levels in Electricity Demand by Region
Electricity Demand Growth Rate by Region 2002 - 2005
-0.50%
0.00%
0.50%
1.00%
1.50%
2.00%
2.50%
3.00%
3.50%
Manawatu Taranaki Tauranga Valley Wairarapa Wanganui
Gro
wth
Rat
e (%
)

Section 6
Subject Network Performance and Lifecycle Asset Management Plan
Date Issued 30 June 2005
PaPage 71
Powerco Limited Asset Management Plan – Electricity Networks 2006 - 2020
6.5.3 The Forecast
Forecast peak power demands for each zone substation in the Powerco network follow in
Table 6.5 to Table 6.10 on the following pages. The following points should be noted:
• The maximum half hourly average is the highest half hour peak recorded in the year. It
may have occurred when load was transferred temporarily. However, as this transfer may
be repeated in the future, items with little or no cyclic loading capability, such as
switchgear and cables, should be sized to accommodate this load;
• The 98th percentile half hourly load is used for determining transformer rating, load
transfer capability etc;
• As it is not considered prudent to forecast small or negative load growth, unless this is
known to be going to occur, a default load growth of 1% is used for load growths less than
1.5%, except where load growth is known to be zero; and,
• Load demands for 2006 are actual demands recorded from the SCADA system where
available, and MDI readings otherwise.
It should be noted that load growths are for the area currently supplied by the substation in
question. In some cases it will not be practical to reinforce the substation to accommodate the
2020 load, and load transfers and network reinforcement will be required to accommodate it.
These will be programmed as this plan is reviewed year by year.
Comparing the load growth projections against territorial local authority plans and other
demographic information such as census data, real estate and property development
forecasts, business forecasts and national economic projections, indicates that these
forecasts appear adequately accurate for planning purposes.

Section 6
Subject Network Development and Lifecycle Asset Management Plan
Date Issued 30 June 2005
Page 72
Powerco Limited Asset Management Plan – Electricity Networks 2006 - 2020
Table 6.5: Forecast Maximum Demands for Manawatu Zone Substations
Substation Forecast Growth
Peak Type 2005 2006 2007 2008 2009 2010 2011 2012 2013 2014 2015 2016 2017 2018
Alfredton 1.00% Max 1/2 hourly avg 0.6 0.6 0.6 0.6 0.6 0.6 0.6 0.6 0.6 0.7 0.7 0.7 0.7 0.7 98th %ile 1/2 hourly avg 0.6 0.6 0.6 0.6 0.6 0.6 0.6 0.6 0.6 0.7 0.7 0.7 0.7 0.7 Feilding 1.50% Max 1/2 hourly avg 17.7 17.9 18.2 18.5 18.7 19.0 19.3 19.6 19.9 20.2 20.5 20.8 21.1 21.4 98th %ile 1/2 hourly avg 16.3 16.5 16.8 17.0 17.3 17.5 17.8 18.1 18.3 18.6 18.9 19.2 19.5 19.7 Kairanga 2.00% Max 1/2 hourly avg 15.7 16.0 16.3 16.6 17.0 17.3 17.7 18.0 18.4 18.7 19.1 19.5 19.9 20.3 98th %ile 1/2 hourly avg 13.4 13.7 14.0 14.3 14.5 14.8 15.1 15.4 15.7 16.1 16.4 16.7 17.0 17.4 Keith St 1.00% Max 1/2 hourly avg 12.4 12.5 12.7 12.8 12.9 13.0 13.2 13.3 13.4 13.6 13.7 13.8 14.0 14.1 98th %ile 1/2 hourly avg 9.2 9.3 9.4 9.5 9.6 9.7 9.7 9.8 9.9 10.0 10.1 10.2 10.3 10.5
1.00% Max 1/2 hourly avg 11.5 11.6 11.7 11.8 12.0 12.1 12.2 12.3 12.4 12.6 12.7 12.8 12.9 13.1 Kelvin Grove 98th %ile 1/2 hourly avg 9.7 9.8 9.9 10.0 10.1 10.2 10.3 10.4 10.5 10.6 10.7 10.8 10.9 11.1 Kimbolton 1.00% Max 1/2 hourly avg 2.6 2.7 2.7 2.7 2.8 2.8 2.8 2.8 2.9 2.9 2.9 3.0 3.0 3.0 98th %ile 1/2 hourly avg 2.2 2.2 2.2 2.2 2.3 2.3 2.3 2.3 2.4 2.4 2.4 2.4 2.4 2.5 Main St 2.00% Max 1/2 hourly avg 31.9 32.5 33.2 33.8 34.5 35.2 35.9 36.6 37.4 38.1 38.9 39.7 40.4 41.3 98th %ile 1/2 hourly avg 23.8 24.3 24.8 25.3 25.8 26.3 26.8 27.4 27.9 28.5 29.1 29.6 30.2 30.8 Mangamutu 1.50% Max 1/2 hourly avg 8.6 8.8 8.9 9.0 9.2 9.3 9.5 9.6 9.7 9.9 10.0 10.2 10.3 10.5 98th %ile 1/2 hourly avg 8.2 8.3 8.4 8.5 8.7 8.8 8.9 9.1 9.2 9.3 9.5 9.6 9.8 9.9 Milson 1.50% Max 1/2 hourly avg 12.7 12.9 13.1 13.3 13.5 13.7 13.9 14.1 14.3 14.6 14.8 15.0 15.2 15.4 98th %ile 1/2 hourly avg 11.5 11.7 11.8 12.0 12.2 12.4 12.6 12.8 12.9 13.1 13.3 13.5 13.7 13.9 Parkville 1.00% Max 1/2 hourly avg 1.9 1.9 1.9 2.0 2.0 2.0 2.0 2.0 2.1 2.1 2.1 2.1 2.1 2.2 98th %ile 1/2 hourly avg 1.6 1.6 1.7 1.7 1.7 1.7 1.7 1.7 1.8 1.8 1.8 1.8 1.8 1.8 Pascal St 1.00% Max 1/2 hourly avg 24.6 24.9 25.1 25.4 25.6 25.9 26.2 26.4 26.7 26.9 27.2 27.5 27.8 28.0 98th %ile 1/2 hourly avg 19.8 20.0 20.2 20.4 20.6 20.8 21.0 21.2 21.4 21.7 21.9 22.1 22.3 22.5 Pongaroa 1.00% Max 1/2 hourly avg 0.8 0.8 0.8 0.8 0.9 0.9 0.9 0.9 0.9 0.9 0.9 0.9 0.9 0.9 98th %ile 1/2 hourly avg 0.6 0.6 0.6 0.6 0.7 0.7 0.7 0.7 0.7 0.7 0.7 0.7 0.7 0.7 Sanson 1.00% Max 1/2 hourly avg 8.0 8.1 8.1 8.2 8.3 8.4 8.5 8.6 8.6 8.7 8.8 8.9 9.0 9.1 98th %ile 1/2 hourly avg 6.7 6.8 6.9 6.9 7.0 7.1 7.1 7.2 7.3 7.4 7.4 7.5 7.6 7.7 Turitea 1.50% Max 1/2 hourly avg 12.6 12.8 13.0 13.2 13.4 13.6 13.8 14.0 14.2 14.4 14.7 14.9 15.1 15.3 98th %ile 1/2 hourly avg 11.2 11.4 11.6 11.7 11.9 12.1 12.3 12.5 12.6 12.8 13.0 13.2 13.4 13.6

Section 6
Subject Network Development and Lifecycle Asset Management Plan
Date Issued 30 June 2005
Page 73
Powerco Limited Asset Management Plan – Electricity Networks 2006 - 2020
Table 6.6 Forecast Maximum Demands for Taranaki Zone Substations
Substation Forecast Growth Peak Type 2005 2006 2007 2008 2009 2010 2011 2012 2013 2014 2015 2016 2017 2018
Bell Block 2.00% Max 1/2 hourly avg 18.0 18.4 18.8 19.1 19.5 19.9 20.3 20.7 21.1 21.6 22.0 22.4 22.9 23.3 98th %ile 1/2 hourly avg 16.0 16.3 16.6 16.9 17.3 17.6 18.0 18.3 18.7 19.1 19.5 19.9 20.2 20.7 Cambria 3.00% Max 1/2 hourly avg 11.5 11.8 12.1 12.5 12.9 13.3 13.7 14.1 14.5 14.9 15.4 15.9 16.3 16.8 98th %ile 1/2 hourly avg 10.2 10.5 10.8 11.1 11.5 11.8 12.1 12.5 12.9 13.3 13.7 14.1 14.5 14.9 Cardiff 1.00% Max 1/2 hourly avg 0.8 0.9 0.9 0.9 0.9 0.9 0.9 0.9 0.9 0.9 0.9 0.9 1.0 1.0 98th %ile 1/2 hourly avg 0.7 0.7 0.7 0.7 0.7 0.7 0.8 0.8 0.8 0.8 0.8 0.8 0.8 0.8 City 2.00% Max 1/2 hourly avg 19.2 19.6 20.0 20.4 20.8 21.2 21.6 22.1 22.5 23.0 23.4 23.9 24.4 24.9 98th %ile 1/2 hourly avg 15.4 15.7 16.0 16.3 16.6 17.0 17.3 17.7 18.0 18.4 18.7 19.1 19.5 19.9
1.50% Max 1/2 hourly avg 9.0 9.1 9.2 9.4 9.5 9.7 9.8 10.0 10.1 10.3 10.4 10.6 10.7 10.9 Cloton Rd 98th %ile 1/2 hourly avg 6.8 6.9 7.0 7.1 7.2 7.3 7.5 7.6 7.7 7.8 7.9 8.0 8.2 8.3 Douglas 1.00% Max 1/2 hourly avg 2.2 2.3 2.3 2.3 2.3 2.3 2.4 2.4 2.4 2.4 2.5 2.5 2.5 2.5 98th %ile 1/2 hourly avg 1.6 1.6 1.6 1.6 1.7 1.7 1.7 1.7 1.7 1.8 1.8 1.8 1.8 1.8 Eltham 2.00% Max 1/2 hourly avg 9.1 9.3 9.5 9.6 9.8 10.0 10.2 10.4 10.6 10.9 11.1 11.3 11.5 11.8 98th %ile 1/2 hourly avg 8.1 8.2 8.4 8.6 8.7 8.9 9.1 9.3 9.4 9.6 9.8 10.0 10.2 10.4 Inglewood 1.00% Max 1/2 hourly avg 4.8 4.9 4.9 5.0 5.0 5.1 5.1 5.2 5.2 5.3 5.3 5.4 5.4 5.5 98th %ile 1/2 hourly avg 4.1 4.1 4.2 4.2 4.2 4.3 4.3 4.4 4.4 4.5 4.5 4.5 4.6 4.6 Kaponga 1.00% Max 1/2 hourly avg 2.9 2.9 2.9 2.9 3.0 3.0 3.0 3.1 3.1 3.1 3.2 3.2 3.2 3.3 98th %ile 1/2 hourly avg 2.6 2.6 2.6 2.6 2.7 2.7 2.7 2.7 2.8 2.8 2.8 2.8 2.9 2.9 Kapuni 2.00% Max 1/2 hourly avg 9.5 9.6 9.8 10.0 10.2 10.4 10.6 10.9 11.1 11.3 11.5 11.7 12.0 12.2 98th %ile 1/2 hourly avg 6.2 6.3 6.4 6.6 6.7 6.8 7.0 7.1 7.3 7.4 7.5 7.7 7.9 8.0 Livingstone 1.00% Max 1/2 hourly avg 2.9 2.9 2.9 2.9 3.0 3.0 3.0 3.1 3.1 3.1 3.2 3.2 3.2 3.3 98th %ile 1/2 hourly avg 2.5 2.5 2.5 2.6 2.6 2.6 2.6 2.7 2.7 2.7 2.7 2.8 2.8 2.8 Manaia 1.00% Max 1/2 hourly avg 5.7 5.8 5.8 5.9 5.9 6.0 6.1 6.1 6.2 6.2 6.3 6.4 6.4 6.5 98th %ile 1/2 hourly avg 5.5 5.6 5.6 5.7 5.7 5.8 5.8 5.9 6.0 6.0 6.1 6.1 6.2 6.3 McKee 0.00% Max 1/2 hourly avg 1.1 1.1 1.1 1.1 1.1 1.1 1.1 1.1 1.1 1.1 1.1 1.1 1.1 1.1 98th %ile 1/2 hourly avg 1.0 1.0 1.0 1.0 1.0 1.0 1.0 1.0 1.0 1.0 1.0 1.0 1.0 1.0 Motukawa 1.00% Max 1/2 hourly avg 3,7 3.7 3.8 3.8 3.9 3.9 3.9 4.0 4.0 4,1 4.1 4.1 4.2 4.2 98th %ile 1/2 hourly avg 2.5 2.5 2.6 2.6 2.6 2.6 2.7 2.7 2.7 2.7 2.8 2.8 2.8 2.9 Ngariki 1.00% Max 1/2 hourly avg 2.4 2.4 2.4 2.5 2.5 2.5 2.5 2.6 2.6 2.6 2.7 2.7 2.7 2.7 98th %ile 1/2 hourly avg 1.7 1.7 1.7 1.7 1.7 1.7 1.8 1.8 1.8 1.8 1.8 1.8 1.9 1.9 Pohokura Max 1/2 hourly avg 4.0 4.0 4.0 4.0 4.0 4.0 4.0 4.0 4.0 4.0 4.0 4.0 4.0 4.0 98th %ile 1/2 hourly avg 3.0 3.0 3.0 3.0 3.0 3.0 3.0 3.0 3.0 3.0 3.0 3.0 3.0 3.0 Pungarehu 1.00% Max 1/2 hourly avg 3.1 3.1 3.2 3.2 3.2 3.3 3.3 3.3 3.4 3.4 3.4 3.5 3.5 3.5 98th %ile 1/2 hourly avg 2.8 2.8 2.9 2.9 2.9 3.0 3.0 3.0 3.1 3.1 3.1 3.1 3.2 3.2 Tasman 1.00% Max 1/2 hourly avg 7.2 7.3 7.3 7.4 7.5 7.6 7.6 7.7 7.8 7.9 8.0 8.0 8.1 8.2 98th %ile 1/2 hourly avg 6.4 6.5 6.5 6.6 6.7 6.7 6.8 6.9 6.9 7.0 7.1 7.1 7.2 7.3 Waihapa 0.00% Max 1/2 hourly avg 1.2 1.2 1.2 1.2 1.2 1.2 1.2 1.2 1.2 1.2 1.2 1.2 1.2 1.2 98th %ile 1/2 hourly avg 1.2 1.2 1.2 1.2 1.2 1.2 1.2 1.2 1.2 1.2 1.2 1.2 1.2 1.2 Waitara East 1.00% Max 1/2 hourly avg 3.7 3.7 3.8 3.8 3.8 3.9 3.9 3.9 4.0 4.0 4.1 4.1 4.1 4.2 98th %ile 1/2 hourly avg 3.1 3.1 3.2 3.2 3.2 3.3 3.3 3.3 3.4 3.4 3.4 3.5 3.5 3.5 Waitara West 1.00% Max 1/2 hourly avg 4.0 4.1 4.1 4.1 4.2 4.2 4.3 4.3 4.4 4.4 4.4 4.5 4.5 4.6

Section 6
Subject Network Development and Lifecycle Asset Management Plan
Date Issued 30 June 2005
Page 74
Powerco Limited Asset Management Plan – Electricity Networks 2006 - 2020
Substation Forecast Growth Peak Type 2005 2006 2007 2008 2009 2010 2011 2012 2013 2014 2015 2016 2017 2018
98th %ile 1/2 hourly avg 3.4 3.4 3.4 3.5 3.5 3.5 3.6 3.6 3.6 3.7 3.7 3.7 3.8 3.8 Whareroa 1.00% Max 1/2 hourly avg 4.6 4.7 4.7 4.8 4.8 4.9 4.9 5.0 5.0 5.1 5.1 5.2 5.2 5.3 98th %ile 1/2 hourly avg 3.4 3.4 3.4 3.5 3.5 3.5 3.6 3.6 3.7 3.7 3.7 3.8 3.8 3.8 TP Carrington 11 2.00% Max 1/2 hourly avg 23.0 23.5 23.9 24.4 24.9 25.4 25.9 26.4 27.0 27.5 28.1 28.6 29.2 29.8 98th %ile 1/2 hourly avg 20.7 21.1 21.5 22.0 22.4 22.8 23.3 23.8 24.2 24.7 25.2 25.7 26.2 26.8 TP Moturoa 2.00% Max 1/2 hourly avg 17.5 17.9 18.2 18.6 19.0 19.3 19.7 20.1 20.5 20.9 21.3 21.8 22.2 22.7 98th %ile 1/2 hourly avg 16.0 16.3 16.6 16.9 17.3 17.6 18.0 18.3 18.7 19.1 19.5 19.9 20.2 20.7
Table 6.7: Forecast Maximum Demands for Tauranga Zone Substations
Substation Forecast Growth Peak Type 2005 2006 2007 2008 2009 2010 2011 2012 2013 2014 2015 2016 2017 2018
Aongatete 3.00% Max 1/2 hourly avg 9.2 9.4 9.7 10.0 10.3 10.6 10.9 11.3 11.6 12.0 12.3 12.7 13.1 13.5 98th %ile 1/2 hourly avg 8.2 8.4 8.7 8.9 9.2 9.5 9.8 10.1 10.4 10.7 11.0 11.3 11.7 12.0 Kauri Point 2.50% Max 1/2 hourly avg 2.7 2.8 2.9 2.9 3.0 3.1 3.2 3.2 3.3 3.4 3.5 3.6 3.7 3.7 98th %ile 1/2 hourly avg 1.8 1.8 1.9 1.9 2.0 2.0 2.1 2.1 2.2 2.2 2.3 2.4 2.4 2.5 Matua 1.00% Max 1/2 hourly avg 7.9 8.0 8.1 8.1 8.2 8.3 8.4 8.5 8.6 8.6 8.7 8.8 8.9 9.0 98th %ile 1/2 hourly avg 6.5 6.5 6.6 6.7 6.7 6.8 6.9 6.9 7.0 7.1 7.2 7.2 7.3 7.4 Omokoroa 4.00% Max 1/2 hourly avg 7.0 7.3 7.6 7.9 8.2 8.5 8.8 9.2 9.6 9.9 10.3 10.8 11.2 11.6 98th %ile 1/2 hourly avg 5.9 6.1 6.3 6.6 6.8 7.1 7.4 7.7 8.0 8.3 8.7 9.0 9.4 9.7
2.00% Max 1/2 hourly avg 15.5 15.8 16.1 16.4 16.7 17.1 17.4 17.8 18.1 18.5 18.8 19.2 19.6 20.0 Otumoetai 98th %ile 1/2 hourly avg 13.2 13.5 13.8 14.0 14.3 14.6 14.9 15.2 15.5 15.8 16.1 16.4 16.8 17.1 Papamoa 5.50% Max 1/2 hourly avg 16.9 17.8 18.8 19.9 20.9 22.1 23.3 24.6 26.0 27.4 28.9 30.5 32.1 33.9 98th %ile 1/2 hourly avg 13.9 14.6 15.4 16.3 17.2 18.1 19.1 20.2 21.3 22.5 23.7 25.0 26.4 27.8 Pongakawa 2.50% Max 1/2 hourly avg 5.6 5.7 5.9 6.0 6.1 6.3 6.5 6.6 6.8 7.0 7.1 7.3 7.5 7.7 98th %ile 1/2 hourly avg 4.6 4.7 4.8 4.9 5.0 5.2 5.3 5.4 5.6 5.7 5.8 6.0 6.1 6.3 Tauranga City 4.00% Max 1/2 hourly avg 15.7 16.4 17.0 17.7 18.4 19.1 19.9 20.7 21.5 22.4 23.3 24.2 25.2 26.2 98th %ile 1/2 hourly avg 14.2 14.7 15.3 15.9 16.6 17.2 17.9 18.6 19.4 20.2 21.0 21.8 22.7 23.6 Te Puke 3.00% Max 1/2 hourly avg 18.9 19.4 20.0 20.6 21.2 21.9 22.5 23.2 23.9 24.6 25.4 26.1 26.9 27.7 98th %ile 1/2 hourly avg 16.6 17.1 17.6 18.1 18.7 19.2 19.8 20.4 21.0 21.7 22.3 23.0 23.7 24.4 Triton 4.50% Max 1/2 hourly avg 21.9 22.8 23.9 24.9 26.1 27.2 28.5 29.7 31.1 32.5 33.9 35.5 37.1 38.7 98th %ile 1/2 hourly avg 17.6 18.4 19.2 20.1 21.0 21.9 22.9 23.9 25.0 26.1 27.3 28.5 29.8 31.2 Waihi Rd 3.00% Max 1/2 hourly avg 10.1 10.4 10.7 11.1 11.4 11.7 12.1 12.5 12.8 13.2 13.6 14.0 14.4 14.9 98th %ile 1/2 hourly avg 7.7 7.9 8.1 8.4 8.6 8.9 9.1 9.4 9.7 10.0 10.3 10.6 10.9 11.2 Welcome Bay 3.00% Max 1/2 hourly avg 15.1 15.6 16.1 16.5 17.0 17.6 18.1 18.6 19.2 19.8 20.3 21.0 21.6 22.2 98th %ile 1/2 hourly avg 11.9 12.3 12.6 13.0 13.4 13.8 14.2 14.6 15.1 15.5 16.0 16.5 17.0 17.5 TP Tauranga 4.50% Max 1/2 hourly avg 20.6 21.6 22.5 23,5 24.6 25.7 26.8 28.0 29.3 30.6 32.0 33.4 34.9 36.5 11 kV 98th %ile 1/2 hourly avg 20.6 21.6 22.5 23,5 24.6 25.7 26.8 28.0 29.3 30.6 32.0 33.4 34.9 36.5 TP Mt Maunganui 4.50% Max 1/2 hourly avg 17.7 18.5 19.3 20.2 21.1 22.1 23.1 24.1 25.2 26.3 27.5 28.7 30.0 31.4 11 kV 98th %ile 1/2 hourly avg 15.5 16.2 16.9 17.7 18.5 19.3 20.2 21.1 22.0 23.0 24.0 25.1 26.3 27.4

Section 6
Subject Network Development and Lifecycle Asset Management Plan
Date Issued 30 June 2005
Page 75
Powerco Limited Asset Management Plan – Electricity Networks 2006 - 2020
Table 6.8: Forecast Maximum Demands for Valley Zone Substations
Substation Forecast Growth Peak Type 2005 2006 2007 2008 2009 2010 2011 2012 2013 2014 2015 2016 2017 2018
Baird Rd 1.00% Max 1/2 hourly avg 8.9 9.0 9.1 9.2 9.3 9.4 9.5 9.6 9.6 9.7 9.8 9.9 10.0 10.1 98th %ile 1/2 hourly avg 5.6 5.6 5.7 5.7 5.8 5.9 5.9 6.0 6.0 6.1 6.2 6.2 6.3 6.3 Browne St 1.00% Max 1/2 hourly avg 6.3 6.4 6.5 6.5 6.6 6.7 6.7 6.8 6.9 6.9 7.0 7.1 7.1 7.2 98th %ile 1/2 hourly avg 5.2 5.3 5.3 5.4 5.4 5.5 5.5 5.6 5.7 5.7 5.8 5.8 5.9 5.9 Coromandel 2.00% Max 1/2 hourly avg 4.7 4.8 4.9 5.0 5.1 5.2 5.3 5.4 5.5 5.6 5.7 5.8 5.9 6.0 98th %ile 1/2 hourly avg 3.0 3.0 3.1 3.1 3.2 3.3 3.3 3.4 3.5 3.5 3.6 3.7 3.7 3.8 Farmers Rd 1.00% Max 1/2 hourly avg 7.9 7.9 8.0 8.1 8.2 8.3 8.3 8.4 8.5 8.6 8.7 8.8 8.9 8.9 98th %ile 1/2 hourly avg 5.8 5.8 5.9 5.9 6.0 6.1 6.1 6.2 6.2 6.3 6.4 6.4 6.5 6.6
1.00% Max 1/2 hourly avg 8.4 8.5 8.5 8.6 8.7 8.8 8.9 9.0 9.1 9.2 9.2 9.3 9.4 9.5 Kerepehi 98th %ile 1/2 hourly avg 7.1 7.1 7.2 7.3 7.3 7.4 7.5 7.6 7.6 7.7 7.8 7.9 8.0 8.0 Lake Rd 1.00% Max 1/2 hourly avg 5.7 5.8 5.8 5.9 5.9 6.0 6.1 6.1 6.2 6.2 6.3 6.4 6.4 6.5 98th %ile 1/2 hourly avg 4.4 4.5 4.5 4.5 4.6 4.6 4.7 4.7 4.8 4.8 4.9 4.9 5.0 5.0 Lakeside + Midway 0.00% Max 1/2 hourly avg 5.2 5.2 5.2 5.2 5.2 5.2 5.2 5.2 5.2 5.2 5.2 5.2 5.2 5.2 98th %ile 1/2 hourly avg 2.7 2.7 2.7 2.7 2.7 2.7 2.7 2.7 2.7 2.7 2.7 2.7 2.7 2.7 Maraetai Rd 1.00% Max 1/2 hourly avg 10.0 10.0 10.1 10.3 10.4 10.5 10.6 10.7 10.8 10.9 11.0 11.1 11.2 11.3 98th %ile 1/2 hourly avg 8.4 8.5 8.6 8.6 8.7 8.8 8.9 9.0 9.1 9.2 9.3 9.4 9.5 9.5 Matatoki 1.00% Max 1/2 hourly avg 5.5 5.6 5.6 5.7 5.7 5.8 5.8 5.9 6.0 6.0 6.1 6.1 6.2 6.3 98th %ile 1/2 hourly avg 4.4 4.4 4.5 4.5 4.6 4.6 4.7 4.7 4.8 4.8 4.9 4.9 5.0 5.0 Mikkelsen Rd 1.00% Max 1/2 hourly avg 12.8 12.9 13.0 13.1 13.3 13.4 13.5 13.7 13.8 14.0 14.1 14.2 14.4 14.5 98th %ile 1/2 hourly avg 11.4 11.5 11.6 11.7 11.8 11.9 12.1 12.2 12.3 12.4 12.5 12.7 12.8 12.9 Morrinsville 1.00% Max 1/2 hourly avg 8.9 9.0 9.1 9.2 9.3 9.4 9.5 9.6 9.7 9.8 9.9 10.0 10.1 10.2 98th %ile 1/2 hourly avg 7.2 7.3 7.4 7.4 7.5 7.6 7.7 7.7 7.8 7.9 8.0 8.1 8.1 8.2 Paeroa 1.00% Max 1/2 hourly avg 7.6 7.6 7.7 7.8 7.9 7.9 8.0 8.1 8.2 8.3 8.4 8.4 8.5 8.6 98th %ile 1/2 hourly avg 6.1 6.2 6.2 6.3 6.4 6.4 6.5 6.6 6.6 6.7 6.7 6.8 6.9 7.0 Piako 1.00% Max 1/2 hourly avg 10.9 11.0 11.1 11.2 11.3 11.5 11.6 11.7 11.8 11.9 12.0 12.2 12.3 12.4 98th %ile 1/2 hourly avg 9.8 9.9 10.0 10.1 10.2 10.3 10.4 10.5 10.6 10.7 10.8 10.9 11.0 11.1 Putaruru 1.00% Max 1/2 hourly avg 10.5 10.6 10.8 10.9 11.0 11.1 11.2 11.3 11.4 11.5 11.6 11.8 11.9 12.0 98th %ile 1/2 hourly avg 9.6 9.7 9.8 9.8 9.9 10.0 10.1 10.2 10.4 10.5 10.6 10.7 10.8 10.9 Tahuna 1.00% Max 1/2 hourly avg 5.5 5.5 5.6 5.6 5.7 5.7 5.8 5.8 5.9 6.0 6.0 6.1 6.1 6.2 98th %ile 1/2 hourly avg 4.4 4.5 4.5 4.5 4.6 4.6 4.7 4.7 4.8 4.8 4.9 4.9 5.0 5.0 Tairua 4.50% Max 1/2 hourly avg 7.3 7.7 8.0 8.4 8.8 9.1 9.6 10.0 10.4 10.9 11.4 11.9 12.4 13.0 98th %ile 1/2 hourly avg 5.2 5.4 5.7 5.9 6.2 6.5 6.8 7.1 7.4 7.7 8.1 8.4 8.8 9.2 Thames T2&T3 1.00% Max 1/2 hourly avg 11.0 11.1 11.2 11.3 11.4 11.5 11.6 11.7 11.9 12.0 12.1 12.2 12.3 12.5 98th %ile 1/2 hourly avg 9.6 9.7 9.8 9.9 10.0 10.1 10.2 10.3 10.4 10.5 10.6 10.8 10.9 11.0 Thames T1 1.00% Max 1/2 hourly avg 3.1 3.1 3.1 3.2 3.2 3.2 3.2 3.3 3.3 3.3 3.4 3.4 3.4 3.5 98th %ile 1/2 hourly avg 2.5 2.5 2.6 2.6 2.6 2.6 2.7 2.7 2.7 2.7 2.8 2.8 2.8 2.8 Tirau 1.00% Max 1/2 hourly avg 8.4 8.5 8.6 8.7 8.8 8.9 9.0 9.0 9.1 9.2 9.3 9.4 9.5 9.6 98th %ile 1/2 hourly avg 7.7 7.8 7.9 8.0 8.1 8.1 8.2 8.3 8.4 8.5 8.5 8.6 8.7 8.8 Tower Rd 1.00% Max 1/2 hourly avg 8.5 8.6 8.7 8.8 8.9 9.0 9.0 9.1 9.2 9.3 9.4 9.5 9.6 9.7 98th %ile 1/2 hourly avg 6.9 7.0 7.1 7.1 7.2 7.3 7.3 7.4 7.5 7.6 7.6 7.7 7.8 7.9 Waihi 1.00% Max 1/2 hourly avg 14.3 14.5 14.6 14.7 14.9 15.0 15.2 15.3 15.5 15.7 15.8 16.0 16.1 16.3

Section 6
Subject Network Development and Lifecycle Asset Management Plan
Date Issued 30 June 2005
Page 76
Powerco Limited Asset Management Plan – Electricity Networks 2006 - 2020
Substation Forecast Growth Peak Type 2005 2006 2007 2008 2009 2010 2011 2012 2013 2014 2015 2016 2017 2018
98th %ile 1/2 hourly avg 12.7 12.8 12.9 13.0 13.2 13.3 13.4 13.6 13.7 13.8 14.0 14.1 14.3 14.4 Waihi Beach 2.50% Max 1/2 hourly avg 4.2 4.3 4.5 4.6 4.7 4.8 4.9 5.0 5.2 5.3 5.4 5.6 5.7 5.8 98th %ile 1/2 hourly avg 3.3 3.4 3.4 3.5 3.6 3.7 3.8 3.9 4.0 4.1 4.2 4.3 4.4 4.5 Waitoa 1.00% Max 1/2 hourly avg 13.2 13.3 13.5 13.6 13.7 13.9 14.0 14.2 14.3 14.4 14.6 14.7 14.9 15.0 98th %ile 1/2 hourly avg 11.8 11.9 12.0 12.2 12.3 12.4 12.5 12.7 12.8 12.9 13.0 13.2 13.3 13.4 Walton 1.00% Max 1/2 hourly avg 7.1 7.1 7.2 7.3 7.3 7.4 7.5 7.6 7.6 7.7 7.8 7.9 8.0 8.0 98th %ile 1/2 hourly avg 5.4 5.5 5.5 5.6 5.7 5.7 5.8 5.8 5.9 5.9 6.0 6.1 6.1 6.2
2.00% Max 1/2 hourly avg 10.1 10.3 10.5 10.7 10.9 11.1 11.3 11.6 11.8 12.0 12.3 12.5 12.8 13.0 Whangamata 98th %ile 1/2 hourly avg 7.0 7.1 7.2 7.4 7.5 7.7 7.8 8.0 8.2 8.3 8.5 8.7 8.8 9.0
Whitianga 4.50% Max 1/2 hourly avg 13.1 13.7 14.3 14.9 15.6 16.3 17.0 17.8 18.6 19.4 20.3 21.2 22.2 23.2
98th %ile 1/2 hourly avg 9.3 9.8 10.2 10.7 11.1 11.6 12.2 12.7 13.3 13.9 14.5 15.2 15.8 16.6
Table 6.9: Forecast Maximum Demands for Wairarapa Substations
Substation Forecast Growth Peak Type 2005 2006 2007 2008 2009 2010 2011 2012 2013 2014 2015 2016 2017 2018
Akura 1% Max 1/2 hourly avg 10.3 10.4 10.5 10.6 10.7 10.8 10.9 11.0 11.2 11.3 11.4 11.5 11.6 11.7 98th %ile 1/2 hourly avg 10.3 10.4 10.5 10.6 10.7 10.8 10.9 11.0 11.2 11.3 11.4 11.5 11.6 11.7 Awatoitoi 1% Max 1/2 hourly avg 1.2 1.2 1.2 1.2 1.2 1.3 1.3 1.3 1.3 1.3 1.3 1.3 1.4 1.4 98th %ile 1/2 hourly avg 1.2 1.2 1.2 1.2 1.2 1.3 1.3 1.3 1.3 1.3 1.3 1.3 1.4 1.4 Chapel 1% Max 1/2 hourly avg 12.3 12.4 12.5 12.7 12.8 12.9 13.1 13.2 13.3 13.5 13.6 13.7 13.9 14.0 98th %ile 1/2 hourly avg 12.3 12.4 12.5 12.7 12.8 12.9 13.1 13.2 13.3 13.5 13.6 13.7 13.9 14.0 Clareville 1% Max 1/2 hourly avg 5.6 5.7 5.7 5.8 5.8 5.9 5.9 6.0 6.1 6.1 6.2 6.2 6.3 6.4 98th %ile 1/2 hourly avg 5.6 5.7 5.7 5.8 5.8 5.9 5.9 6.0 6.1 6.1 6.2 6.2 6.3 6.4
1% Max 1/2 hourly avg 3.6 3.6 3.7 3.7 3.7 3.8 3.8 3.9 3.9 3.9 4.0 4.0 4.1 4.1 Featherston 98th %ile 1/2 hourly avg 2.8 2.8 2.8 2.9 2.9 2.9 3.0 3.0 3.0 3.0 3.1 3.1 3.1 3.2 Gladstone 1% Max 1/2 hourly avg 0.7 0.7 0.7 0.7 0.7 0.7 0.7 0.8 0.8 0.8 0.8 0.8 0.8 0.8 98th %ile 1/2 hourly avg 0.7 0.7 0.7 0.7 0.7 0.7 0.7 0.8 0.8 0.8 0.8 0.8 0.8 0.8 Hau Nui 0% Max 1/2 hourly avg 4.8 4.8 4.8 4.8 4.8 4.8 4.8 4.8 4.8 4.8 4.8 4.8 4.8 4.8 98th %ile 1/2 hourly avg 3.7 3.7 3.7 3.7 3.7 3.7 3.7 3.7 3.7 3.7 3.7 3.7 3.7 3.7 Kempton 1% Max 1/2 hourly avg 3.9 3.9 4.0 4.0 4.1 4.1 4.1 4.2 4.2 4.3 4.3 4.4 4.4 4.4 98th %ile 1/2 hourly avg 3.9 3.9 4.0 4.0 4.1 4.1 4.1 4.2 4.2 4.3 4.3 4.4 4.4 4.4 Martinborough 1% Max 1/2 hourly avg 3.4 3.4 3.5 3.5 3.5 3.6 3.6 3.6 3.7 3.7 3.7 3.8 3.8 3.9 98th %ile 1/2 hourly avg 2.5 2.5 2.5 2.5 2.6 2.6 2.6 2.6 2.7 2.7 2.7 2.7 2.8 2.8 Norfolk 1% Max 1/2 hourly avg 5.7 5.8 5.8 5.9 5.9 6.0 6.1 6.1 6.2 6.2 6.3 6.4 6.4 6.5 98th %ile 1/2 hourly avg 5.7 5.8 5.8 5.9 5.9 6.0 6.1 6.1 6.2 6.2 6.3 6.4 6.4 6.5 Te Ore Ore 1% Max 1/2 hourly avg 5.4 5.5 5.5 5.6 5.6 5.7 5.7 5.8 5.9 5.9 6.0 6.0 6.1 6.2 98th %ile 1/2 hourly avg 4.7 4.8 4.8 4.8 4.9 4.9 5.0 5.0 5.1 5.1 5.2 5.3 5.3 5.4 Tinui 1% Max 1/2 hourly avg 0.8 0.8 0.8 0.8 0.8 0.8 0.8 0.9 0.9 0.9 0.9 0.9 0.9 0.9 98th %ile 1/2 hourly avg 0.8 0.8 0.8 0.8 0.8 0.8 0.8 0.9 0.9 0.9 0.9 0.9 0.9 0.9 Tuhitarata 1% Max 1/2 hourly avg 1.8 1.8 1.8 1.9 1.9 1.9 1.9 1.9 1.9 2.0 2.0 2.0 2.0 2.0 98th %ile 1/2 hourly avg 1.8 1.8 1.8 1.9 1.9 1.9 1.9 1.9 1.9 2.0 2.0 2.0 2.0 2.0

Section 6
Subject Network Development and Lifecycle Asset Management Plan
Date Issued 30 June 2005
Page 77
Powerco Limited Asset Management Plan – Electricity Networks 2006 - 2020
Table 6.10: Forecast Maximum Demands for Wanganui Substations
.Substation Forecast Growth Peak Type 2005 2006 2007 2008 2009 2010 2011 2012 2013 2014 2015 2016 2017 2018
Arahina 1.00% Max 1/2 hourly avg 7.7 7.7 7.8 7.9 8.0 8.0 8.1 8.2 8.3 8.4 8.5 8.5 8.6 8.7 98th %ile 1/2 hourly avg 6.3 6.4 6.5 6.5 6.6 6.6 6.7 6.8 6.8 6.9 7.0 7.1 7.1 7.2 Beach Rd 3.00% Max 1/2 hourly avg 8.4 8.7 8.9 9.2 9.5 9.8 10.1 10.4 10.7 11.0 11.3 11.7 12.0 12.4 98th %ile 1/2 hourly avg 6.9 7.1 7.3 7.5 7.7 8.0 8.2 8.4 8.7 8.9 9.2 9.5 9.8 10.1 Blink Bonnie 1.00% Max 1/2 hourly avg 3.3 3.3 3.4 3.4 3.4 3.5 3.5 3.5 3.6 3.6 3.6 3.7 3.7 3.8 98th %ile 1/2 hourly avg 2.8 2.8 2.8 2.8 2.9 2.9 2.9 3.0 3.0 3.0 3.1 3.1 3.1 3.1 Bulls 1.00% Max 1/2 hourly avg 3.4 3.4 3.5 3.5 3.5 3.6 3.6 3.6 3.7 3.7 3.7 3.8 3.8 3.9 98th %ile 1/2 hourly avg 2.9 2.9 3.0 3.0 3.0 3.1 3.1 3.1 3.2 3.2 3.2 3.3 3.3 3.3
2.00% Max 1/2 hourly avg 8.4 8.6 8.7 8.9 9.1 9.3 9.4 9.6 9.8 10.0 10.2 10.4 10.6 10.8 Castlecliff 98th %ile 1/2 hourly avg 7.3 7.4 7.6 7.7 7.9 8.0 8.2 8.4 8.5 8.7 8.9 9.0 9.2 9.4 Hatricks Wharf 1.50% Max 1/2 hourly avg 8.3 8.4 8.6 8.7 8.8 8.9 9.1 9.2 9.3 9.5 9.6 9.8 9.9 10.1 98th %ile 1/2 hourly avg 7.8 7.9 8.0 8.2 8.3 8.4 8.5 8.7 8.8 8.9 9.1 9.2 9.3 9.5 Kai Iwi 1.00% Max 1/2 hourly avg 1.7 1.7 1.7 1.7 1.7 1.8 1.8 1.8 1.8 1.8 1.9 1.9 1.9 1.9 98th %ile 1/2 hourly avg 1.4 1.4 1.4 1.5 1.5 1.5 1.5 1.5 1.5 1.5 1.6 1.6 1.6 1.6 Peat St 2.00% Max 1/2 hourly avg 13.2 13.4 13.7 14.0 14.3 14.5 14.8 15.1 15.4 15.7 16.0 16.4 16.7 17.0 98th %ile 1/2 hourly avg 10.8 11.0 11.2 11.5 11.7 11.9 12.2 12.4 12.7 12.9 13.2 13.4 13.7 14.0 Pukepapa 1.00% Max 1/2 hourly avg 3.3 3.4 3.4 3.4 3.5 3.5 3.5 3.6 3.6 3.6 3.7 3.7 3.8 3.8 98th %ile 1/2 hourly avg 2.2 2.2 2.2 2.2 2.2 2.3 2.3 2.3 2.3 2.4 2.4 2.4 2.4 2.5 Rata 1.00% Max 1/2 hourly avg 2.6 2.6 2.7 2.7 2.7 2.7 2.8 2.8 2.8 2.8 2.9 2.9 2.9 3.0 98th %ile 1/2 hourly avg 2.6 2.6 2.7 2.7 2.7 2.7 2.8 2.8 2.8 2.8 2.9 2.9 2.9 3.0 Roberts Ave 1.00% Max 1/2 hourly avg 3.7 3.7 3.8 3.8 3.9 3.9 3.9 4.0 4.0 4.0 4.1 4.1 4.2 4.2 98th %ile 1/2 hourly avg 3.7 3.7 3.8 3.8 3.9 3.9 3.9 4.0 4.0 4.0 4.1 4.1 4.2 4.2 Taihape 1.00% Max 1/2 hourly avg 6.0 6.1 6.1 6.2 6.2 6.3 6.4 6.4 6.5 6.6 6.6 6.7 6.8 6.8 98th %ile 1/2 hourly avg 6.0 6.1 6.1 6.2 6.2 6.3 6.4 6.4 6.5 6.6 6.6 6.7 6.8 6.8 Taupo Quay 1.50% Max 1/2 hourly avg 12.5 12.6 12.8 13.0 13.2 13.4 13.6 13.8 14.0 14.2 14.5 14.7 14.9 15.1 98th %ile 1/2 hourly avg 7.0 7.1 7.2 7.3 7.4 7.5 7.6 7.8 7.9 8.0 8.1 8.2 8.4 8.5 Waiouru 1.00% Max 1/2 hourly avg 3.0 3.1 3.1 3.1 3.2 3.2 3.2 3.2 3.3 3.3 3.3 3.4 3.4 3.4 98th %ile 1/2 hourly avg 2.7 2.8 2.8 2.8 2.9 2.9 2.9 2.9 3.0 3.0 3.0 3.1 3.1 3.1 Wanganui East 1.00% Max 1/2 hourly avg 5.3 5.4 5.4 5.5 5.5 5.6 5.6 5.7 5.7 5.8 5.9 5.9 6.0 6.0 98th %ile 1/2 hourly avg 5.3 5.4 5.4 5.5 5.5 5.6 5.6 5.7 5.7 5.8 5.9 5.9 6.0 6.0 TP Ohakune 1.00% Max 1/2 hourly avg 1.9 1.9 1.9 2.0 2.0 2.0 2.0 2.0 2.1 2.1 2.1 2.1 2.1 2.2 98th %ile 1/2 hourly avg 1.9 1.9 1.9 2.0 2.0 2.0 2.0 2.0 2.1 2.1 2.1 2.1 2.1 2.2 TP Waverley 1.00% Max 1/2 hourly avg 3.5 3.5 3.6 3.6 3.6 3.7 3.7 3.8 3.8 3.8 3.9 3.9 3.9 4.0 98th %ile 1/2 hourly avg 3.5 3.5 3.6 3.6 3.6 3.7 3.7 3.8 3.8 3.8 3.9 3.9 3.9 4.0

Section 6
Subject Network Development and Lifecycle Asset Management Plan
Date Issued 30 June 2005
Page 78
Powerco Limited Asset Management Plan – Electricity Networks 2006 - 2020
6.6 Non-Asset Solutions and Distributed Generation Powerco has an active policy of investigating and where appropriate recommending or
adopting non-asset solutions. Presently the following solutions have been implemented:
• Load transfer through the distribution network is considered prior to any substation
capacity upgrade;
• Demand side management is encouraged through demand based network charges in
some cases; and,
• Load control is used to reduce demand peaks.
Distributed generation and co-generation are encouraged, but the uncertain availability of
such generation, particularly wind generation, can make it unsuitable for maintaining network
security and acceptable voltage to consumers. In some areas, particularly in the Valley area,
customers are supplied via long single circuit subtransmission feeders and Powerco’s security
criteria cannot be met at an economic cost. In these areas additional maintenance is carried
out to minimise the probability of outages.
Power factor correction is applied in the distribution network, particularly in the Valley area,
with shunt capacitors (generally 750kVA banks) applied at key locations on distribution
feeders.
The network has been assessed to determine if alternative providers would better serve any
existing assets. Some opportunities have been identified and the situation will continue to be
actively monitored. In the past Powerco has provided solar powered installations in place of
network extensions for some remote small loads such as electric fence units. All opportunities
will continue to be monitored and the current policy of encouraging non-asset-based solutions
will continue.
6.6.1 Pre-commercial Trial of Fuel Cells
Powerco is partnering with Ceramic Fuel Cells Limited (CFCL) on the pre-commercial trial of
two fuel cells for domestic application. CFCL is based in Victoria and has been working on the
technology for the last 14 years or so.
The fuel cell uses solid oxide (ceramic) technology. The trial will be a world first for this
application. Ceramic wafers are heated to in excess of 800oC, with reduced natural gas
passed over one side and air passed over the other. A chemical reaction causes electricity to
flow through the wafers, and this is then captured and passed through an inverter to provide
AC mains supply.
The fuel cells will be trialled on the Wellington gas network and in the Taranaki area. The
units produce 1kW of electrical supply and 1kW heat supply in the form of hot water, for

Section 6
Subject Network Development and Lifecycle Asset Management Plan
Date Issued 30 June 2005
Page 79
Powerco Limited Asset Management Plan – Electricity Networks 2006 - 2020
approximately 2.5kW energy input. The combination of heat and power makes the fuel cell
ideal for domestic application. CFCL proposes that once the 1kW units are fully trialled,
attention will turn to producing a 5kW unit, which will be more ideally suited to larger domestic
consumers.
This form of distributed generation has the potential to revolutionise the electricity and gas
reticulation industries.
6.7 Adoption of New Technology Powerco has an active programme in keeping up with the latest technical innovations and
where appropriate introducing these onto its network. Recent new technology adopted by
Powerco includes the use of the following:
• Corona detecting camera;
• Ethernet based high speed radio;
• Numerical protection relays;
• Transformer monitoring and control units;
• CDMA secure data communications;
• Computerised fault management and dispatch;
• Remotely operated distribution switchgear;
• Spread-spectrum radio, microwave and optical fibre communication for SCADA;
• Handheld electronic data capture devices for inspection and maintenance work;
• A circuit breaker profile logger for circuit breaker condition monitoring; and,
• Infra-red, ultrasonic and partial discharge condition monitoring techniques.
6.8 Acquisition of New Assets Where appropriate and economically viable, Powerco will continue to acquire new assets.
This may be by acquiring additional networks, sections of network owned by consumers or
new subdivisions. Those carrying out subdivision development have shown little inclination to
retain ownership and it is anticipated that this trend will continue for the duration of this plan.
6.9 Redeployment, Upgrade and Disposal of Existing Assets Powerco does not anticipate disposing of any major network assets for the duration of the plan
other than obsolete, superseded equipment, or equipment at the end of its economic life.
Equipment that is redundant at a particular location will be maintained or refurbished and
returned to service in an alternative location more appropriate to its capabilities, provided that
it has sufficient life remaining for refurbishment to be economic. Any serviceable equipment
that does not have a potential use within a reasonable period will be disposed of.

Section 6
Subject Network Development and Lifecycle Asset Management Plan
Date Issued 30 June 2005
Page 80
Powerco Limited Asset Management Plan – Electricity Networks 2006 - 2020
6.10 Long Term Development Plan (Subtransmission Development Plan)
6.10.1 Introduction
A Long Term Development Plan separate from this Asset Management Plan has been
prepared for Powerco’s networks. Its main points are summarised below.
Development of the subtransmission network over the planning period is determined from the
general Asset Management Plan drivers, criteria for long-term planning and forecast load
growth. Where drivers or planning criteria in any area are not satisfied, development work is
analysed and programmed where required.
The following areas are considered:
• The development of the subtransmission network with particular reference to the location,
capacity and security requirements foreseen in the horizon year;
• Voltage selection;
• Capacity and security of grid exit points;
• Other matters including neutral point earthing, losses, reactive power and protection; and,
• Zone substation interconnections at distribution level.
6.10.2 Planning Period
A fifteen year planning period has been adopted from 1 April 2005 for subtransmission long
term planning. This period is of sufficient length for the subtransmission system to be planned
optimally.
6.10.3 Grid Exit Points
A new GXP is planned for Putaruru, which will provide an alternative supply for Putaruru, Tirau
and Lake Rd substations, enabling their security ratings to be increased.
The 11kV switchgear at Carrington GXP 11kV bus is over 45 years old, and the 110/11kV
transformers are 58 years old. These are programmed for replacement with 33 / 11 kV units
in 2006. Larger 110 / 33 kV transformers are also planned.
A second transformer bank has been installed and recently commissioned at Hinuera GXP.
Supply taken from Waihou, Tauranga and Mt Maunganui GXPs presently exceeds their firm
capacity. Investigations are still progressing to develop the most economic solution, which
could involve additional capacity, new GXPs or transferring load to adjacent GXPs. Each of
these options is presently under consideration.

Section 6
Subject Network Development and Lifecycle Asset Management Plan
Date Issued 30 June 2005
Page 81
Powerco Limited Asset Management Plan – Electricity Networks 2006 - 2020
The demand at the 11kV bus at Mt Maunganui GXP presently exceeds its firm capacity, and
due to the rate of development, the ability to transfer load to Papamoa and Triton substations
is diminishing.
The capacity of Transpower’s 110kV circuits into the Tauranga area can be less than the
area’s peak demand if one circuit has been removed from service. The situation is under
ongoing discussion with Transpower.
Transpower has prepared an operating protocol to open the 110kV bus at Mangamarie GXP
under high north to south power flows. The opening of the bus reduces security of supply to
Powerco from N -1 to N.
Transpower has implemented a changeover scheme at Hawera GXP to reduce loading
constraints under certain grid operational situations. At times when the changeover system is
in its open state however, only one transformer supplies Powerco’s network and security of
supply is thus reduced. This issue is being discussed with Transpower.
There is a single three-phase transformer at Brunswick GXP. Options are being considered to
improve the security of supply to the city of Wanganui. These could involve subtransmission
reinforcements.
A comprehensive load management strategy is being developed to determine future load
control requirements. The extent of load control will affect the GXP demands. As a result
some reinforcement projects may be able to be deferred.
The installation of a second transformer at Te Matai GXP is being discussed with Transpower.
If the large scale developments planned for Papamoa East and Rangiuru proceed as planned,
significant reinforcement of Te Matai, or a new GXP in the area will be required.
No other development or upgrading of GXPs is presently programmed or planned by
Transpower in the planning period. Analysis indicates that the capacity at the GXPs will meet
Powerco’s load requirements.
6.10.4 Assessment of Suitability of Network For Present Needs
6.10.4.1 General Comments
The present network configuration allows some operational flexibility, but the level of security
provided in some areas does not comply with Powerco’s security of supply criteria.
The mixed radial/ring configuration used in some areas increases the security of supply, but
also increases fault levels and protection network complexity when operated as a ring.

Section 6
Subject Network Development and Lifecycle Asset Management Plan
Date Issued 30 June 2005
Page 82
Powerco Limited Asset Management Plan – Electricity Networks 2006 - 2020
6.10.4.2 Transformer Ratings
During 2003, Powerco conducted a major review of the ratings of its zone substation
transformers, using the methodology of IEC354, considering the ambient temperature that
applies to the transformer nameplate rating and the design hot spot temperature for forced air
or oil ratings. A set of rating tables has been produced covering all zone substations at
ambient temperatures from 0OC to 30OC. The 20OC ratings are used in Table 6.11 to Table
6.22.
6.10.4.3 Zone Substation Transformer Utilisation
The following tables, Table 6.11 to Table 6.16 show transformer utilisation for 2005 and
forecast utilisation for 2010 and 2015 on the basis of the presently installed transformers.
Load data is taken from load forecast tables. This data should be read in conjunction with the
transformer additions and changes proposed in the subtransmission development and
renewal tables presented in Section 6.11.7.
Table 6.11: Manawatu Zone Substation Transformer Utilisation Data
Substation No of Xfmrs
Xfmr Nameplate
Rating (MVA)
ONAN Capacity
% Growth
2005 98th percentile
Load
2010 98th percentile
Load
2015 98th percentile
Load
%Utilisation 2005
%Utilisation 2010
%Utilisation 2015
Alfredton 1 1.5 1.4 1% 0.6 0.6 0.7 43% 45% 47% Feilding 2 16 / 24 32 2% 16.3 17.5 18.9 51% 55% 59% Kairanga 2 12.5 / 17 25 2% 13.4 14.8 16.4 54% 59% 65% Keith St 2 11.5 / 23 20.8 1% 9.2 9.7 10.1 44% 46% 49% Kelvin Grove 2 12.5 / 17 25 1% 9.7 10.2 10.7 39% 41% 43% Kimbolton 1 3.0 3 1% 2.2 2.3 2.4 72% 76% 80% Main St 2 20.0 40 2% 23.8 26.3 29.1 60% 66% 73% Mangamutu 2 5 / 6.25 10 2% 8.2 8.8 9.5 82% 88% 95% Milson 2 12.5 / 17 25 2% 11.5 12.4 13.3 46% 50% 53% Parkville 1 3.0 2.9 1% 1.6 1.7 1.8 56% 59% 62% Pascal St 2 20.0 38.4 1% 19.8 20.8 21.9 52% 54% 57% Pongaroa 1 3.0 2.9 1% 0.6 0.7 0.7 22% 23% 24% Sanson 2 7.5 15 1% 6.7 7.1 7.4 45% 47% 50% Turitea 2 12.5 / 17 25 2% 11.2 12.1 13.0 45% 48% 52% 24 266.4 134.9 145.0 155.9 51% 54% 59% Note: The ambient temperature and hot spot temperature for which transformers are rated varies. See Powerco’s Zone Substation Transformer Rating standard. ONAN capacities reported are the ratings assigned by this standard.
Table 6.12: Taranaki Zone Substation Transformer Utilisation Data
Substation No of Xfmrs
Xfmr Nameplate
Rating (MVA)
ONAN Capacity
% Growth
2005 98th percentile
Load
2010 98th percentile
Load
2015 98th percentile
Load
%Utilisation 2005
%Utilisation 2010
%Utilisation 2015
Bell Block 2 16 / 24 32 2% 16.0 17.6 19.5 50% 55% 61% Cambria 2 10.0 19.2 3% 10.2 11.8 13.7 53% 61% 71% Cardiff 1 3.0 2.9 1% 0.7 0.7 0.8 24% 26% 27% City 2 11.5 / 23 21.2 2% 15.4 17.0 18.7 73% 80% 88% Cloton Rd 2 10.0 / 13.0 20 2% 6.8 7.3 7.9 34% 37% 40% Douglas 1 5.0 5 1% 1.6 1.7 1.8 32% 34% 35% Eltham 2 7.5 / 10 15 2% 8.1 8.9 9.8 54% 59% 65% Inglewood 2 5.0 10 1% 4.1 4.3 4.5 41% 43% 45% Kaponga 2 2.5 4.8 1% 2.6 2.7 2.8 53% 56% 59% Kapuni 2 5.0 10 2% 6.2 6.8 7.5 62% 68% 75%

Section 6
Subject Network Development and Lifecycle Asset Management Plan
Date Issued 30 June 2005
Page 83
Powerco Limited Asset Management Plan – Electricity Networks 2006 - 2020
Substation No of Xfmrs
Xfmr Nameplate
Rating (MVA)
ONAN Capacity
% Growth
2005 98th percentile
Load
2010 98th percentile
Load
2015 98th percentile
Load
%Utilisation 2005
%Utilisation 2010
%Utilisation 2015
Livingstone 2 2.5 4.8 1% 2.5 2.6 2.7 52% 54% 57% Manaia 1 7.5 7.2 1% 5.5 5.8 6.1 76% 81% 85% McKee 2 1.3 2.4 0% 1.0 1.0 1.0 42% 42% 42% Motukawa 1 2.5 2.4 1% 2.5 2.6 2.8 104% 108% 117% Ngariki 1 5 / 6.25 5 1% 1.7 1.7 1.8 33% 35% 37% Pohokura 2 10 / 12.5 18 0% 3.0 3.0 3.0 17% 17% 17% Pungarehu 2 3.0 / 4.0 6 1% 2.8 3.0 3.1 47% 49% 52% Tasman 2 5.0 10 1% 6.4 6.7 7.1 64% 67% 71% Waihapa 2 1x1.25, 1 x
2.5 3.75 0% 1.2 1.2 1.2 32% 32% 32%
Waitara East 2 5.0 / 9.0 9.6 1% 3.1 3.3 3.4 32% 34% 36% Waitara West 2 5.0 10 1% 3.4 3.5 3.7 34% 35% 37% Whareroa 1 10.0 9.6 1% 3.4 3.5 3.7 35% 37% 39% 38 228.85 108.2 116.7 126.6 47% 51% 55% Notes: 1. The ambient temperature and hot spot temperature for which transformers are rated varies See Powerco’s Zone Substation
Transformer Rating standard. ONAN capacities reported are the ratings assigned by this standard.
Table 6.13: Tauranga Zone Substation Transformer Utilisation Data
Substation No of Xfmrs
Xfmr Nameplate
Rating (MVA)
ONAN Capacity
% Growth
2005 98th percentile
Load
2010 98th percentile
Load
2015 98th percentile
Load
%Utilisation 2005
%Utilisation 2010
%Utilisation 2015
Aongatete 2 5 10.0 3% 8.2 9.5 11.0 82% 95% 110% Kauri Point 1 5 5.0 3% 1.8 2.0 2.3 36% 41% 46% Matua 2 5 10.0 1% 6.5 6.8 7.2 65% 68% 72% Omokoroa 1 10 / 12.5 9.6 4% 5.9 7.1 8.7 61% 74% 90% Otumoetai 2 1x10/12.5,
1x12.5/15 22.1 2% 13.2 14.6 16.1 60% 66% 73%
Papamoa 2 1x11.5 / 23, 1x11.5*
23.0 6% 13.9 18.1 23.7 60% 79% 103%
Pongakawa 2 5 10.0 3% 4.6 5.2 5.8 46% 52% 58% Tauranga City 3 7.5 21.9 4% 14.2 17.2 21.0 65% 79% 96% Te Puke 2 16 / 24 32.0 3% 16.6 19.2 22.3 52% 60% 70% Triton 2 11.5 / 23 23.0 5% 17.6 21.9 27.3 76% 95% 119% Waihi Rd 2 1x5**,
1x16/24 21.0 3% 7.7 8.9 10.3 36% 42% 49%
Welcome Bay 2 11.5 / 23 23.0 3% 11.9 13.8 16.0 52% 60% 70% 23 210.6 121.9 144.4 171.6 58% 69% 82%
Notes: 1. The ambient temperature and hot spot temperature for which transformers are rated varies. See Powerco’s Zone substation
Transformer Rating standard. ONAN capacities reported are the ratings assigned by this standard.
Table 6.14: Valley Zone Substation Transformer Utilisation Data
Substation No of Xfmrs
Xfmr Nameplate
Rating (MVA)
ONAN Capacity
% Growth
2005 98th percentile
Load
2010 98th percentile
Load
2015 98th percentile
Load
%Utilisation 2005
%Utilisation 2010
%Utilisation 2015
Baird Rd 2 5 9.6 1% 5.6 5.9 6.2 58% 61% 64% Browne St 1 7.5 7.2 1% 5.2 5.5 5.8 73% 76% 80% Coromandel 1 5 5.0 1% 3.0 3.3 3.6 59% 65% 72% Farmers Rd 2 5 9.6 1% 5.8 6.1 6.4 60% 63% 66% Kerepehi 1 7.5 7.5 0% 7.1 7.4 7.8 94% 99% 104% Lake Rd 1 5 5.0 1% 4.4 4.6 4.9 88% 93% 97% Lakeside + Midway
2 3 + 3 5.8 1% 2.7 2.7 2.7 46% 46% 46%
Maraetai Rd 2 7.5 14.4 1% 8.4 8.8 9.3 58% 61% 64% Matatoki 1 7.5 7.5 1% 4.4 4.6 4.9 59% 62% 65% Mikkelsen Rd 2 7.5 14.4 1% 11.4 11.9 12.5 79% 83% 87% Morrinsville 2 5 9.6 1% 7.2 7.6 8.0 75% 79% 83% Paeroa 2 5 9.6 1% 6.1 6.4 6.7 64% 67% 70%

Section 6
Subject Network Development and Lifecycle Asset Management Plan
Date Issued 30 June 2005
Page 84
Powerco Limited Asset Management Plan – Electricity Networks 2006 - 2020
Substation No of Xfmrs
Xfmr Nameplate
Rating (MVA)
ONAN Capacity
% Growth
2005 98th percentile
Load
2010 98th percentile
Load
2015 98th percentile
Load
%Utilisation 2005
%Utilisation 2010
%Utilisation 2015
Piako 2 7.5 15.0 1% 9.8 10.3 10.8 65% 69% 72% Putaruru 2 7.5 14.4 5% 9.6 10.0 10.6 66% 70% 73% Tahuna 1 5 5.0 1% 4.4 4.6 4.9 88% 93% 97% Tairua 1 7.5 7.5 1% 5.2 6.5 8.1 69% 86% 107% Thames T2&T3
2 7.5 15.0 1% 9.6 10.1 10.6 64% 68% 71%
Thames T1 1 5 5.0 1% 2.5 2.6 2.8 50% 53% 55% Tirau 1 7.5 / 10 7.5 1% 7.7 8.1 8.5 103% 108% 114% Tower Rd 1 7.5 7.5 3% 6.9 7.3 7.6 92% 97% 102% Waihi 2 7.5 15.0 1% 12.7 13.3 14.0 84% 89% 93% Waihi Beach 1 5 5.0 1% 3.3 3.7 4.2 65% 74% 84% Waitoa 3 7.5 22.5 2% 11.8 12.4 13.0 52% 55% 58% Walton 1 7.5 7.2 5% 5.4 5.7 6.0 75% 79% 83% Whangamata 1 7.5 / 10 7.5 0% 7.0 7.7 8.5 93% 102% 113% Whitianga 2 1x7.5,
1x12.5/17 20.0 0% 9.3 11.6 14.5 47% 58% 73%
40 259.3 176.4 188.8 202.7 68% 73% 78% Notes: 1. The ambient temperature and hot spot temperature for which transformers are rated varies. See Powerco’s Zone
substation Transformer Rating standard. ONAN capacities reported are the ratings assigned by this standard.
Table 6.15: Wairarapa Zone Substation Transformer Utilisation Data
Substation No of Xfmrs
Xfmr Nameplate
Rating (MVA)
ONAN Capacity
% Growth
2005 98th percentile
Load
2010 98th percentile
Load
2015 98th percentile
Load
%Utilisation 2005
%Utilisation 2010
%Utilisation 2015
Akura 2 7.5 / 10 14.4 1% 10.3 10.8 11.4 72% 75% 79% Awatoitoi 1 3.0 3 1% 1.2 1.3 1.3 40% 42% 44% Chapel 2 11.5 / 23 20.8 1% 12.3 12.9 13.6 59% 62% 65% Clareville 2 7.5 / 10 14.4 1% 5.6 5.9 6.2 39% 41% 43% Featherston 1 5 / 6.25 5 1% 2.8 2.9 3.1 56% 58% 61% Gladstone 1 1.0 1 1% 0.7 0.7 0.8 70% 74% 77% Hau Nui 1 5 / 6.25 5 0% 3.7 3.7 3.7 74% 74% 74% Kempton 1 5 / 6.25 5 1% 3.9 4.1 4.3 78% 82% 86% Martinborough 1 5 / 6.25 5 1% 2.5 2.6 2.7 49% 52% 54% Norfolk 2 5 / 6.25 10 1% 5.7 6.0 6.3 57% 60% 63% Te Ore Ore 1 5 / 6.25 5 1% 4.7 4.9 5.2 94% 99% 104% Tinui 1 1.5 1.5 1% 0.8 0.8 0.9 53% 56% 59% Tuhitarata 1 3.0 2.9 1% 1.8 1.9 2.0 62% 65% 69% 17 93 56.0 58.6 61.4 60% 63% 66% Notes: The ambient temperature and hot spot temperature for which transformers are rated varies. See Powerco’s Zone Substation Transformer Rating standard. ONAN capacities reported are the ratings assigned by this standard.
Table 6.16: Wanganui Zone Substation Utilisation Data
Substation No of Xfmrs
Xfmr Nameplate
Rating (MVA)
ONAN Capacity
% Growth
2005 98th percentile
Load
2010 98th percentile
Load
2015 98th percentile
Load
%Utilisation 2005
%Utilisation 2010
%Utilisation 2015
Arahina 1 10 / 12.5 9.6 1% 6.3 6.6 7.0 66% 69% 73% Beach Rd 1 10.0 9.6 3% 6.9 8.0 9.2 71% 83% 96% Blink Bonnie 1 5.0 4.8 1% 2.8 2.9 3.1 58% 60% 64% Bulls 1 7.5 7.2 1% 2.9 3.1 3.2 40% 43% 45% Castlecliff 2 1x7.5,
1x10 16.8 2% 7.3 8.0 8.9 43% 48% 53%
Hatricks Wharf 1 10* 9.6 2% 7.8 8.4 9.1 81% 88% 94% Kai Iwi 1 5.0 4.8 1% 1.4 1.5 1.6 29% 31% 32% Peat St 1 10/12.5/20 10 2% 10.8 11.9 13.2 108% 119% 132% Pukepapa 1 10 / 12.5 10 1% 2.2 2.3 2.4 22% 23% 24% Rata 1 7.5 7.2 1% 2.6 2.7 2.9 36% 38% 40%

Section 6
Subject Network Development and Lifecycle Asset Management Plan
Date Issued 30 June 2005
Page 85
Powerco Limited Asset Management Plan – Electricity Networks 2006 - 2020
Substation No of Xfmrs
Xfmr Nameplate
Rating (MVA)
ONAN Capacity
% Growth
2005 98th percentile
Load
2010 98th percentile
Load
2015 98th percentile
Load
%Utilisation 2005
%Utilisation 2010
%Utilisation 2015
Roberts Ave 1 7.5 / 10 7.2 1% 3.7 3.9 4.1 51% 54% 57% Taihape 1 10.0 10 1% 6.0 6.3 6.6 60% 63% 66% Taupo Quay 1 10 / 12.5 10 2% 7.0 7.5 8.1 70% 75% 81% Waiouru 1 7.5 7.2 1% 2.7 2.9 3.0 38% 40% 42% Wanganui East
1 7.5 7.2 1% 5.3 5.6 5.9 74% 77% 81%
16 131.2 75.6 81.6 88.1 58% 62% 67% Notes: 1. The ambient temperature and hot spot temperature for which transformers are rated varies. See Powerco’s Zone
Substation Transformer Rating standard. ONAN capacities reported are the ratings assigned by this standard.
6.10.4.4 Zone Substation Capacity and Security Levels
Table 6.17 to Table 6.22 below, summarise zone substation capacities and security of supply
levels. They show the following:
• Taranaki, Manawatu and Wairarapa regions have most of their substations at or near the
security level required by Powerco standards. They have the required backup capacity in
transformers, and their transformer utilisations lie between 47% and 60%;
• Wanganui security levels are lower, with 7 of its 15 substations currently at A2 (without
supply for repair time) security. As transformer capacity for backup has not been provided
in these cases, utilisation is higher at 58%;
• At Tauranga, 3 of 12 substations have A2 security, and utilisation is 58%;
• In the Valley Region, 16 of the 27 substations have A2 security, and transformer utilisation
is 68%; and,
• Many substations have lower than desired security levels. Those that are only marginally
lower will be upgraded along with other substation work, but urgent attention is being
given to those supplying industrial or commercial loads.
Utilisations of zone substation transformers are recorded differently in this AMP than in the
July 2004 AMP, and generally appear lower. This is because the loads are recorded at the
98th percentile (that is, the zone substation load exceeds that stated figures for one week per
year) and do not account for times when load is transferred from other substations. The peak
loads are given in the Load Forecast tables.
It should be noted that the class capacity for AAA and AA+ security level substations is now
taken to be the capacity of the lowest rated incoming supply plus the load able to be
transferred, or the two hour rating of the transformer, whichever is the lesser, provided the
load transfer can be carried out in two hours.

Section 6
Subject Network Development and Lifecycle Asset Management Plan
Date Issued 30 June 2005
Page 86
Powerco Limited Asset Management Plan – Electricity Networks 2006 - 2020
Table 6.17: Manawatu Substation Maximum Demands and Transfer Capacities
Substation No of Xfmrs
No of 33 kV in-feeds
Xfmr Nameplate
Rating (MVA)
Xfmr Cont
Rating (MVA)
Xfmr 2 Hour
Rating (MVA)
Switch-gear firm Capacity
(MVA)
Feeder Transfer Capacity
(MVA)
2005 98th percentile
Load (MVA)
2005 Maximum Demand (MVA)
Substation Firm
Capacity
Substation Class
Capacity (MVA)
98th %ile Load as
% of Class
Capacity
2005 Security
of Supply
Desired Security
Class
Alfredton 1 1 1.5 1.4 2.1 7.6 1.1 0.6 0.6 0.0 1.1 54.5% A1 A1 Feilding 2 2 16 / 24 21.1 31.0 22.9 3.0 16.3 17.7 21.1 22.9 71.1% AAA AAA Kairanga 2 2 12.5 / 17 15.0 22.0 22.9 5.0 13.4 15.7 15.0 20.0 67.3% AA AAA Keith St 2 2 11.5 / 23 18.6 27.3 22.9 7.2 9.2 12.4 18.6 22.9 40.1% AAA AAA Kelvin Grove 2 2 12.5 / 17 15.0 22.0 22.9 4.0 9.7 11.5 15.0 19.0 51.2% AA AAA Kimbolton 1 1 3.0 2.9 4.1 12 0.5 2.2 2.6 0.0 0.5 434.4% A2 A2 Main St 2 2 20.0 20.0 28.6 30.5 8.0 23.8 31.9 20.0 28.0 85.1% AAA AAA Mangamutu 2 2 5 / 6.25 5.5 8.1 7.6 1.6 8.2 8.6 5.5 7.1 115.1% AA AA Milson 2 2 12.5 / 17 15.0 22.1 22.9 7.1 11.5 12.7 15.0 22.1 52.1% AAA AAA Parkville 1 1 3.0 2.9 4.3 7.6 1.8 1.6 1.9 0.0 1.8 90.0% A2 A2 Pascal St 2 2 20.0 19.2 28.2 38.1 8.3 19.8 24.6 19.2 27.5 72.0% AA AAA Pongaroa 1 1 3.0 2.9 4.2 7.6 1.3 0.6 0.8 0.0 1.3 48.4% A1 A1 Sanson 2 1 7.5 7.5 11.0 15.2 4.1 6.7 8.0 0.0 4.1 164.0% A2 AA Turitea 2 2 12.5 / 17 14.5 21.2 22.9 2.0 11.2 12.6 14.5 16.5 68.2% AA AAA Note: The ambient temperature and hot spot temperature for which transformers are rated varies. See Powerco’s Zone Substation Transformer Rating standard. ONAN capacities reported are the ratings assigned by this standard.
Table 6.18: Taranaki Substation Maximum Demands and Transfer Capacities
Substation No of Xfmrs
No of 33 kV
in-feeds
Xfmr Nameplate
Rating (MVA)
Xfmr Cont
Rating (MVA)
Xfmr 2 Hour
Rating (MVA)
Switch-gear firm
Capacity (MVA)
Feeder Transfer Capacity
(MVA)
2005 98th percentile
Load (MVA)
2005 Maximum Demand (MVA)
Substation Firm
Capacity
Substation Class
Capacity (MVA)
98th %ile Load as % of Class Capacity
2005 Security
of Supply
Desired Security
Class
Bell Block 2 2 16 / 24 21.1 31.0 22.9 4.5 16.0 18.0 21.1 22.9 69.7% AAA AAA Cambria 2 2 10.0 9.6 14.1 22.9 6.0 10.2 11.5 9.6 14.1 72% AAA AAA Cardiff 1 1 3.0 2.9 4.2 7.6 1.5 0.7 0.8 0.0 1.5 47% A1 A1 City 2 2 11.5 / 23 20.4 30.0 22.9 8.0 15.4 19.2 20.4 22.9 67% AAA AAA Cloton Rd 2 2 10.0 / 13.0 11.4 16.8 22.9 3.5 6.8 9.0 11.4 14.9 46% AAA AA+ Douglas 1 1 5.0 5.0 7.4 22.9 2.0 1.6 2.2 0.0 2.0 80% A1 A1 Eltham 2 2 7.5 / 10 8.8 12.9 15.2 0.0 8.1 9.1 8.8 8.8 92% AAA AAA Inglewood 2 2 5.0 5.0 7.2 14.2 1.0 4.1 4.8 5.0 6.0 68% AA+ AA Kaponga 2 2 2.5 2.4 3.4 7.6 1.0 2.6 2.9 2.4 3.4 75% AA AA Kapuni 2 2 5.0 5.8 8.2 22.9 1.5 6.2 9.5 5.8 7.3 85% AA AA Livingstone 2 2 2.5 2.4 3.5 7.6 0.0 2.5 2.9 2.4 2.4 103% AA AA Manaia 1 1 7.5 7.2 10.6 11.4 5.0 5.5 5.7 0.0 5.0 110% A2 AA McKee 2 2 1.3 1.2 1.8 7.6 0.0 1.0 1.1 1.2 1.2 84% A1 A1 Motukawa 1 1 2.5 2.4 3.4 4.6 1.5 2.5 3.7 0.0 1.5 167% A2 A2

Section 6
Subject Network Development and Lifecycle Asset Management Plan
Date Issued 30 June 2005
Page 87
Powerco Limited Asset Management Plan – Electricity Networks 2006 - 2020
Substation No of Xfmrs
No of 33 kV
in-feeds
Xfmr Nameplate
Rating (MVA)
Xfmr Cont
Rating (MVA)
Xfmr 2 Hour
Rating (MVA)
Switch-gear firm
Capacity (MVA)
Feeder Transfer Capacity
(MVA)
2005 98th percentile
Load (MVA)
2005 Maximum Demand (MVA)
Substation Firm
Capacity
Substation Class
Capacity (MVA)
98th %ile Load as % of Class Capacity
2005 Security
of Supply
Desired Security
Class
Ngariki 1 1 5 / 6.25 5.5 8.1 7.6 3.0 1.7 2.4 0.0 3.0 55% AA AA Pohokura 2 2 10 / 12.5 10.0 10.0 22.9 0.0 3.0 4.0 10.0 10.0 30% AAA AAA Pungarehu 2 2 3.0 / 4.0 3.5 5.2 15.2 1.6 2.8 3.1 3.5 5.1 55% AA AA Tasman 2 2 5.0 4.8 7.1 22.9 3.0 6.4 7.2 4.8 7.8 82% AA AA Waihapa 2 2 1x1.25, 1 x
2.5 1.2 1.8 7.6 0.0 1.2 1.2 1.2 1.2 100% A2 A2
Waitara East 2 2 5.0 / 9.0 7.9 11.6 23.8 5.1 3.1 3.7 7.9 13.0 24% AA AA Waitara West 2 2 5.0 5.0 7.4 23.8 4.3 3.4 4.0 5.0 9.3 36% AA AA Whareroa 1 1 10.0 9.6 14.1 7.6 4.0 3.4 4.6 0.0 4.0 84% AA AA TP Carrington 11
2 2 10.0 * * * 12.0 20.7 23.0 10.0 22.0 94% AA AA
TP Moturoa 2 2 11.5 / 23 * * * 13.0 16.0 17.5 21.1 34.1 47% AAA AAA Note: The ambient temperature and hot spot temperature for which transformers are rated varies. See Powerco’s Zone Substation Transformer Rating standard. ONAN capacities reported are the ratings assigned by this standard.
Table 6.19: Tauranga Substation Maximum Demands and Transfer Capacities
Substation No of Xfmrs
No of 33 kV in-feeds
Xfmr Nameplate
Rating (MVA)
Xfmr Cont
Rating (MVA)
Xfmr 2 Hour
Rating (MVA)
Switch-gear firm Capacity
(MVA)
Feeder Transfer Capacity
(MVA)
2005 98th percentile
Load (MVA)
2005 Maximum Demand (MVA)
Substation Firm
Capacity
Substation Class
Capacity (MVA)
98th %ile Load as
% of Class
Capacity
2005 Security
of Supply
Desired Security
Class
Aongatete 2 2 5 5.8 8.3 22.9 2.2 8.2 9.2 5.8 8.0 102% AA AA Kauri Point 1 1 5 5.0 7.4 7.6 3.7 1.8 2.7 0.0 3.7 49% A2 A2 Matua 2 2 5 5.8 8.5 22.9 3.4 6.5 7.9 5.8 9.2 71% A2 AA Omokoroa 1 1 10 / 12.5 10.6 15.2 22.9 1.8 5.9 7.0 0.0 1.8 325% A2 AA Otumoetai 2 2 1x10/12.5,
1x12.5/15 10.6 15.6 22.9 8.6 13.2 15.5 10.6 19.2 69% AA AA
Papamoa 2 2 1x11.5 / 23, 1x11.5*
11.5 16.9 22.9 5.5 13.9 16.9 11.5 16.9 82% AAA AA
Pongakawa 2 2 5 5.0 7.2 22.9 7.2 4.6 5.6 5.0 12.2 37% AA A1 Tauranga City
3 3 7.5 7.2 7.6 7.6 2.2 14.2 15.7 14.4 7.6 186% AAA AAA
Te Puke 2 2 16 / 24 11.0 15.7 22.9 4.2 16.6 18.9 11.0 15.2 109% AA AAA Triton 2 2 11.5 / 23 18.6 26.6 22.9 6.1 17.6 21.9 18.6 22.9 77% AA+ AAA Waihi Rd 2 2 1x5**,
1x16/24 5.8 8.2 15.5 3.3 7.7 10.1 5.8 9.1 85% AA AA
Welcome Bay
2 2 11.5 / 23 11.5 16.9 22.9 6.6 11.9 15.1 11.5 18.1 66% AA AA

Section 6
Subject Network Development and Lifecycle Asset Management Plan
Date Issued 30 June 2005
Page 88
Powerco Limited Asset Management Plan – Electricity Networks 2006 - 2020
Substation No of Xfmrs
No of 33 kV in-feeds
Xfmr Nameplate
Rating (MVA)
Xfmr Cont
Rating (MVA)
Xfmr 2 Hour
Rating (MVA)
Switch-gear firm Capacity
(MVA)
Feeder Transfer Capacity
(MVA)
2005 98th percentile
Load (MVA)
2005 Maximum Demand (MVA)
Substation Firm
Capacity
Substation Class
Capacity (MVA)
98th %ile Load as
% of Class
Capacity
2005 Security
of Supply
Desired Security
Class
TP Tauranga
2 2 20.2 20.2
TP Mt Maunganui
2 2 15.5 17.7
Note: The ambient temperature and hot spot temperature for which transformers are rated varies. See Powerco’s Zone Substation Transformer Rating standard. ONAN capacities reported are the ratings assigned by this standard. Table 6.20: Valley Substation Maximum Demands and Transfer Capacities
Substation No of Xfmrs
No of 33 kV in-feeds
Xfmr Nameplate
Rating (MVA)
Xfmr Cont
Rating (MVA)
Xfmr 2 Hour
Rating (MVA)
Switch-gear firm Capacity
(MVA)
Feeder Transfer Capacity
(MVA)
2005 98th percentile
Load (MVA)
2005 Maximum Demand (MVA)
Substation Firm
Capacity
Substation Class
Capacity (MVA)
98th %ile Load as
% of Class
Capacity
2005 Security
of Supply
Desired Security
Class
Baird Rd 2 2 9.6 4.8 7.1 22.9 6.0 5.6 8.9 4.8 10.8 52% AA AA+ Browne St 1 1 7.2 10.0 14.7 22.9 3.0 5.2 6.3 0.0 3.0 174% A2 AA Coromandel 1 1 5 5.0 7.4 22.9 0.0 3.0 4.7 0.0 0.0 none A2 AA Farmers Rd 2 2 9.6 5.0 7.4 22.9 5.5 5.8 7.9 5.0 10.5 55% AA AA+ Kerepehi 1 1 7.5 8.6 12.3 22.9 2.1 7.1 8.4 0.0 2.1 336% A2 AA+ Lake Rd 1 1 5 5.0 7.2 22.9 2.4 4.4 5.7 0.0 2.4 184% A2 A1 Lakeside + Midway
2 2 5.8 2.9 4.1 N/A 2.7 5.2 N/A N/A N/A N/A N/A
Maraetai Rd 2 2 14.4 7.2 10.6 22.9 6.0 8.4 10.0 7.2 13.2 64% A2 AA+ Matatoki 1 1 7.5 5.8 7.9 22.9 2.2 4.4 5.5 0.0 2.2 200% A2 AA+ Mikkelsen Rd 2 2 14.4 8.3 12.1 22.9 3.7 11.4 12.8 8.3 12.0 95% AA AA+ Morrinsville 2 2 9.6 7.0 10.0 22.9 3.3 7.2 8.9 7.0 10.3 70% AA AA+ Paeroa 2 2 9.6 4.8 6.9 22.9 3.6 6.1 7.6 4.8 8.4 73% AA AA+ Piako 2 2 15 7.5 10.7 22.9 5.1 9.8 10.9 7.5 10.7 91% AA+ AA+ Putaruru 2 2 14.4 8.3 12.1 22.9 3.5 9.6 10.5 8.3 11.8 81% A2 AA+ Tahuna 1 1 5 7.0 10.3 22.9 2.3 4.4 5.5 0.0 2.3 192% A2 A1 Tairua 1 1 7.5 7.5 10.7 22.9 0.3 5.2 7.3 0.0 0.3 none A2 AA+ Thames T2&T3
2 2 15 5.0 7.4 22.9 6.1 9.6 11.0 5.0 11.1 87% A2 AA+
Thames T1 1 1 5 7.5 11.0 22.9 6.9 2.5 3.1 0.0 6.9 36% A2 AA+ Tirau 1 1 7.5 8.8 12.1 22.9 2.8 7.7 8.4 0.0 2.8 276% A2 AA+ Tower Rd 1 1 7.5 8.6 11.8 22.9 5.4 6.9 8.5 0.0 5.4 128% A2 AA+ Waihi 2 2 15 10.0 14.3 22.9 0.9 12.7 14.3 10.0 10.9 116% A2 AAA Waihi Beach 1 1 5 5.0 7.4 22.9 1.3 3.3 4.2 0.0 1.3 252% A1 AA Waitoa 3 3 22.5 10.0 14.7 22.9 0.0 11.8 13.2 20.0 20.0 59% AAA AAA Walton 1 1 7.2 7.2 10.3 22.9 3.5 5.4 7.1 0.0 3.5 155% A1 A1

Section 6
Subject Network Development and Lifecycle Asset Management Plan
Date Issued 30 June 2005
Page 89
Powerco Limited Asset Management Plan – Electricity Networks 2006 - 2020
Substation No of Xfmrs
No of 33 kV in-feeds
Xfmr Nameplate
Rating (MVA)
Xfmr Cont
Rating (MVA)
Xfmr 2 Hour
Rating (MVA)
Switch-gear firm Capacity
(MVA)
Feeder Transfer Capacity
(MVA)
2005 98th percentile
Load (MVA)
2005 Maximum Demand (MVA)
Substation Firm
Capacity
Substation Class
Capacity (MVA)
98th %ile Load as
% of Class
Capacity
2005 Security
of Supply
Desired Security
Class
Whangamata 1 1 7.5 8.8 12.6 22.9 3.1 7.0 10.1 0.0 3.1 225% A2 AA+ Whitianga 2 2 20 7.5 11.0 22.9 0.0 9.3 13.1 7.5 7.5 125% A2 AA Note:
The ambient temperature and hot spot temperature for which transformers are rated varies. See Powerco’s Zone Substation Transformer Rating standard. ONAN capacities reported are the ratings assigned by this standard.
Table 6.21: Wairarapa Substation Maximum Demands and Transfer Capacities
Substation No of Xfmrs
No of 33 kV
in-feeds
Xfmr Nameplate
Rating (MVA)
Xfmr Cont
Rating (MVA)
Xfmr 2 Hour
Rating (MVA)
Switch-gear firm Capacity
(MVA)
Feeder Transfer Capacity
(MVA)
2005 98th percentile
Load (MVA)
2005 Maximum Demand (MVA)
Substation Firm
Capacity
Substation Class
Capacity (MVA)
98th %ile Load as
% of Class
Capacity
2005 Security
of Supply
Desired Security
Class
Akura 2 2 7.5 / 10 8.5 12.5 22.9 7.0 10.3 10.3 8.5 12.5 82% AA+ AAA Awatoitoi 1 1 3.0 3.0 4.3 22.9 1.2 1.2 1.2 0.0 1.2 100% A2 A2 Chapel 2 2 11.5 / 23 18.6 27.4 22.9 8.0 12.3 12.3 18.6 22.9 54% AA+ AAA Clareville 2 2 7.5 / 10 8.5 12.5 22.9 0.0 5.6 5.6 8.5 8.5 66% AA+ AA+ Featherston 1 1 5 / 6.25 5.5 8.1 22.9 2.5 2.8 3.6 0.0 2.5 111% A1 AA Gladstone 1 1 1.0 1.0 1.4 22.9 1.0 0.7 0.7 0.0 1.0 70% A2 A2 Hau Nui 1 1 5 / 6.25 5.5 8.1 7.6 1.0 3.7 4.8 0.0 1.0 372% A2 A2 Kempton 1 1 5 / 6.25 5.5 8.1 22.9 2.8 3.9 3.9 0.0 2.8 139% A2 AA Martinborough 1 1 5 / 6.25 5.5 8.1 22.9 2.3 2.5 3.4 0.0 2.3 107% A1 AA Norfolk 2 2 5 / 6.25 5.5 8.1 22.9 4.0 5.7 5.7 5.5 9.5 60% AA AAA Te Ore Ore 1 1 5 / 6.25 5.5 7.9 15.2 5.0 4.7 5.4 0.0 5.0 94% AA AA Tinui 1 1 1.5 1.3 1.9 11.4 1.0 0.8 0.8 0.0 1.0 80% A2 A2 Tuhitarata 1 1 3.0 2.9 4.2 7.6 1.5 1.8 1.8 0.0 1.5 120% A2 A2 Note: The ambient temperature and hot spot temperature for which transformers are rated varies. See Powerco’s Zone Substation Transformer Rating standard. ONAN capacities reported are the ratings assigned by this standard.

Section 6
Subject Network Development and Lifecycle Asset Management Plan
Date Issued 30 June 2005
Page 90
Powerco Limited Asset Management Plan – Electricity Networks 2006 - 2020
Table 6.22: Wanganui Substation Maximum Demands and Transfer Capacities
Substation No of Xfmrs
No of 33 kV in-feeds
Xfmr Nameplate
Rating (MVA)
Xfmr Cont
Rating (MVA)
Xfmr 2 Hour
Rating (MVA)
Switch-gear firm Capacity
(MVA)
Feeder Transfer Capacity
(MVA)
2005 98th percentile
Load (MVA)
2005 Maximum Demand (MVA)
Substation Firm
Capacity
Substation Class
Capacity (MVA)
98th %ile Load as
% of Class
Capacity
2005 Security
of Supply
Desired Security
Class
Arahina 1 1 10 / 12.5 10.6 15.6 22.9 7.2 6.3 7.7 0.0 7.2 88% AA AA Beach Rd 1 1 10.0 10.6 15.6 22.9 4.2 6.9 8.4 0.0 4.2 163% A2 AAA Blink Bonnie
1 1 5.0 4.8 7.1 22.9 3.6 2.8 3.3 0.0 3.6 77% AA AA
Bulls 1 1 7.5 7.2 10.6 22.9 1.6 2.9 3.4 0.0 1.6 182% A2 AA Castlecliff 2 2 1x7.5,
1x10 7.2 10.6 22.9 2.4 7.3 8.4 7.2 9.6 76% AA AAA
Hatricks Wharf
1 1 10* 11.0 15.7 22.9 10.9 7.8 8.3 0.0 10.9 72% AA AAA
Kai Iwi 1 1 5.0 4.8 7.1 15.2 2.4 1.4 1.7 0.0 2.4 59% A2 AA Peat St 1 1 10/12.5/20 16.2 23.8 22.9 7.8 10.8 13.2 0.0 7.8 138% AA AAA Pukepapa 1 1 10 / 12.5 11.0 16.2 22.9 7.2 2.2 3.3 0.0 7.2 30% AA AA Rata 1 1 7.5 7.5 11.0 7.6 2.1 2.6 2.6 0.0 2.1 124% A2 A1 Roberts Ave
1 1 7.5 / 10 7.2 10.6 22.9 3.9 3.7 3.7 0.0 3.9 95% AA AA
Taihape 1 1 10.0 10.6 15.6 22.9 0.1 6.0 6.0 0.0 0.1 none A2 AA Taupo Quay
1 1 10 / 12.5 11.0 16.2 22.9 16.0 7.0 12.5 0.0 16.0 44% AA AAA
Waiouru 1 1 7.5 7.2 10.6 15.2 0.0 2.7 3.0 0.0 0.0 none A2 AA Wanganui East
1 1 7.5 7.2 10.6 22.9 3.8 5.3 5.3 0.0 3.8 139% A2 AA
TP Ohakune
1.9 1.9
TP Waverley
3.5 3.5
Note: The ambient temperature and hot spot temperature for which transformers are rated varies. See Powerco’s Zone Substation Transformer Rating standard. ONAN capacities reported are the ratings
assigned by this standard.

Section 6
Subject Network Development and Lifecycle Asset Management Plan
Date Issued 30 June 2005
Page 91
Powerco Limited Asset Management Plan – Electricity Networks 2006 - 2020
6.10.5 Adequacy of Network and Network Constraints
The following covers the network adequacy for each substation as well as their individual
development options.
6.10.5.1 Manawatu Zone Substations
Alfredton, Parkville and Pongaroa substations supply areas of northern Wairarapa. They
have category A2 security. Each consists of a single transformer that has sufficient installed
capacity to meet forecast load growth. Powerco is considering the future of Pongaroa and
Alfredton substations.
Feilding substation supplies Feilding and the surrounding rural area, commercial, industrial,
residential and rural load. It has two transformers with a capacity of 2 x 16 / 24MVA, which
provide AAA security. Reinforcement will be required by 2017. A third Bunnythorpe – Feilding
33kV circuit may be constructed during the planning period and a new substation may be
required.
Kairanga substation supplies residential and rural load to the south east of Palmerston North
and the NZMP dairy factory at Linton. Additional capacity will be needed by 2011. At 33kV,
Kairanga and Pascal St substations are connected on an open ring from Linton GXP.
Kairanga’s present security level is AA, and an upgrade of protection and other equipment is
planned in FY2006 to allow operation with the ring closed, providing AAA security.
Keith St substation supplies industrial, commercial and residential load in Palmerston North.
The 33kV switchgear was replaced in 1999 as a result of a 33kV switchboard failure in June
1998, and the transformers were upgraded in 2003. It has AAA security.
Kelvin Grove substation supplies commercial, industrial and residential load in Palmerston
North and rural load to the north. Its capacity will be adequate for the planning period. Its
present security level is AA, and upgrading the protection Keith St will enable AAA security.
Kimbolton substation supplies the town of Kimbolton and the surrounding rural area. It has
sufficient installed transformer capacity to the end of the planning period, but back feeding
from Feilding requires the use of temporary voltage regulators. Its security level is A2.
Main St substation supplies the Palmerston North CBD. It is loaded above its firm capacity
under the present feeder configuration, but load transfer to Keith St will reduce its load. Its
security level is AAA.

Section 6
Subject Network Development and Lifecycle Asset Management Plan
Date Issued 30 June 2005
Page 92
Powerco Limited Asset Management Plan – Electricity Networks 2006 - 2020
Mangamutu substation supplies Pahiatua, the NZMP dairy factory and the surrounding rural
area. It now has adequate firm capacity to meet present and forecast demand. Load growth
largely depends on dairy industry load at Pahiatua.
Milson substation supplies industrial, commercial and residential load in western Palmerston
North, including the airport. Its capacity will be adequate for the planning period.
Pascal St substation supplies industrial, commercial and residential load in central
Palmerston North. Its security level is AAA. It is close to reaching its class capacity and
options will be considered for off loading, reinforcement or a new zone substation.
Sanson substation supplies Sanson township and the surrounding rural area. It has
adequate capacity to meet forecast demand, but the single circuit 33kV supply does not allow
class AA security to be achieved. An 11kV link to Bulls substation which would provide a
backup supply may be installed if it is required for Ohakea, but is otherwise it is difficult to
justify economically.
Turitea substation supplies Massey University and industrial, residential and rural load to the
south east of Palmerston North. It has two 12.5/17MVA transformers and its capacity is
expected to be adequate until 2017. Turitea is supplied by one 33kV line from Linton GXP. A
second line has been considered for providing AAA security but the existing line from Linton is
short and rarely faults and there is little economic justification for a second line. AA+ security
can be provided at reasonable cost, and is planned for 2007.
Tararua Wind Power (TWP), not owned by Powerco, has been configured as two groups of
turbines of approximately 34 MW each, connected together by a 33kV cable network. Its
capacity may be increased during the planning period. TWP can be connected to Kelvin Grove
and/or Turitea substations.
6.10.5.2 Taranaki Zone Substations
Bell Block substation supplies the Bell Block industrial area, and the nearby residential and
surrounding rural areas. The area offers flat industrial zoned sites, conveniently sited for
access to highway, port and rail at reasonable cost, so further industrial load growth is
possible. One major consumer in the area dominates by taking approximately 20% of firm
capacity of the zone substation. Its capacity is expected to be adequate for the planning
period.
Cambria substation supplies the commercial and residential areas of Hawera and the
immediate surrounding rural area. Its load is above its firm capacity, and load transfer to
Whareroa substation will be carried out in conjunction with Whareroa substation relocation. Its

Section 6
Subject Network Development and Lifecycle Asset Management Plan
Date Issued 30 June 2005
Page 93
Powerco Limited Asset Management Plan – Electricity Networks 2006 - 2020
capacity is expected to be adequate for the planning period, with Whareroa absorbing the load
growth.
Cardiff substation supplies the rural area to the west of Stratford and provides support for
Kaponga. Its capacity is expected to be adequate for the planning period.
Carrington GXP 11kV supplies the southern residential area of New Plymouth and the rural
area to the south of the city. There is significant residential development going on in the area,
and additional residential sections are being subdivided. The bus is loaded beyond its firm
capacity, and significant load shedding is required during winter to prevent overloading. The
11kV switchgear is over 45 years old and the 110/11kV transformers are 59 years old. It is
proposed that these will be replaced by Transpower in 2006/07.
City substation supplies the central business district and surrounding residential area of New
Plymouth. There is some building activity, but there is capacity for further development in the
central business district. Its capacity is expected to be adequate for the planning period.
However, the 33kV cables supplying it have been found to be in poor condition and it is
planned to lay new cables in FY2006/07.
Cloton Rd substation supplies the commercial and residential areas of Stratford and the
surrounding rural area. Population is static, with little building activity, although dairy load is
growing. Its capacity is expected to be adequate for the planning period.
Douglas substation is situated near Douglas, to the east of Stratford. It supplies the rural
area east of Stratford to beyond Whangamomona. There is lot of timber growing in this area,
and electricity needs could rise significantly if local milling is established. Its capacity is
expected to be adequate for the planning period subject to the above.
Eltham substation supplies Eltham town and the surrounding rural area. A significant part of
its load is taken by Riverlands freezing works and the Pastoral Foods dairy products factory.
Load growth will largely depend on the requirements of these two consumers.
Inglewood substation supplies Inglewood township and the surrounding rural area. Its
capacity is expected to be adequate for the planning period.
Kaponga substation supplies Kaponga and the surrounding rural area. Its capacity is
expected to be adequate for the planning period.
Kapuni substation supplies the rural area around Kapuni. It previously took co-generation
load from the Natural Gas Corporation Kapuni site, and supplied the Fonterra lactose plant. Its
capacity is expected to be adequate until 2011.

Section 6
Subject Network Development and Lifecycle Asset Management Plan
Date Issued 30 June 2005
Page 94
Powerco Limited Asset Management Plan – Electricity Networks 2006 - 2020
Livingstone substation supplies Patea town and the surrounding area. Little load growth is
expected. It is loaded slightly above its firm capacity, but by transferring some load to
Whareroa, its capacity is expected to be adequate for the planning period.
Manaia substation supplies the town of Manaia and the surrounding area. One industrial
consumer takes a significant part of its load. It is a single transformer substation, backed up by
11kV supply from Kapuni, but the backup is inadequate at times. A new switchboard was
installed in 2005, and a second transformer and 33kV line into Manaia is planned for 2007.
McKee substation supplies the McKee petroleum production station and the surrounding
rural area. Its capacity is expected to be adequate for the planning period. However the
transformers are over 45 years old, they are in a deteriorated condition. Backup supply can be
provided at 11kV.
Motukawa substation is located at Trustpower's Motukawa power station site, and it supplies
the surrounding rural area. Its capacity is expected to be adequate for the planning period. It
will be disestablished when 6.6/11kV conversion occurs.
Moturoa GXP 11kV is owned by Transpower, although Powerco owns some of the equipment
in it and the 33kV cables supplying it. Powerco also has an interest in the transformers, having
paid UK£2,100 in 1971 to have 11.5 / 23MVA transformers installed instead of 10MVA units.
Moturoa substation supplies the port area of New Plymouth and the western part of the New
Plymouth residential area. It also supplies the rural area westward to Okato. Its capacity is
adequate for the planning period. Discussions have been held with Transpower regarding
Powerco purchasing this substation.
Ngariki substation is on Ngariki Rd, between Opunake and Pungarehu. Its primary purpose
is to provide a backup supply to the Maui Gas Terminal. It supplies the surrounding rural area.
Its capacity is expected to be adequate for the planning period, especially if the gas terminal
ceases production.
Pungarehu substation supplies Pungarehu and the surrounding rural area. It previously
supplied a dairy factory but this is now closed. Its capacity is expected to be adequate for the
planning period.
Tasman substation supplies Opunake town, the surrounding rural area and the Shell Todd
Oil Services Maui Gas Terminal at Oaonui. Co-generation has been considered for this site in
the past. Its capacity is expected to be adequate for the planning period, and fans could be
retrofitted to the transformers if necessary.

Section 6
Subject Network Development and Lifecycle Asset Management Plan
Date Issued 30 June 2005
Page 95
Powerco Limited Asset Management Plan – Electricity Networks 2006 - 2020
Waihapa substation is exclusively for supplying the Waihapa petroleum production station.
Its load is not expected to increase.
Waitara East substation supplies the rural area to the east of Waitara, and all the area north
towards Mt Messenger. Little load growth is expected and its capacity is expected to be
adequate for the planning period.
Waitara West substation supplies the Waitara town area and some nearby rural areas. Its
capacity is expected to be adequate for the planning period.
Whareroa substation is located on the New Zealand Milk Products Dairy Factory site. It
previously supplied and accepted generation from the Kiwi Dairy Factory, and now supplies
the rural area to the south of Hawera. There is co-generation from an oil and gas well site to
the south of the substation. The substation is configured for two transformers but only one is
now installed. Loads in the area will be monitored to determine future needs. Access to the
substation has become unsatisfactory, and rebuilding on another nearby site could take place.
New Substations. A new substation is being constructed at Motunui to supply the Pohokura
gas shore station, and a new substation will be built on the Waitara Freezing Works site if
meat processing recommences there.
6.10.5.3 Tauranga Zone Substations
Aongatete substation provides supply to Katikati, Matakana Island, and the surrounding rural
area. There are a number of cool stores and sawmills in the area. Claymark sawmill, just
south of Katikati has recently expanded. It is loaded beyond its class capacity, but will be
relieved by a new Katikati substation in 2007. Its 33 kV line is being upgraded progressively.
Kauri Point substation supplies various small beach settlements between Katikati and Waihi
Beach. A voltage regulator is located at Kauri Point substation to provide back up for parts of
the 11kV network. Its peak load is up to its class capacity, but the new zone substation at
Katikati in 2007 will relieve it. Some load from Kauri Point has recently been transferred to
Waihi Beach substation.
Matua substation supplies Tauranga suburban load. Some load growth is expected to come
from infill housing. Capacity is expected to be adequate for several years. AA security is
desired, but due to the single supply, only A2 is available. Security at Matua has increased
with new circuit breakers at Otumoetai. A new substation at the port for 2011 will provide
significant 11kV backup capacity and a proposed new 33 kV cable to Matua will raise security
to AA in 2011.

Section 6
Subject Network Development and Lifecycle Asset Management Plan
Date Issued 30 June 2005
Page 96
Powerco Limited Asset Management Plan – Electricity Networks 2006 - 2020
Omokoroa substation supplies the area north of Tauranga, a mix of rural, lifestyle blocks and
urban residential consumers. Load growth for this area is significant, with District Council
signaling the possibility for more urban development. AA security is desired, but due to the
single transformer, only A2 is available. A second transformer will be installed in FY2006/07.
The 11 kV switchboard is in poor but serviceable condition and it is planned to replace it along
with the second transformer installation.
Otumoetai substation supplies Otumoetai, Judea, and Bethlehem, suburbs of Tauranga.
Steady load growth is forecast for this area. Significant load will be transferred to Waihi Rd
substation when the upgrade currently in progress is completed. Its capacity is then expected
to be adequate for the planning period.
Papamoa substation supplies the Papamoa area. Residential growth is continuing at a
strong rate, and the load has increased rapidly. Fans and pumps will be fitted to transformer
T6 in 2006. A new zone substation is planned for Papamoa East in 2009/10.
Pongakawa substation supplies rural customers in the Pongakawa area. The transformer
capacity at Pongakawa is limited because the transformers cannot be operated in parallel. A
larger transformer will be installed in FY2006, after which capacity and security will be
adequate for the Planning period.
Tauranga City substation supplies Tauranga City CBD, Sulphur point and the Port of
Tauranga. The Port of Tauranga is expected to increase its load. A major upgrade of this
substation is planned for FY2006 and FY2007.
Te Puke substation supplies Te Puke and the surrounding rural area. It is loaded significantly
beyond its class capacity. The Rangiuru freezing works is supplied from this substation. New
16 / 24 MVA transformers are being installed in 2005. The District Council has signaled the
possibility of a large new industrial park in the Rangiuru area.
Triton substation supplies a mix of industrial and urban customers in Mount Maunganui. The
industrial load at the Port of Tauranga and the surrounding area is growing steadily.
Transformer capacity is adequate, but 33kV line and cable reinforcements, required for AAA
security, are proceeding and will be completed during FY2006. A new substation nearby is
planned for 2010.
Waihi Road substation supplies urban and commercial load in the centre of Tauranga. Load
is expected to increase, partly due to infill housing and intensification. It was loaded heavily
beyond its class capacity. New 16 / 24 MVA transformers and 11 kV switchboard are being
installed in 2005, which due to a change in vector group, will allow significant load transfer
from Otumoetai substation.

Section 6
Subject Network Development and Lifecycle Asset Management Plan
Date Issued 30 June 2005
Page 97
Powerco Limited Asset Management Plan – Electricity Networks 2006 - 2020
Welcome Bay substation supplies the Welcome Bay area. It is loaded beyond its class
capacity, but this is being rectified by adding fans and pumps to the transformers. With this
done, capacity is expected to be satisfactory for the planning period. One of the 33 kV circuits
supplying Welcome bay is being upgraded in 2005.
6.10.5.4 Valley Zone Substations
Baird Road substation supplies the northern part of Tokoroa, including the CBD and the
farming area just to the north of Tokoroa. Its capacity is adequate for supplying its own load,
but additional capacity is required to support Maraetai Rd substation. Security is A2, but this
can be increased to the required AA by reinforcing feeder links to Maraetai Rd.
Browne Street substation supplies the western side of Matamata including the CBD and the
rural area towards Cambridge. It is loaded beyond its class capacity and requires support from
Tower Rd substation. Security is A2, but this is being increased to the required AA by
reinforcing feeder links to Tower Rd.
Coromandel substation is a single transformer substation, which supplies Coromandel and
the surrounding areas. There is no interconnection via 11kV network with any other
substations. Major maintenance generally requires supply interruptions, although generators
could be used in some situations. Supply is via a single 66kV line. AA security is desired, but
providing a supply security greater than A2 is not economic.
Farmer Road substation supplies two major industrial customers plus the dairy farms in the
immediate area. Both of these major customers, Tatua Dairy and Wallace Corporation have
indicated that their loading requirements are likely to increase in the future. AA+ security is
desired, but due to a single 33 kV supply, only AA is available. Farmer Road is supplied from
a tee from a bonded double circuit line passing nearby. A new GXP is planned for the Piako
area and once the incoming supply is modified, capacity and security will be adequate for the
planning period.
Kerepehi substation provides supply to most of the Hauraki Plains including townships of
Ngatea and Kerepehi. A second transformer will be installed in FY2006. Limited backup for
the 11kV network in the event of a 66 kV line failure is available from Tahuna, Paeroa, and
Matatoki substations. Increased 11kV interconnection to Matatoki is planned for 2006, but
security will still be A2, whereas AA+ is desired.
Lake Road substation is sited alongside the Transpower 33kV GXP at Hinuera. It supplies
farms in the Hinuera area. It is loaded beyond its class capacity. Lake Rd supplies a portion
of Tirau township’s load and when Tirau is upgraded, Lake Rd can be off loaded.

Section 6
Subject Network Development and Lifecycle Asset Management Plan
Date Issued 30 June 2005
Page 98
Powerco Limited Asset Management Plan – Electricity Networks 2006 - 2020
Maraetai Road substation supplies the southern part of Tokoroa and the rural area south to
Kinleith. No significant increase in load is predicted during the planning period. Security is A2,
but this can be increased to the required AA by reinforcing feeder links to Baird Rd
Matatoki substation is a single transformer substation supplying the Matatoki rural area and
two major customers, Thames Timber at Kopu and Carter Holt Harvey Mill at Matatoki. Both
these customers have indicated that they have plans to take more load. AA+ security is
desired, but due to a single supply, only A2 is available. A 7.5 transformer has been installed
in 2005, and increased 11 kV interconnection will improve the security.
Mikkelsen Road substation is sited alongside Transpower’s Waihou GXP. It supplies Te
Aroha and the surrounding rural area, and two major customers supplied, Ingham’s Chicken
Processing Plant and Richmond’s meat processing plant. Indications are that the load at
Ingham's Plant is going to increase. The demand at Mikkelsen Road is presently such that the
failure of one transformer could cause the other transformer to trip on overload before
switching is carried out to transfer load. Options for transferring load away are being
investigated.
Morrinsville substation is situated near the NZMP Morrinsville Dairy Factory, to supply the
load at the Morrinsville Dairy Company. Indications from NZMP are that the load requirements
at their Morrinsville factory are now likely to increase. AA+ security is desired, but due to a
single 33kV supply, only A2 is available.
Paeroa substation supplies the town of Paeroa and the surrounding rural area. Capacity is
adequate for AA security for the planning period, but for AA+ security, reinforcement is
required.
Piako substation supplies the rural area to the east of Morrinsville, and provides support for
Morrinsville. Its load is close to its AA class capacity. Fans are currently being fitted to
increase its capacity. Ways of improving the security of supply to the Piako and Morrinsville
areas will be investigated.
Putaruru substation supplies the town of Putaruru and the surrounding rural area. The CHH
Putaruru Sawmill is supplied from Putaruru Substation. AA+ security is desired, but due to a
single supply, only A2 is available. A GXP at Putaruru to increase security for Putaruru and
Tirau substations is planned. This will provide at least AA security for the planning period.
Tahuna substation is located near the village of Tahuna. It supplies the rural area north of
Morrinsville and the village of Tahuna. Its capacity is expected to be adequate for the planning
period, but only A2 security is available while A1 is desired.
Section 6
Subject Network Development and Lifecycle Asset Management Plan
Date Issued 30 June 2005
Page 99
Powerco Limited Asset Management Plan – Electricity Networks 2006 - 2020
Tairua substation supplies Tairua and Pauanui beach resorts. Both of these areas have
experienced strong load growth, and this is expected to continue. The load at Pauanui and the
long repair time for the submarine cable makes an alternative supply desirable. The
transformer capacity has recently been increased from 5.0 to 7.5MVA. A single transformer
limits security to A2, where AA+ is desired, although there are two 66kV supplies. Installation
of a second transformer is planned for 2007
Thames substation has 3 x 66/11kV transformers. One of the transformers normally supplies
only the A & G Price foundry, because of the voltage flicker caused by their arc furnace. The
transformer capacity will be adequate for the planning period. AA security is desired, but due
to a single 33 kV supply, only A2 is available. A second 33 kV line is planned for 2009.
Tirau substation supplies the NZMP Dairy factory, the village of Tirau, and the rural area
surrounding Tirau. The load requirements are dependent on the Dairy Factory Load. Recent
indications from NZMP indicate that the load at Tirau may increase slightly. The transformer
capacity will need to be increased. Putaruru and Tirau are supplied by a single 33kV line from
Hinuera GXP. A GXP at Putaruru is planned to increase security for Putaruru and Tirau
substations. AA security is desired, but due to the single supply, only A2 is available. When
Tauranga City has been upgraded, one of the transformers from there will be relocated to
Tirau.
Tower Road substation supplies the eastern side of Matamata and the surrounding rural
area. Security is A2, but this can be increased to the required AA by reinforcing feeder links to
Browne St substation. Installation of a second transformer is planned for 2007.
Waihi substation supplies Waihi and the surrounding rural area plus the Waihi Gold Mine.
The peak load is well beyond the substation class capacity, and mine load has to be shed in
the event of a major outage.
Waihi Beach substation supplies Waihi Beach and the surrounding area. Its security level is
A1, where AA is required.
Waitoa Substation is located on NZMP Waitoa Factory Site. This substation only supplies the
Dairy Factory; there are no connections to the external 11kV network. The transformer
capacity at Waitoa is specified in the supply agreement with NZMP.
Walton Substation supplies dairy load in the Walton area. A new cheese factory is planned
for the area, which will initially be supplied from Walton, but may necessitate a new zone
substation to meet its load. This is currently being investigated.
Section 6
Subject Network Development and Lifecycle Asset Management Plan
Date Issued 30 June 2005
Page 100
Powerco Limited Asset Management Plan – Electricity Networks 2006 - 2020
Whangamata Substation supplies the town of Whangamata and the surrounding rural area.
It is a resort area, and its load is determined by holiday demand. Its peak load is below the
substation class capacity. AA+ security is desired, but due to the single supply, only A2 is
available. A second 33 kV line is planned for 2008.
Whitianga substation supplies Whitianga and the surrounding rural area. It is a resort area,
and its peak load is determined by holiday demand. Its load is beyond its firm capacity. One
new 12.5 / 17 MVA transformer was installed in 2005, and another will be installed in 2006..
AA security is desired, but due to the single supply, only A2 is available. Investigations into
constructing a new line from Coroglen to Kaimarama to enhance the security of supply to
Whitianga are proceeding. Studies will be done to investigate options for supplying load north
of Whitianga and to solve voltage problems in the distribution network.
6.10.5.5 Wairarapa Zone Substations
Chapel and Akura substations supply the Masterton Central Business District, industrial and
commercial areas, and a significant part of Masterton residential area. Their capacities are
expected to be adequate for the planning period. Both of these substations require AAA
security but presently have AA+ because the protection arrangements do not permit
paralleling. A protection upgrade at Akura is planned for FY2006.
Clareville substation supplies Carterton and the surrounding rural area. Its capacity is
expected to be adequate for the planning period.
Featherston substation supplies Featherston and the surrounding rural area. Irrigation
loading has improved this substation's load factor. Its capacity is expected to be adequate for
the planning period, but A1 security is available where AA is required. Options will be
investigated for improving the security levels.
Gladstone substation is situated in a rural area to the east of Carterton, and supplies rural
load. Its capacity is expected to be adequate for the planning period.
Hau Nui substation is situated in south eastern Wairarapa, adjacent to the Genesis wind
farm. Its primary purpose is to connect the wind farm output into the network, but it also
supplies a small rural load. Its capacity is expected to be adequate for the planning period.
Kempton substation supplies Greytown and the surrounding rural area. Its capacity is
expected to be adequate for the planning period. AA security is required, but only A2 is
available. Options for upgrading the security to Kempton are being considered.

Section 6
Subject Network Development and Lifecycle Asset Management Plan
Date Issued 30 June 2005
Page 101
Powerco Limited Asset Management Plan – Electricity Networks 2006 - 2020
Martinborough substation supplies urban and rural load. New works in the area have not
resulted in significant load increases, as most new loads are summer and weekend loads,
occurring outside peak times. Improved 11kV backup would raise the security levels and
options are being considered.
Norfolk substation is situated a few kilometres south of Masterton. It supplies several MVA
of load to a single large consumer, as well as other industrial and rural load. Its capacity is
expected to be adequate for the planning period. AAA security is required but AA is available.
Te Ore Ore substation is on the eastern edge of Masterton, and supplies a mix of residential
and rural load. Its capacity is expected to be adequate for the planning period. It is loaded to
its class capacity, but this, plus projected growth, can be handled by cyclic loading and load
transfer until around 2007, when a second transformer will be required.
Tuhitarata substation is situated in the southern Wairarapa area, and supplies a rural load.
Its capacity is expected to be adequate for the planning period.
Tinui and Awatoitoi substations are situated in rural areas to the east of Masterton, towards
Castlepoint, and they supply rural loads. Their capacities are expected to be adequate for the
planning period.
6.10.5.6 Wanganui Zone Substations
Arahina substation is situated at Marton, and supplies urban and rural load. Its capacity is
expected to be adequate for the planning period.
Blink Bonnie substation is situated to the east of Wanganui, adjacent to the Transpower
Wanganui GXP. It supplies the rural load to the south of Wanganui. Its capacity is expected to
be adequate for the planning period
Bulls substation supplies Bulls township and the surrounding rural load. It has A2 security,
but AA is desired. An 11kV link to Sanson substation which would provide a backup supply
may be installed if it is required for Ohakea, but is otherwise uneconomic.
Castlecliff and Beach Rd substations supply a large portion of the city’s industrial load.
Several new industries have emerged over recent years and there has been strong load
growth in this area. Castlecliff capacity was increased during 2004 by installing one 10MVA
transformer, and another is planned for 2006. Beach Rd supplies Imlay freezing works and
other industrial consumers from a single transformer, providing only A2 security of supply. In
the event of a subtransmission fault, backup supplies may be inadequate, and reinforcement

Section 6
Subject Network Development and Lifecycle Asset Management Plan
Date Issued 30 June 2005
Page 102
Powerco Limited Asset Management Plan – Electricity Networks 2006 - 2020
options are being investigated. Discussions with some consumers indicate this is a risk they
may be able to accept.
Hatricks Wharf and Taupo Quay substations supply the Wanganui CBD, and are
configured to run in parallel. One transformer supports the other during outages and the peak
demands are monitored closely to ensure that overloading does not occur. The peak loads of
these stations considered as a pair is over firm capacity, but 11kV reinforcements planned in
the Wanganui CBD will enable improved load transfer to Peat St Substation.
Kai Iwi substation is situated north west of Wanganui, and supplies the Wanganui City water
pumping station and rural load. Its capacity is expected to be adequate for the planning
period, but its 11kV backup supply is marginal for starting the water supply pumps. This
situation is under investigation.
Peat St substation supplies a mix of residential and commercial loads, including the northern
part of the Wanganui CBD. It is the main backup for Taupo Quay and Hatricks substations.
When Mosston Substation is established, Mosston will pick up approximately 1.5MVA of this
load. The substation is configured for two transformers but only one is installed at present,
resulting in part of the Wanganui CBD having only AA category security of supply. A second
transformer will be installed in 2006, and a 33kV link from Roberts Ave to Peat St installed in
2007, enabling AAA security.
Pukepapa substation is situated adjacent to Transpower Marton GXP. It supplies rural load,
but also provides a backstop for Arahina and Bulls substations. Its capacity is expected to be
adequate for the planning period.
Rata substation supplies Hunterville and the surrounding area. Its capacity is expected to be
adequate for the planning period. Reinforcement is required to enable it to be supplied in the
event of a 33kV line or transformer fault, and 22kV upgrade options are being looked at.
Roberts Ave substation is situated in Aramoho, supplying the Aramoho industrial area, and
surrounding residential and rural areas. Its capacity is expected to be adequate for the
planning period. It has one transformer, providing AA security of supply.
Taihape substation is located in Taihape, and supplies urban and rural load. It has one
transformer, and cannot be back fed in the event of a subtransmission fault. Improvement
alternatives are being investigated.
Waiouru substation is just south of Waiouru township. It has one transformer, and cannot be
back fed in the event of a subtransmission fault. Improvement alternatives have been
investigated, but security better than A2 is likely to be uneconomic.

Section 6
Subject Network Development and Lifecycle Asset Management Plan
Date Issued 30 June 2005
Page 103
Powerco Limited Asset Management Plan – Electricity Networks 2006 - 2020
Wanganui East substation supplies the residential area on the north side of the Whanganui
River and rural area to the east of Wanganui. It is loaded beyond its class capacity, and feeder
interconnection reinforcement will be required during the planning period.
6.10.5.7 11kV Load Transfer Capability
The interconnection between 11kV feeders is adequate to provide category AAA security of
supply to consumers in the city areas of New Plymouth and Tauranga, and some parts of the
city areas of Wanganui and Palmerston North. The remaining parts of these city areas have
category AA+ or AA security of supply. Subject to economic viability, AA+ security will be
installed progressively in those substations not meeting the security requirements set out in
Table 6.17 to Table 6.22. Waitara West, Waitara East, Arahina and Pukepapa substations
have sufficient transfer capacity to maintain category AA security. Other small towns and rural
areas are supplied from single zone substations where there is either no interconnection or
very limited interconnection to other zone substations. Many substations in the Valley area
have only A2 security, and options for reconfiguring the networks are being considered.
6.10.5.8 Fault Levels and Equipment Ratings
Analysis of fault levels on the network shows that equipment and cable ratings on the
subtransmission network are adequate.
In the Tauranga distribution network with its high levels of load growth, there are instances
where small 11kV cables do not have the capability to withstand the full network fault level.
Refer to Section 4.7.3.
6.10.5.9 Voltage Selection
Both 66kV and 33kV will continue to be used as appropriate for the subtransmission network,
reinforced or extended as required. 110 kV is being considered as a possible option for some
areas of the Coromandel Peninsula. 11kV will remain the primary distribution voltage, and
existing 6.6kV will only be uprated where performance or economic advantages require it.
Individual areas of the network may be constructed at or uprated to 22kV if there is a
performance or economic advantage.
6.10.6 Consideration of Alternatives
A long-term development plan has been prepared for the Powerco networks this ensures
optimum use of existing assets and minimises the purchase of new equipment. The network
will meet planning criteria for the planning period with the works detailed in the long-term
development plan, which is reviewed annually.

Section 6
Subject Network Development and Lifecycle Asset Management Plan
Date Issued 30 June 2005
Page 104
Powerco Limited Asset Management Plan – Electricity Networks 2006 - 2020
6.10.7 Summary of Subtransmission Network Development
Table 6.23 to
Table 6.28 list the major subtransmission development projects expected to be required
during the planning period, taken from the Long Term Development Plan. The years given in
the tables indicate the intended start year for each project. Some projects will be completed in
a later year. Multiple years are given for long-term projects.
Table 6.23: Manawatu Development Plan
Financial Year
Location Project Project Cost Estimate
2006 Kairanga - Pascal Line differential protection and communications system $110,000 (Note)
2006 Linton - Kairanga - Pascal
Line differential protection and communications system $150,000 (Note)
2006 Kelvin Grove - Keith Street & Bunnythorpe
Line differential protection and communications system $180,000
2006 Bunnythorpe Replace 33kV feeder circuit breakers. $750,000 2006 Kimbolton Substation Replace fault thrower with circuit breaker, or add fault
location with sectionalisation. $80,000
2006 Kimbolton Substation Upgrade or refurbish outdoor 11kV switchgear $100,000 2006 Mangamaire Upgrade feeder protection relays to remedy discrimination
problem $80,000 (Note)
2007 Bunnythorpe Replace protection relays $190,000 2007 Turitea - Linton Add line differential protection system $50,000 2007 Northern Wairarapa Implement alterations to be decided when Transpower
supply changes are known $300,000
2007 Parkville Substation Install existing 5MVA transformer in place of present auto transformer
$50,000
2007 Main St Substation Replace 33kV switchboard $600,000 2007 Pongaroa Substation Oil type change or oil containment system $150,000 2007 Alfredton Substation Replace 11kV switchgear and protection review $160,000 2008 Keith St - Main St Reinforce oil filled cables, stage 1 $1,000,000 2009 Keith St - Main St Reinforce oil filled cables, stage 2 $1,000,000 2010 Pascal St Substation New 30MVA transformers $1,500,000 2010 Sanson Substation Oil containment system $100,000 2011 Kairanga Substation Fit fans to ex Pascal St transformers and install at
Kairanga $200,000
2011 Linton - Turitea Second 33kV line $500,000 2012 Bunnythorpe Substation Replace oil filled cables $600,000 2012 Milson Substation Install new 16/24 MVA transformers $1,200,000 2013 Feilding Substation Third line from Bunnythorpe and indoor 33kV switchboard $1,000,000 2014 Mangamutu Substation Install 12.5MVA/17MVA transformers, possibly ex Kairanga $150,000
Note: These projects are also described in Table 6.29.
Table 6.24: Taranaki Development Plan
Financial Year
Location Project Project Cost Estimate
2006 Carrington - City (NP) Replace 33kV cables, stage 1 $1,000,000 2006 Pohokura Substation Establish new substation $3,000,000 2006 Livingstone Replace 11kV switchboard $300,000 2006 Ngariki Replace 11kV switches (pole mounted) $100,000 2006 Tasman Replace 33kV circuit breakers $150,000 2007 Carrington GXP New 11kV cable ends to new Carrington GXP
switchboard $180,000
2007 Carrington - City (NP) Replace 33kV cables, stage 2 $750,000 2007 Inaha Road
Substation Establish new substation and 33kV lines $5,000,000
2007 Hawera GXP Replace load control injection plant $400,000 2007 Hawera GXP -
Cambria Replace pilot wire protection system $110,000 (Note)
2008 Manaia Substation Install second line $200,000 2008 Manaia Substation Install second transformer $350,000 2008 McKee Substation Replace transformer(s) and rebuild substation $150,000 2008 Whareroa Rebuild Whareroa Substation at new site $1,500,000 2009 Waitara East Oil containment system $100,000 2009 Moturoa GXP Possible establishment of a 33kV switching station $750,000 2009 Huirangi GXP Install new ripple plant (to supersede Cyclocontrol) $400,000 2010 Huirangi - Bell Block Establish second 33kV line $600,000 2011 Waiwhakaiho Establish new Waiwhakaiho Substation $2,500,000

Section 6
Subject Network Development and Lifecycle Asset Management Plan
Date Issued 30 June 2005
Page 105
Powerco Limited Asset Management Plan – Electricity Networks 2006 - 2020
Note: This project is also described in Table 6.29.
Table 6.25: Tauranga Development Plan
Financial Year
Location Project Project Cost Estimate
2006 Aongatete Upgrade Tauranga - Aongatete 33 kV line $250,000 2006 Tauranga Hamilton St Substation Re-development (Stage 1)
Includes new transformers 16/24 MVA $1,800,000
2006 Tauranga Purchase Land for new Sulphur Point Substation $250,000 2006 Tauranga 33kV and 11kV Cabling to new Port Substation $670,000 2006 Mt Maunganui
Replace dual circuit 33 kV to Triton substation with cable (Final Stage)
$300,000
2006 Mt Maunganui Work associated with new 11kV switchboard at Mt Maunganui GXP
$100,000
2006 Te Puke Upgrade 33kV Circuits Te Matai to Te Puke (Stage 1) $250,000 2006 Pongakawa Install Ex Te Puke Transformer at Pongakawa $250,000 2006 Katikati Establish New Zone Substation Katikati (Stage 1) $750,000 2007 Tauranga Hamilton St Substation Re-development (Stage 2)
Includes new transformers 16/24 MVA $1,000,000
2007 Waihi Rd Upgrade Transformer Circuit Breakers at Waihi Rd.
(CB’s ex Hamilton St.) $60,000
2007 Wairoa
Establish new zone substation Wairoa Utilise ex Pongakawa Transformer
$750,000
2007 Omokoroa Omokoroa – Purchase and install new transformer, including new 11kV Switchboard
$2,000,000
2007 Te Puke Upgrade 33kV Circuits Te Matai to Te Puke (Stage 2) $250,000 2007 Aongatete Upgrade Tauranga - Aongatete 33 kV line $250,000 2007 Bethlehem Purchase Land for New Substation Bethlehem $500,000 2007 Katikati Establish New Zone Substation Katikati (Stage 2) $750,000 2008 Welcome Bay New Line CB’s Welcome Bay $200,000 2008 Kauri Point Replace fault thrower with 33kV circuit breaker Kauri
Point substation. $80,000
2008 Papamoa Construct new line to Papamoa East zone substation from Te Matai
$2,000,000
2008 Papamoa Establish new zone substation Papamoa East (Stage 1) $2,000,000 2008 Te Puke New line from Te Matai to Rangiuru $500,000 2008 Pyes Pa Establish new zone substation Tauranga (Stage 1) $1,000,000 2009 Papamoa New zone Substation Papamoa (Stage 2) $1,000,000 2009 Pyes Pa Establish new zone substation Tauranga (Stage 2) $1,000,000 2009 Rangiuru Establish new zone substation Rangiuru $2,000,000 2009 Tauranga 33kV Tauranga to Waihi Road. $2,500,000 2010 Mt Maunganui 33kV Subtransmission to Supply new Mount Central
Substation $1,000,000
2010 Mt Maunganui New Zone Substation Mount Central $2,500,000 2010 Pongakawa Second 33kV Line to Pongakawa $500,000 2010 Tauranga New Zone Substation Sulphur Point. (Stage 1) $1,000,000 2010 Otumoetai Install 33kV cable Otumoetai to Matua $600,000 2011 Pyes Pa New Zone Substation Sulphur Point ( Stage 2) $1,500,000 2011 Bethlehem 33kV Subtransmission to supply new Bethlehem
Substation $1,000,000
2012 Bethlehem Establish new Zone Substation Bethlehem $2,500,000
Table 6.26: Valley Development Plan
Financial Year
Location Project Project Cost Estimate
2006 Whitianga Purchase and install second Transformer at Whitianga Substation
$750,000
2006 Kopu Coroglen Reinforce 66 kV line (Stage 1) $500,000 2006 Thames Obtain easements for second line to Thames $100,000 2006 Whangamata Obtain easements for second line Waihi -
Whangamata $200,000
2006 Kerepehi substation Install 5+ MVA transformer ex Matatoki Including bunding for transformer oil containment
$150,000
2006 Whitianga Obtain easements and design second 66 kV line from Coroglen to Kaimarama
$300,000
2006 Waharoa Install new Substation at Waharoa Open Country Cheese
$950,000

Section 6
Subject Network Development and Lifecycle Asset Management Plan
Date Issued 30 June 2005
Page 106
Powerco Limited Asset Management Plan – Electricity Networks 2006 - 2020
Financial Year
Location Project Project Cost Estimate
2007 Kopu Coroglen Reinforce 66 kV line conductor (Stage 2) $500,000 2007 Waihou / Piako Waihou Piako reconfiguration Stage 2 $1,000,000 2007 Tairua substation Install second 7.5 MVA transformer ex Whitianga $50,000 2007 Tairua – Coroglen Install regulator $600,000
Putaruru Establishment for Putaruru GXP $500,000 2007 Tower Rd substation Install second 7.5 MVA transformer ex Tauranga city $100,000 2007 Whangamata Install second 33 kV line to Whangamata (Stage 1) $1,000,000 2008 Whitianga Install 11kV Line to Matarangi Area. Line to be
constructed at 66kV (Via Blue Mountain Lumber) $1,200,000
2008 Matamata 33kV cable link Browne Street to Tower road. $500,000 2008 Baird Rd substation Install fans on transformers at Baird Road Substation $80,000 2008 Kopu Coroglen Replace 66 kV line conductor (Stage 3) $500,000 2008 Whangamata Install second 33 kV line to Whangamata (Stage 2) $1,000,000 2008 Piako Establish GXP near Piako $500,000 2009 Thames Construct second 66 kV line to Thames $700,000 2009 Walton substation Install oil containment and carry out seismic upgrade $100,000 2009 Tahuna substation Replace fault thrower with 33 kV circuit breaker $50,000 2009 Kopu Coroglen Replace 66 kV line conductor (Stage 4) $500,000 2009 Morrinsville substation Install 33 kV cable from Piako to Morrinsville $2,000,000 2010 Kerepehi Second 66kV Line Kopu to Kerepehi $500,000 2010 Whitianga Install new marine cable and feeder to supply Cooks
Beach Area $1,000,000
Table 6.27: Wairarapa Development Plan
Financial Year
Location Project Project Cost Estimate
2006 Awatoitoi and Tinui Add backup overcurrent and earth fault protection. $80,000 (Note) 2006 Chapel substation Install oil containment $100,000 2007 Norfolk substation Install oil containment $100,000 2008 Te Ore Ore
substation Second transformer and oil containment $400,000
2008 Awatoitoi – Te Ore Ore
Upgrade 33 kV line $200,000
2009 Akura substation Install oil containment $100,000 2010 Gladstone substation Upgrade 33kV line and regulator if load requires $150,000 2010 Clareville substation Upgrade to AAA security rating. Add 33kV bus coupler $60,000 2010 Clareville substation Install oil containment $100,000 2011 Featherston
Substation Install oil containment $100,000
2012 Kempton substation Install oil containment $50,000 2013 Martinborough
substation Install oil containment $50,000
2013 Awatoitoi substation Upgrade 11 kV buswork $50,000 2014 Tinui substation Replace 11 kV regulators and upgrade 11 kV buswork $150,000 2014 Hau Nui Install oil containment $50,000
Note: This project is also described in Table 6. 29.
Table 6.28: Wanganui Development Plan Financial
Year Location Project Project Cost
Estimate 2006 Beach Road Extend building in preparation for future switchgear
upgrades $150,000
2006 Arahina Injection Replace load control injection plant $250,000 2006 Peat Street Replace outdoor 33kV structure with indoor
switchboard $750,000
2006 Castlecliff Automatic 33kV supply changeover $50,000 2007 Roberts Ave - Peat St New 33kV feeder to improve zone substation security
ratings $250,000
2007 Arahina Replace 33kV protection relays $50,000 2007 Roberts Ave Replace CB 3037 $75,000 2007 Peat Street Purchase and install second transformer $600,000 2007 Rata - Pukepapa Install 22kV bidirectional regulators $200,000 2008 Castlecliff Replace one transformer to match for parallel
operation $75,000
2008 Taupo Quay Install second transformer and 33kV supply $1,200,000 2009 Waiouru - Taihape Waiouru district upgrade to improve zone substation
security ratings $520,000
2009 Beach Road Replace outdoor 33kV structure with indoor switchboard
$600,000

Section 6
Subject Network Development and Lifecycle Asset Management Plan
Date Issued 30 June 2005
Page 107
Powerco Limited Asset Management Plan – Electricity Networks 2006 - 2020
Financial Year
Location Project Project Cost Estimate
2009 Beach Road Extend 11kV switchboard for second transformer $150,000 2009 Beach Road Install second transformer $100,000 2010 Taihape Consolidate substations and install second
transformer $900,000
2010 Brunswick - Beach New 33kV feeder via Peat and Castlecliff to improve zone substation security ratings
$550,000
2011 Arahina - Pukepapa Reinforce connection to provide security upgrade $200,000 2012 Mosston Establish new zone substation if load requires $100,000
6.11 Medium Term Development Plan (Distribution)
6.11.1 Introduction
Powerco’s medium term development plan (MTDP) deals with the distribution system from the
zone substation through to the 11kV/400V transformers.
The analysis and preparation of the MTDP focuses on the following key objectives:
• Assessment of the asset management drivers and performance targets;
• Performance assessment of the present system;
• Review of network improvement recommendations;
• Maintenance of appropriate levels of security of supply; and,
• Optimal development of the distribution system to meet consumer service objectives.
6.11.2 Planning Period
The planning period used for the medium term plan is two to five years, depending on the
nature of the activity.
6.11.3 Assessment of Suitability of System For Present Needs And Analysis of Development Options
6.11.3.1 General
Generally, the distribution network is satisfactory for its purpose. Normal peak loads can be
supplied but backup during faults can be limited for rural feeders. The ability to provide the
required security level in the event of zone substation faults has been taken into account when
considering zone substation expenditure.
6.11.3.2 Installed Capacity and Fault Rating
Some feeder alterations may be required to provide backup supply in the event of zone
substation faults.
Load flow studies of feeders have shown that there are some feeders with low voltage
problems. The action is to confirm the accuracy of the source data, prior to establishing an
action plan. Feeders showing significant voltage and capacity issues will take priority.
Projects to correct this will then be added to the Improvement Register as discussed below.
It is expected that fault duties will be adequate on the 11kV distribution system until at least
the end of the planning period.

Section 6
Subject Network Development and Lifecycle Asset Management Plan
Date Issued 30 June 2005
Page 108
Powerco Limited Asset Management Plan – Electricity Networks 2006 - 2020
6.11.3.3 Fault Locators, Line-Reclosers and Sectionalisers
Fault locators, line reclosers and sectionalisers are being progressively installed in appropriate
positions on the network, to reduce the extent and duration of outages.
6.11.3.4 Distribution Transformer Utilisation
Powerco has a policy of improving the utilisation of distribution transformers in the long-term
by removing transformers from under-utilised sites and placing them in locations where the
required capacity better matches the transformer rating, provided it is cost effective to do so. In
general, an under utilised transformer is noted, and is moved when a more appropriate site is
identified. Utilisation is poor where oversized transformers are installed for electric motors
powering irrigation and frost protection schemes.
6.11.3.5 Undergounding Projects
Powerco’s main underground programme is an arrangement with Palmerston North City
Council to underground prescribed areas. This program prioritises undergrounding of older
lines.
6.11.4 Medium Term Development Planning Process
Powerco uses a two-pronged approach to produce its Medium Term Development Plan,
combining both bottom up and top down analyses.
6.11.4.1 Top Down Analysis
Modelling of the feeders is carried out to determine those with thermal loading, voltage drop
and age related problems. These models take network data from Powerco’s GIS database
and loading data from the SCADA system and MDI meters. Various techniques are used to
combine this data into information on each feeder’s capability, which can then be used to
initiate projects to actively develop the network.
6.11.4.2 Bottom Up Analysis
This part of the process relies on input from the field staff, project engineers and other staff
reporting on problems or deficiencies they find on the network. This data is used to drive
projects to reactively develop the network.
6.11.4.3 Combining the Approaches
Using the two-pronged approach means that the network is developed proactively and, when
a project is not picked up by modelling, reactively.
The projects are collated in an Improvement Register where each is ranked according to its
value by safety, asset investment efficiency, reliability, environment, quality, potential of
adverse litigation, operation and maintenance and shareholder value.

Section 6
Subject Network Development and Lifecycle Asset Management Plan
Date Issued 30 June 2005
Page 109
Powerco Limited Asset Management Plan – Electricity Networks 2006 - 2020
Where appropriate the projects are then scoped, approved and undertaken. Alternatively,
projects can be postponed if they are not immediately required or cancelled if on investigation
there is no need to proceed.
6.11.5 Distribution Network Upgrade Projects
The following are some salient distribution network projects planned for FY2006.
Table 6.29: Major Manawatu Distribution Network Projects
Projects Project Cost Estimate ($)
Pohangina feeder crossarms $66,000 Alfredton pole replacements $145,000 Pascal St 9 upgrade in CBD $75,000
Table 6.30: Major Taranaki Distribution Network Projects
Projects Project Cost Estimate ($)
Pihama feeder rebuild $100,000 Rebuild on Motunui feeder $80,000 Manaia town upgrade $60,000 Ratapiko feeder upgrade $60,000 STOS and Oaonui feeders – rebuild $126,000
Table 6.31: Major Valley Distribution Network Projects
Projects Project Cost Estimate ($)
Tairua – new feeder $350,000 Whangamata – new feeder $500,000 Whitianga – new feeder $100,000 Waihi Beach upgrade 11kV $60,000 Te Aroha Borough feeder back up $110,000 Puketutu Rd upgrade $80,000 Studholme St Morrinsville upgrade $60,000 Waotu Rd Putaruru upgrade $70,000 Tahuna feeder 1 upgrade $65,000
Table 6.32: Major Tauranga Distribution Network Projects
Projects Project Cost Estimate ($)
Triton – new feeder on Totara St $250,000 Welcome Bay – two new feeders $250,000 Paengaroa – upgrade conductor or two new regulators $150,000 Oropi Rd – upgrade conductor $30,000 Millers Rd – upgrade conductor $85,000 Mayfield – 11kV link $100,000 Omokoroa – new feeder $300,000 Tauranga CBD – Elizabeth St $200,000
Table 6.33: Major Wairarapa Distribution Network Projects
Projects Project Cost Estimate ($)
Rebuild on Cologne St $65,000 Rebuild on Oxford St feeder $42,000 Rebuild on Taverner St feeder $52,000 Rebuild on Weriati feeder $65,000

Section 6
Subject Network Development and Lifecycle Asset Management Plan
Date Issued 30 June 2005
Page 110
Powerco Limited Asset Management Plan – Electricity Networks 2006 - 2020
Table 6.34: Major Wanganui Distribution Network Projects
Projects Project Cost Estimate ($)
Moawhango feeder rebuilds $400,000 Makirikiri feeder rebuilds $51,000 Mataroa feeder rebuilds $135,000 Leedstown feeder re conductor $105,000 Hunterville feeder rebuilds $165,000
6.12 Reticulation Planning Powerco has recently completed a review of its underground line design standard. This has
focussed on ensuring that underground MV, LV and streetlighting networks are designed in an
economic fashion and to ensure that contractors design and construct underground networks
to a good standard. Powerco is also undertaking a review of its line design standards from a
similar perspective. These reviews will affect the design of new work being installed on the
network.
6.13 Protection and Control System Development Plan
6.13.1 Protection Systems
Over the past few years Powerco had conducted a number of reviews and equipment
upgrades in the Eastern and Western regions to improve the reliability of its protection
systems. Similar reviews and upgrades will continue in conjunction with the planned network
developments.
The deterioration of the older electro-mechanical protection equipment begins to influence its
reliability after 25-30 years of service. In addition the older equipment is becoming technically
inferior as the variety of functions such as data acquisition and interrogation now provided by
newer systems are becoming standard features. The replacement program for aging
equipment is expected to continue over the next decade as many relays in this category are
now approaching or have exceeded their useful life.
The growth happening in Tauranga and the demand for faster fault clearance have put
considerable pressure on the existing older protection systems that were installed there many
years ago. The existing protection systems are becoming inappropriate or unreliable for their
intended applications. This has led to serious selectivity issues and resulted in several
unacceptable network outages. It is not possible to achieve acceptable protection grading with
much of the existing equipment and a replacement and upgrade programme has begun. The
upgrade, which is expected to complete in early 2006, will provide additional advantages in
the implementation of data acquisition and system interrogation functions.
In the Palmerston North district, the network has been constructed to allow multiple supplies to
various substations. This configuration coupled with the infeed from the Tararua windfarm
greatly improves the security of supply to the district. However the existing non-unit protection

Section 6
Subject Network Development and Lifecycle Asset Management Plan
Date Issued 30 June 2005
Page 111
Powerco Limited Asset Management Plan – Electricity Networks 2006 - 2020
systems installed in the district have not been designed to fully complement this and several
undesirable trippings have occurred. In order to address this deficiency the possibility of
introducing unit protection schemes to particular parts of the networks is being looked at.
Over the past two years Powerco has collated the protection configuration technical
information from all regions into a single reference database. This has enhanced the
management of this key engineering information. Data maintenance and upgrades of this
facility will continue.
Table 6.35 summarises scheduled major protection system work required to restore reliability,
sensitivity and selectivity to acceptable levels.
Table 6.35: Protection Development Plan
Financial Year Region Project Project Cost
Estimate ($) 2005 Wairarapa Akura – Te Ore Ore 33kV Ring protection upgrade $130,000 2006 Wairarapa Awatoitoi & Tinui Subs – 11kV incomer protection upgrade review $80,000 2005 Manawatu Mangamaire 33kV GXP protection upgrade $80,000 2006 Manawatu Keith St Sub – Implement bus differential protection upgrade $60,000 2005 Manawatu Rural substations – Implement protection review changes $30,000 2006 Manawatu Kairanga/ Pascal/ Linton – 33kV protection upgrade $260,000 2006 Taranaki Whareroa & Livingston subs – 33kV protection upgrade $80,000 2006 Taranaki Huirangi 33kV protection system review and setting changes $50,000 2007 Taranaki Replace cable differential schemes (Hawera – Cambria 33kV) $110,000
6.13.2 SCADA Systems
The SCADA system is required to provide real time system control and data acquisition with
24 hour, 7 day availability. SCADA system availability is monitored and managed by the
Network Operations Centre (NOC) in close cooperation with Powerco’s Information
Technology group for WAN performance issues. The WAN includes backup routes, which are
provided automatically in case a primary communication circuit fails. Each of the
communication hubs can act as a regional master station in the event of unrecoverable or
extended WAN failure or as part of a disaster recovery plan. Access to the SCADA for
software upgrades or configuration is by way of a permitting system under the control of the
NOC.
A review of the SCADA development plan is currently underway. As with most IT systems, the
evolution of SCADA products is rapid and ongoing but the systems are relatively easy to
upgrade. As a broad policy open architecture systems are adopted whenever possible with a
view to facilitating future development.
A number of zone-substation sites do not have SCADA facilities or they have very limited
facilities. Powerco plans to continue upgrading existing substation SCADA facilities and install
new SCADA facilities at substations where there are none. Table 6.3 and Table 6.3 outline the
development work planned for completion over the next three years.

Section 6
Subject Network Development and Lifecycle Asset Management Plan
Date Issued 30 June 2005
Page 112
Powerco Limited Asset Management Plan – Electricity Networks 2006 - 2020
Powerco has produced a communication asset management plan that reviews its
communication systems. It has been identified that communications paths between
operational regions is poor and regional communication networks require modernisation to
increase data transmission speeds and resilient voice communications.
To facilitate SCADA development within Powerco and to meet the need for a resilient voice
system communication transmission systems will be developed that will deliver inter area and
zone substation ethernet, serial and voice communications.
Communication transmission systems will be renewed and developed utilising digital radio,
fibre and copper transmission mediums to build an inter region high capacity backbone. This
will then enable digital cross-connect ability to zone substation level and provide valuable inter
area communications. The improved management, availability and control that can be seen
from a digital transmission system will enable Powerco to provide diverse routing and industry
standard communication protocols through out its operational network.
Table 6.36: Communication System Development
Financial Year Substation
Development Project
2004 - 2006 SCADA System Review/Upgrade communications – SCADA Master to Hubs 2004 - 2006 Zone subs. (All regions) Review/Upgrade communications – SCADA Hubs to Sub RTU’s 2004 - 2007 All regions Install microwave digital transmission systems linking Powerco satellite
depots improving communication back haul and implement a management system.
2004 – 2007 All regions Upgrade existing UHF analogue communication links to Digital transmission providing increased data capacity and manageability
2004 – 2007 All regions Review / upgrade VHF voice communication systems to improve availability and quality.
2004 - 2007 Zone subs. (All regions) Review / upgrade communications – To facilitate interrogation of modern relays.
2004 - 2007 Zone subs. (All regions) Install time-synchronisation facilities to substations with modern protection relay equipment
Note: The years given in the tables indicate the intended start year for each project. Some projects will be completed in a later year. Multiple years are given for long-term projects.
Table 6.37: SCADA and Automation Development
Financial Year Substation
Development Project
2002 - 2005 All regions Line fault locators and RTU’s / Communications 2002 - 2005 All regions Distribution switches remote control existing key switching points 2002 - 2005 All regions Line circuit breaker upgrades 2002 - 2005 All regions Line circuit breakers, install SCADA control to key line CB’s 2002 - 2005 All regions Upgrade zone sub RTU modules – SCADA development 2002 - 2005 All regions Review/Upgrade load control facilities
2005 Network Operations Centre
Upgrade SCADA master station to include open architecture and associated technology enhancements – SCADA development
2005 Kempton (Wairarapa) Upgrade SCADA RTU 2005 Clareville (Wairarapa) Upgrade SCADA RTU 2006 Norfolk (Wairarapa) Upgrade SCADA RTU 2006 Chapel Wairarapa) Upgrade SCADA RTU 2006 Gladstone (Wairarapa) Upgrade SCADA RTU 2006 Taihape (Wanganui) Upgrade SCADA RTU
Note: The years given in the tables indicate the intended start year for each project. Some projects will be completed in a later year. Multiple years are given for long-term projects.

Section 6
Subject Network Development and Lifecycle Asset Management Plan
Date Issued 30 June 2005
Page 113
Powerco Limited Asset Management Plan – Electricity Networks 2006 - 2020
6.13.3 Load Control Systems
Powerco is presently reviewing the levels of signal voltage across the network to ensure
correct and reliable operation of load control receivers. It has been identified that the
performance of the load control system has deteriorated over recent years since ownership of
the injection plants and the receivers was split. The split ownership has made cohesive and
sustainable management of the system difficult.
A load control development and lifecycle asset management plan is substantially complete.
The new plan includes a prioritised list of issues and indicates required capital investment
profile to address urgent and long-term issues. The application of the management plan will
require the co-operation of all stakeholders to ensure the sustainable operation of an effective
load management system.
It is possible that advances in technology may present the prospect of a commercially viable
two-way communication system across the reticulation network. Investigation of this
technology has been underway.
6.13.4 Metering System Instrument Transformers
Where the instrument transformers are used to provide inputs to power meters that are used
by energy companies to provide energy consumption data for reconciliation in the New
Zealand energy market, the transformers are required to meet the accuracy standards defined
in the Electricity Governance Regulations 2003, which have replaced the MARIA codes of
practice. All voltage transformers are rated to adequately supply metering and protection and
control equipment requirements.
The metering system development and lifecycle asset management plan has been
substantially completed. Issues identified by this review will be addressed on a case-by-case
basis. In general, the existing assets are considered to be capable of providing acceptable
levels of service.
6.14 Lifecycle Asset Plan (Maintenance and Renewal Plan)
6.14.1 Introduction
This section of the asset management plan describes how each type of asset will be condition
monitored, maintained and renewed. A life cycle plan has been prepared for each type of
asset. For the purposes of information disclosure a summary of the types of maintenance
performed for each general type of asset has been included.
This section provides an overview of the maintenance methodology and asset management
strategy, including renewal decision making and asset renewal summary.

Section 6
Subject Network Development and Lifecycle Asset Management Plan
Date Issued 30 June 2005
Page 114
Powerco Limited Asset Management Plan – Electricity Networks 2006 - 2020
6.14.2 Maintenance and Renewal Methodology
6.14.2.1 Determining Maintenance and Renewal Strategy
The objective of the maintenance and renewal planning process is to determine the most cost-
effective method for reducing the risk associated with the asset in achieving the required level
of service potential and management drivers for the network.
Risk management analysis is used to determine the type and effects of maintenance through:
• Identifying all hazards that present a risk to the asset performing its intended function;
• Conducting a failure mode and effects analysis (FMEA). In performing the FMEA, the
maintenance that can be performed to reduce or eliminate the consequences of the failure
is reviewed and the type of maintenance is selected; and,
• Determining the cost of the maintenance or renewal, cost of failure and selecting a
maintenance or renewal type that provides a positive NPV return.
Powerco’s maintenance and renewal policy is based on balancing the cost of inspections,
servicing and renewal, against the consequences of failure. Premature or too frequent
servicing and renewal unnecessarily increase maintenance costs, whilst servicing which is
delayed too long can increase the risk of failure and generally increase the servicing costs
overall. Age based maintenance and renewal provide a conservative approach and generally
result in unnecessarily high asset investment costs due to premature replacements. Where
maintenance is required it is best based on asset condition and duties.
Powerco’s maintenance work comprises the following elements:
• Routine inspections and condition monitoring;
• Routine servicing;
• Evaluation of inspection and condition monitoring results to determine any maintenance or
renewal requirements (this may be performed in the field at the time of
inspection/condition monitoring or later by engineering staff);
• Evaluating faults to predict maintenance or renewal requirements; and
• Performing maintenance or renewal as a result of the above.
6.14.2.2 Inspection And Condition Monitoring
Powerco has developed specific routine inspection requirements for each asset type. These
requirements are based on a combination of manufacturer’s recommendations, industry
practice and Powerco’s own experience. Powerco’s experience is based on asset type, duty,
incidence of faults and the operating environment.
Greater emphasis is being placed on non-invasive diagnostic testing wherever practical. This
work involves the adoption of new technology through the chemical analysis of transformer

Section 6
Subject Network Development and Lifecycle Asset Management Plan
Date Issued 30 June 2005
Page 115
Powerco Limited Asset Management Plan – Electricity Networks 2006 - 2020
and switch oils, the use of infrared cameras, ultra-sound discharge detection, partial discharge
and other techniques, as they become available. This is particularly true for zone substation
and distribution transformers at Kinleith. At Kinleith, all transformers above 500kVA or smaller
units of particular importance have oil samples taken at least every year for Dissolved Gas
Analysis. If previous tests indicate that a unit is deteriorating the sampling period is shortened.
Any units that show a deteriorating trend are either scheduled for a planned outage or have a
full Transformer Condition Assessment carried out.
Partial discharge monitoring of switchboards is carried out at two year intervals.
Cables, for which there is limited condition based testing available, have been built into a
priority list for replacement, based upon criticality, age and type.
In all cases, the frequency of the inspection and condition monitoring is based on the “lead
time to failure”. The “lead time to failure” (LTF) is the time between when the asset condition
begins to deteriorate to a point when it can be detected and the point of failure. Routine
inspection work is scheduled from the date of the last inspection to fall within the LTF.
Under Powerco’s defect and capital works partnership agreements (PAs), the contractor has a
responsibility to report defects observed while in the field. This defect information may be used
to initiate inspections or maintenance. Under the faults PA, the contractor may be requested to
perform a “line patrol” inspection during or immediately after a fault. This inspection is typically
documented and can constitute a visual inspection as mentioned in the maintenance plans.
The line patrol may also be used to initiate a documented inspection or another form of line
inspection.
6.14.2.3 Routine Servicing
Routine servicing is prescribed where condition-based monitoring is not practical or possible.
The application of these techniques is based on a combination of manufacturer’s
recommendations, industry practice and Powerco’s own experience. Routine servicing work is
generally scheduled from the date of the last service.
6.14.2.4 Evaluation of Condition Monitoring Results
The results of inspection and condition monitoring are analysed by specialist service providers
or by Powerco engineers. The type and extent of maintenance prescribed, or total asset
replacement, will be dependent on results.

Section 6
Subject Network Development and Lifecycle Asset Management Plan
Date Issued 30 June 2005
Page 116
Powerco Limited Asset Management Plan – Electricity Networks 2006 - 2020
6.14.2.5 Evaluation of Faults and Monitoring Reliability (Reliability Driven Maintenance)
In addition to routine servicing, Powerco undertakes Reliability Driven Maintenance and this is
achieved using the following techniques:
• Evaluation of the type of faults occurring in a particular area of the network or on a
particular type of equipment can provide information on how to prevent the faults from
recurring. Appropriate maintenance can then be applied to prevent or eliminate further
faults. The type of maintenance or renewal prescribed will depend on the type of failure
mode. The review of the types of faults typically occurs six-monthly over a two to three
year window in order to determine asset service levels and trends; and,
• Evaluation of individual feeder performance indices over a rolling two-year window.
Condition monitoring work will be initiated on feeders with poor reliability. The type of
condition monitoring and the resulting maintenance or renewal would be dependent on the
nature of the unreliability.
6.14.2.6 Performing the Maintenance
As a result of condition monitoring or fault analysis, maintenance may be required. The type of
maintenance performed will depend on the results of the investigation and evaluation. Where
the relationship between the condition monitoring and type of maintenance required is known
this is described in the maintenance plans that follow.
Where the condition monitoring indicates that an asset needs replacement or refurbishment,
this is typically scheduled to co-ordinate with other planned work in the area. In the case of
large customers, particularly Kinleith, work is programmed to coincide with plant maintenance
shutdowns.
6.14.2.7 Criteria for Asset Renewal
General criteria for asset replacement have been defined. For simple assets this may be
scheduled by age, on failure (i.e. expulsive fuses, surge arrestors). For large assets,
replacement is generally based on condition or reliability assessments.
6.14.3 Scheduling Maintenance and Renewal Activities
Applying the maintenance plans and renewal criteria to the available asset data derives the
schedules for maintenance and renewal of the network assets.
The renewal of major assets has been scheduled given their expected useful lives in the first
instance; however, this replacement may be deferred or brought forward depending on the
actual condition of the asset. There are also a number of other factors that can influence the
need for asset renewal and these are discussed for each general asset class in Section 6.13.5
below.

Section 6
Subject Network Development and Lifecycle Asset Management Plan
Date Issued 30 June 2005
Page 117
Powerco Limited Asset Management Plan – Electricity Networks 2006 - 2020
Complete maintenance schedules for all assets are prepared. For this plan, the types of
condition monitoring and maintenance have been extracted from the life-cycle plans and
summarised by general asset category. The scheduling and execution of distribution network
condition monitoring and maintenance is co-ordinated across the asset base to minimise cost
and avoid duplication of travelling. The detailed maintenance schedules are not included in
this plan.
6.14.4 Individual Asset Lifecycle Plans
Individual asset lifecycle plans have prepared for the following asset types:
• 33/11kV power transformers;
• 33kV isolators;
• 33kV circuit breakers;
• 33kV surge arrestors;
• 33kV protection relays;
• 33kV and 11kV busbars;
• 33kV subtransmission cables;
• 33kV instrument transformers;
• 33kV subtransmission lines;
• SCADA RTU outstations;
• SCADA master station;
• SCADA supply batteries and charging system;
• Zone substation supply batteries and charging system;
• Protection relays;
• Distribution voltage circuit breakers;
• Distribution voltage instrument transformers;
• Distribution voltage and 400V distribution lines;
• Distribution voltage regulators;
• Distribution voltage isolators;
• Distribution voltage surge arrestors;
• Distribution voltage expulsion fuses;
• Distribution voltage distribution cables;
• Distribution transformers;
• Distribution switchgear: ground mounted;
• Distribution voltage line reclosers;
• 400 V distribution boxes (pillars); and,

Section 6
Subject Network Development and Lifecycle Asset Management Plan
Date Issued 30 June 2005
Page 118
Powerco Limited Asset Management Plan – Electricity Networks 2006 - 2020
• Earthing systems.
6.14.4.1 Overhead Line Condition Monitoring and Maintenance Summary
The types of condition monitoring and maintenance carried out on overhead lines include:
• Visual inspection of pole, conductor, crossarm, insulators and ancillary equipment at
regular intervals;
• Non destructive testing of wooden poles;
• Infrared scans, and detailed inspections of fittings from bucket truck;
• RF inspection of insulators;
• Scheduled replacement of crossarms;
• Scheduled replacement of surge arrestors;
• Vegetation management;
• Earth testing;
• Specific maintenance is carried out as a result of condition monitoring or reliability
assessment; and,
• Verification of conductor phase to earth clearances
6.14.4.2 Underground Cable Network Condition Monitoring and Maintenance Summary
The types of condition monitoring and maintenance carried out on underground cables
include:
• Review of operating ratings to ensure that operating ratings are correct for various
operating conditions. This can be achieved by distributed temperature sensing devices on
some recently installed subtransmission cables;
• Visual survey of subtransmission cable routes for possible damage points;
• VLF AC insulation tests on XLPE subtransmission cables;
• Oil pressure monitoring;
• DC Insulation resistance tests on PILC cables;
• Sheath-to-earth insulation resistance tests on subtransmission cables, as appropriate;
• Visual, infrared and RF inspection of terminations, as applicable;
• Visual inspection of link and pillar boxes;
• On-line partial discharge testing of subtransmission cables; and,
• Specific maintenance is carried out as a result of condition monitoring or reliability
assessment.

Section 6
Subject Network Development and Lifecycle Asset Management Plan
Date Issued 30 June 2005
Page 119
Powerco Limited Asset Management Plan – Electricity Networks 2006 - 2020
6.14.4.3 Distribution Transformer Condition Monitoring and Maintenance Summary
The types of conditions monitoring and maintenance carried out on distribution transformers
include:
• Inspect transformer tank & general fittings;
• Oil testing (acidity, dielectric strength & moisture tests performed on transformers
>100kVA at prescribed intervals unless the transformer is completely sealed);
• Check and change breathers;
• Earth testing;
• Specific maintenance is carried out as a result of condition monitoring or reliability
assessment; and,
• The transformer will be refurbished if physical and economic criteria are met.
6.14.4.4 Distribution Switchgear Condition Monitoring and Maintenance Summary
The types of conditions monitoring and maintenance carried out on distribution switchgear
include:
• Visual inspection;
• Operating tests & mechanism servicing;
• Review of recloser and sectionaliser protection settings;
• Clean & re-seal external surfaces on cast resin type switchgear;
• Partial discharge testing on ground mounted switchgear;
• Ultra-sonic checks for dry type cable termination deterioration in ground mounted
switchgear;
• Close-in inspection, infrared scans, adjustment and lubrication of isolators;
• Earth testing;
• Oil condition testing;
• Specific maintenance is carried out as a result of condition monitoring or reliability
assessment; and,
• The switchgear will be refurbished if operational, physical and economic criteria are met.
6.14.4.5 Zone Substation Condition Monitoring and Maintenance Summary
The types of conditions monitoring and maintenance performed on zone substation equipment
include:
(a) Power Transformers and Tapchangers;
• Visual inspection for mechanical deterioration and damage;
• Tapchanger contact & mechanism maintenance;

Section 6
Subject Network Development and Lifecycle Asset Management Plan
Date Issued 30 June 2005
Page 120
Powerco Limited Asset Management Plan – Electricity Networks 2006 - 2020
• Dehydrating breather maintenance;
• General operating tests and maintenance;
• Oil Tests (degree of polymerisation, dielectric strength, moisture, acidity);
• Insulation resistance/polarisation tests; and,
• Infra-red scans.
(b) Circuit Breakers and Switchboards:
• Visual inspection for mechanical wear, damage and serviceability;
• General operational tests and maintenance - monitor operational performance;
• High voltage test;
• DC Insulation Test;
• Contact resistance test;
• Partial discharge condition monitoring;
• Fault & disturbance relay timing/pickup tests;
• Protection setting review to ensure that the equipment being protected will be adequately
served by the relay settings;
• Protection setting verification on-site; and,
• Protection system primary injection and secondary injection tests.
(c) Inspection and testing is also conducted on ancillary items at zone substations, including:
• Instrument transformers;
• Isolators;
• Buswork & surge arrestors;
• Batteries and charger;
• Buildings, fences and enclosures;
• SCADA I/O integrity testing between input and master-station;
• Communication system;
• Earthing system; and,
• LVAC supply.
6.14.5 Frequencies of Inspections and Maintenance Activities
The frequencies of inspections and maintenance regimes are described in detail in Powerco’s
Asset Life Cycle Plan.
Circuit Inspection frequencies vary depending upon the criticality of the circuit. Highly critical
circuits are inspected at 2 1/2 yearly intervals while less critical circuits are inspected at 5
yearly intervals. Spur lines may be inspected at 10 yearly intervals.

Section 6
Subject Network Development and Lifecycle Asset Management Plan
Date Issued 30 June 2005
Page 121
Powerco Limited Asset Management Plan – Electricity Networks 2006 - 2020
Zone substation equipment receives a 3-month visual inspection with special inspections and
maintenance generally being carried out on 6 month, 1 yearly 2 yearly and 4 yearly intervals.
Ground mounted distribution switchgear is inspected on 2 yearly cycles. Ground mounted
transformers receive a 6 monthly and 5 yearly inspection.
6.14.6 Review of Asset Lifecycle Plans
Each of the Asset Life Cycle Plans are being reviewed to take account of the practices
included in the Contract Field Service Agreements with Powerco Energy Services and
Energex in the Eastern Region. Asset Life Cycle Plans reviewed first included zone substation
transformers, subtransmission lines, earthing and wood pole testing. Emphasis is placed on
assessing risk profiles for all situations. The standards consider greater use of condition
monitoring as a criterion for undertaking transformer, switchgear and pole maintenance.
Asset Lifecycle Plans will also be reviewed as legislation changes.
6.14.7 Asset Renewal Plans
The following figures show the replacement profiles of different asset categories in
replacement cost terms. Forecast asset renewal expenditures are presented in Section 6.15.2
but these figures demonstrate trends in expected asset renewal expenditures over time. The
graphs indicate replacement costs and a 9-year moving average.
Budgeted asset renewal expenditures can be somewhat different from expenditures estimated
from age profiles alone. Actual asset renewals are generally driven by their condition rather
than their age. Other criteria for replacing equipment include availability of spares, particularly
in the case of switchgear and load control injection equipment; standardisation and changes in
technology, which can arise in SCADA equipment; latent defects and the present value costs
of ongoing maintenance.
The asset renewal expenditures are based on ODV unit replacement costs. The age profiles
may understate actual renewal expenditure needs because some asset categories have been
excluded (pillars and service connections) and because allowances for urban areas, difficult
terrain or ground conditions have not been made. In addition, many renewal works are
necessarily performed on a piecemeal basis rather than on the mass scale basis that the ODV
Handbook considers. Some assets may not be able to reach their standard maximum lives
due to third-party damage, road realignments, overhead line to underground conversions,
higher asset degradation rates than expected or historically deferred maintenance.

Section 6
Subject Network Development and Lifecycle Asset Management Plan
Date Issued 30 June 2005
Page 122
Powerco Limited Asset Management Plan – Electricity Networks 2006 - 2020
The asset replacement profiles have been updated over those presented in the July 2004
AMP due to updated age and condition information being available. The asset replacement
profiles are in real 2004 dollars.
6.14.7.1 Total Network Asset Replacement Profile
Total Network Asset Replacement Profile
$0
$10,000
$20,000
$30,000
$40,000
$50,000
$60,000
$70,000
2006
2007
2008
2009
2010
2011
2012
2013
2014
2015
2016
2017
2018
2019
2020
Year of Replacement
Rep
lace
men
t C
ost
($0
00)
Replacement Costs 9yr Average
Figure 6.2: Total Network Asset Replacement Profile
Figure 6.2 shows that renewal expenditure over the next 5 years should be above $10 million,
and renewal expenditures will need to increase over coming years. The large bar in FY2006
represents equipment past its design life. The bar at FY2012 represents switchgear of
unknown age, which was assigned to this year.

Section 6
Subject Network Development and Lifecycle Asset Management Plan
Date Issued 30 June 2005
Page 123
Powerco Limited Asset Management Plan – Electricity Networks 2006 - 2020
6.14.7.2 Overhead Line Replacement Profile
Overhead Line Replacement Profile
$0
$2,000
$4,000
$6,000
$8,000
$10,000
$12,000
$14,000
2006
2007
2008
2009
2010
2011
2012
2013
2014
2015
2016
2017
2018
2019
2020
Year of Replacement
Rep
lace
men
t C
ost
($0
00)
Overhead Line Replacement Cost
9yr Average
Figure 6.3: Overhead Line Replacement Profile
These graphs show a steady amount of pole asset replacement cost each year. There are
several areas where poles may need replacement before the standard life due to
unsatisfactory materials or manufacture. These include part of the Tauranga network, which
was constructed using poles with top-load strength not clearly established, and some of the
south Taranaki area, where some concrete poles were manufactured using salt contaminated
sea sand.
Snow storms are the past 3-4 years in the Taihape and Northern Manawatu region have
severely stressed some aging assets. A significant renewal program has been initiated for
this region.
Condition monitoring shows that most lines are in the condition expected for their age,
although some in harsh coastal areas have deteriorated more quickly than expected. Steel
core corrosion in ASCR conductors is proving to be a problem in coastal areas. Some copper
conductors have become work hardened due to load cycling and age.

Section 6
Subject Network Development and Lifecycle Asset Management Plan
Date Issued 30 June 2005
Page 124
Powerco Limited Asset Management Plan – Electricity Networks 2006 - 2020
6.14.7.3 Underground Cable Replacement Profile
Underground Cable Replacement Profile
$0
$500
$1,000
$1,500
$2,000
$2,500
$3,000
$3,500
$4,000
2006
2007
2008
2009
2010
2011
2012
2013
2014
2015
2016
2017
2018
2019
2020
Year of Replacement
Rep
lace
men
t C
ost
($0
00)
Underground Cable Replacement Cost
9yr Average
Figure 6.4: Underground Cable Replacement Profile
Whilst the amount of underground cable requiring replacement due to age is expected to
increase steadily, there are several instances where cables need to be replaced before the
end of their standard economic life. These include:
• In Tauranga, where large scale development is taking place, existing 25 sq mm and 35 sq
mm cables need to be replaced by 185 sq mm or 300 sq mm cables for capacity reasons.
This is effectively small cable retired early.
• 33kV cables supplying City Substation in New Plymouth are prone to failure due to water
treeing;
• Some early XLPE type distribution cables, particularly in the Tauranga area, also suffer
from water treeing and are prone to failure;
• Unplanned defect replacement as a result of third-party excavations;
• Route realignment for Transit and others;
• Consumer requirements;
• Link box and underground tee replacement (safety and reliability);
• Replacement due to repositioning of other assets (e.g.: distribution substations); and,
• Land subsidence, requiring the moving of cables to a secure area.
These items are planned in concept in the five year Medium Term Development Plan, but
detailed planning does not usually occur until the year preceding the work, and is generally
based on some form of condition/performance assessments. In particular, work to meet

Section 6
Subject Network Development and Lifecycle Asset Management Plan
Date Issued 30 June 2005
Page 125
Powerco Limited Asset Management Plan – Electricity Networks 2006 - 2020
consumer requirements can sometimes be required at short notice. The expenditure forecast
given in paragraph 6.15.3 reflects these factors.
6.14.7.4 Distribution Transformer Replacement Profile
Distribution Transformer Replacement Profile
$0
$500
$1,000
$1,500
$2,000
$2,500
$3,000
$3,500
$4,000
$4,50020
06
2007
2008
2009
2010
2011
2012
2013
2014
2015
2016
2017
2018
2019
2020
Year of Replacement
Rep
lace
men
t C
ost
($0
00)
Distribution Transformer ReplacementCosts
9yr Average
Figure 6.5: Distribution Transformer Replacement Profile
Figure 6.5 indicates that distribution transformer replacement costs are set to increase
steadily. This is because of rapid network development in the past resulting in year by year
increases in equipment being installed. This aging profile is thought to be slightly pessimistic
however, as the load cycles of some distribution transformers result in them lasting longer
than their standard lives.
There are some instances where distribution transformers need to be replaced before their
standard life. Examples of this include:
• Replacement due to capacity change, where the age of the changed transformer makes
its reuse uneconomic.
• Asset replacement due to actual condition;
• Unplanned defect repairs as a result of third-party damage;
• Overhead transformer to pad mount conversions due to seismic strength;
• Overhead line to underground conversions; and,
• Severe corrosion in harsh coastal environments.
The expenditure forecast given in paragraph 6.15.3 reflects these factors.
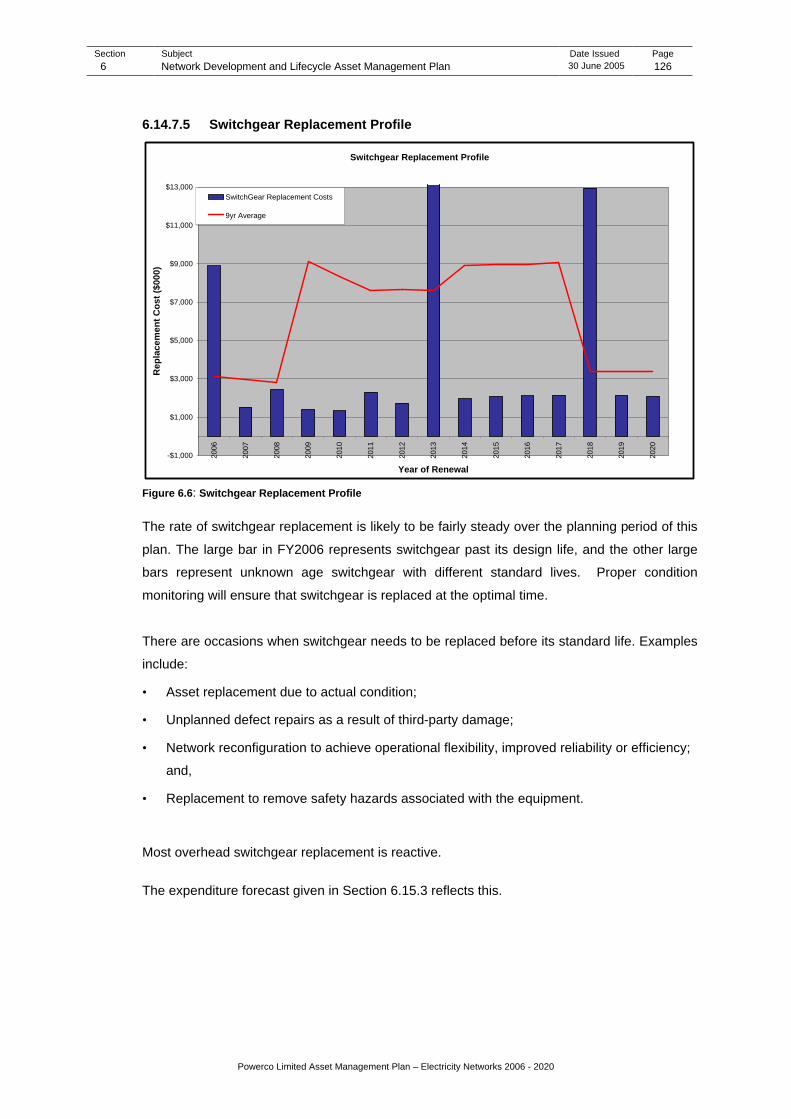
Section 6
Subject Network Development and Lifecycle Asset Management Plan
Date Issued 30 June 2005
Page 126
Powerco Limited Asset Management Plan – Electricity Networks 2006 - 2020
6.14.7.5 Switchgear Replacement Profile
Switchgear Replacement Profile
-$1,000
$1,000
$3,000
$5,000
$7,000
$9,000
$11,000
$13,000
2006
2007
2008
2009
2010
2011
2012
2013
2014
2015
2016
2017
2018
2019
2020
Year of Renewal
Rep
lace
men
t C
ost
($0
00)
SwitchGear Replacement Costs
9yr Average
Figure 6.6: Switchgear Replacement Profile
The rate of switchgear replacement is likely to be fairly steady over the planning period of this
plan. The large bar in FY2006 represents switchgear past its design life, and the other large
bars represent unknown age switchgear with different standard lives. Proper condition
monitoring will ensure that switchgear is replaced at the optimal time.
There are occasions when switchgear needs to be replaced before its standard life. Examples
include:
• Asset replacement due to actual condition;
• Unplanned defect repairs as a result of third-party damage;
• Network reconfiguration to achieve operational flexibility, improved reliability or efficiency;
and,
• Replacement to remove safety hazards associated with the equipment.
Most overhead switchgear replacement is reactive.
The expenditure forecast given in Section 6.15.3 reflects this.

Section 6
Subject Network Development and Lifecycle Asset Management Plan
Date Issued 30 June 2005
Page 127
Powerco Limited Asset Management Plan – Electricity Networks 2006 - 2020
6.14.7.6 Zone Substation Replacement Profile
Zone Substation Replacement Profile
$0
$2,000
$4,000
$6,000
$8,000
$10,000
$12,000
$14,000
$16,000
$18,000
2006
2007
2008
2009
2010
2011
2012
2013
2014
2015
2016
2017
2018
2019
2020
Year of Replacement
Rep
lace
men
t C
ost
($0
00)
Substation Replacement Costs
9yr Average
Figure 6.7: Zone Substation Replacement Profile
Figure 6.7 shows a large amount of equipment due for replacement in 2006. Most of this is
load control equipment which is beyond its standard design life, and plans for its replacement
are set out in Powerco’s Load Control Asset Management Plan. Note that the replacement
cost on this graph assumes that like is replaced with like, while more cost effective
arrangements are planned in many cases.
Zone substation equipment undergoes regular condition monitoring, and is replaced when its
condition indicates that replacement is advisable. The figure indicates significant variation in
replacement cost from year to year, and some replacement will have to be advanced or
deferred to smooth out the capital requirement and workload.
There is a small amount of over-age zone substation equipment on the network
Assets sometimes need to be replaced before their standard life. Reasons for this include:
• Asset replacement due to actual condition;
• Reliability issues, including spares and ability to service;
• Replacement due to operational constraint or safety issues;
• Insulator/structure replacement in heavy pollution areas;
• Replace/reposition zone substation due to load changes;
• Protection discrimination and control issues. Replacing equipment no longer capable of
required discrimination; and,

Section 6
Subject Network Development and Lifecycle Asset Management Plan
Date Issued 30 June 2005
Page 128
Powerco Limited Asset Management Plan – Electricity Networks 2006 - 2020
• Environmental compliance issues.
The major upcoming renewal work for the zone substation assets is summarised in Table 6.38
to Table 6.43. It should be noted that the majority of subtransmission replacements involve
upgrading rather than like with like replacement, and they are included in this plan as
development projects.
Table 6.38: List of Major Subtransmission Renewal Work - Manawatu
Year Substation Proposed Work 2006 Bunnythorpe Replace three 33kV circuit breakers 2006 Kimbolton Replace 11 kV switchboard 2007 Main St Replace 33 kV switchboard 2008 Bunnythorpe Replace two 33 kV circuit breakers 2010 Bunnythorpe Replace two 33 kV circuit breakers
Table 6.39: List of Major Subtransmission Renewal Work - Taranaki
Year Substation Proposed Work 2006-07 City Replace 33kV cables
2007 Whareroa Establish replacement zone substation on new site
2007 Livingstone Replace 11kV switchboard 2008 Waihapa Replace transformer T7
Table 6.40: List of Major Subtransmission Renewal Work - Tauranga
Year Substation Proposed Work None - All planned replacements involve upgrading,
and are included in this plan as development projects
Table 6.41: List of Major Subtransmission Renewal Work - Valley
1.28 Substation Proposed Work 2006 Piako Replace 33kV Circuit Breaker 2007 Paeroa Replace transformers
Table 6.42: List of Major Subtransmission Renewal Work - Wairarapa
Year Substation Proposed Work 2006 Akura Zone Transformers refurbish 2007 Awatoitoi Zone Transformer refurbish 2008 Martinborough Zone Transformer refurbish
Table 6.43: List of Major Subtransmission Renewal Work - Wanganui
Year Substation Proposed Work 2007 Taihape Substation refurbish
6.15 Statutory Compliance Powerco’s Asset Management is governed to a significant extent by legislation. The impact of
new and existing legislation on Powerco’s network is reviewed regularly. The pieces of
legislation which currently have the largest impact on Powerco’s asset management are the
Resource Management Act 1991, the Electricity Act 1992, the Hazardous Substances and
New Organisms Act 1996, the Electricity Regulations 1997, and the Electricity Governance
Regulations 2003. Whilst Powerco is targeting many areas for compliance, particular focus is
on:
• Rolling reviews of oil containment facilities at zone substations;

Section 6
Subject Network Development and Lifecycle Asset Management Plan
Date Issued 30 June 2005
Page 129
Powerco Limited Asset Management Plan – Electricity Networks 2006 - 2020
• Rolling reviews of seismic stability at zone substations;
• Preparation of an environmental management plan and environmental risk audit;
• Vegetation Management. Changes in legislation affecting tree trimming mean that tree
trimming costs is increasing by a significant amount;
• Review of means of compliance with Government Distributed Generation Regulations
(when issued);
• Recording of new 230/400V cable locations between service pillars and customers’
boundaries (focusing on Tauranga);
• Knowledge of service providers with the Hazardous Substances and New Organisms Act
1996;
• Requiring Authority applications for Electricity and Gas: and,
• Gaining all necessary radio licences needed to operate the radio network.
6.16 Development, Renewal and Maintenance Expenditure Forecasts
6.16.1 Introduction
The network expenditure forecasts describe the development, renewal and maintenance work
required to:
• Maintain the level of service performance for the assets;
• Develop the assets to meet the new and future load growth; and,
• Improve and enhance the service performance where the service standards are not being
met.
The expenditure has been categorised into three categories:
• Development (includes enhancement and extensions): Capital expenditure on new
assets, or expenditure that materially changes the service potential and performance of
the existing assets;
• Renewal: Capital expenditure on the replacement of existing assets that maintains the
original level of service performance and extends the economic life of the network. That is,
replacement of like with like; and,
• Operating and maintenance: Operational expenditure that is required to operate or
maintain the assets to achieve their original design economic lives and service potentials.
The network operating costs include utility rating costs, site leases, site service charges,
network insurance, charter payments and other like costs. The summary forecasts do not
include direct Asset Management Group costs.
In all cases, the expenditure forecasts for FY2006 and FY2007 have been based on detailed
planning and assessment of the assets. The forecasts in the mid to later years have been set

Section 6
Subject Network Development and Lifecycle Asset Management Plan
Date Issued 30 June 2005
Page 130
Powerco Limited Asset Management Plan – Electricity Networks 2006 - 2020
given the general application of the planning criteria and load growth projections to the
network, and broad projections of asset condition based renewal and maintenance needs.
6.16.2 Expenditure Forecasts
The asset management expenditure forecasts are given in Table 6.44 to Table 6.48. The
forecasts are separated by expenditure type and asset type. In the Tables, the category of
Other Assets includes costs associated with metering assets, vegetation control, field
operation for network projects and underground cable location. Note that all values are
nominal, assuming a 2.0% CPI.
Table 6.44: Expenditure Summary Forecast
Expenditure 2006 2007 2008 2009 2010 Capital Expenditure 44,633,895 44,824,472 46,220,362 47,694,455 49,393,632 Operations & Maintenance 21,330,971 22,147,504 22,995,350 23,875,713 24,789,842 Total 65,964,866 66,971,975 69,215,712 71,570,168 74,183,473
Expenditure 2011 2012 2013 2014 2015 Capital Expenditure 52,663,929 55,342,375 58,301,767 61,585,962 65,246,972 Operations & Maintenance 25,523,441 26,278,817 27,056,618 27,857,512 28,682,186 Total 78,187,370 81,621,192 85,358,386 89,443,474 93,929,158
Table 6.45: Total Expenditure Forecast
Asset Class 2006 2007 2008 2009 2010 OH Lines 16,300,479 16,918,716 17,535,504 18,181,581 18,881,904 UG Lines 13,439,655 12,716,830 13,050,408 13,400,691 13,830,039 Dist Transformers 8,456,168 8,750,307 9,196,612 9,679,867 10,228,877 Dist Switchgear 5,936,158 6,098,690 6,268,994 6,444,571 6,633,406 Zone Sub Equipment 13,173,851 13,495,025 13,824,797 14,163,420 14,534,379 Other Assets 6,162,206 6,389,260 6,624,880 6,869,388 7,123,117 Network Operating 2,496,348 2,603,148 2,714,516 2,830,650 2,951,752 Total 65,964,866 66,971,975 69,215,712 71,570,168 74,183,473
Asset Class 2011 2012 2013 2014 2015 OH Lines 19,898,179 20,852,423 21,868,042 22,949,699 24,102,431 UG Lines 14,927,644 15,551,610 16,228,315 16,964,104 17,766,152 Dist Transformers 10,633,110 10,850,333 11,072,196 11,298,805 11,530,265 Dist Switchgear 7,241,195 7,956,550 8,808,171 9,825,870 11,046,098 Zone Sub Equipment 15,122,204 15,746,649 16,410,777 17,117,938 17,871,798 Other Assets 7,339,198 7,561,839 7,791,239 8,027,605 8,271,148 Network Operating 3,025,841 3,101,789 3,179,644 3,259,453 3,341,266 Total 78,187,370 81,621,192 85,358,386 89,443,474 93,929,158
Table 6.46: Development Expenditure Forecast
Asset Class 2006 2007 2008 2009 2010 OH Lines 5,086,505 5,102,943 5,194,720 5,288,211 5,406,584 UG Lines 9,856,316 9,680,491 9,829,142 9,980,236 10,194,757 Dist Transformers 4,492,869 4,445,547 4,517,921 4,591,548 4,691,682 Dist Switchgear 2,330,483 2,374,000 2,421,107 2,469,152 2,525,961 Zone Sub Equipment 7,151,144 7,294,167 7,440,050 7,588,851 7,763,850 Total 28,917,317 28,897,147 29,402,940 29,917,998 30,582,835
Asset Class 2011 2012 2013 2014 2015 OH Lines 5,649,095 5,775,274 5,904,281 6,036,180 6,171,035 UG Lines 10,945,095 11,179,610 11,419,174 11,663,898 11,913,894 Dist Transformers 4,989,391 5,097,870 5,208,719 5,321,990 5,437,736 Dist Switchgear 2,588,483 2,648,025 2,708,937 2,771,251 2,834,998 Zone Sub Equipment 7,942,885 8,126,048 8,313,434 8,505,142 8,701,271 Total 32,114,949 32,826,826 33,554,545 34,298,461 35,058,933

Section 6
Subject Network Development and Lifecycle Asset Management Plan
Date Issued 30 June 2005
Page 131
Powerco Limited Asset Management Plan – Electricity Networks 2006 - 2020
Table 6.47: Renewal Expenditure Forecast
Asset Class 2006 2007 2008 2009 2010 OH Lines 5,436,616 5,820,710 6,119,813 6,437,978 6,776,674 UG Lines 2,431,358 1,840,949 1,980,831 2,133,277 2,299,600 Dist Transformers 2,988,038 3,292,749 3,628,545 3,998,601 4,406,413 Dist Switchgear 1,944,040 2,000,441 2,058,664 2,118,773 2,180,836 Zone Sub Equipment 2,759,725 2,814,919 2,871,218 2,928,642 2,987,215 Other Assets 156,801 157,557 158,352 159,185 160,059 Total 15,716,578 15,927,325 16,817,422 17,776,457 18,810,796
Asset Class 2011 2012 2013 2014 2015 OH Lines 7,348,139 7,967,795 8,639,705 9,368,276 10,158,287 UG Lines 2,606,529 2,954,425 3,348,755 3,795,716 4,302,333 Dist Transformers 4,478,788 4,552,351 4,627,123 4,703,122 4,780,370 Dist Switchgear 2,667,919 3,263,792 3,992,750 4,884,519 5,975,463 Zone Sub Equipment 3,281,750 3,605,326 3,960,806 4,351,335 4,780,370 Other Assets 165,855 171,860 178,084 184,533 191,215 Total 20,548,980 22,515,549 24,747,222 27,287,502 30,188,038
Table 6.48: Operating & Maintenance Expenditure Forecast
Asset Class 2006 2007 2008 2009 2010 OH Lines 5,777,358 5,995,063 6,220,971 6,455,392 6,698,646 UG Lines 1,151,981 1,195,390 1,240,435 1,287,178 1,335,682 Dist Transformers 975,261 1,012,011 1,050,146 1,089,718 1,130,781 Dist Switchgear 1,661,636 1,724,250 1,789,224 1,856,646 1,926,609 Zone Sub Equipment 3,262,981 3,385,938 3,513,528 3,645,926 3,783,313 Other Assets 6,005,406 6,231,703 6,466,529 6,710,203 6,963,059 Network Operating 2,496,348 2,603,148 2,714,516 2,830,650 2,951,752 Total 21,330,971 22,147,504 22,995,350 23,875,713 24,789,842
Asset Class 2011 2012 2013 2014 2015
OH Lines 6,900,945 7,109,354 7,324,056 7,545,243 7,773,109 UG Lines 1,376,019 1,417,575 1,460,386 1,504,490 1,549,925 Dist Transformers 1,164,931 1,200,112 1,236,355 1,273,693 1,312,159 Dist Switchgear 1,984,792 2,044,733 2,106,484 2,170,100 2,235,637 Zone Sub Equipment 3,897,569 4,015,276 4,136,537 4,261,461 4,390,157 Other Assets 7,173,343 7,389,978 7,613,155 7,843,073 8,079,934 Network Operating 3,025,841 3,101,789 3,179,644 3,259,453 3,341,266 Total 25,523,441 26,278,817 27,056,618 27,857,512 28,682,186
6.16.3 Summary of Changes from Previous Forecasts
The key changes to the expenditure forecasts over those presented in the July 2004 AMP are:
• Revision of renewal expenditure between FY2010 and FY2015 to better reflect the
condition and age profile;
• Eastern Region Customer Initiated Work expenditures remain at similar levels throughout
the planning period to reflect a rapid growth scenario that is forecast to be long term rather
than short lived;
• Reduction of allowance for utility rates (network operating);
• Alignment of maintenance expenditure to Powerco’s revised maintenance standards and
schedules;
• Real operational expenditures increase after FY2010 because of the need to carry out
more maintenance on the aging asset base; and,

Section 6
Subject Network Development and Lifecycle Asset Management Plan
Date Issued 30 June 2005
Page 132
Powerco Limited Asset Management Plan – Electricity Networks 2006 - 2020
• The expenditure forecasts were indexed by CPI (2.7%) over the July 2004 AMP.
6.16.4 Development Expenditure Forecast
Development expenditure relates to development or enhancement of the network. The need to
undertake development work is based on:
• Growth in network load requiring an increase in network capacity;
• Network security (and reliability) are below the standard; and,
• Expansion of the network to connect new consumers.
6.16.5 Renewal Expenditure Forecast
Renewal expenditure generally relates to the replacement of existing assets where these
assets have been identified as being at the end of their economic life, based on their assessed
condition. As the asset replacement decision is based on the most recent condition
assessment the expenditure forecasts in the mid to later years need to be taken as a general
guide only.
The forecast renewal expenditure for some asset types exceeds projected renewal
expenditure based on original economic life and age. In many instances assets need to be
replaced in advance of their original economic life and examples of this include:
• The original economic life of the asset not being accurate due to the asset design,
material selection and environmental conditions;
• Network reconfiguration to achieve operational flexibility, improved reliability or efficiency;
• Unplanned defect repairs, including third-party damage;
• Line/cable route realignment as a result of third-party requests;
• Overhead line to underground conversion;
• Replacement due to operational constraint or safety issues;
• Replace/reposition zone substation due to large consumer requirement change;
• Protection discrimination and control issues. Replacing equipment no longer capable of
required discrimination; and,
• Environmental compliance issues.
6.16.6 Operating and Maintenance Expenditure Forecast
The operating and maintenance expenditure forecast has been set based on the asset
maintenance plans developed using the maintenance strategy and Powerco’s present
operating practices. In general terms maintenance is required to maintain the asset’s service
performance or is necessary for the assets to achieve their intended service potential.
Maintenance expenditure has been forecast based on present work levels, after adjustments
have been made to allow for increased Service Provider efficiency (downwards) and growth in

Section 6
Subject Network Development and Lifecycle Asset Management Plan
Date Issued 30 June 2005
Page 133
Powerco Limited Asset Management Plan – Electricity Networks 2006 - 2020
system length and ODV (upwards). No allowance for increases in utility rates has been
included.
Powerco’s maintenance work comprises the following:
• Routine condition monitoring;
• Routine servicing;
• Evaluation of inspection and condition monitoring results to determine any maintenance
requirements;
• Evaluating faults to predict condition monitoring and maintenance requirements;
• Performing maintenance repairs and refurbishment as a result of (c) and (d) above;
• Fault repair; and,
• Network operating.
6.17 Network Service Provision Activities
6.17.1 Introduction
Powerco Asset Management Group outsources all construction and maintenance activities.
6.17.2 Powerco Outsourcing Policy Overview
6.17.2.1 Powerco Service Provision Policy Overview
Powerco has developed a service provision strategy to set the long-term direction for the
management of construction and maintenance activities in line with its business model and
corporate objectives.
The service provision strategy was revised during 2004 and the updated strategy is given
below. The strategy was reviewed giving consideration to:
• Powerco’s corporate business drivers;
• The current capabilities, strengths and weaknesses of the service provision market;
• The needs of the Service Providers; and,
• The capabilities of the Asset Management Group in managing the outsourcing of
construction and maintenance activities.
Powerco shall utilise Service Providers and competitive market principles to deliver
sustainable improvements in the cost, quality and safety of construction and maintenance
services on the electricity and gas networks. This includes:
a) Facilitating Service Provider resources with expertise matched to the work requirement in
the locations required;

Section 6
Subject Network Development and Lifecycle Asset Management Plan
Date Issued 30 June 2005
Page 134
Powerco Limited Asset Management Plan – Electricity Networks 2006 - 2020
b) Maximising the Service Provider’s control over the inputs to its services to allow it to meet
the service performance level;
c) Utilising competitive tension to encourage continuous improvement in the cost of the
delivered service;
d) Minimising the level of management of Service Providers while ensuring appropriate
control is maintained to deliver the desired service outcome;
e) Maintaining an acceptable level of safety performance by Service Providers; and,
f) Fairly allocate risk between Powerco and the Service Provider.
A series of guiding principles were then developed to provide greater detail on how the Asset
Management Group can achieve the service provision strategy and hence support the
corporate objectives. The service provision principles cover:
• Facilitation of resources to meet Powerco’s needs;
• Delegation of responsibility to Service Providers;
• Utilising competitive tension to improve productivity and innovate;
• Optimising the level of Service Provider management; and,
• Allocation, communication and recognition of risk.
The service provision principles describe the use of long-term alliance style contracts with
Service Providers. It is considered that an alliance style contract is the most appropriate
commercial arrangement for Powerco to adopt with its Service Providers for core construction
and maintenance activities. The principles of this style of contract satisfy the service provision
objectives. The alliance style contract is well matched to the level of maturity of the Asset
Management Group and Service Providers. However, as the level of maturity increases on
Powerco’s present contracts, adopting a pure alliance model could be considered in the future
as a “Pure” Alliance has been shown to maximise the economic benefit obtainable form a
long-term contractual relationship.
6.17.3 Western Region Alliance Style Agreement and Contracts
One significant alliance style agreement exists between the Powerco Asset Management
Group and Powerco Energy Services Limited for provision of construction and maintenance
services in the Western region. The scope of this partnership includes the following general
work types:
• Fault and defect repair;
• Zone substation maintenance;
• Major ground level distribution substations and HV Switchgear maintenance;
• Detailed design for general line construction;
• Construction, maintenance, inspection and condition monitoring work for the
subtransmission and distribution network;

Section 6
Subject Network Development and Lifecycle Asset Management Plan
Date Issued 30 June 2005
Page 135
Powerco Limited Asset Management Plan – Electricity Networks 2006 - 2020
• Zone substation development work;
• Distribution network condition monitoring and maintenance; and,
• Construction work for the subtransmission and distribution network
The quantity of work selected and issued under the alliance agreement is set at a minimum
level to support the quantity and location of resources to deliver fault and defect response
services. Major projects, typically greater than $500,000, specialist technical services and
vegetation management are performed by other Service Providers.
Typically this work is performed under either lump sum or measure and value contracts. In
addition other work types are outsourced for benchmarking purposes.
Powerco also has agreements for the purchase of some types of equipment, such as
distribution transformers.
6.17.4 Eastern Region Alliance Style Agreements
Powerco has Contract Field Services Agreements (CFSA) with Powerco Energy Services
Limited and Energex for provision of construction and maintenance services in the Eastern
region. These two agreements are structured similarly to each other.
Generally the CFSAs require the Service Provider to provide the following services:
• Fault and defect repair;
• Zone substation maintenance;
• Major ground level distribution substations and HV Switchgear maintenance;
• Detailed design for general line construction;
• Construction, maintenance, inspection and condition monitoring work for the
subtransmission and distribution network;
• Zone substation development work;
• Distribution network condition monitoring and maintenance; and,
• Construction work for the subtransmission and distribution network
Apart from major project work and some non-exclusive services outlined in the contracts, the
services mentioned above are exclusive to the Service Provider
6.17.5 Customer Initiated Work
Customer imitated work, which is typically the extension of the network to connect new
consumers or the reticulation of new subdivision, is performed by a number of approved
Service Providers. There is active market across Powerco’s regions where the approved
Service Providers compete for this work.

Section 8
Subject Performance Measurement and Review
Date Issued 30 June 2005
Page 136
Powerco Limited Asset Management Plan – Electricity Networks 2006 - 2020
7 RISK MANAGEMENT
7.1 Risk Management Charter Powerco’s approach to risk management starts at the strategic level with its Risk Management
Charter, which in turn delegates responsibilities for risk management to functional groups in
the form of risk profiles. Powerco’s Risk Management Charter is the culmination of many
years of continuous improvement from what had comprised various ad hoc systems for risk
control. The Charter fulfils the need for an efficient, effective and demonstrable risk
management process. It is consistent with established principles of risk management and
builds on these. The Charter is authorised by Powerco’s Audit Committee and Board of
Directors and it forms the top level of the company’s risk management hierarchy. Relevant
excerpts from the Risk management Charter are appended in Appendix 1.
7.2 Risk Management Profiles Following the guidance of the Risk Management Charter, four Risk Profiles have been
developed that form a key part of Powerco’s asset management process. These are outlined
as follows.
7.2.1 Environmental Responsibility
The main environmental risks associated with the electricity network are:
Visual and Physical Encumbrances - these pertain to Powerco’s rights to own assets on the
road side or on private land. The rights of line companies in this regard are largely dictated by
District Plans and by the Electricity Act and Transit Act. Powerco is presently developing an
interpretation of rights to upgrade lines located on privately titled land under the Electricity Act.
Damage through Oil Spills and Fire - Powerco aims to maintain equipment in good condition
and carry out regular condition inspections. Oil containment systems are being installed under
a rolling refit programme or when new equipment is installed.
Health Effects from EMF - a watching brief is kept on latest research, in particular, the work of
CIGRE/CIRED Working Group 36.06, and our network operating policies are being updated to
include the limits in international guidelines.
Disposal of treated softwood poles - at present the need to dispose of old softwood poles does
not often arise, although when it does arise, generally this managed in accordance with local
authority guidelines. There is usually a high demand for old poles to be recycled for a variety
of purposes.
Greenhouse Gas Emissions - SF6 gas is a potent greenhouse gas but the quantities that
Powerco owns are relatively small. Powerco has a procedure for disposing of SF6 in line with

Section 8
Subject Performance Measurement and Review
Date Issued 30 June 2005
Page 137
Powerco Limited Asset Management Plan – Electricity Networks 2006 - 2020
national guidelines formulated as a result of a national working group in which Powerco
participated.
7.2.2 Natural Disasters
This risk profile is particularly relevant given that Powerco serves a wide area of the North
Island, a part of the world that is exposed to high winds, seismic and volcanic activity and in
parts, snow storms and floods. Whilst line companies in New Zealand are not as concerned
with bush fires as much as our counterparts in Australia are, all of these affect Powerco’s
operations. The review of line design bases described below results from this risk profile.
The tactical response to these risks largely centres on contingency planning, with the Supply
Continuity Plan being the main guiding document. The Network Operations Centre group keep
an ongoing watch on weather forecasts to be forewarned of approaching storms. Powerco
also maintains alliances with Civil Defence and Regional Councils, and takes part in Civil
Defence exercises.
7.2.3 Network Asset Management
This risk profile is concerned with long duration loss of electricity supply, inadequate network
capacity leading to equipment damage or loss of supply, harm to people and harm to the
environment.
Adherence to network security criteria and renewal programmes are key parts of the annual
Asset Management process culminating in the preparation of the Asset Management Plan. A
further aspect is the trade off between price and quality of supply. A series of industry and
public consultations are under way to ascertain (quantify) the needs of the community for
adequate supply quality. In accordance with industry standards, the supply security
assessment process results in the development works plan, which in turn results in the capital
expenditure forecast.
The risks of harm to the public and personnel are monitored through regular network
inspections. During construction projects these risks are monitored through an audit process.
Operational procedures along with systems of locks and keys control access of personnel to
network sites. Dangerous sites are fenced to maintain public safety. Rolling reviews of the
integrity of earthing systems are carried out, as well as when equipment upgrades are carried
out. Some of the changes in regulations towards equipment earthing are too vague to apply in
practice and to address this, Powerco is participating in industry working groups. Personnel in
the electricity industry are generally accustomed to safe work practices, but this is reinforced
through Powerco’s culture for safety.

Section 8
Subject Performance Measurement and Review
Date Issued 30 June 2005
Page 138
Powerco Limited Asset Management Plan – Electricity Networks 2006 - 2020
7.2.4 System Integrity and Access
Powerco has an obligation under OSH legislation and its Use of System Agreements with
electricity retailers to provide reliable networks and a safe working environment. Network
security has already been mentioned in the context of supply reliability but another process is
the Performance Engineering process. This involves analysing network performance trends
and developing fixes where necessary. Planned supply outages can be controlled through the
network defects and fault management process. Live line techniques can be applied so that
an outage is not needed. Other factors affecting reliability and public safety such as vehicle
collisions, trees, birds vandalism and grass growing into equipment need to be monitored and
controlled.
From a safety perspective, with growing numbers of contractors accessing and working on the
network it is incumbent that the network assets are designed, constructed and maintained to
facilitate safe work practices. Important components to staff and contractor safety are regular
training refreshers and competency assessments, access approval processes, and ongoing
training of network controllers.
7.3 Risk Management Process
7.3.1 Purpose and Scope
The purpose of risk management from an asset management perspective is to manage risks
that may prevent the infrastructure assets from meeting service potential targets or cause
harm to people or financial loss to Powerco. The term “manage risk” may mean to reduce,
eliminate, transfer or accept the risk.
The risk management charter and profiles are applied to the development, renewal and
maintenance of all infrastructure assets covered by the Powerco asset management plan.
7.3.2 Risk Management Procedure: Review of Maintenance Methodology
This procedure is used to review maintenance methodologies:
1. Identify the hazards that present risk
• To the safety of employees and the general public;
• To the environment; and
• Of electricity supply interruptions.
These could be caused by:
• Environmental conditions such as lightning, ice, floods, slips, land subsidence
or earthquake;
• External factors such as vehicle collision, trees, vandalism, bird strikes,
opossums, uncontrolled digging or vermin/grass in kiosks;

Section 8
Subject Performance Measurement and Review
Date Issued 30 June 2005
Page 139
Powerco Limited Asset Management Plan – Electricity Networks 2006 - 2020
• Equipment failure such as inherent design inadequacy, overload deterioration,
moisture ingress or corrosion;
• Operational error such as incorrect protection settings or operating wrong
equipment;
• Substandard workmanship such as jointing, binding, cable laying or
terminating;
2. Conduct a failure mode and effects analysis (FMEA) on each class of assets and
general groups of assets (i.e. zone substations). For each failure mode review the
maintenance that could be performed to prevent or reduce the consequences of the
failure;
3. Estimate the effects of performing the maintenance in reducing the likelihood and
repair time for the failure;
4. Calculate the cost of the maintenance or action;
5. Calculate the cost of the failure where this relates to electricity supply interruptions or
environmental damage; and,
6. For safety related risk, determine the severity rating and probable frequency, and
determine what actions are required to reduce or eliminate the likelihood of the risk
eventuating.
7. During the review consideration shall be given to the other asset management drivers
to ensure that there are not any conflicts with the maintenance methodologies. Any
conflicts that do exist should be resolved by reviewing all drivers.
8. Select the maintenance activities that:
• Provide positive NPV;
• Those actions required from a health and safety standpoint, and;
• Do not conflict with the other asset management drivers.
In carrying out this procedure, the results of existing maintenance practices is reviewed.
Feedback from the field that occurs during the maintenance may contain valuable information
on the effectiveness or otherwise of the maintenance activity.

Section 8
Subject Performance Measurement and Review
Date Issued 30 June 2005
Page 140
Powerco Limited Asset Management Plan – Electricity Networks 2006 - 2020
7.3.3 Risk Management Procedure: Review of Development Planning Criteria
This procedure is used to check performance against planning criteria:
• Select the planning criteria that determine appropriate equipment reliabilities, failure
frequencies and repair times from company or industry statistics or from the FMEA for the
asset type. Assume appropriate maintenance practices have been applied;
• Where the planning criteria relate to reliability, simulate the network configuration given by
the planning criteria under normal conditions to determine the SAIFI, CAIDI and SAIDI.
The planning criteria shall be accepted if the simulation results (the SAIFI, CAIDI and
SAIDI) are within the feeder performance criteria or zone substation performance criteria;
• Perform risk assessment using Powerco's multi-stakeholder assessment process. Identify
all risks that could cause a crisis. How does the network handle the risk occurring? How
can the network better handle the risk occurring? Consider all other asset management
drivers when reviewing options to ensure that criteria are met and there is no conflict with
other asset management drivers; and,
• Check the performance outcomes against the planning criteria. If planning criteria fail to
meet the performance criteria then the planning criteria will be amended. The other asset
management drivers shall be considered when changing the planning criteria.
7.3.4 Multi-Stakeholder Assessment
The multi-stakeholder assessment process allows the project to be reviewed against a
balanced set of criteria that represents significant stakeholder needs. The multi-stakeholder
assessment process is presently being reviewed with the introduction of the Spend
Optimisation Tool.
The assessment criteria are combined using a weighted sums method, but the total number
resulting should not be considered in isolation from the underlying factors. These criteria are:
• Safety – Hazard to staff, public or customer. This factor is not valued in monetary terms.
The consequences of a hazard are rated between catastrophic and barely noticeable. The
frequency of exposure to a hazard is rated between continuous and no exposure. The
likelihood of event occurring is rated between happens often and almost impossible.
Some judgement in balancing risk with expenditure is required – as is always the case for
safety;
• Asset Investment Efficiency – The efficiency of the investment in terms of meeting
ongoing or new service requirements
• For development (growth) projects the efficiency of the investment is based on the
ratio of assessed ORC to budgeted capital cost;

Section 8
Subject Performance Measurement and Review
Date Issued 30 June 2005
Page 141
Powerco Limited Asset Management Plan – Electricity Networks 2006 - 2020
• For renewal projects an investment is considered to be efficient if the capital cost of
the replacement assets is less than the accumulated depreciation (RC – DRC) of
the existing assets being replaced;
• Network Reliability – The assessment of reliability performance is based on the
simplified calculation of the IRR of the new investment, based on capital cost and asset
life and reliability improvement;
• Growth - The ability to meet capacity requirements at the desired security level. In
addition to the asset investment efficiency assessment, growth assessment considers the
new earnings growth that will be sacrificed if the investment does not proceed. The
assessment of growth performance is based on the simplified calculation of IRR of the
new investment based on capital cost, asset life and new earnings;
• Environment – Including monetary liability, possible environmental damage, public
relations and aesthetics. Generally Powerco will only pay for environmental driven
projects where a tangible risk exists, such as an oil spill. Powerco will assist with aesthetic
benefits where upgrade works are required for another purpose, but generally the extra
costs are met by the party requesting the work;
• Quality – Voltage quality, legislative requirement and possible customer equipment
damage. Voltage quality includes voltage regulation, harmonics and transients;
• Liability – Possible claim from customer(s) for consequential damage due to loss of
supply. This criterion covers loss of supply, which has particularly serious consequences
for the customer(s), and Powerco has a known deficiency on its network, such as a
switchboard with poor condition monitoring results supplying a large factory, which would
be unable to produce for weeks if the board failed. It is a probabilistic risk calculation
considering consequences, likelihood, image, industry reputation and possible negative
publicity; and,
• Operations and Maintenance Costs – The assessment of O&M performance is based
on the simplified calculation of IRR of the new investment based on capital cost, asset life
and maintenance cost saving.
7.3.5 Risk Based Approach to Line Design
In the previous two years, Powerco has experienced several significant storm events, two of
which were the February storm in 2004 and the August 2004 snow storms in the Rangitikei
area. A critical success factor of Powerco’s response to these storm events was the well
defined and preprepared emergency response structure of its Electricity Supply Continuity
plan. Based on Business Continuity concepts, the supply continuity plan is scaleable and
generic and provides the framework necessary to manage response activities effectively and
efficiently, along regional process lines.

Section 8
Subject Performance Measurement and Review
Date Issued 30 June 2005
Page 142
Powerco Limited Asset Management Plan – Electricity Networks 2006 - 2020
The February storm was characterised in some areas by long return periods and because of
this, electricity consumers generally regarded the failure of parts of the electricity supply
infrastructure as understandable. Powerco received very positive feedback from external
parties involved with the emergency, including Electricity Retailers, District and Regional
Councils, and the National Crisis Management Centre.
The snow storms in August caused significant loss of electricity supply to electricity
consumers in the Taihape, Waiouru and Northern Manawatu areas. These areas have a
relatively high altitude with exposed locations and they have been hit by snow storms fairly
regularly in the past. Three storms have occurred in the last four years. The network in these
areas predominantly comprises overhead line and whilst it performs fairly reliably under both
summer and winter conditions, it is aging: many poles are approaching 40 years of age and
some degradation is evident in the line components.
The original design and construction standards have proved adequate for normal weather
conditions but they are increasingly being perceived as inadequate for the sorts of storm
conditions experienced recently. The original design standards were based on working stress
codes of practice. Network repairs made during and immediately following the storm were
based on the former line design principles. We are now concerned that the repairs will be
inadequate to withstand future similar severe weather conditions.
Powerco believes that following the recent snow storm, it is timely to limit-state principles to
adopt line design and remedial works in order to “future-proof” the network. Firstly, there is
growing concern that storms like those recently experienced are becoming more severe and
regular. With the network in the Taihape and Waiouru areas becoming more aged, new design
principles will allow special consideration of storm prone areas as the network is renewed.
Secondly, there is a need for greater consistency across Powerco’s network area. As the
network has grown through mergers and acquisitions, a variety of line design bases and
practices are actually still being used. Adoption of new principles will mean a common
approach.
Limit state design processes allow a probability and return period approach to be adopted to
the calculation of risk-based critical loads. Overhead lines are subject to several loads arising
from conductor static loads, personnel working aloft, temperature changes, wind loads, snow
accumulation on conductor and conductor dynamic loads. The most significant influence
affecting line design is the prevailing weather conditions. As the loads vary in differing ways
under different conditions, such as in exposed, high altitude areas with low temperatures, it is
unlikely that all worst-case scenario loads will be experienced co-incidentally. Account can
also be taken of material deterioration and material end-of-life states.

Section 8
Subject Performance Measurement and Review
Date Issued 30 June 2005
Page 143
Powerco Limited Asset Management Plan – Electricity Networks 2006 - 2020
Powerco is presently in the process of preparing limit-state line design standards for overhead
lines. The intention is that risk-based limit-state philosophies will be employed for all new line
construction and all remedial works to existing lines.
7.3.6 Project Risk Management
Where significant risks in terms of safety, environmental, quality and liability exist, the project
should be put forward for ranking and approval without conducting any further economic
assessment
For projects requiring a Network Project Approval Memorandum the risks associated with the
project in terms of construction and timing are considered and the management strategy is
noted.
7.3.7 Summary of Contingency Plans and Emergency Response Systems
Details of emergency response procedures are contained in Powerco’s Electricity Supply
Continuity Plan (ESCP). The aim of this plan is to:
Sustain electricity network capabilities through abnormal, emergency situations by effective network management and practices.
The plan is designed for emergencies, i.e. events that fall outside of the ordinary operation of
the network that routinely deals with ‘incidents’ as defined below.
Incidents (Not covered by the ESCP)
An incident is an expected but unforeseeable event that can be managed within the normal operating framework of the Network Control Centre. These would be handled by personnel as virtually a routine job and would normally not require the presence of a Supervisor on site for the full duration of the operation. Examples include: • Reported lines down or pole fires; • ‘No Power’ calls; and, • Network faults
Emergencies (Covered by the ESCP)
An emergency is an unplanned event that presents or has the potential to present a major disruption to the normal operation of the network. An emergency is too big a problem to be handled in a timely manner using business-as-usual resources and capabilities, e.g. without bringing in extra staff who are not ‘on call’ to assist. Events that may cause, or be lead indicators for Emergency Situations mentioned above include (but are not limited to): • Natural disasters (severe storm, flooding, earthquake, volcanic eruption,
cyclone, tsunami); • Major transmission network or generation failure; and, • Significant natural or human threat or impact to the Network Operations Centre. A network emergency would require the presence on site of a supervisor as Site Control Officer and, depending on the classification, a Senior Manager at the emergency control centre.

Section 8
Subject Performance Measurement and Review
Date Issued 30 June 2005
Page 144
Powerco Limited Asset Management Plan – Electricity Networks 2006 - 2020
General guidelines for classification of an event as an Emergency Situation are: • Loss (or potential loss) of 10,000 customers or 20MVA of load (or greater)
where this is likely to be sustained for more than 6 hours; • Loss (or potential loss) of between 5,000 and 10,000 customers or between 10
and 20MVA of load where this is likely to be sustained for more than 10 hours; • The declaration of a Civil Defence Emergency; and, • The evacuation of the normal Network Operations Centre other than for a fire
alarm.
The ESCP is prescriptive in nature and sets out the composition, authority, responsibilities and
the reporting structure for Electricity Emergency Response teams and resource allocation.
Individual risks are not identified as procedures are designed to ensure that the support
structure mobilised is appropriate to the particular emergency situation.
Testing of the ESCP and training of staff will be an on-going activity.
7.4 Conclusions from Risk Analysis The integration of risk management into the planning process has led to a number of results.
These are:
• The application of a Network Project Approval Process to all proposed development
projects. This process consists of the following steps:
- Review of project fit with AMP strategy and/or works plan;
- Assessment and justification of project;
- Multi-stakeholder assessment;
- Project risk management;
- Project economic justification;
- Project prioritisation; and
- Formal approval of project.
• Applying standards for zone substation and distribution feeder security levels, determining
zone substations not meeting required security levels, determining upgrade requirements,
and prioritising for upgrading;
• Applying a formal procedure for preparing contingency plans for loss of supply to major or
strategically important consumers;
• Update of maintenance standards and schedules, and the development of new standards
covering the plan/conceive, design/construct, maintain/refurbish, and dispose asset
lifecycles;
• Development of new line design procedures and methodologies;
• Production of comprehensive substation operating manuals and contingency plans; and,
• Ongoing work on the worst performing distribution feeders with a view to improving their
performance.

Section 8
Subject Performance Measurement and Review
Date Issued 30 June 2005
Page 145
Powerco Limited Asset Management Plan – Electricity Networks 2006 - 2020
7.4.1 Western Region At-Risk Situations
There are several situations on the western networks where Powerco is at risk in the event of
a fault. Significant risks are listed below. Solutions to these risk situations are being analysed.
• The two 33 kV cables from Carrington GXP to City substation are in a deteriorated
condition, and the possibility exists of a single fault causing both cables to fail. This would
cause an outage to the New Plymouth CBD, and at peak load times, all power may not be
able to be restored. Advice has been sought from consultants in the UK who have
reported that water has gained access to the phase conductors and armour wires of the
cables prior to jointing together of the individual lengths with further water entering by
defective seals at joints or by diffusion through the PVC oversheath. Water will have
diffused into the insulation leading to the reported initiation of water treeing, which will be
on going. Powerco is considering the implications of this advice, and provision for
replacement in 2006 and 2007 has been made in the long term development plan.
• Most cables ex Carrington GXP 11kV are of paper lead construction, built with lead that
does not contain alloy E. If it is moved, the lead crumbles, and repair is difficult. Some of
these cables are in a trench with several others and their group rating is low. If any of
these needs to be jointed, there is a serious risk of damaging the other cables, and a shut
down of all the cables would be needed to carry out the repair safely. Sections of these
cables will be replaced along with the commissioning of a new 11kV switchboard by
Transpower in the next two years, but replacement of the remainder will now be carried
out progressively over several years;
• 11kV cables to the Paraite Rd industrial area in Bell Block are heavily loaded and they
cannot take any further load increase without reducing security. However, a major
customer has reduced load significantly and the situation is being monitored on an
ongoing basis;
• 11kV circuits to Waiwhakaiho industrial area run as a dual circuit on common poles. The
main risk is a car versus pole accident along Awanui and Cumberland Sts. If these are
both out of service, adequate supply to the area cannot be maintained. The installation of
a new feeder to the area is in the works plan for 2006;
• James Lane distribution substation is constructed on a bridge over the Huatoki River, and
contains two 500kV transformers and oil filled switchgear. The potential for an
environmental incident is high. Its removal is in the works plan for 2006;
• Manaia zone substation has only one transformer, and in the event of a transformer or
switchgear failure, full supply to Manaia, including a major customer, cannot be
maintained. A second transformer is planned for 2008
• Transpower Brunswick GXP has only a single transformer bank, and one overhead line to
Peat St and if supply from it is lost at a time of high load, not all the Wanganui city load
can be restored. Some reinforcements to overcome this are in progress and others are
planned for progressive implementation over the next three years;

Section 8
Subject Performance Measurement and Review
Date Issued 30 June 2005
Page 146
Powerco Limited Asset Management Plan – Electricity Networks 2006 - 2020
• Beach Rd substation has a single transformer, and if it fails, supply cannot be restored to
a 5 MVA customer. The risk has been discussed with the customer concerned and
alternative supply arrangements are being investigated. The sale of the Taupo Quay
depot may necessitate expansion at Beach Rd;
• Kai Iwi substation supplies the Wanganui waterworks with a single transformer. In the
event of a prolonged outage, Wanganui could run out of water. Further investigation is in
progress;
• Pongaroa substation has no oil containment, and any significant leak will pollute a nearby
stream. Alternative solutions, including possibly disestablishing the substation are being
evaluated;
• Some interconnecting 11kV cables in the Palmerston North Central City area do not have
suitable capacity in all cases to support backfeeding in the event of some fault. There is a
risk that outage times will be extended in some fault situations. This issue is subject to an
upgrade project;
• There is restricted operation of the network and increased probability of failure for some
types of 11kV ground mounted switchgear, due to latent defects with the equipment the
affected switchgear in critical parts of the network is subject to a renewal program;
• There is an increased risk of failure on aluminium XLPE cables installed in the late 1960’s.
Some urban areas of Palmerston North have this type of cable installed. The condition
and performance of this cable is being closely monitored and replaced when necessary;
• A number of substations in the Western region do not meet Powerco’s security of supply
standards, which increases the probability of failure. In most cases enhancement work is
being scheduled or considered. Economic reasons may prevent the security of supply
standards being implemented, and in this situation non-asset and contingency plans are
being implemented.
• A long single 33kV line supplies Sanson substation. If the line fails, all load cannot be
supplied at 11kV. Alternative supply arrangements are under investigation, but may prove
to be uneconomic; and,
• Chapel substation has no oil containment, and spilt oil can easily pollute a nearby stream.
Provision of oil containment is in the works plan for 2006.
7.4.2 Eastern Region At-Risk Situations
There are several situations on the eastern networks where Powerco is at risk in the event of
a fault. These are listed below. Plans to deal with these risks are being investigated.
• Thames is supplied by a single 66 kV line, and in the event of its failure, the majority of the
town’s load would be interrupted for repair time. Obtaining easements for a second line is
planned for 2006;

Section 8
Subject Performance Measurement and Review
Date Issued 30 June 2005
Page 147
Powerco Limited Asset Management Plan – Electricity Networks 2006 - 2020
• Waihi substation peak load is around 6MVA above its class capacity, although much of
the load results from mining operations, which are expected to reduce within five years.
The load is being monitored on an ongoing basis;
• Browne St, Tower Rd, Lake Rd, Kauri Point and Waihi Beach do not meet their required
security levels, but instead rely upon switching in the distribution networks to provide back
up supplies to cover for loss of equipment availability. In worst cases, backup supplies
may be inadequate;
• A number of substations, such as Baird Rd, Maraetai Rd, Morrinsville, Omokoroa, Kauri
Point, Matua, Pongakawa, Kerepehi, Matatoki, and Whangamata do not meet Powerco’s
required security levels as they are supplied by single lines and do not have full
distribution network support. The economic viability of increasing the security of these
substations is being considered on an individual basis. In 2005 Matatoki had a larger
transformer installed, and Kerepehi will have a second transformer installed. In 2007,
Omokoroa will have a second transformer installed;
• Putararu and Tirau are supplied from Hinuera GXP by a single line, with very little supply
being able to be restored in the event of loss of availability. Tirau has a large dairy factory.
A new GXP for Putaruru is planned to overcome this;
• Whitianga and Coromandel, major tourist and holiday destinations, are supplied by a
single 66kV line. It is planned to improve the security of supply to Whitianga by extending
the existing second 66kV line in 2007, but the extension of the second line to Coromandel
is not likely to be economic;
• Several substations do not have oil containment facilities and work on implementing these
is proceeding;
• The pilots protecting the 33kV feeders supplying the Tauranga CBD are all in the same
cable. Damage to this one cable could cause loss of supply to the entire CBD. The
opportunity to lay new pilots or fibre optic cable will next arise when the new 33kV feeders
to Waihi Rd are laid in 2009. Options of using high speed digital radio links are being
considered;
• Some mainline and interconnection 11kV cables in the Tauranga central city do not have
suitable capacity in all cases to support backfeeding in the event of some faults. There is
the risk that outage times will be extended to the full repair time for some customers. This
issue is subject to a significant upgrade project;
• The operation of some types of 11kV ground-mounted switchgear has been restricted and
there is an increased risk of failure of this equipment. The affected switchgear in critical
parts of the network is subject to a renewal program; and,
• There is an increased risk of failure of 11kV XLPE cable installed in Tauranga prior to
1975, especially smaller 25mm cables. A replacement programme is proceeded for cables
where reliability impact of a failure is expected to be significant.

Section 8
Subject Performance Measurement and Review
Date Issued 30 June 2005
Page 148
Powerco Limited Asset Management Plan – Electricity Networks 2006 - 2020
8 PERFORMANCE MEASUREMENT AND REVIEW
8.1 Introduction This section presents a review of Powerco’s performance against target for FY2005,
discusses the factors that influenced the performance, and compares these against industry
performance where a reasonable comparison can be made. Detailed discussion of the
performance measures and targets is included in Section 5 of this plan.
8.2 Review of Previous Plans
8.2.1 General Review Comments
This plan is the result of the review of Powerco’s Asset Management Plan issued on 31 July
2004. Preparation of the plan is an ongoing process throughout the year, but work intensifies
between April and June, when final results become available. Powerco has established a
comprehensive set of performance targets for FY2006, and will monitor performance against
them.
8.2.2 Review of Work In Progress
Powerco has reviewed its long term development plan, covering subtransmission
development for a 15-year period to FY2020. It has also completed its medium term
development plan covering distribution network development for a five-year period to FY2010.
This is presently being used to formulate feeder renewal and maintenance projects.
8.3 Review of Service Performance Against Targets Powerco’s overall network reliability performance as measured by SAIDI was 32% above
target (unfavourable), partly due to a number of extreme weather events. However, with the
exclusion of the three extreme weather events Powerco’s network reliability was only 10%
above target, which is a very good result considering the sustained periods of poor weather
throughout FY2005, (refer to section 3.4 of Powerco Limited Threshold Compliance Statement
2005, 20 May 2005). This is also an improvement of the post-extreme weather performance
over FY2004.
The three extreme weather events experienced during FY2005 were:
• Tornado near Waitara on 15 August 2004: with its severe and wide destruction path;
• Snow storms in the Taihape area from 17 August to 24 August 2004, containing rime ice.
The snow and ice caused damage to the network and transport and access were
adversely affected; and,
• Downbursts near Te Puke on 25 March 2005. Downbursts are enormously powerful
vertical gusts of wind from within a thunderstorm, exploding downwards and accelerating
horizontally along the ground when they hit the earth surface.

Section 8
Subject Performance Measurement and Review
Date Issued 30 June 2005
Page 149
Powerco Limited Asset Management Plan – Electricity Networks 2006 - 2020
Powerco’s network in the Taihape and Waiouru areas experienced significant damage to
equipment and some consumers were without power for extended periods of time. The
customer minutes lost due to this storm are illustrated in Figure 8.1 below:
Figure 8.1: August Snow Storm Customer Minutes Lost
The effects of this storm and other extreme weather events are shown in Figure 8.2 below.
Significant weather events with adverse reliability impacts were as follows (these are further
described in Powerco’s Threshold Compliance Statement):
Figure 8.2: SAIDI Performance vs Time
August Snow Storm
0
1000000
2000000
3000000
4000000
5000000
6000000
07/0
8/04
08/0
8/04
09/0
8/04
10/0
8/04
11/0
8/04
12/0
8/04
13/0
8/04
14/0
8/04
15/0
8/04
16/0
8/04
17/0
8/04
18/0
8/04
19/0
8/04
20/0
8/04
21/0
8/04
22/0
8/04
23/0
8/04
24/0
8/04
25/0
8/04
Date
Cu
sto
mer
Min
ute
s
33 kV22 kV11 kV6.6 kV
Significant Effects on SAIDI
0
2
4
6
8
10
12
14
16
18
1-A
pr
15-A
pr
29-A
pr
13-M
ay
27-M
ay
10-J
un
24-J
un
8-Ju
l
22-J
ul
5-A
ug
19-A
ug
2-S
ep
16-S
ep
30-S
ep
14-O
ct
28-O
ct
11-N
ov
25-N
ov
9-D
ec
23-D
ec
6-Ja
n
20-J
an
3-F
eb
17-F
eb
3-M
ar
17-M
ar
31-M
ar
Fortnight Ending
SA
IDI (
Cu
sto
mer
min
s/to
tal I
CP
s)
High w inds and snow storms predominantly in Eastern and Central districts
Lightning storm and tornado in Eastern Region
Equipment failure on 66kV feeder in Coromandel region
High w inds causing many tree/line contacts
High w inds causing tree contacts in Wanganui region and equipment failure in Masterton
High w inds, tornado and lightning in Taranaki region
Tree fell onto 66kV line in Coromandel region
Strong w inds, tornado and poles dow n in Eastern region
Major fault on 33kV line in Putaruru
Equipment failure in Valley and Eastern regions

Section 8
Subject Performance Measurement and Review
Date Issued 30 June 2005
Page 150
Powerco Limited Asset Management Plan – Electricity Networks 2006 - 2020
Powerco’s 2005 reliability performance is summarised in Table 8.1. Comparing this to the
industry mean indicates that Powerco’s performance is in the “average” band (Powerco’s
Fy2005 result ranked against the FY2005 industry statistics in the middle band).
Table 8.1: Powerco Reliability Performance Summary
Performance Measure Unit
Powerco Actual 2005
Western Actual 2005
Eastern Actual 2005
Powerco Target 2005
Industry Average
2004
Industry Median
2004
SAIDI (B+C) Minutes per Customer 194.5 175.2 218.1 150 186.30 168.60
SAIFI (B+C) Interruptions per
Customer 2.745 2.334 3.247 2.5 2.30 1.80
CAIDI (B+C) Minutes per Interruption 70.9 75.1 67.2 60 82.80 79.20
Notes: 1. The industry data was taken from the PriceWaterhouseCoopers Electricity Line Business and Gas Pipeline
Business 2004 Information Disclosure Compendium. 2. Powerco data includes extreme weather events.
Powerco’s reliability performance over time, measured by SAIDI, is illustrated in Figure 8.3
below.
Figure 8.3: Powerco SAIDI Performance Trend
Note: Powerco data includes extreme weather events.
Figure 8.4 below shows the recent reliability performance against network customer density.
Powerco’s performance for FY2005 (with the inclusion of the extreme weather events) is in the
average performing group when compared with its peers. This is a good result considering
the extreme weather events experienced during the year.
Based on the results of Powerco’s Price Quality Trade-offs Study, the FY2006 target has been
set at 150. In setting this target, Powerco realises that the improvements to network security
Powerco SAIDI Performance
-
100
200
300
400
500
600
700
2001 2002 2003 2004 2005
Year (FYE)
SA
IDI (
Cla
ss B
+C)
min
ute
s
WesternEasternPowercoPowerco Trend

Section 8
Subject Performance Measurement and Review
Date Issued 30 June 2005
Page 151
Powerco Limited Asset Management Plan – Electricity Networks 2006 - 2020
and fault response process needed in the event than the continued unsettled weather
continues may take time to achieve.
Customer Density vs SAIDI
0
5
10
15
20
25
30
35
40
0 50 100 150 200 250 300 350 400 450 500 550 600
SAIDI (Class B & C)
Cu
sto
mer
Den
sity
(IC
P/k
m)
Non Powerco Networks FY2004
Powerco FY2004
Powerco FY2005 Actual
Powerco FY2006 Target
Figure 8.4: Powerco SAIDI vs Customer Density
Note: Industry data based on 2004 Information Disclosure Data.
8.3.1 Regional Reliability Performance
The reliability performance has been disaggregated by region in Table 8.2 below. This table
provides details of line fault rates, which contribute to overall reliability.
8.3.2 Distribution Feeder Class Reliability Performance
Powerco has set feeder interruption duration index (FIDI) targets (Section 5.2.3) for each of its
five feeder classes and all feeders have been assigned a feeder class commensurate with the
customers connected. Measuring individual feeder performance provides a disaggregated
measure of service performance more closely aligned to the individual consumers’
experience.
The following graphs show the worst performing feeders in each class for FY2005. The data
has been used to track performance and initiate improvements in the performance of these
feeders. To put the performance data into perspective, Powerco has 598 distribution feeders
and 86% of these performed better than target. Hence, the vast majority of consumers
received an electricity supply within targeted reliability. This is a significant improvement over
FY2004 (where 77% performed better than target).
The performance of the feeders is consistent with the overall network reliability, which was
also above target (unfavourable). Many of the feeders identified performed poorly due to the
storms experienced across the Powerco footprint during the year. Winds and a tornado
occurred in the Eastern region in June 2004 and again in March 2005 and a snow and
windstorm that affected the Western Region during August 2004. For all the under-performing
feeders identified below, the performance gap has been, or will be, investigated and corrective

Section 8
Subject Performance Measurement and Review
Date Issued 30 June 2005
Page 152
Powerco Limited Asset Management Plan – Electricity Networks 2006 - 2020
and preventative actions undertaken to improve performance. Specific performance issues or
events that caused the poor performance are mentioned under each graph.
Table 8.2: Regional Reliability Performance
8.3.3 Reliability Improvement Initiatives
Supply reliability performance against target is the main area in which targets are not being
met. Much of this is weather dependant, with storms adversely affecting the reliability results,
but there are several areas in which performance improvements are being made on an
ongoing basis. While these will take several years to complete, significant progress has and is
being made on them. They are:
Performance Unit Powerco Actual FYE 2005 Target 2005
Measure Man Tar Tau Val Wai Wan Total West East Powerco
SAIDI (Class A) minutes per customer 0.2 0.0 0.1 0.6 0.0 24.9 3.0
SAIDI (Class B) minutes per customer 11.8 10.9 5.0 13.9 6.4 20.6 11.1 15.0 26.0 20.0
SAIDI (Class C) minutes per customer 119.0 153.1 214.9 202.4 152.2 252.1 183.4 98.0 169.0 130.0
SAIDI (Class D) minutes per customer 50.4 0.8 0.0 0.5 0.0 0.5 9.2
SAIDI (Class B+C) minutes per customer 130.8 164.0 219.9 216.3 158.6 272.6 194.5 113.0 195.0 150.0
SAIDI (All Classes) minutes per customer 182.5 165.6 222.9 217.9 162.9 298.6 208.3
SAIFI (Class A) Interruptions per customer 0.00 0.00 0.00 0.00 0.00 0.08 0.01
SAIFI (Class B) Interruptions per customer 0.07 0.05 0.04 0.22 0.04 0.11 0.09 0.1 0.2 0.1
SAIFI (Class C) Interruptions per customer 2.24 2.28 3.71 2.50 1.88 2.53 2.65 1.7 3.2 2.4
SAIFI (Class D) Interruptions per customer 0.73 0.06 0.00 0.03 0.00 0.04 0.15
SAIFI (Class B+C) Interruptions per customer 2.31 2.33 3.75 2.72 1.91 2.65 2.75 1.8 3.4 2.5
SAIFI (All Classes) Interruptions per customer 3.05 2.40 3.75 2.76 1.94 2.77 2.92
CAIDI (Class A) Minutes per interruption 352.5 0.0 250.0 131.8 0.0 320.2 302.4
CAIDI (Class B) Minutes per interruption 161.3 215.0 127.1 64.1 170.1 181.9 117.4 150.0 136.8 142.9
CAIDI (Class C) Minutes per interruption 53.1 67.1 58.0 80.9 81.1 99.5 69.2 57.6 53.0 54.9
CAIDI (Class D) Minutes per interruption 69.4 13.2 0.0 16.7 0.0 14.0 61.3
CAIDI (Class B+C) Minutes per interruption 56.5 70.3 58.7 79.6 82.8 103.0 70.9 62.8 57.7 59.8
CAIDI (All Classes) Minutes per interruption 59.8 68.9 59.4 79.0 84.0 107.7 71.5
Faults O/H and U/G Number per 100km 12.27 12.35 13.95 8.16 11.10 10.18 11.06 11.4 10.0 10.9
Faults O/H Number per 100km 13.12 12.87 17.02 8.38 11.23 10.32 11.64 11.7 10.9 11.4
Faults U/G Number per 100km 3.98 3.54 5.86 6.30 6.32 3.52 5.3 5.3 4.7 5.0

Section 8
Subject Performance Measurement and Review
Date Issued 30 June 2005
Page 153
Powerco Limited Asset Management Plan – Electricity Networks 2006 - 2020
• Continued monitoring and management of the worst performing distribution feeders;
• Distribution system reconfiguration, automation and sectionalisation to improve
performance.
• Implementing SCADA at zone substations that do not have this facility. See table 6.31 for
planned projects; and,
• Addressing subtransmission network reliability performance particularly in the Eastern
region. Significant planning work in this area is reflected in the Eastern Region long-term
development plan (refer tables 6.25 and 6.26). Five zone substation transformers have
been delivered and have been or are being installed.
Good progress has been made with these initiatives as of the feeders not meeting their
reliability targets:
• Of the 17 F1 feeders listed in FY2004, 10 are still listed in FY2005.
• Of the 20 F2 feeders listed in FY 2004, only 6 are still listed in FY2005.
• Of the 31 F3 feeders listed in FY 2004, only 9 are still listed in FY2005.
• Of the 30 F4 feeders listed in FY 2004, only 3 are still listed in FY2005.
• Of the 2 F5 feeders listed in FY2004, 1 is still listed in FY2005.
The improvement in feeders not meeting reliability targets is shown in Figure 8.5 below:
Figure 8.5: Feeders Not Meeting SAIDI Targets, 2003 - 2005
The following graphs show planned and unplanned FIDI for each security class. The
horizontal orange line represents the FIDI target for the feeder class.
Feeders Not Meeting SAIDI Targets
0
5
10
15
20
25
30
35
40
45
50
F1 F2 F3 F4 F5
No
of
Fee
der
s 2003
2004
2005

Section 8
Subject Performance Measurement and Review
Date Issued 30 June 2005
Page 154
Powerco Limited Asset Management Plan – Electricity Networks 2006 - 2020
8.3.4 FIDI Graphs and Comments for Powerco
8.3.4.1 Feeder Class F1
Figure 8.6: Worst Performing Feeders – Class F1
Wanganui, Bryce – The feeder has less than 20 ICP’s connected. One unplanned outage has
accounted for the FIDI result due to a bird strike with three spans of wire failing. Some
reconducting work will be carried out in the 2006/07 year.
Valley, Kennedy Drive – Outages resulted primarily from four defective equipment faults and
one foreign interference event being 82% and 18% respectively. The two major faults
resulted from cable failures where 11kV back-feed was available. This is an F1/F3/F4 feeder
with one recloser installed. No further work is planned.
Manawatu, Kawakawa – One unplanned outage has accounted for the FIDI minutes due to a
tent being blown into the line. No further works are planned for the feeder.
Taranaki, Blake St. - Two unplanned outages have accounted for the FIDI minutes on the
feeder, due to failed insulators. No further work is planned on the feeder for the 2005/06 year.
Taranaki Bell Block 6 – One unplanned outage accounted for the FIDI minutes, due to a car
versus pole. A cable was damaged on the pole and full repairs were required before a
transformer could be re-supplied. This accounted for the high customer minutes. No further
works are planned for the feeder.
Valley, Woods Rd – Two planned outages occurred due to overhead line reconstruction.
There are only 39 customers on this feeder. No further work is planned.
Worst Performing Feeders - Class F1
0
50
100
150
200
250
300
350
400
450
500W
AN
GA
NU
I - B
RY
CE
ST
VA
LLE
Y -
KE
NN
ED
Y D
RIV
E
MA
NA
WA
TU -
KA
WA
KA
WA
TAR
AN
AK
I - B
LAK
E S
T
VA
LLE
Y -
TOW
NS
HIP
& L
S
TAR
AN
AK
I - B
ELL
BLO
CK
6
VA
LLE
Y -
WO
OD
S R
D
VA
LLE
Y -
MA
UN
GA
KA
WA
RD
TA
RA
NA
KI -
ELT
HA
M T
OW
N N
OR
TH
TAR
AN
AK
I - M
AN
GA
TOK
I
TA
UR
AN
GA
- S
OU
TH
TAR
AN
AK
I - G
LOV
ER
RD
EA
ST
TAR
AN
AK
I - M
AN
AIA
TA
UR
AN
GA
- T
AR
A R
D
FID
I Min
ute
s
Unplanned
Planned
Target

Section 8
Subject Performance Measurement and Review
Date Issued 30 June 2005
Page 155
Powerco Limited Asset Management Plan – Electricity Networks 2006 - 2020
Taranaki Eltham Town North - One unplanned outage and one planned outage accounted for
the FIDI minutes, due to a truck versus pole. No further works are planned for the feeder.
Taranaki, Mangatoki – The feeder is classed F1/F4 with a recloser. There have been 4
unplanned outages on the feeder, all downstream of the recloser, ie: on the F4 section of the
feeder. This reflects the performance of the F4 section, with no outages recorded against the
F1 component of the feeder.
Taranaki, Glover Rd East – Two unplanned outages have accounted for the FIDI result, a
bird strike and a cable failure. No further works are planned for the feeder.
Taranaki, Manaia - The FIDI minutes result from planned and unplanned outages. The
planned outages were for pole replacement, with two minor unplanned outages on spur lines
that did not affect the F1 component of the feeder. One outage caused by a tree branch in
the main line accounted for the majority of the FIDI minutes.
8.3.4.2 Feeder Class F2
Figure 8.7: Worst Performing Feeders – Class F2
Tauranga, Maleme – There were six outages, with unknown cause and foreign interference
being 74% and 26% respectively. There is one recloser to isolate faults past a council water
pumping station. This feeder has 900 ICP’s and a new feeder is proposed to supply the
industrial customers. Auto-reclose functionality is to be enabled on the Transpower 11kV CB,
and re-configuration of 11kV chevron to delta construction is planned.
Valley, Willoughby St – There were four outages, with unknown cause and defective
equipment being 48% and 52% respectively. There was a cable failure and several insulator
failures. No further works are planned for the feeder, as it is only 5km in length.
Worst Performing Feeders - Class F2
0
50
100
150
200
250
300
350
TAU
RA
NG
A -
MA
LEM
E S
T
VA
LLE
Y -
WIL
LOU
GH
BY
ST
WA
NG
AN
UI -
WA
TE
RW
OR
KS
RD
WA
IRA
RA
PA
- W
AIN
GA
WA
RD
TA
UR
AN
GA
- A
ER
OD
RO
ME
WA
NG
AN
UI -
TA
IHA
PE
TO
WN
SO
UT
H
TA
RA
NA
KI -
MO
TU
RO
A 5
MA
NA
WA
TU -
WO
RK
S
VA
LLE
Y -
QU
EE
N S
T
TA
RA
NA
KI -
CA
RR
ING
TO
N 1
0
WA
IRA
RA
PA
- R
EN
ALL
ST
MA
NA
WA
TU -
SU
MM
ER
HIL
L
MA
NA
WA
TU -
OH
AK
EA
WA
NG
AN
UI -
DR
EW
S A
VE
TAU
RA
NG
A -
SP
RIN
G S
T
VA
LLE
Y -
PO
RT
RD
TA
UR
AN
GA
- C
AM
ER
ON
RD
DO
MA
IN
TAU
RA
NG
A -
ELI
ZAB
ETH
ST
WE
ST
WA
NG
AN
UI -
AR
AM
OH
O IN
LAN
D
FID
I Min
utes
Unplanned
Planned
Target

Section 8
Subject Performance Measurement and Review
Date Issued 30 June 2005
Page 156
Powerco Limited Asset Management Plan – Electricity Networks 2006 - 2020
Wanganui, Waterworks Rd – The FIDI minutes resulted from planned outages, and no
unplanned outages occurred. Tree trimming and line reconstruction have been the focus in
improving the feeder’s performance from the previous year.
Wairarapa, Waingawa Rd – Four unplanned outages have accounted for the FIDI minutes on
the feeder, all vehicle versus pole accidents. No further works are planned for the feeder.
Tauranga, Aerodrome – Eight outages occurred with defective equipment and planned
outages being 57% and 33% respectively. Cable faults and line defects were the major cause.
This feeder supplies 470 customers, and no further works are planned.
Wanganui, Taihape Town South – Two unplanned outages have accounted for the FIDI
minutes on the feeder. One vehicle accident accounted for 75% of the FIDI minutes, and a
tree contact accounted for the remaining FIDI. Tree trimming has been completed on the
feeder.
Taranaki, Moturoa 5 - One vehicle accident accounted for 88% of the FIDI minutes, and three
minor outages accounted for the remainder.
Manawatu Works – One unplanned outage, a bird strike, accounted for 89% of the FIDI
minutes. Two further unplanned and one-planned outages accounted for the remainder. No
further works are planned for the feeder in FY2006.
Valley, Queen St – There were four outages resulting from defective equipment and foreign
interference, being 74% and 26% respectively. Cable faults and line defects where the major
cause. This feeder supplies 1311 customers mainly within the Thames CBD region. No further
works are planned for the feeder.
Taranaki, Carrington 10 – One unplanned outage, a bird strike, and two planned outages
accounted for the FIDI minutes on the feeder. Tree trimming has been completed on the
feeder with no further work being planned.
Wairarapa, Renall St – This feeder has only 25 ICP’s connected. One unplanned outage
(cable failure) accounted for all the FIDI minutes. No further works are planned for the feeder.
Manawatu, Summerhill – Planned outages accounted for 95% for the FIDI minutes on the
feeder, reflecting the continuing network growth in the area.

Section 8
Subject Performance Measurement and Review
Date Issued 30 June 2005
Page 157
Powerco Limited Asset Management Plan – Electricity Networks 2006 - 2020
Manawatu, Ohakea – Two unplanned outages accounted for the FIDI minutes on the feeder.
One was due to an insulator failure and the other to an emergency shut down required to
repair a failed binder. No further work is planned on the feeder.
Wanganui, Drews Ave – One unplanned outage accounted for the FIDI minutes on the feeder,
due to faulty ground mounted switchgear. No further work is planned for the feeder.
Tauranga, Spring St – One outage occurred in August 2004 due to the failure of defective
cable that supplies customers in the Tauranga CBD. Cable upgrades have been scheduled for
FY2006.
Valley, Port Rd – There were three outages due to defective equipment and foreign
interference, being 78% and 28% respectively. The major outage was due to a faulty insulator,
which supplies customers in the Whangamata CBD. This feeder has approximately 1500
customers, and the installation of an additional feeder is planned for FY2006.
Tauranga, Cameron Rd Domain – One outage occurred due to foreign interference, a cable
strike, with restoration delayed due to switchgear operating restrictions and traffic delays. This
feeder supplies the Tauranga CBD and only has 180 customers. Replacement of the
switchgear is planned for FY2006.
Tauranga, Elizabeth St West – Two outages occurred, with the major fault resulting from a
ground mounted switchgear unit that failed. This was the initial fault that caused multiple
cascade faults in the Tauranga CBD in August 2004. Cable and switchgear upgrades are
scheduled for FY2006.
Wanganui, Aramoho Inland – Two planned outages accounted for the FIDI minutes on the
feeder. One was to install new high voltage switchgear and one was for a switchboard
upgrade. No further work is planned on the feeder.

Section 8
Subject Performance Measurement and Review
Date Issued 30 June 2005
Page 158
Powerco Limited Asset Management Plan – Electricity Networks 2006 - 2020
8.3.4.3 Feeder Class F3
Figure 8.8: Worst Performing Feeders – Class F3
Taranaki, Bell Block 2 - The feeder has had 14 unplanned outages in the past 12 months.
Further investigation will determine what the fault mechanisms have been and where to
instigate reliability improvements.
Valley, Purangi – There have been eleven outages, with unknown causes and defective
equipment being 48% and 46% respectively. An additional recloser and a link sectionaliser
were installed, and a comms upgrade to an existing recloser and a line survey were carried
out. A large proportion of faults are insulator failures. This feeder has over 35kms of overhead
line and 1660 customers, with no practicable way to install an additional feeder.
Taranaki, Tarata – Planned outages account for 74% FIDI minutes, line upgrades which
included replacing cross arms and conductor.
Tauranga, Ohauiti – There were eight outages, with lightning and tree contacts being 68% and
27% respectively. This is an F3/F4 feeder with a recloser protecting each section. A two to
three wire upgrade is planned for 3kms of line to provide adequate back-feed, but easement
issues have put this FY2005 project on hold.
Wanganui, Goldfinch – Four unplanned outages have accounted for the FIDI minutes on the
feeder, due to tree contacts. Tree clearance work has been completed on the feeder.
Tauranga, Vale St – There were three outages, with to foreign interference and planned
shutdowns being 79% and 21% respectively. This feeder only has 470 customers with no
additional works planned.
Worst Performing Feeders - Class F3
0
100
200
300
400
500
600TA
RA
NA
KI -
BE
LL B
LOC
K 2
VA
LLE
Y -
PU
RA
NG
I
TA
RA
NA
KI -
TA
RA
TA
TA
UR
AN
GA
- O
HA
UIT
I
WA
NG
AN
UI -
GO
LDF
INC
H
TAU
RA
NG
A -
VA
LE S
T
TA
UR
AN
GA
- B
OW
EN
TO
WN
VA
LLE
Y -
KU
AO
TUN
U
WA
NG
AN
UI -
HU
NTE
RV
ILLE
22K
V
VA
LLE
Y -
OP
OU
TE
RE
TAR
AN
AK
I - B
ELL
BLO
CK
7
TAU
RA
NG
A -
WE
LCO
ME
BA
Y
VA
LLE
Y -
NG
ATE
A
TA
RA
NA
KI -
MO
TU
RO
A 9
VA
LLE
Y -
VIC
TOR
IA S
T
WA
IRA
RA
PA
- M
IRO
ST
WA
NG
AN
UI -
NG
AT
AW
A
VA
LLE
Y -
PA
UA
NU
I
WA
IRA
RA
PA
- B
ELV
ED
ER
E
MA
NA
WA
TU -
WE
ST
TOW
N
WA
NG
AN
UI -
MA
RA
NG
AI
MA
NA
WA
TU -
MA
KIN
O
WA
IRA
RA
PA
- C
OLO
GN
E S
T
VA
LLE
Y -
PE
PE
RD
VA
LLE
Y -
THO
MP
SO
N D
R
TA
UR
AN
GA
- B
ET
HLE
HE
M H
EIG
HT
S
TA
RA
NA
KI -
CA
RR
ING
TO
N 5
MA
NA
WA
TU -
RE
SID
EN
TIA
L
FID
I Min
ute
s
Unplanned
Planned
Target

Section 8
Subject Performance Measurement and Review
Date Issued 30 June 2005
Page 159
Powerco Limited Asset Management Plan – Electricity Networks 2006 - 2020
Tauranga, Bowentown – There were four outages, with unknown causes and human error
being 64% and 31% respectively. This feeder is 21 kms long and has 470 customers. New
fault indicators are to be installed in FY2006.
Valley, Kuaotunu – There were thirteen outages, with foreign interference and defective
equipment being 56% and 34% respectively. This is an urban feeder in Whitianga with 1450
customers. A new feeder is to be installed in FY2006.
Wanganui, Hunterville 22kV – The feeder has had 15 unplanned and 6 planned outages that
account for the FIDI minutes. The planned outages have been for line reconstruction work.
Five tree contacts and four accidents account for the majority of the unplanned FIDI minutes.
Tree trimming is being completed on the feeder in FY2006.
Valley, Opoutere – There were three outages. with 90% being defective equipment, cable
faults and faulty protection. One recloser is installed. There are 1130 customers. Additional
fault indicators are to be installed in FY2006.
Taranaki, Bell Block 7 – A distribution switch failure resulted in a section of the feeder not
being supplied until full repairs were completed. This accounts for the high FIDI minutes on
the feeder. No further works are planned in FY2006.
Tauranga, Welcome Bay – There were four outages, with 89% being defective equipment,
cable faults. This feeder has over 2100 customers. Planned works include the installation of a
sectionaliser and several cable mounted fault indicators, and a new feeder to be installed in
FY2006.
Valley, Ngatea – There were nine outages, with foreign interference and defective equipment
being 72% and 27% respectively. This was caused by vandals putting chains over conductors,
bird strikes and various overhead line hardware defects. This feeder has 1100 customers over
72kms, with a single recloser installed. Line inspections have been completed, and fault
indicators are to be installed in FY2006.
Taranaki, Moturoa 9 – The feeder has had 20 unplanned outages in the past 12 months.
Further investigation will determine what the fault mechanisms have been and where to
instigate reliability improvements. Planned outages have included conductor replacement.
Valley, Victoria St – There were ten outages, with foreign interference and adverse weather
being 48% and 20% respectively. Faults were due to car vs pole accidents and high winds

Section 8
Subject Performance Measurement and Review
Date Issued 30 June 2005
Page 160
Powerco Limited Asset Management Plan – Electricity Networks 2006 - 2020
causing hardware failures. This is a short urban feeder in Waihi with 1200 customers. Line
inspections have been completed, and no works are planned for FY2006.
Wairarapa Miro St – Two unplanned outages account for 99% of the FIDI minutes, with a
conductor breaking and line contact due to high winds in the area. No further work is planned
on the feeder.
Wanganui, Ngatawa – One unplanned outage accounted for 82% of FIDI minutes on the
feeder. One planned outage occurred to replace a pole that had been damaged by a car
accident. No further works are planned for the feeder.
Valley, Pauanui – Four outages caused 98% of FIDI minutes, due to cable faults. Sections of
cable have been scheduled for replacement along with a new feeder for installation in 2006,
due to steadily increasing numbers of ICPs.
Wairarapa, Belvedere – The feeder had 2 unplanned and 1 planned outages during the year,
which account for the FIDI minutes. Tree trimming has been completed in the 2004/05 year.
No further works are planned.
Manawatu, West Town – The feeder had 13 unplanned outages, accounting for the FIDI
minutes. Improvement initiatives include replacing cross arms, insulators and re-conductoring
sections of the feeder that have been identified as being in poor condition.
Wanganui, Marangai – The feeder had 2 unplanned and 1 planned outages accounting for the
FIDI minutes. One unplanned outage due to a stolen vehicle hitting a pole accounted for 82%
of the total FIDI minutes.
Manawatu, Makino – The feeder is classed F3/F4 with a recloser. There have been 13
unplanned outages on the feeder with 12 outages downstream of the recloser, ie: on the F4
section of the feeder. There have been 11 planned outages on the F4 section of the feeder
with cross arm and replacement of conductor being the main focus.
Wairarapa, Cologne St – This feeder is classed F3/F5 with the FIDI minutes made up from six
planned and nine unplanned outages. Planned outages have been for pole replacement and
tree trimming. All unplanned outages have occurred on the rural or F5 section of the feeder,
unknown cause and tree contacts being recorded as the cause of the outages. Tree trimming
is ongoing into the FY2006.

Section 8
Subject Performance Measurement and Review
Date Issued 30 June 2005
Page 161
Powerco Limited Asset Management Plan – Electricity Networks 2006 - 2020
Valley, Pepe Rd - Three outages caused 90% of FIDI minutes, caused by vandalism and car
vs pole incidents. This feeder has a recloser and 1350 customers. It supplies the urban area
of Tairua. No works are planned for FY2006.
Valley, Thompson Dr - Three outages caused 85% of FIDI minutes, from a single cable fault
and follow-up repair works. This is a short urban feeder with 450 customers. No works
planned for FY2006.
Tauranga, Bethlehem Heights - Twelve outages caused 86% of FIDI minutes from defective
equipment failures. This feeder has been re-configured to reduce customer numbers, two
reclosers have been installed, and a line inspection has been completed. A new feeder is to
be installed in FY2006.
Taranaki, Carrington 5 – The feeder demographics have changed with all the feeders from the
Mangorei switching station renamed as Carrington 5. The feeder is classed as a F3/F4 with
the unplanned and planned outages occurring on the F4 section.
Manawatu, Residential – The feeder is mainly urban with a minor rural section. The 5
unplanned outages have occurred in this section. Installing a recloser or moving this section of
the feeder onto a rural (F4) feeder are being considered.
8.3.4.4 Feeder Class F4
Figure 8.9: Worst Performing Feeders - Class F4
Wanganui, Papakai – The majority of the unplanned outages occurred during the snowstorm
in August, including broken poles and lines down due to snow loading. An aerial survey has
been completed and a number of defects identified and repaired. Planned works for the
2005/06 year include repoling and rearming.
Worst Performing Feeders - Class F4
0
1,000
2,000
3,000
4,000
5,000
6,000
WA
NG
AN
UI -
PA
PA
KA
I
WA
IRA
RA
PA
- W
ES
TME
RE
GLA
DS
TON
E
WA
NG
AN
UI -
MA
NG
AW
EK
A
WA
NG
AN
UI -
MA
TA
RO
A
MA
NA
WA
TU
- H
OR
OE
KA
TA
UR
AN
GA
- M
AK
ET
U
MA
NA
WA
TU -
RA
NG
IWA
HIA
MA
NA
WA
TU
- C
OO
NO
OR
WA
IRA
RA
PA
- P
IRIN
OA
TA
RA
NA
KI -
TIK
OR
AN
GI
MA
NA
WA
TU -
AP
ITI
TAU
RA
NG
A -
KA
IMA
I DR
IVE
VA
LLE
Y -
MA
NG
ATA
RA
TA
WA
NG
AN
UI -
MIS
SIO
N R
D
TA
UR
AN
GA
- K
AIR
UA
RD
MA
NA
WA
TU -
MA
UR
ICE
VIL
LE
WA
NG
AN
UI -
MO
AW
HA
NG
O
FID
I Min
ute
s
Unplanned
Planned
Target

Section 8
Subject Performance Measurement and Review
Date Issued 30 June 2005
Page 162
Powerco Limited Asset Management Plan – Electricity Networks 2006 - 2020
Wairarapa, Westmere-Gladstone – The feeder has had 18 unplanned and four planned
outages that account for the FIDI minutes. A recloser is to be installed on the feeder to
improve the outage figures. Tree trimming has continued through the 2004/05 year.
Wanganui, Mangaweka – The majority of the unplanned outages occurred during the
snowstorm in August, including broken poles and lines down due to snow loading, and land
slippage. An aerial survey has been completed with a large number of upgrades planned for
FY2006 to improve the feeder’s performance.
Wanganui, Mataroa – The majority of the unplanned outages occurred during the snowstorm
in August, with supply to some areas taking up to 6 days to be restored. An aerial survey has
been completed with a large number of upgrades planned for the 2005/06 year to improve the
feeder’s performance.
Manawatu, Horoweka – The feeder had 17 unplanned and 8 planned outages, which
accounted for the FIDI minutes. Improvement initiatives include replacing cross arms,
insulators and poles that have been identified as being in poor condition, and upgrading a
recloser.
Tauranga, Maketu – Nineteen outages resulted from adverse weather and foreign
interference, being 44% and 32% respectively. Mini tornado’s, high winds, bird strikes, and car
vs pole incidents are the causes. This feeder runs adjacent to SH2 and many estuaries. It has
600 ICPs. A line inspection was recently completed. Works planned include rearming of two
sections of line, installing bird deflectors and installing a recloser in FY2006.
Manawatu, Rangiwahia – The majority of the unplanned outages occurred during the
snowstorm in August, including broken poles and lines down due to snow loading. Full repairs
have been completed. Possum guarding is planned for FY2006.
Manawatu, Coonoor – This feeder had 14 unplanned and 8 planned outages, accounting for
the FIDI minutes. The reclosers on the feeder have cleared all unplanned outages. Planned
outages on the feeder have included repoling and resiting the line out of slip zones. A line
condition patrol is planned for FY2006.
Wairarapa, Pirinoa – 8 unplanned outages accounted for all the FIDI minutes on the feeder,
which were caused by defective equipment. Line reconstruction in some sections is planned
for FY2006.
Taranaki, Tikorangi – The feeder had 8 unplanned and 1 planned outages that have
accounted for the FIDI minutes. One unplanned outage was due to a tornado that accounted

Section 8
Subject Performance Measurement and Review
Date Issued 30 June 2005
Page 163
Powerco Limited Asset Management Plan – Electricity Networks 2006 - 2020
for 65% of the FIDI minutes. Further investigation will determine the fault mechanisms, to
initiate improvements.
Manawatu, Apiti – The majority of the unplanned outages occurred during the snowstorm in
August, including broken poles and lines down due to snow loading. Full repairs have been
completed. Possum guarding has been completed. Works planned for FY2006 include
crossarm replacement.
Tauranga, Kaimai Drive – Twenty four outages resulted from foreign interference, unknown
causes, and tree contacts, being 39%, 24% and 15% respectively. This feeder is 115 kms in
length and has 1340 ICPs. It has two reclosers and two sectionalisers installed, and has had a
recent line inspection. Works planned include the installation of additional fault indicators,
some re-poling, and SCADA upgrade of two sectionalisers.
Valley, Mangatarata – There were ten outages, with adverse weather and tree contacts being
58% and 19% respectively. High winds caused line hardware failures, and there were several
tree contacts and car vs pole incidents. This feeder has one recloser, has had fault indicators
installed, and has recently been inspected. Some line hardware replacement is planned for
FY2006.
Wanganui, Mission Rd – The feeder had 8 unplanned and 1 planned outages that have
accounted for the FIDI minutes. Further investigation will determine the fault mechanisms, to
initiate improvements
Tauranga, Kairua Rd – There were fourteen outages, with adverse weather and foreign
interference/ tree contacts being 49% and 16% respectively. One major outage was due to a
mini tornado, and there were by car vs pole incidents and tree contacts. One recloser is
installed, and a new feeder has been installed to reduce ICP numbers. Inspection data is still
to be returned, and three fault indicators are to be installed in FY2006.
Manawatu, Mauriceville – 11 unplanned and 1 planned outages accounted for the FIDI
minutes on the feeder. The fault causes were adverse weather, defective equipment and
foreign interference. A line condition patrol is planned for FY2006.
Wanganui, Moawhango – The majority of the unplanned outages occurred during the
snowstorm in August, including broken poles and lines down due to snow loading, and land
slippage. An aerial survey has been completed and a number of works are planned for
FY2006 to improve the feeder’s performance.

Section 8
Subject Performance Measurement and Review
Date Issued 30 June 2005
Page 164
Powerco Limited Asset Management Plan – Electricity Networks 2006 - 2020
8.3.4.5 Feeder Class F5
Figure 8.10 Worst Performing Feeders – Class F5 Wanganui, Irirangi – The feeder has had 8 unplanned and 5 planned outages that account for
the FIDI minutes. Outages during the August snowstorm account for 66% of the FIDI minutes
recorded against this feeder. The planned outages have been for pole replacement. A line
condition patrol is planned for FY2006.
Manawatu, Waione - The feeder has had 8 unplanned and 5 planned outages that account for
the FIDI minutes. The feeder had a line condition patrol in FY2005.
8.3.5 Network Capacity Performance
The network performed satisfactorily in terms of capacity. Capacity shortfalls either have been
dealt with, or are being dealt with under the long or medium term development plans.
A normal number of capacity upgrades due to consumer load increases were undertaken
during the year.
8.3.6 Network Quality Performance
The network generally performed to the required level in terms of voltage and quality. A
number of voltage complaints were received, but these were predominately caused by the
consumer or adjacent consumers increasing their load. These issues were dealt with in
accordance with Powerco’s policy, and included conductor and transformer upgrades and
reconfigurations. In some areas general load growth has been accommodated by installing
11kV voltage regulation equipment.
Worst Performing Feeders - Class F5
0
200
400
600
800
1,000
1,200
1,400
1,600
WA
NG
AN
UI -
IRIR
AN
GI
MA
NA
WA
TU -
WA
ION
E
FID
I Min
ute
s
Unplanned
Planned
Target

Section 8
Subject Performance Measurement and Review
Date Issued 30 June 2005
Page 165
Powerco Limited Asset Management Plan – Electricity Networks 2006 - 2020
A very small number of consumer property damage complaints were received as a result of
voltage fluctuations. Powerco undertook investigations in all instances and the fluctuations
were outside the reasonable control of a prudent network operator.
8.4 Review of Economic Efficiency Performance Against Targets
8.4.1 Asset Efficiency Performance
Powerco’s asset efficiency performance is presented in Table 8.3 below. A number of
measures have been used to determine asset efficiency. Powerco has performed well against
target.
Powerco’s ODRC/ICP of $3,058/ICP compares favourably against the industry average
ODRC/ICP of $3151/ICP. However, this comparison is of limited value as it considers
depreciation and hence, those networks with a higher average asset age appear to perform
better than those of newer construction.
Table 8.3: Asset Efficiency Performance Measures
Notes: 1. Asset efficiency (ODRC/ICP) is the ratio of optimised depreciated replacement cost over number of ICPs. 2. Asset efficiency (RC/ICP) is the ratio of replacement cost over number of ICPs. 3. Asset efficiency (ODRC/MWh) is the ratio of optimised depreciated replacement cost over input network MWh. 4. Asset efficiency (RC/MWh) is the ratio of replacement cost over input network MWh. 5. Capital efficiency is the annual network Capital Expenditure over the change in ODRC as a percentage. It can
only be calculated when both start and end ODRC values are available. It excludes the reduction due to depreciation and any gain due to asset revaluation in the period.
6. Change in Asset Service Potental is the change in ODRC from year start to year-end. It can only be calculated when both start and end ODRC values are available. It includes the reduction due to depreciation but excludes any gain due to revaluation in the period.
7. ODRC and RC are as at 31 March 2001, and include street light assets.
Figure 8.11 presents a graph of asset efficiency (ODV/ICP) versus SAIDI using the FY2004
disclosure information. In this comparison Powerco is in the good performing category.
With increasing expectations from the community in environmental impact, reliability and
quality, it is expected that network investment per ICP will increase in the longer term. This will
Performance Unit Powerco Actual FYE 2005 Target Measure Man Tar Tau Val Wai Wan Total Powerco
Asset Efficiency (ODRC/ICP) Notes 1, 7
$/ICP 2,954 3,460 2,757 3,200 3,202 3,054 3,085 3,000
Asset Efficiency (RC/ICP) Notes 2, 7 $/ICP 5,663 6,553 4,820 5,957 6,467 6,179 5,817 6,000
Asset Efficiency (ODRC/MWh) Notes 3, 7
$/MWh 203 238 218 160 281 258 209 225
Asset Efficiency (RC/MWh) Notes 4, 7
$/MWh 389 451 382 298 568 521 395 450
Capital Efficiency Note 5 % na na na na na na na 100
Change in Asset Service Potential Note 6
% na na na na na na na >0

Section 8
Subject Performance Measurement and Review
Date Issued 30 June 2005
Page 166
Powerco Limited Asset Management Plan – Electricity Networks 2006 - 2020
be partly offset by older assets being replaced by newer ones incorporating improved
technologies.
Asset Efficiency vs SAIDI
0
1,000
2,000
3,000
4,000
5,000
6,000
7,000
8,000
0 50 100 150 200 250 300 350 400 450 500 550 600
SAIDI (Class B & C)
Ass
et E
ffic
ien
cy (
OD
V/IC
P)
($)
Non Powerco Networks FY2004
Powerco FY2004
Powerco FY2005 Actual
Powerco FY2006 Target
Figure 8.11: Asset Efficiency vs SAIDI based on 2004 Information Disclosure Data
8.4.2 Asset Utilisation Performance
Asset utilisation is a key driver of long-term asset efficiency. Generally Powerco performance
was good when compared to the targets set. Zone substation utilisations in Valley and
Tauranga regions are much closer to target than they were in the July 2004 plan due to
significant the use of the sustained peak load rather than the 1/2 hourly peak load in the
calculation and because of the investment in increased transformer capacity.
The load factor and substation transformer utilisation were in the good performing range when
compared to national and international benchmarks.
The distribution transformer utilisation was slightly under the national average of 32.5%. It is
typical for less dense networks to have a lower distribution transformer utilisation due to the
low diversity of rural distribution substations. Lower utilisation factors are also observed in
widespread networks where weather and demographic trends lead to non-coincidence of local
versus regional consumption patterns.

Section 8
Subject Performance Measurement and Review
Date Issued 30 June 2005
Page 167
Powerco Limited Asset Management Plan – Electricity Networks 2006 - 2020
Table 8.4: Asset Utilisation Performance Measures
Performance Powerco Actual FYE 2005 Target
Measure Man Tar Tau Val Wai Wan Total
Substation Transformer Utilisation. Note 1
51% 44% 52% 65% 60% 60% 54% 58%
Distribution Transformer Utilisation by Supply MD. Note 2
29% 28% 31% 29% 26% 27% 28% 30%
Distribution Transformer Utilisation by Disaggregated Feeder MD. Notes 2, 4
41% 37% 31% 45% 39% 37% 38% 38%
Load Factor Note 3 65% 68% 59% 69% 61% 60% 67% 60%
Line Losses Note 5 6.3% 5.8% 5.9% 4.8% 6.0% 5.5% 5.6% -
Notes: 1. Zone substation transformer utilisation is the substation maximum demand over the total substation ONAN rating
expressed as a percentage. 2. Distribution transformer utilisation is calculated for both aggregated and disaggregated demand.
Aggregated: Network kW MD over distribution transformer capacity. 3. Disaggregated: Sum of disaggregated feeder MDs over distribution transformer capacity. Note that the
aggregated factor is lower due to power factor. 4. Load factor is the ratio of (Network kWh)/(Network MD kW x 365 x24) 5. Feeder capacity utilisation is the disaggregated feeder MD over the total distribution feeder winter 6pm capacity.
It cannot be reasonably calculated yet due to incomplete data. 6. Line losses calculation is based on historical 'kWh Sold' figures because up to date information is not available
from all retailers. 7. While disaggregated distribution transformer utilisation has been calculated the results should be treated with
some caution. Feeder MD results were not available for some feeders and some feeders supply loads directly (not via distribution transformers). These feeders have been removed from the average. Tauranga's result is strongly affected by these limitations
8.4.2 Cost Performance
Powerco’s direct cost performance is presented in Table 8.5 below. The actual performance
for FY2005 was under target (11% favourable).
Table 8.5: Powerco’s Direct Cost Performance
Actual Performance Measure
2001 2002 2003 2004 2005
Direct Costs/km 1152 949 1013 1164 1052 (Note 2)
Note: 1. The actual direct costs include the network operating costs which include network utility rates from FY2004,
maintenance, asset management group and network operating centre costs. 2 The 2005 figure is draft and subject to review when the Information Disclosure figures have been audited.
Figure 8.12 presents a graph of direct costs versus SAIDI using the FY2004 information
disclosure information. It presents a view of the key cost and service component. Powerco is
in the good performing category when compared to the industry, whose average direct costs
per km is $1181/km.

Section 8
Subject Performance Measurement and Review
Date Issued 30 June 2005
Page 168
Powerco Limited Asset Management Plan – Electricity Networks 2006 - 2020
Direct Cost per km vs SAIDI
0
500
1000
1500
2000
2500
3000
0 50 100 150 200 250 300 350 400 450 500 550 600
SAIDI (Class B & C)
Dir
ect
Co
st p
er k
m (
$/km
) Non Powerco Networks FY2004
Powerco FY2004
Powerco FY2005 Actual
Powerco FY2006 Target
Figure 8.12: Direct Costs vs SAIDI based on Information Disclosure Data
8.5 Review of Safety Performance Powerco Energy Services Limited and other Contracted Service Providers perform all
construction and maintenance work on Powerco’s network. The health and safety
programmes of all are audited and field safety audits are conducted to confirm compliance. In
the FY2005 year there were 6 lost time accidents on the network. All incidents are fully
investigated and any recommended actions or non-conformance issues are logged and
followed up until completion.
8.6 Review of Environmental Performance During FY2005 no significant environmental incidents occurred on Powerco’s network. All
Service Providers are required to comply with Powerco environmental policy which includes,
for example, the active use of oil spill kits whenever handling oil or working on oil filled assets.
8.7 Review of Physical Performance Against Plan The physical progress of development, renewal and maintenance activities for FY2005 is
summarised below.
The capital works programme (development and renewal activities) was substantially
completed. There was some work deferred but the high priority work has largely been
completed.
The maintenance work programme was largely completed. The outstanding maintenance has
been incorporated into the FY2006 maintenance plan.
8.7.1 Subtransmission Development Performance
Major Western region subtransmission and zone substation development and equipment
replacement progress against the FY2005 plan is summarised in Table 8.6 below.

Section 8
Subject Performance Measurement and Review
Date Issued 30 June 2005
Page 169
Powerco Limited Asset Management Plan – Electricity Networks 2006 - 2020
Table 8.6: Western Region 2005 Subtransmission Projects Status
Location Project Status at 31 March 2005
Kairanga substation Additional 33 kV circuit breaker Deferred to 2006 Mangamutu substation Install 7.5MVA transformers ex Keith St Completed Kimbolton substation Replace 33kV fault thrower with a circuit breaker Deferred to 2006 Parkville, Alfredton & Pongaroa substations
Determine optimum configuration of these substations Pending
Turitea substation Automated 33 kV switching Deferred to 2006 Bulls substation 11kV link to Sanson substation May be reinstated
depending on Ohakea requirements
Castlecliff substation Replace 7.5MVA transformer with existing 10MVA unit Deferred to 2006 Mataroa Establish new zone substation and install 2 sets of
regulators Deferred for further investigation
Peat St substation Install existing second transformer Deferred to later 2006
Rata Install 22kV regulators between Rata and Pukepapa Deferred to 2007
Cardiff Install reconditioned transformer T4 Completed
McKee substation Replace transformers and rebuild substation Cancelled Manaia substation New 11 kV switchgear Completed Gladstone substation Replace substation with regulators Deferred to 2006 Akura and Te Ore Ore substations
Implement 33 kV closed ring operation Deferred to later 2005
Chapel substation Purchase new site Pending Kai Iwi substation Investigate waterworks reliability requirements Deferred to 2006
Major Eastern region subtransmission and zone substation development and equipment
replacement progress against the FY2005 plan is summarised in Table 8.7 below:
Table 8.7: Eastern Region 2005 Subtransmission Project Status
Location Project
Status at 31 March 2005
Te Puke substation Install 2 new 16 / 24 MVA transformers Completed
Waihi Rd substation Install 2 new 16 / 24 MVA transformers In progress
Waihi Rd substation Install new 11 kV switchgear Completed
Whitianga substation Install new 12.5 / 17 MVA transformer Completed
Matatoki substation Install ex Whitianga 7.5 MVA transformer Completed
Triton substation Install 33 kV cable to separate present dual circuit 33 kV lines In progress
Kopu - Kerepehi 66kV reconstruction In progress
Tauranga – Kaitemako – Te Matai
Upgrade Tauranga - Kaitemako - Te Matai 33kV O/H conductor (stage 2)
In progress
Otumoetai substation 33kV breaker and protection installation Completed Greerton – Wairoa – Te Matai
Upgrade O/H conductor - Stage 2 In progress
Katikati Procure zone substation site Pending
Papamoa Fit fans and pumps to T6 In progress
Welcome Bay Fit fans and pumps to transformers Pending
Thames substation Install oil containment In progress
Lake Rd substation Install fans on transformer Deferred to 2006
Kopu – Corogflen Reinforce 66 kV line Deferred to 2007
Thames Obtain easement for second 66 kV line Deferred to 2007
Whangamata Obtain easement for second 33 kV line Completed
Waihou – Piako 33 kV line reconfiguration, stage 1 Deferred to 2006
Piako substation Install fans on transformers Completed
Tirau – Putaruru Easement for second 33 kV line, superceded by Putaruru GXP proposal
Cancelled

Section 8
Subject Performance Measurement and Review
Date Issued 30 June 2005
Page 170
Powerco Limited Asset Management Plan – Electricity Networks 2006 - 2020
8.7.2 Medium Term Development Performance
The Medium Term Development Plan has been rolled out in both the Eastern and Western
regions this year although there are still some discrepancies between the data reported on
between the regions. The MTDP can now be used to drive further network modelling and the
inclusion of projects it suggests into the Electricity Work Plans.
8.7.3 Protection and Control Development Performance
The following tables indicate the status of protection, communications and SCADA projects in
the FY2005 plan:
Table 8.8: FY2005 Protection Project Status
Region Development Project Status at 31 March 2005
Wairarapa Akura – Te Ore Ore 33kV Ring protection upgrade 95%
Manawatu Implement Milson Sub protection review Completed
Manawatu Kelvin Grove sub - 33kV protection upgrade Completed Manawatu Mangamaire (GXP) - 33kV protection upgrade Completed Manawatu Tararua network protection review Completed Manawatu Rural substations – Implement protection review Completed Tauranga Tauranga 33kV - Protection upgrade In progress
Valley Implement Hinuera system protection review Completed
All districts General renewals Completed / ongoing
All districts General review implementation Completed / ongoing
Manawatu Tararua Wind Farm 33kV protection review and changes for expansion of the Wind Farm.
Completed
Taranaki Cloton Road protection upgrade investigation and report Report completed, implement in 2006
Table 8.9: FY2005 Communications Project Status
Substation
Development Project Status at 31 March 2005
Various Review/Upgrade communications – To facilitate interrogation of modern relays.
In progress at 6 substations
Various Install time-synchronisation facilities to substations with modern protection relay equipment
In progress at 6 substations
Table 8.10: FY2005 SCADA Project Status
Substation
Development Project Status at 31 March 2005
Various Line fault locators and RTU’s / Communications 1 complete 7 deferred to 2006
Various Line circuit breaker control upgrades Deferred 2006 Various Line circuit breakers, install SCADA control to key line CB’s Complete. Requirements
continued to be monitored. Whareroa Upgrade zone sub RTU modules – SCADA development In Concept Design Livingstone Upgrade zone sub RTU modules – SCADA development In Concept Design Kapuni Upgrade zone sub RTU modules – SCADA development In Concept Design Various Review/Upgrade load control facilities In progress Kempton Upgrade SCADA RTU In progress Clareville Upgrade SCADA RTU In progress Akura Upgrade SCADA RTU In progress Featherston Upgrade SCADA RTU Completed Manaia Upgrade SCADA RTU Completed

Section 8
Subject Performance Measurement and Review
Date Issued 30 June 2005
Page 171
Powerco Limited Asset Management Plan – Electricity Networks 2006 - 2020
Substation
Development Project Status at 31 March 2005
Whitianga Upgrade SCADA RTU Completed Wanganui East
Install SCADA RTU Completed
Rata Install SCADA RTU Completed Roberts Ave Install SCADA RTU Completed
8.8 Review of Financial Progress Against Plan The financial progress against plan is summarised by asset category in Tables 8.11 and 8.12
below. Commentary on the variance between actual and budget is also provided.
8.8.1 Capital Expenditure
Western and Eastern region variance to planned capital expenditure was 28% behind the
planned budget at end FY2005.
In the Western region despite being successful at issuing the works programme projects to
our service providers, traction on completing the capital programme was poor due to field
resource constraints. Field resource constraints are not just a Powerco issue, but are an
industry issue, and will be subject to specific attention during the coming year. Most
uncompleted projects will be incorporated into the FY2006 plan.
In the FY2004, actual capital expenditure in the Eastern Region was higher than the AMP
budget. There were three reasons for this, firstly that the original budget was based on that of
the previous owners and this has now been increased. Secondly, for subdivision work, the
load forecast always tends to lag the expenditure due to uptake rates and building times.
Thirdly, we updated our load forecasts in previous years to reflect the high levels of load
growth occurring in the Eastern Region.
Table 8.11: Capital Expenditure Summary Asset Type Capital Expenditure 2005 ($000) Actual Budget Variance
Overhead Lines 8,965 11,324 2,359
Underground Cables 10,431 12,824 2,393
Distribution and Subtransmission Switchgear 2,437 3,664 1,227
Distribution Transformers 7,723 7,438 -285
Zone Substation Assets 3,267 10,156 6,889
Total 32,822 43,896 11,074
8.8.2 Maintenance Expenditure:
The severe and prolonged series of storms in February 2004 that pushed reactive
maintenance costs up for all categories of overhead lines in the Western region continued to
affect maintenance due to the general weakening of the network in the area and higher than
normal fault and repair jobs required, producing an end of year variance of 19% for overhead

Section 8
Subject Performance Measurement and Review
Date Issued 30 June 2005
Page 172
Powerco Limited Asset Management Plan – Electricity Networks 2006 - 2020
lines. This flowed through to an overall budget variance of 3% for Western region
maintenance.
Several cable failures in the western region resulted in a 10% over variance for underground
cables. Normal preventative maintenance on zone substation, distribution transformers,
switchgear and cables was carried out, and closely followed budget. Except for the noted
variance of underground cables individual variances on these assets mostly came to within 2
to 3 percent of year-end budget in the Western region. Some planned zone substation asset
refurbishment was not carried out due to low priority requirement and will be rescheduled.
Table 8.12: Maintenance Expenditure Summary Asset Type Maintenance Expenditure 2003 ($000) Actual Budget Variance
Overhead Lines 6,406 7,068 662
Underground Cables 2,010 1,757 -253
Distribution and Subtransmission Switchgear 2,214 2,761 547
Distribution Transformers 2,781 3,109 328
Zone Substation Assets 3,765 4,890 1,125
Total 17,176 19,586 2,410
8.9 Review of Progress Against Risk Management Activities Progress with the “at-risk” situations is reported on in Section 7.4 of this report.
8.10 Improvement Initiatives
8.10.1 Network Improvement Sub-process
The purpose of the Network Improvement sub-process is to proactively monitor service quality
issues and improve network service performance. The objective is to ensure the networks
deliver the required performance and that any substandard performance is addressed
promptly and effectively.
The Network Improvement sub-process includes both reactive (short term) and proactive (long
term) performance management elements, and provides important feedback to the planning
process.
8.10.2 Summary of Improvement Initiatives Undertaken in FY2005
Various improvement initiatives were undertaken in FY2005, with many centred on improving
the reliability of under-performing feeders. Improvement initiatives continually being
implemented are summarised below:
• Use of generators to reduce planned outages;
• Careful management of planned shutdown SAIDI allowances;
• Temperature and previous load based cyclic rating of zone substation transformers;
• Fusing of various spur lines;
• Review and implementation of protection settings and scheme designs;

Section 8
Subject Performance Measurement and Review
Date Issued 30 June 2005
Page 173
Powerco Limited Asset Management Plan – Electricity Networks 2006 - 2020
• Commissioning of new sections of feeder to enhance backup of existing poor performing
feeders;
• Removal of redundant air break switches;
• Replacement of older reclosers with modern automated reclosers;
• Installation of automated distribution switches;
• Review of the lightning protection standards and implementation of an upgrade program;
and,
• Vegetation control targeted from network reliability performance.

Section A
Subject Appendices
Date Issued 30 June 2005
Page 174
Powerco Limited Asset Management Plan – Electricity Networks 2006 - 2020
APPENDIX 1: EXCERPTS FROM RISK MANAGEMENT CHARTER
Background Powerco’s historical approach to risk management has been fragmented, in the form of ad hoc
systems of risk control; for example hazard controls in the workplace and disaster recovery
plans.
The Executive Management Team has identified the need for an efficient, effective and
demonstrable Risk Management Process within Powerco, which forms an integral part of the
company’s management process.
This document describes Powerco’s Risk Management Charter, which is consistent with and
builds on the established principles of risk management as detailed in: -
• Australian/New Zealand Standard – Risk Management (AS/NZS 4360:1999)
• Standards Australia – A Basic Introduction to Risk Management (SAA HB142 – 1999)
• Australian/New Zealand Standard – Guidelines for Managing Risk in the Australian and
New Zealand Public Sector (SAA/NZS HB143:1999)
• Risk Financing Guidelines (SAA HB141-1999)
This Charter is produced under the authority of the Audit Committee, which has endorsed the
document for the approval of the Board.
This is a controlled document within the Powerco Quality Management System and any future
updates will be in accordance with that system. Any enquires should be directed to the
Corporate Risk Manager.
Risk Management Policy The Chief Executive has issued a Risk Management Policy, as set out below, which has been
endorsed by the Executive Management Team, who wish to emphasise that risk management
is a critical aspect of the effective internal management of Powerco.

Section A
Subject Appendices
Date Issued 30 June 2005
Page 175
Powerco Limited Asset Management Plan – Electricity Networks 2006 - 2020
Risk Management Overview
Objectives
The objectives of the establishment of an integrated risk management process within Powerco
are to: -
• Ensure that significant risks currently faced by the business are understood and managed;
• Develop an organisation-wide approach to business risk, including a common business
risk language;
• Prioritise risks on a business process basis rather than departmental basis;
Powerco’s Risk Management Policy
The governance of Powerco lies with the Board and is defined in Powerco’s Corporate Governance Charter. The Executive Management Team has the responsibility and accountability for the representation, direction and business success of Powerco. This requires a management process, which includes a flow of information to and from the Chief Executive and the Board. All aspects of Powerco’s activities need to be included in this process, including exposure to risk, which is therefore a critical aspect in the effective discharge of management responsibilities. The Board is accountable for risk within Powerco but delegates policy execution to the Executive Management Team. In order to ensure that risk management is recognised and treated as a core competency, Powerco has implemented a coordinated framework for the management of risk as detailed in the Risk Management Charter. This will ensure that a formal and consistent process of risk identification, assessment, acceptance and treatment is carried out company wide. Particular emphasis is placed on exposure to business and safety risks that may exist in the short to medium term. In managing the areas of significant risk, the Risk Management Charter provides for: - • The identification of Powerco’s Major Risk Areas incorporating all relevant programmes,
processes, projects, activities and assets. • A standard framework and templates for the identification, assessment, acceptance and/or
mitigation of risks across all Major Risk Areas. • Regular reporting of changes in the status of risks profiles, to alert management to any critical
developments in Powerco’s overall Risk Management Profile. • Regular reporting to the Board on the levels of risk and management of that risk in all Major
Risk Areas. • Reappraisal of Risk Management Plans by the Executive Management Team at six monthly
intervals with findings reported to the Board through the Audit Committee Steven Boulton Chief Executive

Section A
Subject Appendices
Date Issued 30 June 2005
Page 176
Powerco Limited Asset Management Plan – Electricity Networks 2006 - 2020
• Heighten awareness of risk and ensure that risk is considered in all decision making
processes;
• Ensure that there is a balance of management effort in relation to Opportunity Risks and
Hazard Risks;
• Ensure that all Powerco personnel are aware of their responsibilities in dealing with risks;
• Ensure that significant risks are adequately monitored and controlled, through formal
documentation and appropriate reporting channels; and
• Ensure that adequate residual risk treatments such as insurance or internal funding are in
place.
Benefits of Effective Risk Management
The key benefits to Powerco and Powerco personnel of an effective risk management process
are as follows: -
• Facilitates better quality service delivery;
• Protects personnel, intellectual property and assets;
• Fosters legal and regulatory compliance;
• Minimises the potential for litigation;
• Promotes public, employee and consumer safety;
• Achieves higher profitability through reduced expenses; and
• Promotes effective internal management controls.
Process
The process for the management of risk in Powerco is based on that described in SAA/NZS
HB143: 199 Guidelines for Managing Risk in the Australian and New Zealand Public Sector.
The following diagram is an overview of that process: -

Section A
Subject Appendices
Date Issued 30 June 2005
Page 177
Powerco Limited Asset Management Plan – Electricity Networks 2006 - 2020
Establish the context
Identify risks
Analyse risks
Evaluate risks
Treat risks
Risk management overview (AS/NZS 4360:1999)
Com
mun
icat
e an
d co
nsul
t
Mon
itor
and
revi
ew
Risk Management Overview
Assess risks
Analyse risks
Evaluate risks
Main Elements
The main elements of the risk management process include the following: -
• Establish the Context: this step establishes the strategic, organisational and risk
management context in which the rest of the process takes place. For the purposes of the
initial implementation of the risk management process, criteria against which risk will be
assessed is established and the structure of the analysis defined.
• Identify Risks: identify Major Risk Areas and within those areas determine what, why and
how things can arise as the basis for further analysis.
• Evaluate Risks: determine the existing business processes and analyse risks in terms of
probability of occurrence and impact in the context of those business processes. The
analysis should consider:
• The likelihood of an event occurring; and
• The potential consequences and their magnitude.
• Assess and Prioritise Risks: compare estimated levels of risk against the pre-established
criteria. Risks are then ranked to identify management priorities and appropriate action
plans. The objective of this phase is to separate the major (or material/significant) risks,
which require attention from the minor acceptable risks.
• Risk Response: accept and monitor low-priority risks. For other risks develop and
implement a specific management plan.

Section A
Subject Appendices
Date Issued 30 June 2005
Page 178
Powerco Limited Asset Management Plan – Electricity Networks 2006 - 2020
• Monitor and review: monitor and review the performance of the risk management process
and changes that might affect it.
The diagram below illustrates the key roles and components of the risk management process
.
Key Roles and Components in Risk Management
BOARD
AUDITCOMMITTEE
EXECUTIVE MANAGEMENT
TEAM
RISK CUSTODIANS
Risk management requirementsRisk Management Charter
Risk Management CharterRisk management strategies
Clear responseEffective "buy-in"
Strategic Risk Management Framework
Reports / compliance certificates
Business Unit / Process Risk Management Profiles
Controls / self assessment
PERSONNEL
Business Unit / Process Risk Management Plans
Delegations and accountabilities
Plans, Monitoring and Reporting
Risk management is an on-going cyclic process, as illustrated by the diagram below.

Section A
Subject Appendices
Date Issued 30 June 2005
Page 179
Powerco Limited Asset Management Plan – Electricity Networks 2006 - 2020
The on-going monitoring and evaluation of risks and their management is conducted in the
manner described below.
Audit Committee
The Audit Committee is responsible to the Board for the governance of the Risk Management
Process. Whilst the Risk Management Plans, draw up by the Risk Custodians are signed-off
by the Executive Management Team, there must be an effective channel of communication
through to the Audit Committee and Board.
Approval
The communication and approval requirements are achieved by a quarterly reporting and
review process in which reports are produced by the Risk Custodians and presented to the
Executive Management Team for discussion. When accepted these reports are summarised
Powerco's Risk Management Cycle
Full risk
Identification & Evaluation
Corporate Risk Management Coordination
Risk response evaluation
Development /
Modification of
Risk Management
Plans
Quarterly
Monitoring &
Review of Risk
Profiles
Consolidated Reporting

Section A
Subject Appendices
Date Issued 30 June 2005
Page 180
Powerco Limited Asset Management Plan – Electricity Networks 2006 - 2020
by the Corporate Risk Manager, signed-off by the Executive Management Team and
presented to the Audit Committee for approval.
At six monthly intervals each Risk Management Plan is to be thoroughly reviewed by the
assigned Risk Custodian and the results reported back to the Executive Management Team.
Any revisions to the plans follow the same process as new plans with a sign-off required by
the Executive Management Team.
Quarterly Management Review
The Risk Custodians should review the detailed Risk Profile for each Major Risk Area
assigned to them on a quarterly basis. At these reviews it should be identified whether there
are any new perceived risks which need to be added to the Risk management Plan or whether
existing risks need to be reassessed or are no longer relevant. In particular where new
projects, processes or initiatives have been introduced; the Risk Custodian should consider
what risks it is imposing on Powerco and amend the appropriate Risk Management Plan
accordingly. It is possible that some instances of crossover between Major Risk Areas could
occur here and so Risk Custodians need to communicate with each other and with the
Corporate Risk Manager in a coordinating and supporting role as appropriate. This quarterly
review should ensure that all material risks are being identified and that management is
satisfied with their current risk profiles.
Reporting
Risk Custodians should provide a Risk Management Report for their assigned Major Risk
Area(s) on a quarterly basis. This report will document the findings and actions from the
quarterly management review process. This will include:
• Any alterations or additions to the Risk Attributes and/or Risk Responses
• An update of the action list including any new actions
• An amended Risk Management Profile if appropriate attached
The completed report should be forwarded to the Corporate Risk Manager with a copy
attached to the appropriate Risk Management Plan as an addendum.
Six Monthly Reviews
Every six months each Risk Custodian should take a fresh and rigorous risk management
review on the Risk Management Plan. This should be more than a simple roll-forward of
existing Plans but rather a full review, interviewing relevant employees and establishing Plans
based on any new findings. The amount of time taken up by this process however should be
minimal given that the quarterly review process has been thorough. Such review should
include checks to ensure that:
• All key strategies for managing risk are included;
• Any opportunity risk is identified;

Section A
Subject Appendices
Date Issued 30 June 2005
Page 181
Powerco Limited Asset Management Plan – Electricity Networks 2006 - 2020
• One best KPI of the management risk is provided; and
• All current and future actions set out in the Plan are directed towards managing risk.
The new and revised Plans should be presented, through the Corporate Risk Manager, to the
Executive Management Team for sign-off. A summary report should explain the significant
changes from the previous Plan and provide comment on the effectiveness of mitigating
controls during the prior six-month period. The Corporate Risk Manager will then compile a
summary report and revised overall Risk Management Profile through the Audit Committee to
the Board.
This process of re-performing the identification and analysis on a six-monthly basis will ensure
that the concepts behind the Risk Management Process remain fresh and it will encourage
broader thinking than a review of an existing risk summary might elicit.
Once the Risk Management Process is established the six-monthly review cycles will be timed
for November and May, so that the former fits into Powerco’s strategic planning and budget
cycle. As part of the annual business review process the Executive Management Team will
assess the Risk Management Process cycle to determine if any adjustments are deemed
appropriate.
Review and Reporting Cycle
Function Frequency Date Establishment of Risk Management Process & Risk Management Plans
Once As approved
Review and report on Risk Management Plans Quarterly November February May August
Revise and up-date Risk Management Plans Six Monthly May November
This date cycle coincides with the biannual survey and reporting in Powerco’s Statutory
Compliance Programme.
Consolidated Monthly Reporting
The Risk Custodians are responsible for the on going Operational Risk Management Plans
and for the quarterly and six-monthly review processes. Information will be extracted from
these plans for consolidated monthly reporting of the status of each Risk Response including
all outstanding items on the Risk Control Action Plan. The Corporate Risk Manager is
responsible for the consolidation of this information and reporting to the Executive
Management Team and the Board each month.

Section A
Subject Appendices
Date Issued 30 June 2005
Page 182
Powerco Limited Asset Management Plan – Electricity Networks 2006 - 2020
Powerco Consolidated Risk Register
1.1.1.1.1.1.1.1.1Priority A/B/C
Major Risk Area
Risk Custodian
Last Review
Date
Outstanding Actions
Price control threat
A Regulation & Legal
Corporate Risk
Nov’00 1. Meet with Commerce Commission
Risk Priority
In order to provide a common basis on which to view and compare all business risks identified
in all Major Risk Areas, each risk is assigned a priority derived from the evaluated
consequential impact and residual risk probability on the following basis: -
Priority A (Red) - Risks assessed as HIGH impact and/or probability
Priority B (Blue) - Risks assessed as MEDIUM impact and/or probability
Priority C (Green) - Risks assessed as LOW impact and probability
Risk Register
Each individual risk identified in the Operational Risk Management Plans is entered onto
Powerco’s Consolidated Risk Register. This listing is reported in priority order and identifies
the review dates and outstanding actions for each risk. The format for the Consolidated Risk
Register is showing in the following example: -
Business Risk Map
The Business Risk Map is a graphical representation of the identified individual risks plotted
onto a similar grid to the Risk Profile Summary. This provides a quantitative analysis of the
numbers of risks of each priority that fall into each sector of the profile of impact v probability.
The format of the Business Risk Map is shown in the following example: -

Section A
Subject Appendices
Date Issued 30 June 2005
Page 183
Powerco Limited Asset Management Plan – Electricity Networks 2006 - 2020
Powerco Consolidated Business Risk Map
Û Earthquake
Û Customer Credit
Û Work Hazards
Û GXP Loss
Û Treasury
Û Major Storm
Ù Info.Systems
Ù Network Capacity
Ù Load Shedding
Ù Asset Planning
Ù Environ. Damage
Û Price Control
Û Generator Failure
Co
nse
qu
enti
al Im
pac
t
Ö Pricing Methodology
Ö Ù Tech. Obsolescence Û Lightning
Û

Section A
Subject Appendices
Date Issued 30 June 2005
Page 184
Powerco Limited Asset Management Plan – Electricity Networks 2006 - 2020
APPENDIX 2: SUBTRANSMISSION MAPS Manawatu Region Subtransmission Map

Section A
Subject Appendices
Date Issued 30 June 2005
Page 185
Powerco Limited Asset Management Plan – Electricity Networks 2006 - 2020
Taranaki Region Subtransmission Map

Section A
Subject Appendices
Date Issued 30 June 2005
Page 186
Powerco Limited Asset Management Plan – Electricity Networks 2006 - 2020
Tauranga Region Subtransmission Map

Section A
Subject Appendices
Date Issued 30 June 2005
Page 187
Powerco Limited Asset Management Plan – Electricity Networks 2006 - 2020
Valley Region Subtransmission Map

Section A
Subject Appendices
Date Issued 30 June 2005
Page 188
Powerco Limited Asset Management Plan – Electricity Networks 2006 - 2020
Wairarapa Region Subtransmission Map
Wanganui Region Subtransmission Map


![Asset disclosure and political selection: Evidence from India … · 2020-05-30 · Asset disclosure and political selection: Evidence from India [VERY PRELIMINARY AND NOT FOR CIRCULATION]](https://img.dokumen.tips/doc/110x75/5f079b9b7e708231d41dd50b/asset-disclosure-and-political-selection-evidence-from-india-2020-05-30-asset.jpg)