Embed Size (px)
Citation preview

Pacific-Basin Finance Journal 21 (2013) 1116–1135
Contents lists available at SciVerse ScienceDirect
Pacific-Basin Finance Journal
j ourna l homepage: www.e lsev ie r .com/ locate /pacf in
Information asymmetry, price discovery, and the ChineseB-share discount puzzle☆
John A. Doukas a,1, Liu Wang b,⁎a Department of Finance, College of Business & Public Administration, Old Dominion University, Norfolk, VA 23529, USAb Department of Finance, School of Business, Providence College, Providence, RI 02918, USA
a r t i c l e i n f o
☆ We thank the anonymous referee and Editor Ghoimproved the quality of this paper.⁎ Corresponding author. Tel.: +1 401 865 1883.
E-mail addresses: [email protected] (J.A. Doukas)1 Tel.: +1 757 683 5521.
0927-538X/$ – see front matter © 2012 Elsevier B.V.http://dx.doi.org/10.1016/j.pacfin.2012.08.004
a b s t r a c t
Article history:Received 11 October 2011Accepted 22 August 2012Available online 5 September 2012
This paper addresses the information asymmetry between Chineselocal A-share and foreign B-share markets and its impact on theB-share discount puzzle, contingent upon Chinese stock marketliberalization reforms in 2001 and 2002. In contrast with thewidespread notion that domestic investors are better informed thanforeign investors, this study shows that foreign investors actuallypossess more value-relevant, firm-specific information in emergingmarkets, where information transparency and investor protectionrights are relatively weak. As such, the observed B-share discount isnot compensation for the informational disadvantage of foreigninvestors but, rather, the result of a downward price correction(toward the fundamental values) once more firm-specific informa-tion is capitalized by sophisticated foreign investors in the B-sharemarket. The price correction effect is significant even after controllingfor several alternative explanations. Further investigation suggests amitigated degree of information asymmetry and B-share discountupon market liberalization.
© 2012 Elsevier B.V. All rights reserved.
JEL classification:G12G14G15
Keywords:Information asymmetryB-share discountPrice synchronicityMarket liberalizationChina
1. Introduction
As capital markets become more and more globally integrated, the issue of information asymmetry ininternational equity markets is becoming increasingly crucial. Despite general agreement on the presenceof information asymmetry, the issue of whether or not domestic investors are better informed than foreigninvestors remains controversial, especially in emerging contexts. Some researchers argue that domestic
n Rhee for their valuable comments and suggestions, which substantially
, [email protected] (L. Wang).
All rights reserved.
1117J.A. Doukas, L. Wang / Pacific-Basin Finance Journal 21 (2013) 1116–1135
investors are better informed because they have linguistic, cultural, and regulatory advantages (e.g.,Brennan and Cao, 1997; Chakravarty et al., 1998; Chan et al., 2008), whereas others point out thatforeign investors have an informational advantage in emerging markets because they are moreexperienced and subject to less information censorship (e.g., Chui and Kwok, 1998; Grinblatt andKeloharju, 2000).
In the context of China, one major contribution of the information asymmetry analysis is that it pointsto a possible explanation for the Chinese B-share discount puzzle. Prior to Chinese stock marketliberalization reforms,2 Chinese firms could issue two classes of stocks, identical in all aspects except fortheir ownership restrictions: A shares, which could only be held and traded by Chinese domestic investors,and B shares, which could only be held and traded by foreign investors. As a result, the Chinese stockmarket is divided into two separate markets: the local A-share and foreign B-share markets. In segmentedmarkets where companies issue restricted shares that are only available to domestic investors andunrestricted shares that can be held and traded by foreign investors, unrestricted shares are tradeduniformly at a premium relative to their restricted counterparts (e.g., Bailey et al., 1999). In China,however, unrestricted B shares are traded at a large discount, a fact that is often referred to as the “ChineseB-share discount puzzle” (Bailey et al., 1999; Bailey and Jagtiani, 1994; Chan et al., 2008; Yang and Lau,2005). This sharp contrast has attracted a substantial body of research, among which the most influentialis the uninformed foreign investor hypothesis. The idea is that due to language barriers, differentaccounting standards, and weak access to local information, foreign investors often have less informationthan domestic investors, and, hence, require a higher premium (stock price discount) in the B-sharemarket (e.g., Chakravarty et al., 1998; Chan et al., 2008). A major deficiency of this argument stems fromits generalizability to emerging markets.
In an environment with limited investor protection, ineffective legal enforcement, and ill-functioningaccounting–auditing systems, the presumption that domestic investors are in possession of sufficientvalue-relevant information is unwarranted. In fact, Chinese investors are found to be speculators who tradeon rumors rather than informed investors who trade on fundamentals (e.g., Ma, 1996; Mei et al., 2003), andthe price movements of Chinese stocks are found to be highly synchronous with the movements of themarket rather than reflecting firm-specific information (e.g., Chan and Hameed, 2006; Morck et al., 2000).The fact that Chinese domestic A shares are not informative per se has been a large factor in questioning theuninformed foreign investor interpretation of the B-share discount puzzle. Moreover, many recent studiesindicate that foreign investors tend to be more informed than domestic investors in emerging marketswhere the institutional environment is weak (e.g., Chui and Kwok, 1998; Yang, 2003).
The ongoing debate over the issue of whether or not domestic investors are better informed thanforeign investors in emerging markets gives rise to the first motivation of this study. Using a panel sampleof Chinese firms that issue both local A and foreign B shares, we find that foreign investors are actuallymore informed than domestic investors in an emerging market such as China. Built upon this “informedforeign investor” hypothesis, the study also offers an alternative explanation for the B-share discountpuzzle. As empirical evidence indicates, with informed foreign investors and inherent stock misvaluation,the observed Chinese B-share discount is not compensation for the informational disadvantage of foreigninvestors but, rather, the result of a downward price correction (toward the fundamental values) oncemore firm-specific information is capitalized by sophisticated foreign investors in the B-share market.Moreover, while the impact of market liberalization on the evolution of the Chinese stock market hasstimulated a growing body of research, the focus is primarily on the first liberalization reform, i.e., theopening of the foreign B-share market to Chinese domestic investors on February 19, 2001. The secondreform, i.e., the opening of the domestic A-share market to qualified foreign institutional investors (QFII)on November 5, 2002, is largely ignored. For instance, Karolyi et al. (2009) define the pre-liberalizationperiod as February 1, 2001–February 19, 2001, and the post-liberalization period as February 28, 2001–April 1, 2001; Chan et al. (2007) define the pre-liberalization period as January 10, 2000–February 19,2001, and the post-liberalization period as February 20, 2001–November 8, 2001; and Karolyi and Li(2003) define the pre-liberalization period as January 1, 1999–February 19, 2001, and the post-liberalization period as February 20, 2001–December 31, 2001. Evidence on the post-liberalization period
2 The opening of the foreign B-share market to Chinese domestic investors on February 19, 2001 and the opening of the domesticA-share market to qualified foreign institutional investors (QFII) on November 5, 2002.
1118 J.A. Doukas, L. Wang / Pacific-Basin Finance Journal 21 (2013) 1116–1135
generated from these studies may capture nothing but abnormal fluctuations between the two regulatoryreforms. Hence, unlike previous studies that focus exclusively on the opening of the foreign B-sharemarket to domestic investors (e.g., Chan et al., 2007; Karolyi, et al., 2009; Karolyi and Li, 2003), this studyaddresses the more fundamental question of whether, and to what extent, the Chinese marketliberalization reforms—that is, the opening of the foreign B-share market to Chinese domestic investorson February 19, 2001 and the opening of the domestic A-share market to QFII on November 5, 2002—influenced the patterns of information asymmetry and the B-share discount.
This study contributes to the literature in several dimensions. First, it challenges the prevailing viewthat domestic investors are better informed than foreign investors and extends our understanding ofhow unique institutional environments can shape the information context in a particular country.Founded upon the informed foreign investor hypothesis, this study also points to another possibleexplanation of the Chinese foreign share discount puzzle. In particular, the B-share discount can beexplained as a result of a downward price correction (toward the fundamental values) once morefirm-specific information is capitalized by sophisticated foreign investors in the B-share market.Empirical evidence indicates that the price correction effect is significant even after controlling for otheralternative explanations. Second, this study provides additional clarity in the development ofinformation asymmetry measures. In particular, we find that the literature is populated by a multitudeof measures, many of which are rather ambiguous, resulting in conflicting results regarding the directionof information asymmetry. For instance, Chakravarty et al. (1998) find that domestic investors are betterinformed based on (1) the return sensitivity of B shares to their A-share counterparts (i.e., CovA,B/σA
2),arguing that higher sensitivity indicates less information asymmetry because B-share investors couldobtain more information from A-share prices; (2) the sample variance of B-share returns, where highvolatility suggests more information asymmetry because the prediction of B-share prices is moredifficult; and (3) the number of company citations in the Wall Street Journal index. While these proxieshave some explaining power concerning the degree of information asymmetry, it is not clear whetherdomestic or foreign investors are better informed. Moreover, Chan et al. (2007) find that local A sharesdominate the price discovery process based primarily on Hasbrouck's (1995) information sharesapproach. Note, however, that a necessary condition for Hasbrouck's (1995) model to work is costlessarbitrage. Given that the A and B shares are not perfectly exchangeable and that short selling is legallyforbidden in China, this approach cannot be effectively utilized in analyzing the informativeness ofChinese stocks. Because unwarranted quantifications of inputs inevitably result in misleading results,more robust and consistent measures of information asymmetry have to be developed and utilized. Thepresent paper also bridges this gap. Finally, while the issues of information asymmetry and the Chineseforeign share discount puzzle have stimulated a considerable amount of quality research, there islimited evidence on the impact of market liberalization on the dynamics of information environment,and the second liberalization reform (i.e., the opening of the domestic A-share market) is largelyignored in the extant literature. Using a balanced panel, which spans from October 1997 to September2007, this study effectively examines the impact of market liberalization on the evolution of informationenvironment and the process of price discovery.
The remainder of this paper is organized as follows: Section 2 briefly discusses the development of thehypotheses; Section 3 describes the data and model specifications; Section 4 reports the empirical results,followed by concluding remarks in Section 5.
2. Hypothesis development
2.1. Information asymmetry
Despite the growing importance of the issue of information asymmetry in international equity markets,the question of whether domestic investors are better informed than foreign investors remains controversial,especially in emerging contexts. In the literature, it is widely believed that foreign investors have aninformational disadvantage relative to domestic investors due to the former's lack of linguistic, cultural, andregulatory knowledge and weak access to local information (e.g., Brennan and Cao, 1997; Chakravarty et al.,1998; Chan et al., 2008). In support of the uninformed foreign investor hypothesis, Chan et al. (2008) pointout that foreign investors tend to face more severe information asymmetry in an emerging market such as
1119J.A. Doukas, L. Wang / Pacific-Basin Finance Journal 21 (2013) 1116–1135
China, where firms often hide material changes in their business conditions, corporate managers freelymanipulate firm-specific information, and insider trading is widespread. This is the very case facing theChinese stock market. However, this argument ignores the fact that Chinese domestic investors are likely toface the same situation. With limited investor protection, ineffective legal enforcement, and ill-functioninginformation infrastructure, domestic investors may not necessarily be more informed than foreign investors.In China, investors are frequently regarded as speculators who trade on rumors rather than informedinvestors who trade on fundamentals (e.g., Ma, 1996; Mei et al., 2003), and the price movements ofindividual stocks are found to be highly synchronous with the movements of the market rather thanreflecting firm-level information (e.g., Chan and Hameed, 2006; Morck et al., 2000). The fact that Chineselocal A shares are not informative per se plays a major role in questioning the uninformed foreign investorinterpretation of the B-share discount puzzle.
In this study, we expect foreign investors to be better informed than domestic investors. We justify thisargument on three grounds. First, the disclosure requirement is stricter for firms with foreign B-sharelistings. In China, firms that issue shares to both domestic and foreign investors are required to preparetheir financial statements based on both the Chinese Generally Accepted Accounting Principles (GAAP)and the International Accounting Standards (IAS), whereas firms that issue shares exclusively to domesticinvestors are subject solely to the Chinese GAAP. The higher financial reporting standard in the B-sharemarket will, to a large extent, mitigate information asymmetry between corporate insiders and outsiders.Second, the B-share market is more regulated and subject to less information censorship. The increasedinvestor protection and enhanced information transparency in the B-share market will undoubtedlyfacilitate timely information transmission, and hence, promote informed trading. Third, foreign investorsparticipating in the B-share market are often more experienced and sophisticated than Chinese domesticinvestors in collecting, processing, and analyzing value-relevant corporate information.
In the literature, a popular way to address the direction of information asymmetry is to investigate thelead–lag relation between the two markets (e.g., Chan and Hameed, 2006; Chui and Kwok, 1998; Lo andMacKinlay, 1990; Yang, 2003). In a perfect market with no information asymmetry, all availableinformation should be incorporated into stock prices instantaneously. However, if some investors have aninformational advantage relative to others, then a large portion of information will be impounded intostock prices by uninformed investors with a lag after observing the action of informed investors.Consistent with this argument, Lo and MacKinlay (1990) find that past returns of large firms lead currentreturns of small firms. Badrinath et al. (1995) find that returns on stocks with high institutional ownershiplead returns on stocks with low institutional ownership. Brennan et al. (1993) and Chan and Hameed(2006) find that returns of firms with high analyst coverage lead those of firms with low analyst coverage.These empirical findings point to a single story: There is a significant lead–lag relation between informedand uninformed parties, where uninformed parties tend to follow informed parties in their decisionmaking processes.
Following the literature, we use the vector autoregression (VAR) methodology to investigate the lead–lag relationship between local A and foreign B shares. In the context of this study, the informed foreigninvestor hypothesis implies that information will tend to flow from foreign to domestic investors and thatthe price movements in the B-share market will lead those in the A-share market. Based on the abovediscussion, the following hypothesis is developed:
H1a. Foreign investors are better informed in an emerging market such as China, and the movements in theB-share market lead those in the A-share market.
While the VAR model provides a direct measure of the lead–lag relationship, some caveats should benoted. First, the VAR approach only tells us the direction of information flow; it does not tell us thecontribution of each factor to the process of price discovery. Moreover, observing a dominant pricediscovery role in one market does not necessarily mean that investors trading in that market are betterinformed. It is not clear how well-informed the investors are, nor how value-relevant are the stock prices.In addition, given that the VAR model provides a multidimensional, simultaneous analysis of exogenousvariables, the inclusion of a large number of control variables is often technically impossible. Therefore,while previous studies attempt to draw inferences by relying heavily on the VAR approach (e.g., Yang,2003), in the context of this study it is utilized mainly for exploratory purposes.
1120 J.A. Doukas, L. Wang / Pacific-Basin Finance Journal 21 (2013) 1116–1135
Intuitively, a more direct way to address the direction of information asymmetry is to compare theprice informativeness between the two classes of assets. The idea is that if domestic (foreign) investors arebetter informed, then A-share (B-share) prices should be more informative compared to their B-share(A-share) counterparts.
Drawing on state-of-the-art finance literature (e.g., Chan and Hameed, 2006; Morck et al., 2000; Roll,1988), this study uses price synchronicity to measure stock price informativeness. This stream of researchis developed upon a hypothesized decomposition of information in stock pricing. As Roll (1988) pointsout, the extent to which stocks move together depends on the relative amounts of firm-level andmarket-level information incorporated into stock prices. The idea is that if asset prices can be consideredas a function of both firm-specific and market-wide information, then in an environment with significantimpediments to informed trading, investors will have to rely more on market-wide information, resultingin a higher degree of stock co-movement. In contrast, the price movements will tend to be lesssynchronous in a more transparent environment that encourages informed trading. Empirically, a growingbody of literature consistently provides support for this information-based interpretation of pricesynchronicity. For example, Morck et al. (2000) find that stock prices move together more in emergingmarkets, where reliable firm-specific information is either technically unavailable or prohibitivelyexpensive. Durnev et al. (2003) indicate that the relationship between current returns and future earningsis stronger for firms and industries with low price synchronicity. Durnev et al. (2004) document a positiveassociation between the economic efficiency of corporate investment and the magnitude of firm-specificvariation in stock returns. Jin andMyers (2006) find that stock price synchronicity decreases with the levelof information transparency. Gul et al. (2010) note that foreign ownership and auditor quality areinversely associated with synchronicity and that the amount of firm-level information reflected in stockprices is lower for firms with high synchronicity. Overall, these empirical findings suggest that higherfirm-specific return variation (as a fraction of total variation) indicates more informative stock pricing.
In the context of this study, the informed foreign investor hypothesis implies that foreign B-shareprices should be more informative (less synchronous) compared to their A-share counterparts. Therefore,the following hypothesis is developed:
H1b. Foreign investors are better informed in an emerging market such as China, and foreign B-share pricesare more informative than local A-share prices.
2.2. The B-share discount puzzle
In segmented markets where companies issue restricted shares that are only available to domesticinvestors and unrestricted shares that can be held and traded by foreign investors, unrestricted shares aretraded uniformly at a premium relative to their restricted counterparts (e.g., Bailey et al., 1999; Bailey andJagtiani, 1994; Domowitz et al., 1997; Hietala, 1989; Stulz and Wasserfallen, 1995). In China, however,unrestricted B shares are traded at a large discount (e.g., Bailey et al., 1999; Bailey and Jagtiani, 1994; Chanet al., 2008; Yang and Lau, 2005). This difference is considered a “puzzle” because, in theory, given thatforeign investors can diversify away a large portion of risk associated with Chinese B shares throughnon-Chinese stocks, the required return should be lower for foreign B shares than for local A shares,resulting in a B-share premium rather than a discount.
The sharp contrast between the Chinese and other capital markets has attracted a substantial body ofresearch. Nevertheless, empirical evidence to date has been inconclusive in interpreting the causes of thediscount. Overall, frequently documented hypotheses can be roughly classified into four streams.
The first stream of research relies on the theory of supply and demand. As Bailey and Jagtiani (1994)and Fernald and Rogers (2002) point out, it is the lack of alternatives to low-yielding bank accounts inChina that drives domestic savings into the A-share market and pushes A-share prices up, beyond parity.In addition, Sun and Tong (2000) argue that the existence of the Hong Kong H-share market provides agood substitute for the B-share market, which grants higher demand elasticity to the B shares. Both effectstend to inflate the A-share prices and deflate the B-share prices. The major criticism concerning thishypothesis stems from its failure to explain the cross-sectional variation in A-share premiums (Chan et al.,2008).

1121J.A. Doukas, L. Wang / Pacific-Basin Finance Journal 21 (2013) 1116–1135
The second line of research attributes the price differential between the two classes of stocks to thespeculative behavior of Chinese investors. Because Chinese security markets are extraordinarily risky,domestic investors tend to be highly risk tolerant and speculative, diverting A-share prices from a rationallevel (e.g., Ma, 1996; Mei et al., 2003). While Mei et al. (2003) find that the A-share turnover rate, whichproxies for the amount of speculative trading, explains some of the cross-sectional variation in A-sharepremiums, a large portion of the variation remains unexplained.
The third school of research considers the Chinese foreign share discount as a result of B shares' lack ofliquidity and high trading costs (e.g., Chen et al., 2001; Chen and Xiong, 2001). That is, B shares are pricedlower to compensate for their lower liquidity and higher transaction costs. This hypothesis, however,cannot explain why other capital markets with similar ownership restrictions do not experience the samepattern of foreign share discount.
The last and most prevalent body of research is built upon the information asymmetry hypothesisdeveloped by Brennan and Cao (1997). The idea is that due to language barriers, different accountingstandards, and weak access to local information, foreign investors often have less information thandomestic investors, and, hence, require a higher premium (stock price discount) in the B-share market(e.g., Chakravarty et al., 1998; Chan et al., 2008). The major challenge facing this hypothesis is the questionof whether domestic investors are in possession of sufficient value-relevant information in weakinformation environments.
If foreign investors do not have an informational disadvantage, as is proposed in this study, then thequestion becomes whether the analysis of information asymmetry still contributes to our understanding ofthe B-share discount puzzle. To better illustrate this point, it is important to understand two idiosyncrasiesassociated with the Chinese stock market. First, Chinese domestic shares are universally overvalued relativeto their fundamentals (e.g., Bailey and Jagtiani, 1994; Fernald and Rogers, 2002;Ma, 1996;Mei et al., 2003). Itis argued that both the excess funds in the A-share market and the highly speculative behavior of Chineseinvestors contribute largely to the deviation of stock prices from a rational level. Second, the movements ofstock prices are highly synchronous with the movements of the market rather than reflecting firm-specificinformation in China (e.g., Chan and Hameed, 2006; Morck et al., 2000). This phenomenon can be wellexplained by the information-based interpretation of price synchronicity. If we consider asset prices as afunction of both firm-specific and market-wide information, then investors will have to rely more onmarket-level information in an environment where credible firm-level information is either technicallyunavailable or prohibitively costly, resulting in more synchronous price movements.
Because the B-share market is associated with a higher level of regulatory and disclosure standards, lessinformation censorship, and more sophisticated investor base, one should expect foreign B-share investorsto be more efficient in collecting and processing value-relevant information than local A-share investors.Consequently, more firm-specific information should be capitalized into B-share prices, resulting in moreaccurate or less overvalued B-share pricing. Therefore, in a world with informed foreign investors andinherent stock overvaluation, the so-called B-share discount can be interpreted as a result of a downwardprice correction (toward the fundamental values) once more firm-specific information is incorporated intostock pricing. If this is the case, then one should observe a positive relation between the magnitude of theB-share discount and the capitalization of firm-specific information (as measured by price synchronicity).
Based on the above discussions, the following hypothesis is derived:
H2. The B-share discount can be attributed largely to the price correction effect, and the more informativethe stock prices, the larger the discount.
2.3. Impact of market liberalization
Observing the information asymmetry between foreign and domestic investors, however, is not theend of the story in today's increasingly integrated world. A more interesting and important question toaddress is whether and to what extent the market liberalization reforms—that is, the opening of theforeign B-share market in 2001 and the opening of the domestic A-share market in 2002—affect thepatterns of information asymmetry and the B-share discount. It is important to note that the process ofmarket liberalization defined in this study is different from previous studies, which focus exclusively on
1122 J.A. Doukas, L. Wang / Pacific-Basin Finance Journal 21 (2013) 1116–1135
the opening of the foreign B-share market to domestic investors (e.g., Chan et al., 2007; Karolyi, et al.,2009; Karolyi and Li, 2003).
While it is unlikely for the processes of market liberalization to entirely eradicate the differencebetween the two markets, mitigated information asymmetry and reduced price disparity are expected.First, given that the disclosure and regulatory requirements across the twomarkets have been increasinglystandardized since the regulatory reforms, the information asymmetry between local A-share and foreignB-share markets should be less prominent. Second, the capabilities of investors to collect and processvalue-relevant, firm-specific information should be less divergent after market integration, since theinvestor base is more or less the same across the two markets. Therefore, one hypothesizes the following:
H3. Both information asymmetry and price disparity between the two markets are mitigated upon theregulatory reforms of market liberalization.
3. Data and methodology
3.1. The B-share discount
This study examines the price dispersion between the local A and foreign B shares that are issued bythe same companies (hereafter termed the twin-share portfolios). Given that not all Chinese publiclylisted firms issue shares to both domestic and foreign investors, this study focuses only on firms that issueboth A and B shares. Using balanced panel data, we further require the sample firms to be continuouslylisted on either the Shanghai Stock Exchange (SSE) or the Shenzhen Stock Exchange (SZSE) for at least10 years at the time of estimation. After eliminating firms with insufficient histories or missing values onrelated variables, companies with incomparable sizes, enterprises in financial industries, and those withforeign listings other than B-share listings, we are left with 53 firms. The final sample, therefore, consists of53 firms (26 SSE-listed and 27 SZSE-listed), each with a continuous dual-listing history during the sampleperiod from October 1997 to September 2007.
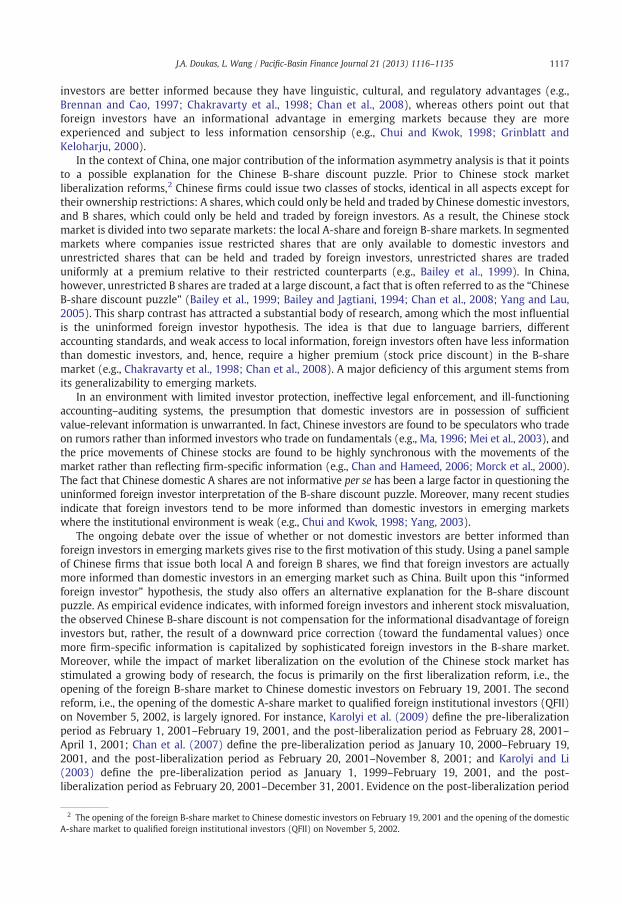
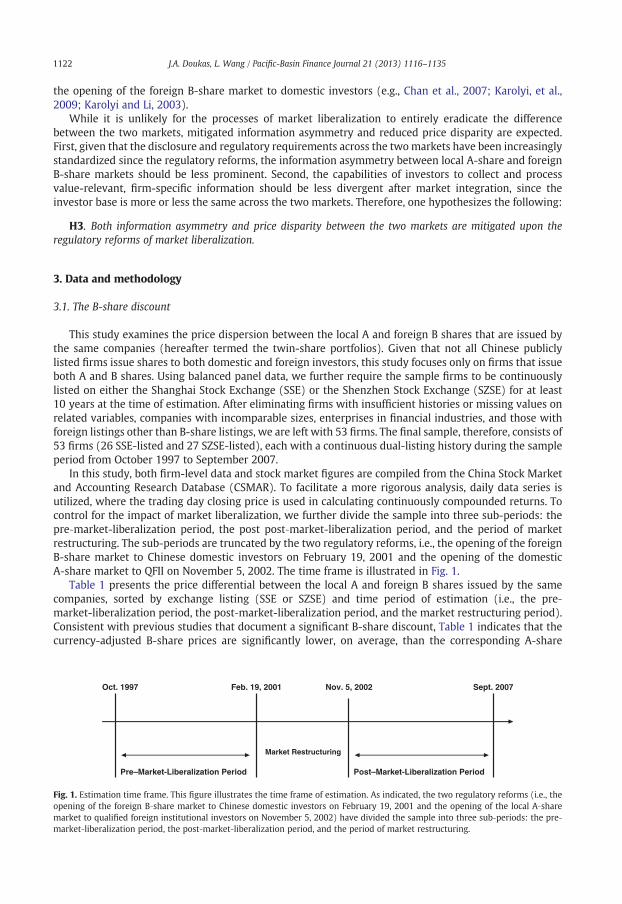
In this study, both firm-level data and stock market figures are compiled from the China Stock Marketand Accounting Research Database (CSMAR). To facilitate a more rigorous analysis, daily data series isutilized, where the trading day closing price is used in calculating continuously compounded returns. Tocontrol for the impact of market liberalization, we further divide the sample into three sub-periods: thepre‐market-liberalization period, the post post‐market-liberalization period, and the period of marketrestructuring. The sub-periods are truncated by the two regulatory reforms, i.e., the opening of the foreignB-share market to Chinese domestic investors on February 19, 2001 and the opening of the domesticA-share market to QFII on November 5, 2002. The time frame is illustrated in Fig. 1.
Table 1 presents the price differential between the local A and foreign B shares issued by the samecompanies, sorted by exchange listing (SSE or SZSE) and time period of estimation (i.e., the pre‐market-liberalization period, the post‐market-liberalization period, and the market restructuring period).Consistent with previous studies that document a significant B-share discount, Table 1 indicates that thecurrency-adjusted B-share prices are significantly lower, on average, than the corresponding A-share
Oct. 1997 Feb. 19, 2001 Nov. 5, 2002 Sept. 2007
Market Restructuring
Pre–Market-Liberalization Period Post–Market-Liberalization Period
Fig. 1. Estimation time frame. This figure illustrates the time frame of estimation. As indicated, the two regulatory reforms (i.e., theopening of the foreign B‐share market to Chinese domestic investors on February 19, 2001 and the opening of the local A‐sharemarket to qualified foreign institutional investors on November 5, 2002) have divided the sample into three sub‐periods: the pre‐market‐liberalization period, the post‐market‐liberalization period, and the period of market restructuring.
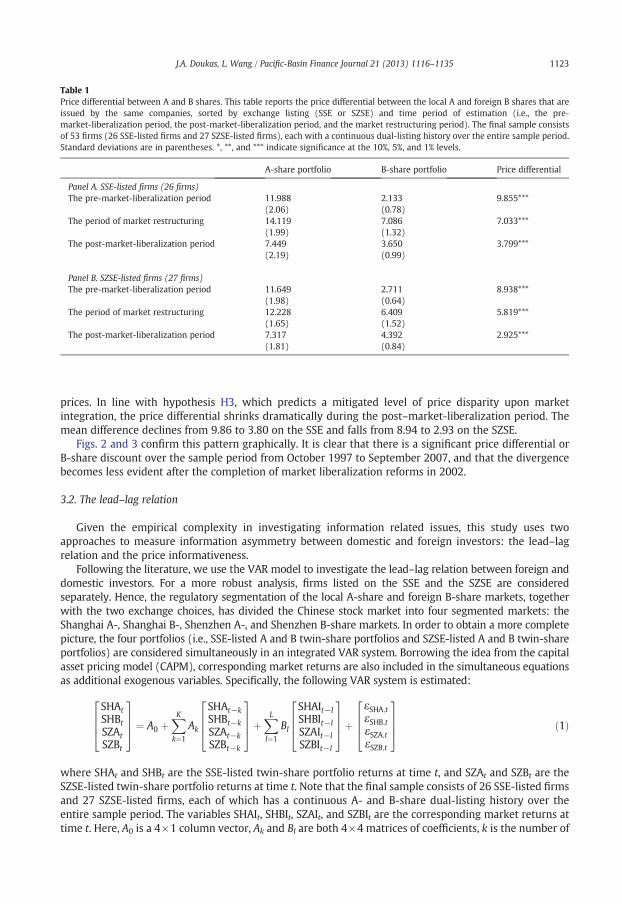
Table 1Price differential between A and B shares. This table reports the price differential between the local A and foreign B shares that areissued by the same companies, sorted by exchange listing (SSE or SZSE) and time period of estimation (i.e., the pre‐market-liberalization period, the post‐market-liberalization period, and the market restructuring period). The final sample consistsof 53 firms (26 SSE-listed firms and 27 SZSE-listed firms), each with a continuous dual-listing history over the entire sample period.Standard deviations are in parentheses. *, **, and *** indicate significance at the 10%, 5%, and 1% levels.
A-share portfolio B-share portfolio Price differential
Panel A. SSE-listed firms (26 firms)The pre-market-liberalization period 11.988
(2.06)2.133(0.78)
9.855***
The period of market restructuring 14.119(1.99)
7.086(1.32)
7.033***
The post-market-liberalization period 7.449(2.19)
3.650(0.99)
3.799***
Panel B. SZSE-listed firms (27 firms)The pre-market-liberalization period 11.649
(1.98)2.711(0.64)
8.938***
The period of market restructuring 12.228(1.65)
6.409(1.52)
5.819***
The post-market-liberalization period 7.317(1.81)
4.392(0.84)
2.925***
1123J.A. Doukas, L. Wang / Pacific-Basin Finance Journal 21 (2013) 1116–1135
prices. In line with hypothesis H3, which predicts a mitigated level of price disparity upon marketintegration, the price differential shrinks dramatically during the post–market-liberalization period. Themean difference declines from 9.86 to 3.80 on the SSE and falls from 8.94 to 2.93 on the SZSE.
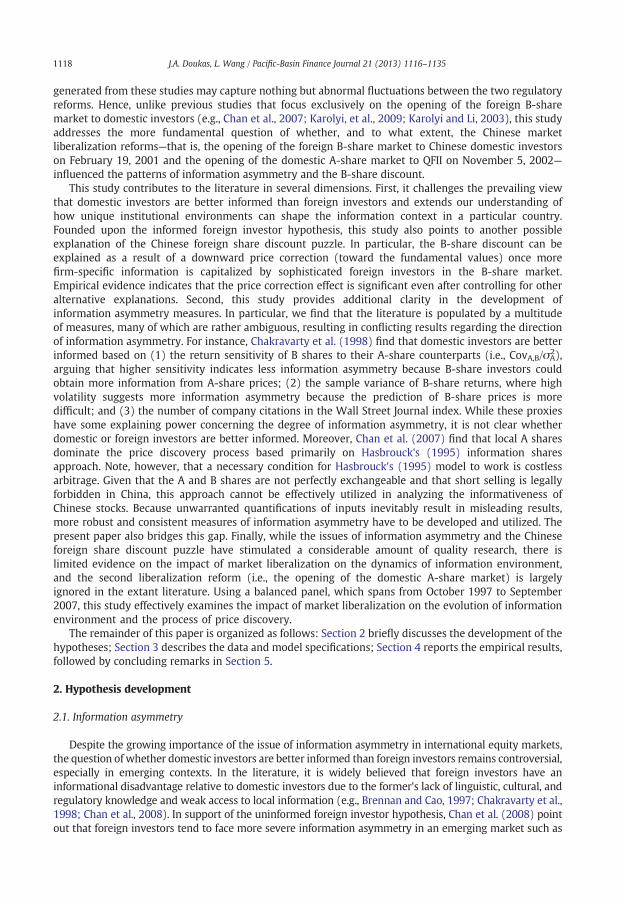
Figs. 2 and 3 confirm this pattern graphically. It is clear that there is a significant price differential orB-share discount over the sample period from October 1997 to September 2007, and that the divergencebecomes less evident after the completion of market liberalization reforms in 2002.
3.2. The lead–lag relation
Given the empirical complexity in investigating information related issues, this study uses twoapproaches to measure information asymmetry between domestic and foreign investors: the lead–lagrelation and the price informativeness.
Following the literature, we use the VAR model to investigate the lead–lag relation between foreign anddomestic investors. For a more robust analysis, firms listed on the SSE and the SZSE are consideredseparately. Hence, the regulatory segmentation of the local A-share and foreign B-share markets, togetherwith the two exchange choices, has divided the Chinese stock market into four segmented markets: theShanghai A-, Shanghai B-, Shenzhen A-, and Shenzhen B-share markets. In order to obtain a more completepicture, the four portfolios (i.e., SSE-listed A and B twin-share portfolios and SZSE-listed A and B twin-shareportfolios) are considered simultaneously in an integrated VAR system. Borrowing the idea from the capitalasset pricing model (CAPM), corresponding market returns are also included in the simultaneous equationsas additional exogenous variables. Specifically, the following VAR system is estimated:
SHAtSHBtSZAtSZBt
2664
3775 ¼ A0 þ
XKk¼1
Ak
SHAt−kSHBt−kSZAt−kSZBt−k
2664
3775þ
XLl¼1
Bl
SHAIt−lSHBIt−lSZAIt−lSZBIt−l
2664
3775þ
εSHA;tεSHB;tεSZA;tεSZB;t
2664
3775 ð1Þ
SHAt and SHBt are the SSE-listed twin-share portfolio returns at time t, and SZAt and SZBt are the
whereSZSE-listed twin-share portfolio returns at time t. Note that the final sample consists of 26 SSE-listed firmsand 27 SZSE-listed firms, each of which has a continuous A- and B-share dual-listing history over theentire sample period. The variables SHAIt, SHBIt, SZAIt, and SZBIt are the corresponding market returns attime t. Here, A0 is a 4×1 column vector, Ak and Bl are both 4×4 matrices of coefficients, k is the number of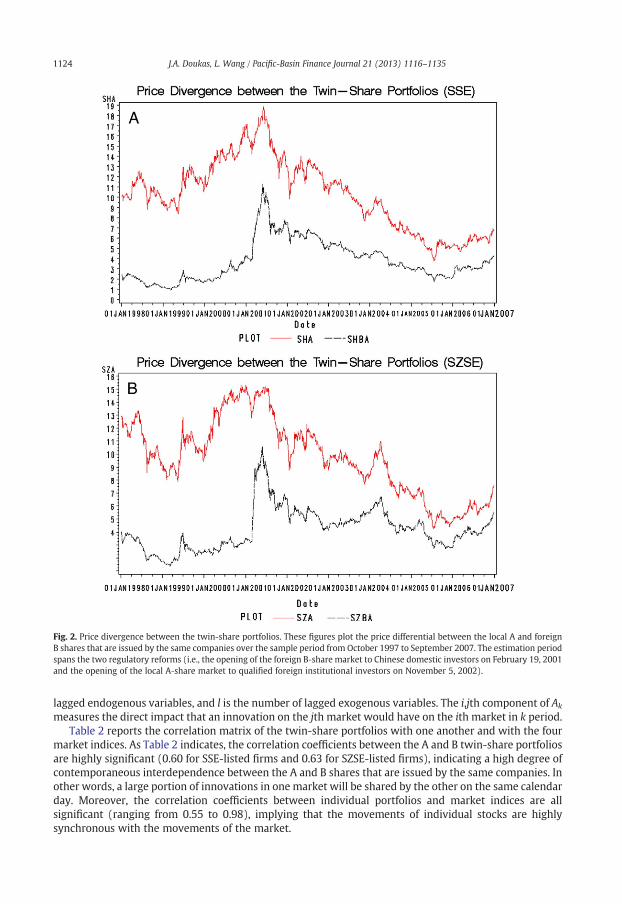
Fig. 2. Price divergence between the twin-share portfolios. These figures plot the price differential between the local A and foreignB shares that are issued by the same companies over the sample period from October 1997 to September 2007. The estimation periodspans the two regulatory reforms (i.e., the opening of the foreign B‐share market to Chinese domestic investors on February 19, 2001and the opening of the local A‐share market to qualified foreign institutional investors on November 5, 2002).
1124 J.A. Doukas, L. Wang / Pacific-Basin Finance Journal 21 (2013) 1116–1135
lagged endogenous variables, and l is the number of lagged exogenous variables. The i,jth component of Ak
measures the direct impact that an innovation on the jth market would have on the ith market in k period.Table 2 reports the correlation matrix of the twin-share portfolios with one another and with the four
market indices. As Table 2 indicates, the correlation coefficients between the A and B twin-share portfoliosare highly significant (0.60 for SSE-listed firms and 0.63 for SZSE-listed firms), indicating a high degree ofcontemporaneous interdependence between the A and B shares that are issued by the same companies. Inother words, a large portion of innovations in one market will be shared by the other on the same calendarday. Moreover, the correlation coefficients between individual portfolios and market indices are allsignificant (ranging from 0.55 to 0.98), implying that the movements of individual stocks are highlysynchronous with the movements of the market.

Fig. 3. The B-share discount. These figures plot the B‐share discount over the sample period from October 1997 to September 2007. Theestimation period spans the two regulatory reforms (i.e., the opening of the foreign B‐share market to Chinese domestic investors onFebruary 19, 2001 and the opening of the local A‐share market to qualified foreign institutional investors on November 5, 2002).
1125J.A. Doukas, L. Wang / Pacific-Basin Finance Journal 21 (2013) 1116–1135
In addition to the integrated VAR system, firms that are listed on the SSE and the SZSE are furtherinvestigated separately. In particular, the following simultaneous equation systems are estimated:
SHAtSHBt
� �¼ A0 þ
XKk¼1
AkSHAt−kSHBt−k
� �þXLl¼1
BlSHAIt−lSHBIt−l
� �þ εSHA;t
εSHB;t
� �ð2Þ
SZAtSZBt
� �¼ A0 þ
XKk¼1
AkSZAt−kSZBt−k
� �þXLl¼1
BlSZAIt−lSZBIt−l
� �þ εSZA;t
εSZB;t
� �ð3Þ
A0 is a 2×1 column vector, Ak and Bl are both 2×2 matrices of coefficients, and all the other
wherevariables are defined as in Eq. (1).
Table 2Correlation matrix. This table reports the Pearson correlation coefficients of the A and B twin-share portfolios with each other andwith the four market indices (i.e., the Shanghai A-, Shanghai B-, Shenzhen A-, and Shenzhen B-share markets), where the nullhypothesis is of no correlation.
Panel A. SSE-listed firms
SHA SHB SHAI SHBI SZAI SZBI
SHA 0.5970 0.8581 0.5726 0.8788 0.5489b .0001 b .0001 b .0001 b .0001 b .0001
SHB 0.5970 0.5884 0.9819 0.5921 0.8030b .0001 b .0001 b .0001 b .0001 b .0001
Panel B. SZSE-listed firms
SZA SZB SHAI SHBI SZAI SZBI
SZA 0.6275 0.8836 0.5502 0.9287 0.5884b .0001 b .0001 b .0001 b .0001 b .0001
SZB 0.6275 0.6010 0.8074 0.6109 0.9704b .0001 b .0001 b .0001 b .0001 b .0001
1126 J.A. Doukas, L. Wang / Pacific-Basin Finance Journal 21 (2013) 1116–1135
The order of VAR is determined by comparing the information criteria amongmodel specifications withlag lengths ranging from 1 to 20 (i.e., from one day to one month). For a more precise specification, theAkaike information criterion (AIC) and the Schwarz Bayesian criterion (SBC) are considered jointly in thisstudy. The statistics of the information criteria for model specifications with 1, 2, 3, 4, 5, 10, and 20 lags arereported in Table 3.
According to Table 3, the VAR with 1 lag seems to be the most appropriate identification for all threemodel specifications, suggesting that a large portion of innovations in one market are transmitted toanother within two calendar days. Therefore, the order of VAR is chosen to be 1 throughout the study.
3.3. Stock price informativeness
In line with the literature (e.g., Chan and Hameed, 2006; Morck et al., 2000; Roll, 1988), this study usesthe R-squared value from the regression of the CAPM to measure the departure of firm-specific stockmovements from the market. Note that in the literature, many studies include industry returns in theregression (see, for example, Durnev et al., 2004; Gul et al., 2010; Roll, 1988). It is argued, however, that instudies that focus on emerging markets, the inclusion of industry returns in the regression as an additionalindependent variable might be problematic, because of the difficulties in disentangling the industry effectfrom the market and the fact that some industries are dominated by a few firms (e.g., Chan and Hameed,2006). This study follows Chan and Hameed's approach.3 In particular, the following model is estimated:
3 A si
Rit−RFt
� �¼ α þ β RM
t −RFt
� �þ εit ð4Þ
Rit is the stock return for each individual firm at time t, that is, Rit ¼ log PitPi;t−1
� �� 100; RtM is the
M� �
wherecorresponding market return at time t, that is, RMt ¼ log Pt
PMt−1� 100; Rt
F is the risk-free rate (China's
monthly yield of the three-month household deposit interest rate) at time t; and β is the covariance of themarket return with the portfolio return divided by the variance of the market return. The R-squared valuesfrom Eq. (4) are then used to measure the departure of firm-specific movements from the market.Specifically,
R2 ¼ 1− ∑ε̂2t∑ yt−y½ �2
ð5Þ
milar measure is used by Doukas et al. (2011).
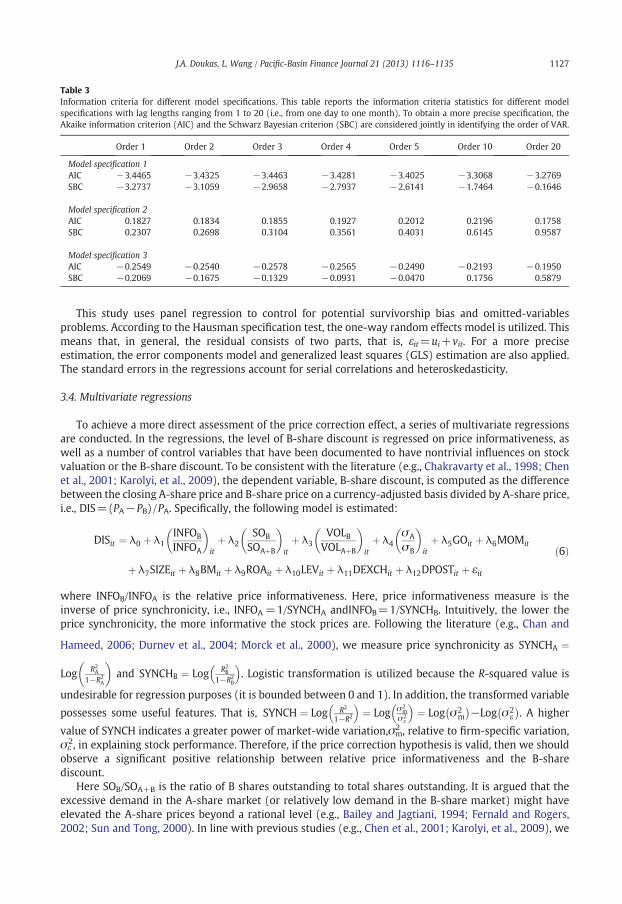
Table 3Information criteria for different model specifications. This table reports the information criteria statistics for different modelspecifications with lag lengths ranging from 1 to 20 (i.e., from one day to one month). To obtain a more precise specification, theAkaike information criterion (AIC) and the Schwarz Bayesian criterion (SBC) are considered jointly in identifying the order of VAR.
Order 1 Order 2 Order 3 Order 4 Order 5 Order 10 Order 20
Model specification 1AIC −3.4465 −3.4325 −3.4463 −3.4281 −3.4025 −3.3068 −3.2769SBC −3.2737 −3.1059 −2.9658 −2.7937 −2.6141 −1.7464 −0.1646
Model specification 2AIC 0.1827 0.1834 0.1855 0.1927 0.2012 0.2196 0.1758SBC 0.2307 0.2698 0.3104 0.3561 0.4031 0.6145 0.9587
Model specification 3AIC −0.2549 −0.2540 −0.2578 −0.2565 −0.2490 −0.2193 −0.1950SBC −0.2069 −0.1675 −0.1329 −0.0931 −0.0470 0.1756 0.5879
1127J.A. Doukas, L. Wang / Pacific-Basin Finance Journal 21 (2013) 1116–1135
This study uses panel regression to control for potential survivorship bias and omitted-variablesproblems. According to the Hausman specification test, the one-way random effects model is utilized. Thismeans that, in general, the residual consists of two parts, that is, εit=ui+vit. For a more preciseestimation, the error components model and generalized least squares (GLS) estimation are also applied.The standard errors in the regressions account for serial correlations and heteroskedasticity.
3.4. Multivariate regressions
To achieve a more direct assessment of the price correction effect, a series of multivariate regressionsare conducted. In the regressions, the level of B-share discount is regressed on price informativeness, aswell as a number of control variables that have been documented to have nontrivial influences on stockvaluation or the B-share discount. To be consistent with the literature (e.g., Chakravarty et al., 1998; Chenet al., 2001; Karolyi, et al., 2009), the dependent variable, B-share discount, is computed as the differencebetween the closing A-share price and B-share price on a currency-adjusted basis divided by A-share price,i.e., DIS=(PA−PB)/PA. Specifically, the following model is estimated:
DISit ¼ λ0 þ λ1INFOB
INFOA
� �itþ λ2
SOB
SOAþB
� �itþ λ3
VOLBVOLAþB
� �itþ λ4
σA
σB
� �itþ λ5GOit þ λ6MOMit
þ λ7SIZEit þ λ8BMit þ λ9ROAit þ λ10LEVit þ λ11DEXCHit þ λ12DPOSTit þ εit
ð6Þ
INFOB/INFOA is the relative price informativeness. Here, price informativeness measure is the
whereinverse of price synchronicity, i.e., INFOA =1/SYNCHA andINFOB=1/SYNCHB. Intuitively, the lower theprice synchronicity, the more informative the stock prices are. Following the literature (e.g., Chan andHameed, 2006; Durnev et al., 2004; Morck et al., 2000), we measure price synchronicity as SYNCHA ¼
Log R2A
1−R2A
� �and SYNCHB ¼ Log R2
B
1−R2B
� �. Logistic transformation is utilized because the R-squared value is
undesirable for regression purposes (it is bounded between 0 and 1). In addition, the transformed variable
possesses some useful features. That is, SYNCH ¼ Log R2
1−R2
� �¼ Log σ2
mσ2
ε
� �¼ Log σ2
m
� −Log σ2
ε�
. A higher
value of SYNCH indicates a greater power of market-wide variation,σm2 , relative to firm-specific variation,
σε2, in explaining stock performance. Therefore, if the price correction hypothesis is valid, then we should
observe a significant positive relationship between relative price informativeness and the B-sharediscount.
Here SOB/SOA+B is the ratio of B shares outstanding to total shares outstanding. It is argued that theexcessive demand in the A-share market (or relatively low demand in the B-share market) might haveelevated the A-share prices beyond a rational level (e.g., Bailey and Jagtiani, 1994; Fernald and Rogers,2002; Sun and Tong, 2000). In line with previous studies (e.g., Chen et al., 2001; Karolyi, et al., 2009), we
1128 J.A. Doukas, L. Wang / Pacific-Basin Finance Journal 21 (2013) 1116–1135
use the ratio of B shares outstanding to total shares outstanding as a proxy for relative demand conditions.If the differential demand hypothesis is valid, then the coefficient estimate on this term should be negativeand significant. In equilibrium, however, the distinction betweenmeasures of supply and demandmay notbe very clear. If the number of shares outstanding is determined mainly by the supply of shares by firmsrather than demand by investors, then we may observe a positive coefficient estimate.
Moreover, previous studies also attribute the price disparity to the B shares' lack of liquidity (e.g., Chenet al., 2001; Chen and Xiong, 2001). To be consistent with the literature (e.g., Chen et al., 2001; Karolyi, etal., 2009), we use the ratio of B-share trading volume to total trading volume,VOLB/VOLA+B, as a proxy forrelative liquidity. If the differential liquidity hypothesis is valid, then the coefficient estimate on this termshould be negative and significant.
In addition, Ma (1996) and Mei et al. (2003) argue that the speculative behavior of Chinese domesticinvestors plays an important role in explaining the observed B-share discount (or A-share premium).Following previous studies (e.g., Chen et al., 2001; Karolyi, et al., 2009), we use relative return volatility,σA/σB, to capture the speculative behavior of domestic versus foreign investors. If the differential riskhypothesis holds, then the coefficient estimate on the relative volatility term should be positive andsignificant.
Besides, recent studies find that government ownership (e.g., Hou and Lee, 2011; Karolyi, et al., 2009)and the momentum effect in the A-share market (Karolyi and Li, 2003) have a significant impact on thedynamics of B-share discount. Therefore, we further control for government ownership and themomentum effect, where government ownership, GO, is measured as the percentage of common sharesowned by the state (e.g., Wang and Yung, 2011), and the momentum effect, MOM, is computed as thecumulative A-share returns over the preceding month (e.g., Karolyi and Li, 2003).
Additional control variables include firm size, SIZE, calculated as the natural log of total marketcapitalization of the firm; the book-to-market ratio, BM, measured as the difference between total assetsand total liabilities, divided by the stock market capitalization of the firm; the return on assets ratio, ROA,computed as EBXI (i.e., earnings before extraordinary items and discontinued operations) divided by totalassets; the leverage (debt-to-equity) ratio, LEV; an exchange dummy, DEXCH, where 1 stands forSSE-listed firms and 0 stands for SZSE-listed firms; and a post-liberalization dummy, DPOSTL, where 1stands for post-liberalization period and 0 otherwise. The book-to-market ratio, return on assets ratio, andleverage ratio are included in the model to account for growth opportunities, profitability, and the impactof capital structure, respectively. To address potential industry effects, all regressions are conducted withineach industry category.
The control variables are chosen based on previous studies, data availability, and the nature of thisstudy. Both the correlation test and the VIF statistics suggest that the concern about multicollinearityamong the independent variables does not appear to be warranted. Note that monthly data is utilized inmultivariate regressions.
4. Empirical results
Table 4 reports the VAR estimates based on three different model specifications, where Panel A focuseson the pre‐market-liberalization period and Panel B focuses on the post‐market-liberalization period.Overall, the empirical results generated from different model specifications are highly consistent,suggesting that the models are well specified.
Panel A of Table 4 reports the regression results of the VAR systems during the pre‐market-liberalization period. As columns 1–4 indicate, there is a significant dependence of A-share returns uponthe past movements of their B-share counterparts prior to market liberalization, especially for theSSE-listed firms. Additionally, the past returns of Shenzhen B shares tend to have some predictive poweron their own future returns. In terms of market returns, the Shenzhen B-share market appears to play asignificant leading role in predicting individual stock returns (column 8 of Panel A). Overall, the resultssuggest that, under perfect market segmentation, the information tends to flow from foreign B-sharemarket to domestic A-share market and that foreign investors are better informed than Chinese domesticinvestors (hypothesis H1a is supported). While Panel A documents significant Granger causality betweenthe twin-share portfolios, an inconsistency has to be noted. The signs of some coefficient estimates arenegative. Technically speaking, the signs of coefficient estimates in simultaneous equation systems are

Table 4Lead–lag relation between A and B markets.This table reports the VAR estimates based on the following different model specifications, where Panel A focuses on thepre-market-liberalization period and Panel B focuses on the post-market-liberalization period.
Model 1
SHAtSHBtSZAtSZBt
2664
3775 ¼ A0 þ
XKk¼1
Ak
SHAt−kSHBt−kSZAt−kSZBt−k
2664
3775þ
XLl¼1
Bl
SHAIt−lSHBIt−lSZAIt−lSZBIt−l
2664
3775þ
εSHA;tεSHB;tεSZA;tεSZB;t
2664
3775
Model 2 SHAtSHBt
� �¼ A0 þ
XKk¼1
AkSHAt−kSHBt−k
� �þXLl¼1
BlSHAIt−lSHBIt−l
� �þ εSHA;t
εSHB;t
� �
Model 3 SZAtSZBt
� �¼ A0 þ
XKk¼1
AkSZAt−kSZBt−k
� �þXLl¼1
BlSZAIt−lSZBIt−l
� �þ εSZA;t
εSZB;t
� �
where SHAt and SHBt SSE-listed twin-share portfolio returns at time t, and SZAt and SZBt are the SZSE-listed twin-share portfolioreturns at time t. Note that the SSE-listed twin-share portfolios include 26 A- and B-share dual-listed firms, and the SZSE-listedtwin-share portfolios include 27 A- and B-share dual-listed firms. The variables SHAIt, SHBIt, SZAIt, and SZBIt are thecorresponding market returns at time t. Here, A0 is a 4×1 column vector in Model 1 and a 2×1 column vector in Models 2 and 3,Ak and Bl are 4×4 matrices of coefficients in Model 1 and 2×2 matrices of coefficients in Models 2 and 3. The parameter k is thenumber of lagged endogenous variables and l is the number of lagged exogenous variables. According to AIC and SBC criteria, alag length of 1 is chosen for all three model specifications. The t-values are in parentheses. *, **, and *** indicate significance at the10%, 5%, and 1% levels.
Panel A. Pre-market-liberalization period (October 1, 1997–February 18, 2001)
SHA (t−1) SHB (t−1) SZA (t−1) SZB (t−1) SHAI (t−1) SHBI (t−1) SZAI (t−1) SZBI (t−1)
Model specification 1SHA 0.0147 −0.2034* −0.0285 0.1553 0.0239 0.2551**
(0.17) (−1.82) (−0.15) (1.39) (0.13) (2.08)SHB 0.0631 −0.0329 −0.5971* 0.0939 0.4281 0.1759
(0.45) (−0.18) (−1.96) (0.51) (1.44) (0.87)SZA 0.0344 −0.1819 −0.1227 0.0012 0.0605 0.2299*
(0.32) (−1.40) (−0.63) (0.01) (0.32) (1.79)SZB 0.0549 −0.3981** −0.5709** 0.0554 0.3454 0.4943***
(0.36) (−2.17) (−2.09) (0.33) (1.30) (2.73)
Model specification 2SHA −0.0031 −0.2060* 0.0462 0.2049*
(−0.04) (−1.85) (0.49) (1.86)SHB 0.0075 −0.0386 −0.1099 0.1863
(0.05) (−0.21) (−0.71) (1.03)
Model Specification 3SZA 0.0503 −0.1996 −0.0518 0.2112*
(0.48) (−1.55) (−0.44) (1.67)SZB 0.0382 −0.3873** −0.1206 0.5395***
(0.26) (−2.12) (−0.73) (3.01)
Panel B. Post‐market-liberalization period (November 6, 2002–September 30, 2007)
SHA (t−1) SHB (t−1) SZA (t−1) SZB (t−1) SHAI (t−1) SHBI (t−1) SZAI (t−1) SZBI (t−1)
Model specification 1SHA 0.1662** −0.1043 −0.3084*** 0.1645 0.2897** −0.0786
(2.44) (−0.81) (−3.01) (1.26) (2.08) (−0.75)SHB 0.0427 0.0270 −0.4037*** 0.2520* 0.2060 −0.0154
(0.57) (0.19) (−3.61) (1.76) (1.35) (−0.14)SZA −0.0301 0.0142 −0.2094** 0.2035 0.1755 −0.0491
(−0.33) (0.13) (−2.17) (1.64) (1.33) (−0.50)SZB −0.1557 0.1010 −0.1902* 0.1672 0.1471 −0.0113
(−1.59) (0.90) (−1.85) (1.27) (1.05) (−0.11)
Model specification 2SHA 0.2285*** −0.1256 −0.1938*** 0.1648
(4.12) (−0.98) (−2.93) (1.30)
(continued on next page)
1129J.A. Doukas, L. Wang / Pacific-Basin Finance Journal 21 (2013) 1116–1135
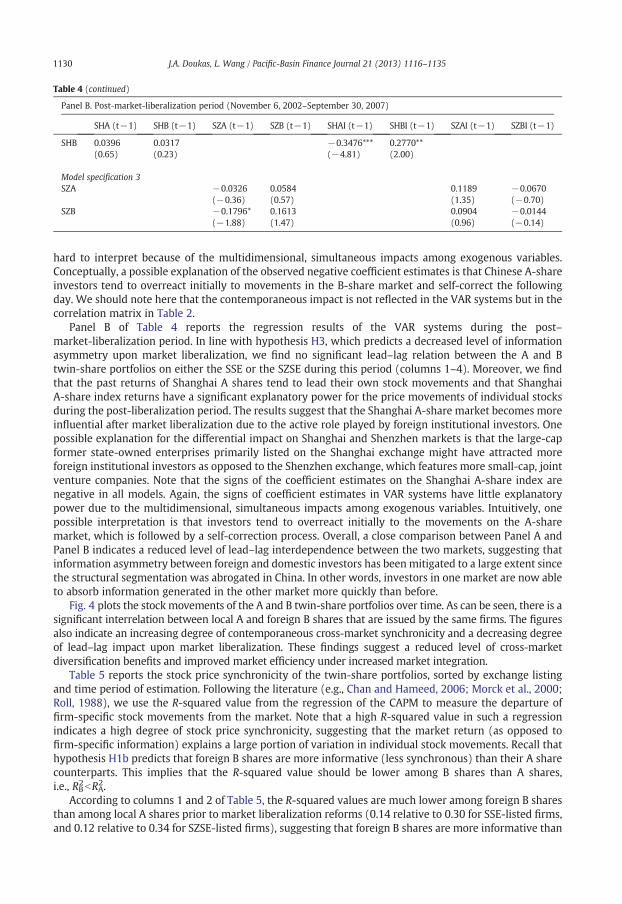
Table 4 (continued)
Panel B. Post‐market-liberalization period (November 6, 2002–September 30, 2007)
SHA (t−1) SHB (t−1) SZA (t−1) SZB (t−1) SHAI (t−1) SHBI (t−1) SZAI (t−1) SZBI (t−1)
SHB 0.0396 0.0317 −0.3476*** 0.2770**(0.65) (0.23) (−4.81) (2.00)
Model specification 3SZA −0.0326 0.0584 0.1189 −0.0670
(−0.36) (0.57) (1.35) (−0.70)SZB −0.1796* 0.1613 0.0904 −0.0144
(−1.88) (1.47) (0.96) (−0.14)
1130 J.A. Doukas, L. Wang / Pacific-Basin Finance Journal 21 (2013) 1116–1135
hard to interpret because of the multidimensional, simultaneous impacts among exogenous variables.Conceptually, a possible explanation of the observed negative coefficient estimates is that Chinese A-shareinvestors tend to overreact initially to movements in the B-share market and self-correct the followingday. We should note here that the contemporaneous impact is not reflected in the VAR systems but in thecorrelation matrix in Table 2.
Panel B of Table 4 reports the regression results of the VAR systems during the post–market-liberalization period. In line with hypothesis H3, which predicts a decreased level of informationasymmetry upon market liberalization, we find no significant lead–lag relation between the A and Btwin-share portfolios on either the SSE or the SZSE during this period (columns 1–4). Moreover, we findthat the past returns of Shanghai A shares tend to lead their own stock movements and that ShanghaiA-share index returns have a significant explanatory power for the price movements of individual stocksduring the post-liberalization period. The results suggest that the Shanghai A-share market becomes moreinfluential after market liberalization due to the active role played by foreign institutional investors. Onepossible explanation for the differential impact on Shanghai and Shenzhen markets is that the large-capformer state-owned enterprises primarily listed on the Shanghai exchange might have attracted moreforeign institutional investors as opposed to the Shenzhen exchange, which features more small-cap, jointventure companies. Note that the signs of the coefficient estimates on the Shanghai A-share index arenegative in all models. Again, the signs of coefficient estimates in VAR systems have little explanatorypower due to the multidimensional, simultaneous impacts among exogenous variables. Intuitively, onepossible interpretation is that investors tend to overreact initially to the movements on the A-sharemarket, which is followed by a self-correction process. Overall, a close comparison between Panel A andPanel B indicates a reduced level of lead–lag interdependence between the two markets, suggesting thatinformation asymmetry between foreign and domestic investors has been mitigated to a large extent sincethe structural segmentation was abrogated in China. In other words, investors in one market are now ableto absorb information generated in the other market more quickly than before.
Fig. 4 plots the stock movements of the A and B twin-share portfolios over time. As can be seen, there is asignificant interrelation between local A and foreign B shares that are issued by the same firms. The figuresalso indicate an increasing degree of contemporaneous cross-market synchronicity and a decreasing degreeof lead–lag impact upon market liberalization. These findings suggest a reduced level of cross-marketdiversification benefits and improved market efficiency under increased market integration.
Table 5 reports the stock price synchronicity of the twin-share portfolios, sorted by exchange listingand time period of estimation. Following the literature (e.g., Chan and Hameed, 2006; Morck et al., 2000;Roll, 1988), we use the R-squared value from the regression of the CAPM to measure the departure offirm-specific stock movements from the market. Note that a high R-squared value in such a regressionindicates a high degree of stock price synchronicity, suggesting that the market return (as opposed tofirm-specific information) explains a large portion of variation in individual stock movements. Recall thathypothesis H1b predicts that foreign B shares are more informative (less synchronous) than their A sharecounterparts. This implies that the R-squared value should be lower among B shares than A shares,i.e., RB2bRA2.
According to columns 1 and 2 of Table 5, the R-squared values are much lower among foreign B sharesthan among local A shares prior to market liberalization reforms (0.14 relative to 0.30 for SSE-listed firms,and 0.12 relative to 0.34 for SZSE-listed firms), suggesting that foreign B shares are more informative than

Fig. 4. The twin-share portfolio returns. These figures plot the stock returns of the twin‐share portfolios over the sample period fromOctober 1997 to September 2007. The estimation period spans the two regulatory reforms (i.e., the opening of the foreign B‐sharemarket to Chinese domestic investors on February 19, 2001 and the opening of the local A‐share market to qualified foreigninstitutional investors on November 5, 2002).
1131J.A. Doukas, L. Wang / Pacific-Basin Finance Journal 21 (2013) 1116–1135
their A-share counterparts under perfect market segmentation. In addition, hypothesis H2 predicts apositive relation between the magnitude of the B-share discount and the capitalization of firm-specificinformation. As Table 1 shows, the price disparity between the two classes of stocks declines dramaticallyafter the regulatory reforms (decreases from 9.86 to 3.80 for SSE-listed firms and drops from 8.94 to 2.93for SZSE-listed firms). In the meantime, the divergence in price synchronicity also shrinks substantiallyupon the completion of liberalization reforms (the mean difference of the R-squared values declines from0.16 to 0.05 for SSE-listed firms and drops from 0.22 to 0.001 for SZSE-listed firms).
Consistent with hypothesis H3, which predicts a mitigated degree of information asymmetry across thetwo markets, we find a clear convergence in regression R-squared values between the two classes of
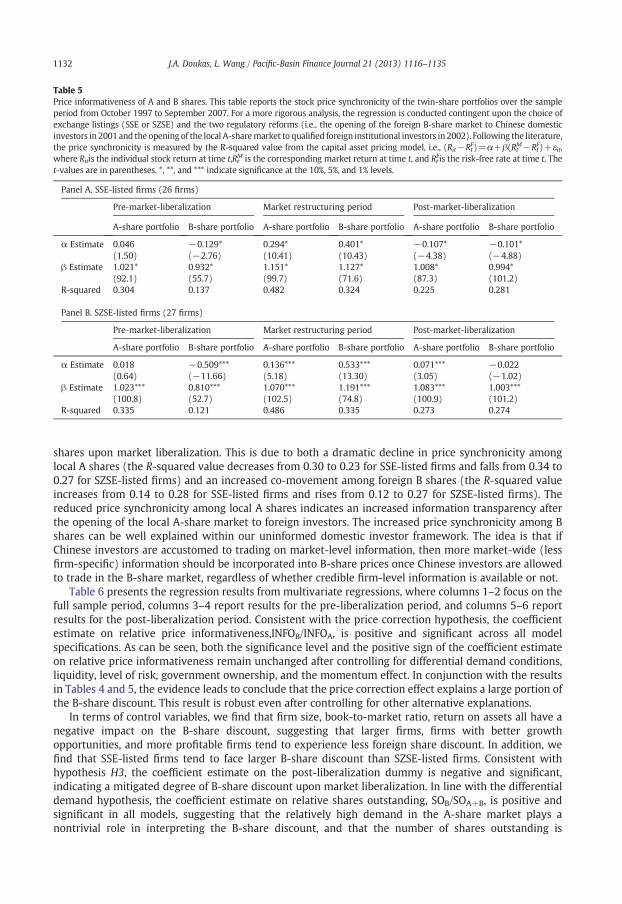
Table 5Price informativeness of A and B shares. This table reports the stock price synchronicity of the twin-share portfolios over the sampleperiod from October 1997 to September 2007. For a more rigorous analysis, the regression is conducted contingent upon the choice ofexchange listings (SSE or SZSE) and the two regulatory reforms (i.e., the opening of the foreign B-share market to Chinese domesticinvestors in 2001 and the opening of the local A-sharemarket to qualified foreign institutional investors in 2002). Following the literature,the price synchronicity is measured by the R-squared value from the capital asset pricing model, i.e., (Rit−Rt
F)=α+β(RtM−RtF)+εit,
where Ritis the individual stock return at time t,RtM is the corresponding market return at time t, and RtFis the risk-free rate at time t. The
t-values are in parentheses. *, **, and *** indicate significance at the 10%, 5%, and 1% levels.
Panel A. SSE-listed firms (26 firms)
Pre‐market-liberalization Market restructuring period Post-market-liberalization
A-share portfolio B-share portfolio A-share portfolio B-share portfolio A-share portfolio B-share portfolio
α Estimate 0.046 −0.129* 0.294* 0.401* −0.107* −0.101*(1.50) (−2.76) (10.41) (10.43) (−4.38) (−4.88)
β Estimate 1.021* 0.932* 1.151* 1.127* 1.008* 0.994*(92.1) (55.7) (99.7) (71.6) (87.3) (101.2)
R-squared 0.304 0.137 0.482 0.324 0.225 0.281
Panel B. SZSE-listed firms (27 firms)
Pre‐market-liberalization Market restructuring period Post‐market-liberalization
A-share portfolio B-share portfolio A-share portfolio B-share portfolio A-share portfolio B-share portfolio
α Estimate 0.018 −0.509*** 0.136*** 0.533*** 0.071*** −0.022(0.64) (−11.66) (5.18) (13.30) (3.05) (−1.02)
β Estimate 1.023*** 0.810*** 1.070*** 1.191*** 1.083*** 1.003***(100.8) (52.7) (102.5) (74.8) (100.9) (101.2)
R-squared 0.335 0.121 0.486 0.335 0.273 0.274
1132 J.A. Doukas, L. Wang / Pacific-Basin Finance Journal 21 (2013) 1116–1135
shares upon market liberalization. This is due to both a dramatic decline in price synchronicity amonglocal A shares (the R-squared value decreases from 0.30 to 0.23 for SSE-listed firms and falls from 0.34 to0.27 for SZSE-listed firms) and an increased co-movement among foreign B shares (the R-squared valueincreases from 0.14 to 0.28 for SSE-listed firms and rises from 0.12 to 0.27 for SZSE-listed firms). Thereduced price synchronicity among local A shares indicates an increased information transparency afterthe opening of the local A-share market to foreign investors. The increased price synchronicity among Bshares can be well explained within our uninformed domestic investor framework. The idea is that ifChinese investors are accustomed to trading on market-level information, then more market-wide (lessfirm-specific) information should be incorporated into B-share prices once Chinese investors are allowedto trade in the B-share market, regardless of whether credible firm-level information is available or not.
Table 6 presents the regression results from multivariate regressions, where columns 1–2 focus on thefull sample period, columns 3–4 report results for the pre-liberalization period, and columns 5–6 reportresults for the post-liberalization period. Consistent with the price correction hypothesis, the coefficientestimate on relative price informativeness,INFOB/INFOA, is positive and significant across all modelspecifications. As can be seen, both the significance level and the positive sign of the coefficient estimateon relative price informativeness remain unchanged after controlling for differential demand conditions,liquidity, level of risk, government ownership, and the momentum effect. In conjunction with the resultsin Tables 4 and 5, the evidence leads to conclude that the price correction effect explains a large portion ofthe B-share discount. This result is robust even after controlling for other alternative explanations.
In terms of control variables, we find that firm size, book-to-market ratio, return on assets all have anegative impact on the B-share discount, suggesting that larger firms, firms with better growthopportunities, and more profitable firms tend to experience less foreign share discount. In addition, wefind that SSE-listed firms tend to face larger B-share discount than SZSE-listed firms. Consistent withhypothesis H3, the coefficient estimate on the post-liberalization dummy is negative and significant,indicating a mitigated degree of B-share discount upon market liberalization. In line with the differentialdemand hypothesis, the coefficient estimate on relative shares outstanding, SOB/SOA+B, is positive andsignificant in all models, suggesting that the relatively high demand in the A-share market plays anontrivial role in interpreting the B-share discount, and that the number of shares outstanding is
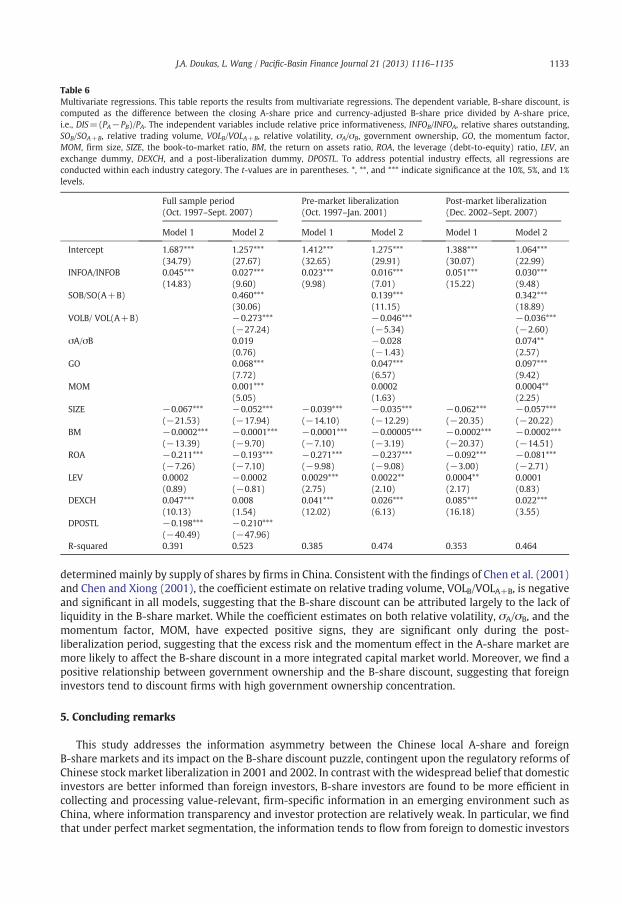
Table 6Multivariate regressions. This table reports the results from multivariate regressions. The dependent variable, B-share discount, iscomputed as the difference between the closing A-share price and currency-adjusted B-share price divided by A-share price,i.e., DIS=(PA−PB)/PA. The independent variables include relative price informativeness, INFOB/INFOA, relative shares outstanding,SOB/SOA+B, relative trading volume, VOLB/VOLA+B, relative volatility, σA/σB, government ownership, GO, the momentum factor,MOM, firm size, SIZE, the book-to-market ratio, BM, the return on assets ratio, ROA, the leverage (debt-to-equity) ratio, LEV, anexchange dummy, DEXCH, and a post-liberalization dummy, DPOSTL. To address potential industry effects, all regressions areconducted within each industry category. The t-values are in parentheses. *, **, and *** indicate significance at the 10%, 5%, and 1%levels.
Full sample period(Oct. 1997–Sept. 2007)
Pre-market liberalization(Oct. 1997–Jan. 2001)
Post‐market liberalization(Dec. 2002–Sept. 2007)
Model 1 Model 2 Model 1 Model 2 Model 1 Model 2
Intercept 1.687*** 1.257*** 1.412*** 1.275*** 1.388*** 1.064***(34.79) (27.67) (32.65) (29.91) (30.07) (22.99)
INFOA/INFOB 0.045*** 0.027*** 0.023*** 0.016*** 0.051*** 0.030***(14.83) (9.60) (9.98) (7.01) (15.22) (9.48)
SOB/SO(A+B) 0.460*** 0.139*** 0.342***(30.06) (11.15) (18.89)
VOLB/ VOL(A+B) −0.273*** −0.046*** −0.036***(−27.24) (−5.34) (−2.60)
σA/σB 0.019 −0.028 0.074**(0.76) (−1.43) (2.57)
GO 0.068*** 0.047*** 0.097***(7.72) (6.57) (9.42)
MOM 0.001*** 0.0002 0.0004**(5.05) (1.63) (2.25)
SIZE −0.067*** −0.052*** −0.039*** −0.035*** −0.062*** −0.057***(−21.53) (−17.94) (−14.10) (−12.29) (−20.35) (−20.22)
BM −0.0002*** −0.0001*** −0.0001*** −0.00005*** −0.0002*** −0.0002***(−13.39) (−9.70) (−7.10) (−3.19) (−20.37) (−14.51)
ROA −0.211*** −0.193*** −0.271*** −0.237*** −0.092*** −0.081***(−7.26) (−7.10) (−9.98) (−9.08) (−3.00) (−2.71)
LEV 0.0002 −0.0002 0.0029*** 0.0022** 0.0004** 0.0001(0.89) (−0.81) (2.75) (2.10) (2.17) (0.83)
DEXCH 0.047*** 0.008 0.041*** 0.026*** 0.085*** 0.022***(10.13) (1.54) (12.02) (6.13) (16.18) (3.55)
DPOSTL −0.198*** −0.210***(−40.49) (−47.96)
R-squared 0.391 0.523 0.385 0.474 0.353 0.464
1133J.A. Doukas, L. Wang / Pacific-Basin Finance Journal 21 (2013) 1116–1135
determined mainly by supply of shares by firms in China. Consistent with the findings of Chen et al. (2001)and Chen and Xiong (2001), the coefficient estimate on relative trading volume, VOLB/VOLA+B, is negativeand significant in all models, suggesting that the B-share discount can be attributed largely to the lack ofliquidity in the B-share market. While the coefficient estimates on both relative volatility, σA/σB, and themomentum factor, MOM, have expected positive signs, they are significant only during the post-liberalization period, suggesting that the excess risk and the momentum effect in the A-share market aremore likely to affect the B-share discount in a more integrated capital market world. Moreover, we find apositive relationship between government ownership and the B-share discount, suggesting that foreigninvestors tend to discount firms with high government ownership concentration.
5. Concluding remarks
This study addresses the information asymmetry between the Chinese local A-share and foreignB-share markets and its impact on the B-share discount puzzle, contingent upon the regulatory reforms ofChinese stock market liberalization in 2001 and 2002. In contrast with the widespread belief that domesticinvestors are better informed than foreign investors, B-share investors are found to be more efficient incollecting and processing value-relevant, firm-specific information in an emerging environment such asChina, where information transparency and investor protection are relatively weak. In particular, we findthat under perfect market segmentation, the information tends to flow from foreign to domestic investors
1134 J.A. Doukas, L. Wang / Pacific-Basin Finance Journal 21 (2013) 1116–1135
and that foreign B shares are generally more informative than their A-share counterparts. As such, theobserved B-share discount is not compensation for the informational disadvantage of foreign investorsbut, rather, the result of a downward price correction (toward the fundamental values) once morefirm-specific information is capitalized by sophisticated foreign B-share investors. Moreover, the empiricalevidence indicates that the price correction effect is significant even after controlling for other alternativeexplanations. Further investigation suggests a mitigated degree of information asymmetry and B-sharediscount upon market liberalization.
Despite the interesting findings, some caveats should be noted. While this study offers an alternativeexplanation for the Chinese B-share discount puzzle, we do not try to rule out other possible interpretationsdocumented in the literature. Rather, our empirical findings are fairly consistent with the differentialdemand hypothesis (e.g., Bailey and Jagtiani, 1994; Fernald and Rogers, 2002; Sun and Tong, 2000), theliquidity hypothesis (e.g., Chen et al., 2001; Chen and Xiong, 2001), and the government ownershiphypothesis (e.g., Hou and Lee, 2011; Karolyi, et al., 2009), suggesting that the relatively high demand in theA-share market, the B-share's lack of liquidity, and political risk play a nontrivial role in explaining theB-share discount puzzle. In addition, we find supportive evidence for the speculative behavior hypothesis(e.g., Ma, 1996; Mei et al., 2003) and the momentum hypothesis (e.g., Karolyi and Li, 2003) during thepost-liberalization period, implying that excess risk and the momentum effect in the A-share market aremore likely to be behind the B-share discount in a more integrated market.
Overall, this study offers several new insights into the literature. First, it challenges the prevailing viewthat domestic investors are better informed than foreign investors. While an earlier study by Yang (2003)has largely questioned the informed domestic investor hypothesis in China, this study goes beyond Yang(2003) and indicates that the results are robust using different information asymmetry measures evenafter controlling for other factors. Second, this study provides additional clarity in the development ofinformation asymmetry measures. In particular, we find that the conflicting results that have beenplaguing the literature are mainly a result of various information asymmetry measures utilized bydifferent researchers. Because unwarranted quantifications of inputs inevitably result in misleadingresults, more robust and consistent measures of information asymmetry have to be developed andutilized. Our study introduces a more direct and robust measure, i.e., the price informativeness. Finally,while the issues of information asymmetry and the Chinese foreign share discount puzzle have stimulatedconsiderable research interest, there is limited evidence on the impact of market liberalization on thedynamics of information environment, and the second liberalization reform (i.e., the opening of thedomestic A-share market) is largely ignored in the extant literature. The present paper also bridges thisgap.
References
Badrinath, S., Kale, J., Noe, T., 1995. Of shepherds, sheep, and the cross-autocorrelations in equity returns. Review of Financial Studies8, 401–430.
Bailey, W., Jagtiani, J., 1994. Foreign ownership restrictions and stock prices in the thai capital market. Journal of Financial Economics36, 57–87.
Bailey, W., Chung, Y., Kang, J., 1999. Foreign ownership restrictions and equity price premiums: what drives the demand forcross-border investments? Journal of Financial and Quantitative Analysis 34, 489–511.
Brennan, M., Cao, H., 1997. International portfolio investment flows. Journal of Finance 52 (5), 1851–1880.Brennan, M., Jegadeesh, N., Swaminathan, B., 1993. Investment analysis and the adjustment of stock prices to common information.
Review of Financial Studies 6, 799–824.Chakravarty, S., Sarkar, A., Wu, L., 1998. Information asymmetry, market segmentation and the pricing of cross-listed shares: theory
and evidence from Chinese A and B shares. Journal of International Financial Markets, Institutions, and Money 8, 325–355.Chan, K., Hameed, A., 2006. Stock price synchronicity and analyst coverage in emerging markets. Journal of Financial Economics 80,
115–147.Chan, K., Menkveld, A.J., Yang, Z., 2007. The informativeness of domestic and foreign investors' stock trades: evidence from the
perfectly segmented Chinese market. Journal of Financial Markets 10, 391–415.Chan, K., Menkveld, A.J., Yang, Z., 2008. Information asymmetry and asset prices: evidence from China Foreign share discount. Journal
of Finance 63, 159–196.Chen, Z., Xiong, P., 2001. Discount on Illiquid Stock: Evidence from China. Working Paper, Yale University International Center of
Finance.Chen, G.M., Lee, B.S., Rui, O., 2001. Foreign ownership restrictions and market segmentation in China's stock markets. Journal of
Financial Research 24, 133–155.Chui, A.C.W., Kwok, C.C.Y., 1998. Cross-autocorrelation between A-shares and B-shares in the Chinese stock market. Journal of
Financial Research 21, 333–353.

1135J.A. Doukas, L. Wang / Pacific-Basin Finance Journal 21 (2013) 1116–1135
Domowitz, I., Glen, J., Madhavan, A., 1997. Market segmentation and stock prices: evidence from an emerging market. Journal ofFinance 52, 1059–1085.
Doukas, J., Guo, J., Zhou, B., 2011. ‘Hot’ debt markets and capital structure. European Financial Management 17, 46–99.Durnev, A., Morck, R., Yeung, B., Zarowin, P., 2003. Does greater firm-specific return variation mean more or less informed stock
pricing? Journal of Accounting Research 41 (5), 797–836.Durnev, A., Morck, R., Yeung, B., 2004. Value-enhancing capital budgeting and firm-specific stock return variation. Journal of Finance
59, 65–105.Fernald, J., Rogers, J.H., 2002. Puzzles in the Chinese stock market. The Review of Economics and Statistics 84, 416–432.Grinblatt, M., Keloharju, M., 2000. The investment behavior and performance of various investor types: a study of Finland's unique
data set. Journal of Financial Economics 55, 43–67.Gul, F.A., Kim, J., Qiu, A.A., 2010. Ownership concentration, foreign shareholding, audit quality, and stock price synchronicity:
evidence from China. Journal of Financial Economics 95 (3), 425–442.Hasbrouck, J., 1995. One security, many markets: determining the contributions to price discovery. Journal of Finance 50, 1175–1199.Hietala, P.T., 1989. Asset pricing in partially segmented markets: evidence from the Finnish market. Journal of Finance 44, 697–718.Hou, W., Lee, E., 2011. Split share structure reform, corporate governance, and the foreign share discount puzzle in China. Working
Paper, Durham Business School.Jin, L., Myers, S., 2006. R2 around the world: new theory and new tests. Journal of Finance 79, 257–292.Karolyi, G.A., Li, L., 2003. A Resolution of the Chinese Discount Puzzle,Working Paper. Ohio State University, Fisher School of Business.Karolyi, G.A., Li, L., Liao, R., 2009. A (partial) resolution of the Chinese discount puzzle: the 2011 deregulation of the B-share market.
Journal of Financial Economic Policy 1, 80–106.Lo, A., MacKinlay, C., 1990. When are contrarian profits due to stock market overreaction. Review of Financial Studies 3, 175–206.Ma, X., 1996. Capital controls, market segmentation and stock prices: evidence from Chinese stock market. Pacific-Basin Finance
Journal 4, 219–239.Mei, J., Scheinkman, J.A., Xiong, W., 2003. Speculative Trading and Stock Prices: An Analysis of Chinese A-B Share Premia. Working
Paper, Bendheim Center for Finance, Princeton University.Morck, R., Yeung, B., Yu, W., 2000. The information content of stock markets: why do emerging markets have synchronous stock
price movements. Journal of Financial Economics 58, 215–260.Roll, R., 1988. R2. Journal of Finance 43 (3), 541–566.Stulz, R.M., Wasserfallen, W., 1995. Foreign equity investment restrictions, capital flight, and shareholder wealth maximization:
theory and evidence. Review of Financial Studies 8, 1019–1057.Sun, Q., Tong, W., 2000. The effect of market segmentation on stock prices: the China syndrome. Journal of Banking and Finance 24,
1875–1902.Wang, L., Yung, K., 2011. Do state enterprises manage earnings more than privately owned firms? The case of China. Journal of
Business Finance & Accounting 38, 794–812.Yang, J., 2003. Market segmentation and information asymmetry in Chinese stock markets: a VAR analysis. The Financial Review 38,
591–609.Yang, T., Lau, S.T., 2005. U.S. cross-listing and China's B-share discount. Journal of Multinational Financial Management 15, 334–353.