Embed Size (px)
Citation preview

FEDERAL RESERVE BANK OF SAN FRANCISCO
WORKING PAPER SERIES
Information and Communications Technology as a
General-Purpose Technology: Evidence from U.S Industry Data
Susanto Basu
Boston College and NBER
John Fernald Federal Reserve Bank of San Francisco
December 2006
Working Paper 2006-29 http://www.frbsf.org/publications/economics/papers/2006/wp06-29k.pdf
The views in this paper are solely the responsibility of the authors and should not be interpreted as reflecting the views of the Federal Reserve Bank of San Francisco or the Board of Governors of the Federal Reserve System. This paper was produced under the auspices for the Center for the Study of Innovation and Productivity within the Economic Research Department of the Federal Reserve Bank of San Francisco.

Information and Communications Technology as a General-Purpose Technology: Evidence from U.S Industry Data
Susanto Basu Boston College and NBER
John Fernald
Federal Reserve Bank of San Francisco
December 2006
Abstract: Many people point to information and communications technology (ICT) as the key for
understanding the acceleration in productivity in the United States since the mid-1990s. Stories of ICT as a ‘general purpose technology’ suggest that measured TFP should rise in ICT-using sectors (reflecting either unobserved accumulation of intangible organizational capital; spillovers; or both), but with a long lag. Contemporaneously, however, investments in ICT may be associated with lower TFP as resources are diverted to reorganization and learning. We find that U.S. industry results are consistent with GPT stories: the acceleration after the mid-1990s was broadbased—located primarily in ICT-using industries rather than ICT-producing industries. Furthermore, industry TFP accelerations in the 2000s are positively correlated with (appropriately weighted) industry ICT capital growth in the 1990s. Indeed, as GPT stories would suggest, after controlling for past ICT investment, industry TFP accelerations are negatively correlated with increases in ICT usage in the 2000s.
Prepared for the Conference on “The Determinants of Productivity Growth”, Vienna, Austria, September 2006. This paper draws heavily on and updates work reported in Basu, Fernald, Oulton, and Srinivasan (2003). We thank Robert Inklaar and conference participants for helpful comments, and David Thipphavong for excellent research assistance. The views expressed in this paper are those of the authors and do not necessarily represent the views of others affiliated with the Federal Reserve System.

1. Introduction
After the mid-1990s, both labor and total factor productivity (TFP) accelerated in the United States. A
large body of work has explored the sources and breadth of the U.S. acceleration. Much of this research focuses
on the role of information and communications technology (ICT).1
In this paper, we undertake two tasks. First, we undertake detailed growth accounting at an industry level
for data from 1987-2004. Second, we use these results to show that the simple ICT explanation for the U.S. TFP
acceleration is incomplete at best. In standard neoclassical growth theory, the use of ICT throughout the economy
leads to capital deepening, which boosts labor productivity in ICT-using sectors—but does not change TFP in
sectors that only use but do not produce ICT. TFP growth in producing ICT goods shows up directly in the
economy’s aggregate TFP growth. From the perspective of neoclassical economics, there is no reason to expect
an acceleration in the pace TFP growth outside of ICT production.
But, consistent with a growing body of literature, we find that the TFP acceleration was, in fact, broad-
based—not narrowly located in ICT production. Basu, Fernald and Shapiro (2001), in an early study, found a
quantitatively important acceleration outside of manufacturing. Triplett and Bosworth (2006, though the original
working paper was 2002) highlighted the finding that the late-1990s TFP acceleration was due, in a proximate
sense, to the performance of the service sector.
Since these early studies, there have been several rounds of major data revisions by the Bureau of
Economic Analysis that changed the details of the size and timing of the measured acceleration in different
sectors, but did not affect the overall picture. Oliner and Sichel (2006) use aggregate data (plus data on the
relative prices of various high-tech goods) and estimate that in the 2000-2005 period, the acceleration in TFP is
completely explained by non-ICT-producing sectors. Jorgenson, Ho and Stiroh (2006) undertake a similar
exercise and reach a similar conclusion. Indeed, both papers find that TFP growth in ICT production slowed
down from its rapid pace of the late 1990s. Using industry-level data, Corrado et al (2006), and Bosworth and
Triplett (2006) find that non-ICT-producing sectors saw a sizeable acceleration in TFP in the 2000s, whereas TFP
growth slowed in ICT-producing sectors in the 2000s. In the data for the current paper, sectors such as ICT
production, finance and insurance, and wholesale and retail trade accelerated after the mid-1990s; TFP growth in
those sectors remained relatively strong in the 2000s even as other sectors finally saw an acceleration.
1 Jorgenson (2001) and Oliner and Sichel (2000) provide early discussions of the role of information technology in
the productivity acceleration. We discuss the literature in greater detail later.

2
The broadbased acceleration raises a puzzle. According to standard neoclassical production theory, which
underlies almost all the recent discussions of this issue, factor prices do not shift production functions. Thus, if
the availability of cheaper ICT capital has increased TFP in industries that use, but do not produce, ICT
equipment, then it has done so via a channel that neoclassical economics does not understand well.
We discuss theories of ICT as a general purpose technology (GPT), in an effort to see if these theories can
explain the puzzle of why measured TFP accelerated in ICT-using industries. The main feature of a GPT is that it
leads to fundamental changes in the production process of those using the new invention (see, e.g., Helpman and
Trajtenberg, 1998). For example, Chandler (1977) discusses how railroads transformed retailing by allowing
nationwide catalog sales. David and Wright (1999) also discuss historical examples. Indeed, the availability of
cheap ICT capital allows firms to deploy their other inputs in radically different and productivity-enhancing ways.
In so doing, cheap computers and telecommunications equipment can foster an ever-expanding sequence of
complementary inventions in industries using ICT. These complementary inventions cause the demand curve for
ICT to shift further and further out, thereby offsetting the effects of diminishing returns.
As Basu, Fernald, Oulton and Srinivasan (2003; henceforth BFOS) highlight, ICT itself may be able to
explain the measured acceleration in TFP in sectors that are ICT users. In their model, reaping the full benefits of
ICT requires firms to accumulate a stock of intangible knowledge capital. For example, faster information
processing might allow firms to think of new ways of communicating with suppliers or arranging distribution
systems. These investments may include resources diverted to learning; they may involve purposeful innovation
arising from R&D. The assumption that complementary investments are needed to derive the full benefits of ICT
is supported both by GPT theory and by firm-level evidence.2 Since (intangible) capital accumulation is a slow
process, the full benefits of the ICT revolution show up in the ICT-using sectors with significant lags.
Note that the BFOS story hews as closely as possible to neoclassical assumptions while explaining the
puzzle of TFP growth in ICT-using industries. From the perspective of a firm, the story is essentially one of
neoclassical capital accumulation. If growth accounting could include intangible capital as an input to production
then it would show no technical change in ICT-using industries. (Of course, measuring intangible capital directly
is very difficult at best; see Corrado, Hulten and Sichel (2006).) But the story can easily be extended to include
non-neoclassical features that would explain true technical progress in ICT-using industries via other mechanisms,
such as spillovers. Indeed, to the extent that much of the intangible capital accumulated by ICT users is

3
knowledge, which is a non-rival good, it would be natural to expect spillovers. For example, the innovations that
have made Amazon.com and Walmart market leaders could presumably be imitated at a fraction of the cost it took
to develop these new ideas in the first place, at least in the long run.
We assess whether the acceleration in measured TFP is related to the use of ICT. We write down a simple
model to motivate our empirical work. The model predicts that observed investments in ICT are a proxy for
unobserved investments in reorganization or other intangible knowledge. In this model, the productivity
acceleration should be positively correlated with lagged ICT capital growth but negatively correlated with current
ICT capital growth (with these growth rates ‘scaled’ by the share of ICT capital in output). Note that the
unconditional correlation between the productivity acceleration and either ICT capital growth or the ICT capital
share can be positive, negative, or zero.
In the data, we find results that support the joint hypothesis that ICT is a GPT—i.e., that complementary
investment is important for realizing the productivity benefits of ICT investment—and that, since these
complementary investments are unmeasured, they can help explain the cross-industry and aggregate TFP growth
experience of the U.S. in the 1990s. Specifically, we find that industries that had high ICT capital growth rates in
the 1987-2000 period (weighted by ICT revenue shares, as suggested by theory) also had a faster acceleration in
TFP growth in the 2000s. Controlling for lagged capital growth, however, ICT capital growth in the 2000s was
negatively correlated with contemporaneous TFP growth. These results are consistent with—indeed, predicted
by—the simple model that we present.
The paper is structured as follows. We present preliminary empirical results from industry-level growth
accounting in Section 2, and document the puzzle we note above. We then present a simple model of intangible
capital investment in Section 3, and show how measured inputs—especially ICT investment—can be used to
derive a proxy for unmeasured investment in intangibles. We test the key empirical implications of the model in
Section 4. Conclusions, caveats and ideas for future research are collected in Section 5.
2. Data and preliminary empirical results
We begin by establishing stylized facts from standard growth accounting. We focus on disaggregated,
industry-level results for total factor productivity. We first describe our data set briefly, and then discuss results.
2 For evidence, see Bresnahan, Brynjolfsson and Hitt (2002).

4
We use a 40-industry dataset that updates that used in Basu, Fernald, and Shapiro (2001), Triplett and
Bosworth (2006), and BFOS (2003). The data run from 1987-2004 on a North American Industry Classification
System (NAICS) basis. For industry gross output and intermediate-input use, we use industry-level national
accounts data from the Bureau of Economic Analysis. For capital input—including detailed ICT data—we use
Bureau of Labor Statistics capital input data by disaggregated industry. For labor input, we use unpublished BLS
data on hours worked by two-digit industry.3
Several comments are in order. First, there are potential differences in how the conversion from SIC to
NAICS has been implemented across agencies; see Bosworth and Triplett (2006) and Corrado et al (2006) for a
discussion. Second, we do not have industry measures of labor quality, only raw hours, as estimated by the BLS.
Third, we aggregate industries beyond what is strictly necessary, in part because of concern that industry matches
across data sources are not as good at lower levels of aggregation. (For example, in some cases, our BLS estimate
of capital compensation share in a sub-industry substantially exceeded the implied BEA figure, whereas in another
sub-industry the share fell substantially short; once aggregated, the BLS figure was close to—i.e., only slightly
smaller than, the BEA figure—as expected.)
Table 1 provides standard estimates of TFP for various aggregates, including the 1-digit industry level.
The first three columns show TFP growth, in value-added terms, averaged over different time periods. Since
aggregate TFP is a value-added concept, we present industry TFP in value-added terms as well; by controlling for
differences in intermediate input intensity, these figures are ‘scaled’ to be comparable to the aggregate figures.
The next two columns show the acceleration, first from 1987-95 to 1995-2000; and then from 1995-2000 to 2000-
04. The final two columns show the average share of intermediate inputs in gross output and the sector’s nominal
share of aggregate value-added. 4
3 The BEA data gross-product-originating data were downloaded from http://bea.gov/bea/dn2/gdpbyind_data.htm on
March 15, 2006. The BLS capital data were downloaded from http://www.bls.gov/web/prod3.supp.toc.htm on March 21, 2006.. We removed owner-occupied housing from the BEA data for the real estate industry. The BEA labor compensation data do not include proprietors or the self-employed, so we follow Triplett and Bosworth (2006) in using BLS data on total payments to capital that correct for this. We thank Steve Rosenthal at the BLS for sending us unpublished industry hours data, which makes adjustments for estimated hours worked by non-production and supervisory employees as well as the self-employed (received via email on June 27, 2006).
4 With Törnqvist aggregation, aggregate TFP growth is a weighted average of industry gross-output TFP growth, where the so-called ‘Domar weights’ equal nominal industry gross output divided by aggregate value added; the weights thus sum to more than one. See Hulten (1978) for an extensive discussion. In continuous time, this is equivalent to first converting gross-output residuals to value-added terms by dividing by (one minus the intermediate share), and then using shares in nominal value added. Hence, contributions to aggregate TFP growth are the same using value-added weighted value-added TFP, or using Domar-weighted gross-output TFP. (In discrete time, using average shares from adjacent periods,

5
The top line shows an acceleration of about ½ percentage point in the second half of the 1990s, and then a
further acceleration of about ¾ percentage point in the 2000s. The other lines show various sub-aggregates,
including the 1-digit NAICS level. It is clear that in our dataset, the acceleration was broad-based. First, suppose
we focus on the non-ICT producing sectors (fourth line from bottom). They show a very small acceleration in the
late 1990s (from 0.70 to 0.84 percent per year), but then a much larger acceleration in the 2000s (to an average of
2.00 percent per year). In contrast, ICT-producing industries saw a sharp acceleration in TFP in the late 1990s
but then some deceleration in the 2000s.
A more detailed analysis of the non-ICT sectors shows more heterogeneity in the timing of the TFP
acceleration. For example, trade and finance accelerated in the mid-1990s and growth then remained strong in the
2000s. Non-durable manufacturing, business services, and information slowed in the mid-1990s before
accelerating in the 2000s. Nevertheless, by the 2000s, most sectors show an acceleration relative to the pre-1995
period (mining, utilities, and insurance are exceptions).
Griliches (1994) and Nordhaus (2002) argue that real output in many service industries are poorly
measured—e.g., there are active debates on how, conceptually, to measure the nominal and ‘real output’ of a
bank5 ; in health care, the hedonic issues are notoriously difficult. Nordhaus argues for focusing on what ‘well-
measured’ (or at least, ‘better measured’) sectors of the economy. The acceleration in TFP in well-measured
industries (third line from bottom) took place primarily in the 1990s with little further acceleration in the 2000s;
but excluding ICT-producing sectors, the acceleration is spread out over the 1995-2004 period.
In the short term, non-technological factors can change measured industry TFP. These factors include
non-constant returns to scale and variations in factor utilization. Basu, Fernald and Shapiro (BFS, 2001) argue
that cyclical mismeasurement of inputs plays little if any role in the U.S. acceleration of the late 1990s. BFS also
find little role in the productivity acceleration for deviations from constant returns and perfect competition.
In the early 2000s, some commentators suggested that, because of uncertainty, firms were hesitant to hire
new workers; as a result, one might conjecture that firms might have worked their existing labor force more
intensively in order to get more labor input. But typically, one would expect that firms would push their workers
to work longer as well as harder; this is the basic intuition underlying the use of hours-per-worker as a utilization
they are approximately equivalent.) Basu and Fernald (2001) discuss this aggregation and its extension to the case of imperfect competition; see also Oulton (2001a).
5 See, for example, Wang, Basu, and Fernald (2004).

6
proxy in Basu and Kimball (1997), BFS, and Basu, Fernald, and Kimball (2006). In the 2000s, however, when
productivity growth was particularly strong, hours/worker remained low.
BFS do find a noticeable role for traditional adjustment costs associated with investment. When
investment rose sharply in the late 1990s, firms were, presumably, diverting an increasing amount of worker time
to installing the new capital rather than producing marketable output. This suggests that true technological
progress was faster than measured. In contrast, investment generally was weak in the early 2000s, suggesting that
there was less disruption associated with capital-installation. Nevertheless, the magnitude of this effect appears
small, for reasonable calibrations of adjustment costs. Applying the BFS correction would raise the U.S.
technology acceleration from 1995-2000 by about 0.3 percentage points per year, but would have a negligible
effect from 2000-2004. Hence, the investment reversal could potentially explain some portion of the second wave
of acceleration, but not all of it.6 These adjustment-cost considerations strengthen the conclusion that the
technology acceleration was broadbased, since service and trade industries invested heavily in the late 1990s and,
hence, paid a lot of investment adjustment costs.
3. Industry-Level Productivity Implications of ICT as a New GPT
The U.S. productivity acceleration in the late 1990s coincided with accelerated price declines for
computers and semiconductors. But, as we just saw, much of the TFP acceleration appears to have taken place in
the 2000s, and outside of ICT production. Can ICT somehow explain the measured TFP acceleration in industries
using ICT? We first discuss broad theoretical considerations of treating ICT as a new General-Purpose
Technology (GPT), and then present a simple model to clarify the issues and empirical implications.
3.1 GENERAL PURPOSE TECHNOLOGIES AND GROWTH ACCOUNTING
Standard neoclassical growth theory suggests several direct channels for ICT to affect aggregate labor and
total factor productivity growth. First, faster TFP growth in producing ICT contributes directly to aggregate TFP
growth. Second, by reducing the user cost of capital, falling ICT prices induce firms to increase their desired
capital stock.7 This use of ICT contributes directly to labor productivity through capital deepening.
6 These numbers are qualitatively the same but smaller than those reported in Basu, Fernald, and Shapiro (2001) for
three reasons. The main reasons are (i) data revisions have reduced the growth rate of investment in the second half of the 1990s.; and (ii) Jason Cummins and John Roberts pointed out a mistake in our conversion from Shapiro (1986)’s framework to ours. This led us to reduce our estimate of the “disruption cost” per unit of investment growth (the BFS parameter φ )from 0.048 in BFS to 0.035.
7 Tevlin and Whelan (2000) for the U.S. and Bakhshi et al (2003) for the U.K. provide econometric evidence that falling relative prices of ICT equipment fuelled the ICT investment boom.

7
Growth accounting itself does not take a stand on the deep causes of innovation and TFP. Neoclassical
growth theory generally takes technology as exogenous, but this is clearly a modeling shortcut, appropriate for
some but not all purposes. Endogenous growth theories, in contrast, generally presume that innovation results
from purposeful investments in knowledge or human capital, possibly with externalities.
We interpret ICT’s general purpose nature in the spirit of the neoclassical growth model, since the GPT
arrives exogenously (i.e., technological progress in ICT production is exogenous). ICT-users respond in a
neoclassical way: Frms respond to faster, more powerful computers and software by reorganizing and
accumulating intangible organizational capital. Measured TFP, which omits this intangible organizational
investment as output, and the service flow from organizational capital as an input, is also affected.
Our motivation for viewing ICT this way is the many microeconomic, firm-level, and anecdotal studies
suggesting an important—but often indirect and hard to foresee—role for ICT to affect measured production and
productivity in sectors using ICT. Conceptually, we separate these potential links into two categories: Purposeful
co-invention, which we interpret as the accumulation of “complementary organizational capital,” which leads to
mismeasurement of true technology; and externalities of one sort or another. For example, Bresnahan and
Trajtenberg (1995) and Helpman and Trajtenberg (1998) suggest that innovations in ICT cause unexpected ripples
of co-invention and co-investment in sectors that seem almost arbitrarily far away.
First, firm-level studies suggest that benefiting from ICT investments requires substantial and costly co-
investments in complementary capital, with long and variable lags.8 For example, firms that use computers more
intensively may reorganize production, thereby creating ‘intangible capital’ in the form of organizational
knowledge. Such investments include resources diverted to learning, or purposeful innovation arising from R&D.
As Bresnahan (undated) argues, “advances in ICT shift the innovation possibility frontier of the economy rather
than directly shifting the production frontier.”
8 See, for example, Brynjolfsson and Hitt (2000) and Bresnahan (undated) for a discussion of the kinds of
complementary investments and co-invention that firms undertake in order to benefit from ICT, given its ‘general purpose’ attributes. Bloom, Sadun and Van Reenen (2005) use data on cross-country mergers to provide additional firm-level evidence for the importance of (partially transferable) intangible capital.

8
The resulting “organizational capital” is analogous to physical capital in that companies accumulate it in a
purposeful way. Conceptually, we think of this unobserved complementary capital as an additional input into a
standard neoclassical production function.9
Second, the GPT literature suggests the likelihood of sizeable externalities to ICT. For example,
successful new managerial ideas—including those that take advantage of ICT, such as the use of a new business
information system—seem likely to diffuse to other firms. Imitation may be easier and less costly than the initial
co-invention of, say, a new organization change, because you learn by watching and analyzing the
experimentation, the successes and, importantly, the mistakes made by others. 10 Indeed, firms that don’t use
computers more intensively might also benefit from spillovers of intangible capital. For example, if there are
sizeable spillovers to R&D, and if R&D is more productive with better computers, then even firms that don’t use
computers intensively may benefit from the knowledge created by computers.
The first set of considerations are completely consistent with the traditional growth accounting framework
but suggest difficulties in implementation and interpretation. In particular, these considerations suggest that the
production function is mismeasured because we don’t observe all inputs (the service flow from complementary,
intangible capital) or all outputs (the investment in complementary capital). Hence, TFP is mismeasured. The
second set of ideas, related to externalities, suggest that ICT might also explain “true” technology.
Empirically, the challenge is to infer unobserved complementary investments. We now turn to a formal
model that suggests variables that might proxy for these unobservables. Of course, our interpretation of the results
will be clouded by our uncertainty about whether our proxies are capturing only neoclassical investment in
unobserved organizational capital, or whether the proxies are affecting TFP directly through spillovers.
3.2 INDUSTRY-LEVEL IMPLICATIONS OF ICT AS A NEW GPT: A SIMPLE MODEL11
Many papers modeling the effects of GPTs are motivated by the ICT revolution.12 But it is difficult to
derive industry-level empirical implications from this literature. For example, it is often unclear how to measure
9 Much of Brynjolfsson’s work tries to quantify the role of unobserved complementary capital. Macroeconomic
studies of the effects of organizational capital include Greenwood and Yorokoglu (1997), Hornstein and Krusell (1996), Hall (2001), and Laitner and Stolyarov (2001).
10 Bresnahan (undated) provides a nice discussion of the channels for externalities to operate. Bresnahan and Trajtenberg (1995) highlight both ‘vertical’ externalities (between general purpose technology producers and each application sector) and ‘horizontal’ externalities (across application sectors).
11 This section follows Basu, Fernald, Oulton, and Srinivasan (2003) fairly closely. 12 A very incomplete list is Caselli (1999), Greenwood and Yorukoglu (1997), the collection of papers edited by
Helpman (1998), Hobijn and Jovanovic (2001), Jovanovic and Rousseau (2003), and Laitner and Stolyarov (2001).

9
in practice some of the key variables, such as unobserved investment and capital; and even for observed variables,
measurement conventions often depart from those used in national accounting.13
On the other hand, conventional industry-level growth-accounting studies of the sort reviewed and extended
in Section 3 are typically hard to interpret in terms of GPT considerations because they generally lack a
conceptual framework to interpret movements in TFP. Although some studies try to look for a “new economy” in
which ICT has indirect effects on measured TFP in ICT-using industries, in the absence of clear theoretical
guidance, it is not clear that many would know if they had, in fact, found it.
Finally, the empirical literature using firm-level data or case studies stresses the importance and costly
nature of organizational change accompanying ITC investment. This literature is insightful but rarely makes
contact with economy-wide productivity research. (An exception is Brynjolfsson and Yang (2001)). Our
empirical work below is a tentative attempt to make that connection. The model below provides the bare bones of
a theoretical framework to capture some of the key issues, focusing on cross-industry empirical implications. The
model takes as given the arrival of a particular GPT, which here is taken to be the production of ICT capital at a
continuously falling relative price. The distinguishing feature of a GPT is that its effects are general—going well
beyond the industry of production—but require complementary investments by firms in order to fully benefit from
its use. For empirical implementation, we focus on industries that use the GPT.
Value added in industries that use, but do not produce, ICT is given by:
( )( , ), ,IT NTit it it t it it it itQ Y A F Z G K C K L≡ + = , i = 1, … N (1)
where F and G are homogeneous of degree 1 in their arguments. Z is a technology term that each industry takes
as exogenous. We discuss the distinction between A and Y shortly. For simplicity, we ignore materials input
(though we incorporate them in our empirical work), imperfect competition, increasing returns, and capital
adjustment costs. All could be added, at the cost of considerable notation.
Each industry hires labor L and rents ICT capital KIT and non-ICT capital KNT in competitive, economy-wide
markets. The aggregate stocks of the two types of capital evolve as:
( ) 11JT JT JT JTt t tK I Kδ −= + − , J = I, N (2)
13 For example, capital is typically measured as foregone consumption, which is sensible for an aggregative model
but difficult to relate to industry-level capital accounts that deal with capital heterogeneity and quality change by (attempting to) measure capital input in efficiency units. Howitt (1998) attempts to bridge the two conventions

10
Industries must individually accumulate complementary capital, C, representing business and organizational
models or IT training. The investment flow A is the time and resource cost of training and creating new business
structures.14 Industries forego producing market output Y to accumulate this capital:
( ) 11it it C itC A Cδ −= + − (3)
Investment is irreversible. Since both A and NT investment goods cost the same to produce, the economic
difference between the two types of capital is that they interact in different ways with ICT capital. The difference
in terms of measurement is that Y is observable by national accountants but A is not.15
The main economic implication of the separability assumption built into (1) is that the marginal
productivities of ITK and C are closely tied to one another. We assume that the elasticity of substitution between
the two inputs in the production of G is relatively small. We also assume Inada-like conditions to the effect that
the marginal productivity of each input is very low if the level of the other is close to zero. Thus, when the GPT
arrives and ICT capital starts getting cheap, the incentive to also accumulate C is very strong.
Note that conceptually, ‘innovation’ as traditionally construed can take two forms. First, we lump
purposeful innovations into C (indeed, we have assumed that all purposeful innovation is closely linked to ICT).
Second, we interpret Z as all ‘exogenous’ increases in technology, including the component of organizational
change that spills over as an externality from the sector of origin—for example, the idea of using individual
electric motors at each workstation in a factory, rather than relying on the single drive train of a steam engine.
3.3 TFP MEASUREMENT WITH UNOBSERVED INPUTS AND OUTPUT
What are the implications of complementary capital accumulation for the measured TFP of ICT-using
industries? Differentiating, we can write the production function in growth rates as:
IT NT
IT NTIT NTCK K L Z
F K F KF C F L F ZY Aq y a k c k l zQ Q Q Q Q Q Q
Δ = Δ + Δ = Δ + Δ + Δ + Δ + Δ (4)
Since we have assumed constant returns to scale and perfect competition, we have
1IT NT
IT NT IT IT NT NTC CK K L K K
F K F KF C F CF L P K P K WLQ Q Q Q Q PQ PQ PQ
+ + + = + + + = . (5)
14 Chandler (1977) discusses innovations in inventory management made possible by railroads. Wal-Mart inventory
management system provides an example of innovations made possible by ITC. 15 Some fraction of A is probably measured: for example, consultant services and many forms of software. It is not
clear how much of what is measured is properly capitalized, as required by equation (3).
11
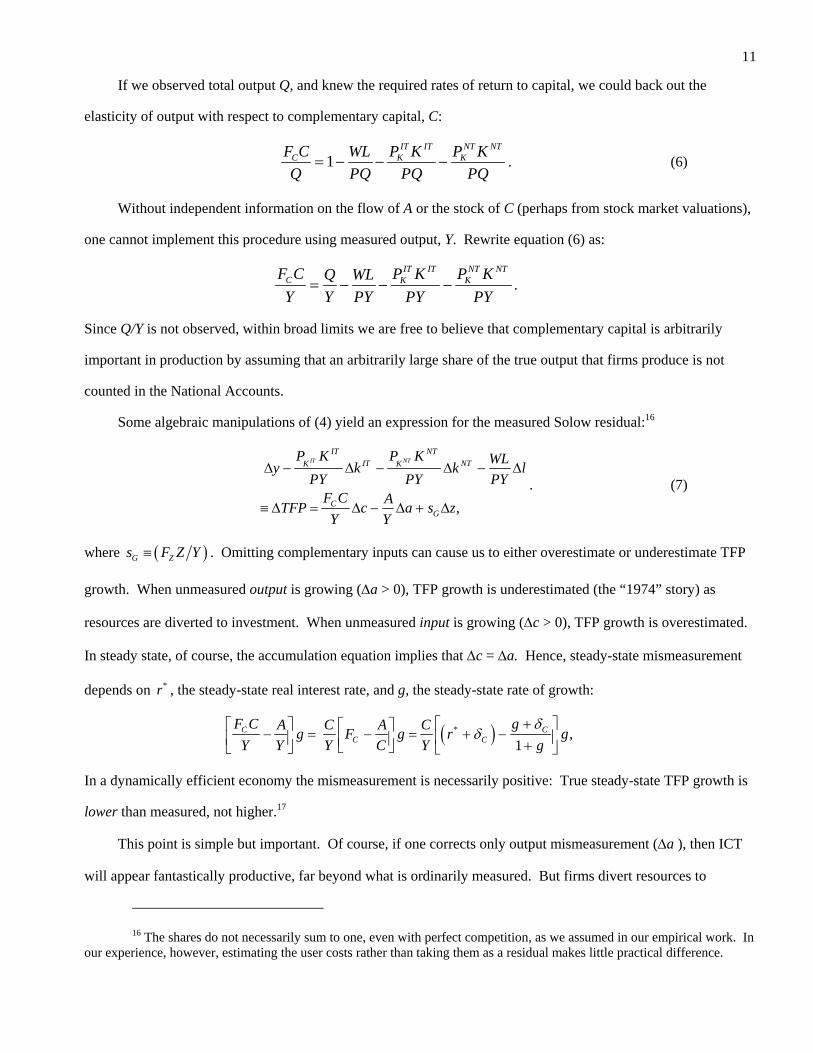
If we observed total output Q, and knew the required rates of return to capital, we could back out the
elasticity of output with respect to complementary capital, C:
1IT IT NT NT
C K KF C WL P K P KQ PQ PQ PQ
= − − − . (6)
Without independent information on the flow of A or the stock of C (perhaps from stock market valuations),
one cannot implement this procedure using measured output, Y. Rewrite equation (6) as:
IT IT NT NT
C K KF C P K P KQ WLY Y PY PY PY
= − − − .
Since Q/Y is not observed, within broad limits we are free to believe that complementary capital is arbitrarily
important in production by assuming that an arbitrarily large share of the true output that firms produce is not
counted in the National Accounts.
Some algebraic manipulations of (4) yield an expression for the measured Solow residual:16
,
IT NTIT NT
IT NTK K
CG
P K P K WLy k k lPY PY PY
F C ATFP c a s zY Y
Δ − Δ − Δ − Δ
≡ Δ = Δ − Δ + Δ
. (7)
where ( )G Zs F Z Y≡ . Omitting complementary inputs can cause us to either overestimate or underestimate TFP
growth. When unmeasured output is growing (Δa > 0), TFP growth is underestimated (the “1974” story) as
resources are diverted to investment. When unmeasured input is growing (Δc > 0), TFP growth is overestimated.
In steady state, of course, the accumulation equation implies that Δc = Δa. Hence, steady-state mismeasurement
depends on *r , the steady-state real interest rate, and g, the steady-state rate of growth:
( )* ,1
C CC C
F C gA C A Cg F g r gY Y Y C Y g
δδ
+⎡ ⎤⎡ ⎤ ⎡ ⎤− = − = + −⎢ ⎥⎢ ⎥ ⎢ ⎥ +⎣ ⎦⎣ ⎦ ⎣ ⎦
In a dynamically efficient economy the mismeasurement is necessarily positive: True steady-state TFP growth is
lower than measured, not higher.17
This point is simple but important. Of course, if one corrects only output mismeasurement (Δa ), then ICT
will appear fantastically productive, far beyond what is ordinarily measured. But firms divert resources to
16 The shares do not necessarily sum to one, even with perfect competition, as we assumed in our empirical work. In
our experience, however, estimating the user costs rather than taking them as a residual makes little practical difference.

12
unobserved investment Δa in order to create an intangible capital stock, which contributes to future production.
The resulting unmeasured flow of capital services implies a bias in the other direction. The net bias may be either
positive or negative at a point in time, but is positive in the steady state.
We now seek an observable proxy for unobserved investment in, and growth in the stock of, complementary
capital. Observed growth in ICT capital provides a reasonable proxy. Suppose G takes a CES form:
1 1
1[ (1 ) ]ITG K Cσ σ σσ σ σα α− −
−= + −
Consider the optimization sub-problem of producing G at minimum cost each period. Let , ,/K IT K CP P be the
relative rental rate of ICT capital to C-capital. The solution of the sub-problem is:
, ,ln( / )ITt t K IT K C tc k P PσΔ = Δ + Δ , (8)
This equation links growth in complementary capital and growth of observed ICT capital.
We can use the accumulation equation to express unobserved investment Δa in terms of current and lagged
growth in unobserved capital Δc:
( )( ) 1
11
Ct t t
Ca c cA g
δ−
⎡ ⎤−Δ = Δ − Δ⎢ ⎥+⎣ ⎦
.
Substituting the last equation and equation (8) into (7), we have in principle an equation for TFP growth that
indicates the importance of complementary capital accumulation:
( )( )
, ,1
, , 1
1ln
1K IT K ITCIT ITC
t t GK C K Ct t
P PF C C CTFP k k s zY Y Y gP P
δσ σ−
−
⎡ ⎤ ⎡ ⎤⎛ ⎞ ⎛ ⎞⎡ ⎤−⎡ ⎤Δ = − Δ + Δ + Δ + + Δ⎢ ⎥ ⎢ ⎥⎜ ⎟ ⎜ ⎟⎢ ⎥⎢ ⎥ ⎜ ⎟ ⎜ ⎟+⎣ ⎦ ⎢ ⎥ ⎢ ⎥⎣ ⎦⎝ ⎠ ⎝ ⎠⎣ ⎦ ⎣ ⎦ (9)
The first term is proportional to *( 1)r δ+ − , so under reasonable circumstances it is negative. The second term,
on the other hand, is clearly positive. Hence, other things equal, industries that are making large ICT investments
today will have low measured TFP growth, but those that made such investments in the past will have high
measured TFP growth.
As an estimating equation, (9) has the difficulty that industries are likely to differ in their long-run C/Y
ratios. Using the CES assumption for G, the cost-minimizing F.O.C. implies that
17 Dynamic efficiency requires that the output elasticity equal or exceed the investment rate. In our discrete time
economy, one can show that dynamic efficiency requires that MPK=(r+ δ)≥ (g+δ)/(1-g).

13
,
,
1 K ITICT
K C
PCPK
σσαα
⎡ ⎤ ⎛ ⎞−⎛ ⎞= ⎜ ⎟⎢ ⎥⎜ ⎟ ⎜ ⎟⎝ ⎠⎢ ⎥ ⎝ ⎠⎣ ⎦,
or
1
,
, ,
1ICT ICT
K ICTK K
K C K C
PC P s sY P P
σσα βα
−⎡ ⎤⎛ ⎞ ⎛ ⎞−⎛ ⎞⎢ ⎥= =⎜ ⎟ ⎜ ⎟⎜ ⎟⎜ ⎟ ⎜ ⎟⎢ ⎥⎝ ⎠⎝ ⎠ ⎝ ⎠⎣ ⎦
In the Cobb-Douglas case, C/Y is proportional to the observed ICT share, so ceteris paribus the mismeasurement
of complementary capital is more important in those industries where ICT capital is used to a greater extent. Thus:
[ ] ( )( ) 1
11
1C
C t t GTFP F k k s zg
δβ β −
⎡ ⎤−Δ = − + + Δ⎢ ⎥+⎣ ⎦
, (10)
where 1
ICTICT ICTK
t t tK
Pk s k p
P
σ
σ−
⎛ ⎞ ⎡ ⎤= Δ + Δ⎜ ⎟ ⎣ ⎦⎝ ⎠ and
1 σαβα−⎛ ⎞= ⎜ ⎟
⎝ ⎠.
This model has several general implications. First, one might find a link between ICT use and measured
TFP even if there are no “externalities” to ICT use. Second, the correct “proxy” for ICT use involves the
interaction of ICT-intensity (the ICT share) and the growth rate. Intuitively, if ICT capital grows quickly but its
share in small, then there probably isn’t much complementary capital to cause mismeasurement. In contrast, if the
share is large (implying complementary capital is likely important) but the growth of ICT capital is small, then the
mismeasurement of true output and true investment is also small during the period at hand. Third, one needs to
control for both current and lagged k . Since these values are correlated in the data, if one omits one of them,
then the regression has an omitted variable problem. Indeed, the regression coefficient could have either sign,
since the correlated omitted variable has a coefficient with the opposite sign.18
3.4 EXTENSIONS TO THE BASIC FRAMEWORK
The model above is, of course, stylized and imposes a lot of structure on the problem in order to derive an
estimating equation. As a result, there are a number of challenges in implementing this framework empirically.
First, it is unclear how long the lags are between ICT investment and complementary investment. In other words,
18 Hence one needs to generalize the approach followed by, e.g., Stiroh (2002b) who look for ICT spillovers/by
regressing TFP growth on only the current-year growth rate of IT capital. See Stiroh (2002a) and Stiroh and Bosch (2006) for related work. Brynjolfsson and Hitt (2002) also find significant lags in firm-level data, which nicely complements our more aggregative evidence.

14
the length of a period is a free parameter, and theory gives little guidance. The lagged k may be last year’s ITC
capital accumulation, or the last decade’s. Furthermore, equation (3) for the accumulation of complementary
capital has no adjustment costs, or time-to-build or time-to-plan lags in the accumulation of C. But such frictions
and lags are likely to be important in practice, making it even harder to uncover the link between ICT and
measured TFP.
Second, suppose there are externalities captured in Δz and that they are a function of industry as well as
aggregate C. Then one can no longer tell whether the k terms represent accumulation of a private stock, or intra-
industry externalities that are internalized within the industry. Similarly, if we find that lagged k is important for
explaining current productivity growth we do not know whether that finding supports the theory we have outlined,
or whether it indicates that the externality is a function of lagged capital.
Third, other variables might enter the production function for A, which we have not accounted for. We
imposed the same production function for A and Y. But it is possible, as many have recognized, that the
production of complementary capital is particularly intensive in skilled (i.e., college-educated) labor.19 If true, the
hypothesis implies that the relative price of accumulating complementary capital may differ significantly across
industries (or across countries) in ways that we have ignored.
Fourth, even with the restrictions we’ve imposed, we need to make further assumptions about σ as well as
the relative user costs for ICT and complementary capital. We made the strong assumption that the price of
complementary investment is the same as that of output, so this relative price should largely reflect the trend
decline in ICT prices. Nevertheless, that was clearly an assumption of convenience—reflecting our lack of
knowledge—rather than something we want to rely to strongly on. In what follows, we ignore the relative price
terms, but this needs to be explored further. (Suppose we assume that σ = 0. There is still a relative price effect
which, if omitted, would imply a trend in the estimated coefficient over time; but in the cross-section, this relative
price is close to common across firms, so its omission shouldn’t matter much.)
Finally, given the difficulty finding good instruments, we report OLS regressions below. But current ICT
capital growth is surely endogenous. Given the correlation between current and lagged share-weighted ICT
capital growth, any endogeneity potentially biases both coefficients. The effect on estimates depends on the size
19 Krueger and Kumar (2003) ask whether the different educational systems in the U.S. and Europe (especially
Germany) may be responsible for their different growth experiences in the 1990s. See also Lynch and Nickell (2002).
15
of the true coefficient as well as the degree of endogeneity. The endogeneity bias might be positive or negative:
Basu, Fernald, and Kimball (2006), for example, find that positive technology innovations tend to reduce inputs
on impact. As is standard, one trades off bias against precision; indeed, weak instruments could lead to both bias
and imprecision. In any case, one needs to interpret the results with caution.
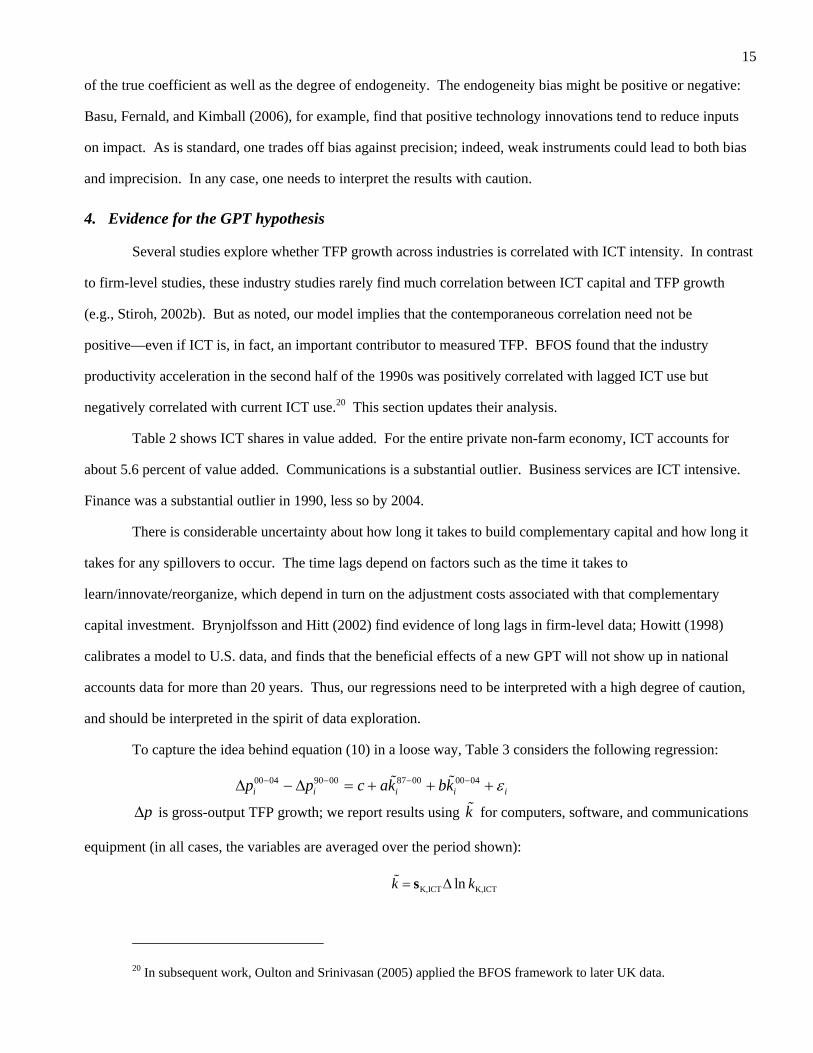
4. Evidence for the GPT hypothesis
Several studies explore whether TFP growth across industries is correlated with ICT intensity. In contrast
to firm-level studies, these industry studies rarely find much correlation between ICT capital and TFP growth
(e.g., Stiroh, 2002b). But as noted, our model implies that the contemporaneous correlation need not be
positive—even if ICT is, in fact, an important contributor to measured TFP. BFOS found that the industry
productivity acceleration in the second half of the 1990s was positively correlated with lagged ICT use but
negatively correlated with current ICT use.20 This section updates their analysis.
Table 2 shows ICT shares in value added. For the entire private non-farm economy, ICT accounts for
about 5.6 percent of value added. Communications is a substantial outlier. Business services are ICT intensive.
Finance was a substantial outlier in 1990, less so by 2004.
There is considerable uncertainty about how long it takes to build complementary capital and how long it
takes for any spillovers to occur. The time lags depend on factors such as the time it takes to
learn/innovate/reorganize, which depend in turn on the adjustment costs associated with that complementary
capital investment. Brynjolfsson and Hitt (2002) find evidence of long lags in firm-level data; Howitt (1998)
calibrates a model to U.S. data, and finds that the beneficial effects of a new GPT will not show up in national
accounts data for more than 20 years. Thus, our regressions need to be interpreted with a high degree of caution,
and should be interpreted in the spirit of data exploration.
To capture the idea behind equation (10) in a loose way, Table 3 considers the following regression:
00 04 90 00 87 00 00 04i i i i ip p c ak bk ε− − − −Δ − Δ = + + +
pΔ is gross-output TFP growth; we report results using k for computers, software, and communications
equipment (in all cases, the variables are averaged over the period shown):
K,ICT K,ICTlnk k= Δs
20 In subsequent work, Oulton and Srinivasan (2005) applied the BFOS framework to later UK data.

16
,K ICTs is the share of computers and software in gross output (using value-added shares instead makes
little qualitative difference to results). This measure of k drops the relative price terms from the alternatives
discussed; BFOS found that results appeared more stable with this measure than when the relative price terms
appeared, although qualitative results were generally similar.
Thus, we regress the acceleration in the 2000s, relative to the late 1990s, on k for the 1990s, and on k
for the 2000s. Using the acceleration partially controls for differences in underlying growth rates across sectors.21
(Separating out k for the early and late 1990s led to multicolinearity problems—i.e., coefficients on the 1990s
regressors were statistically insignificant although in magnitude they remained similar to the combined coefficient
a; the coefficient b was not (much) affected.) A virtue of the specification is that it imposes relatively minimal
restrictions on lags and on coefficient stability, since the period averaging smoothes through some of that.
Nevertheless, there is no reason to expect that the relationship will work equally well when applies to all time
periods, since the link between ICT and unobserved intangible investment that we highlight in the model could
easily vary over time and over industries. We also throw out ICT-producing industries, since they are such
enormous outliers in the productivity dimension. (When we include the ICT-producing industries, results overall
and within manufacturing are qualitatively similar but are very sensitive to outliers. Non-manufacturing is not, of
course, affected.)
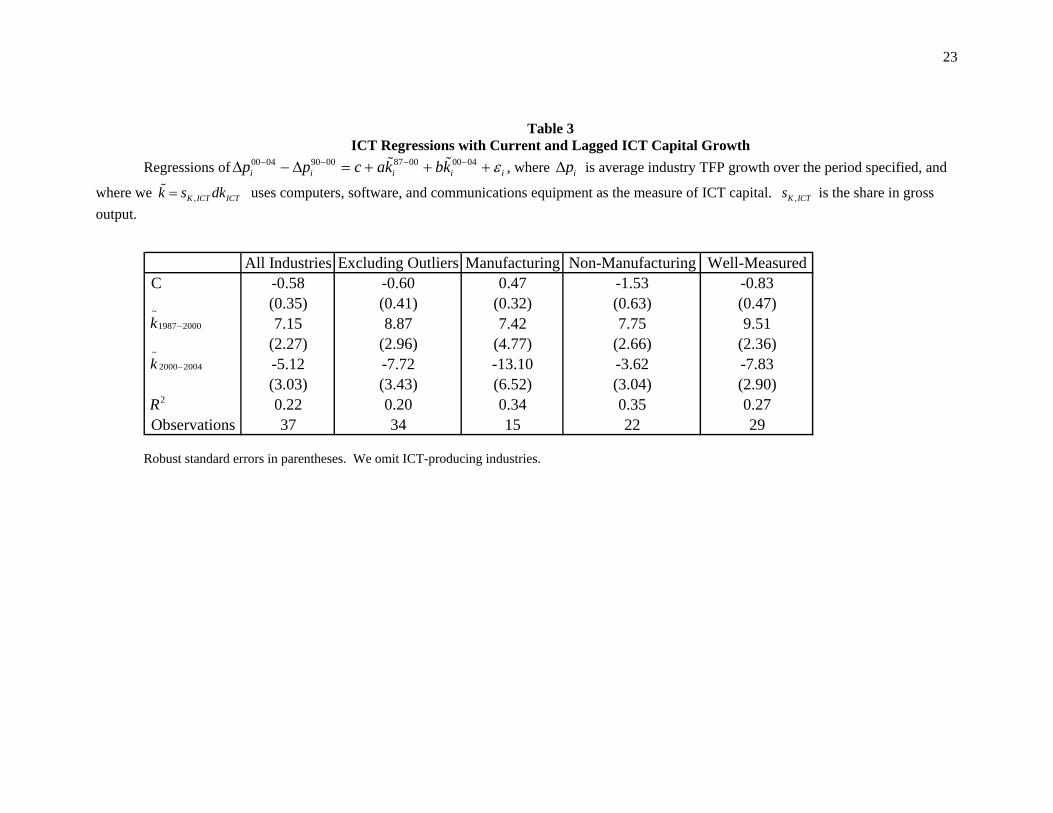
Table 3 shows that with long lags, ICT capital growth is positively associated with the industry TFP
acceleration; but after controlling for past values, contemporaneous ICT capital growth is negatively associated
with the acceleration. That is, 87 00ik − enters positively but 00 04
ik − enters negatively. Thus, the productivity
acceleration in the 2000s is somewhat consistent with the predictions of the theory section.
These results are robust to outliers. We identified influential observations (based on the Belsley-Kuh-
Welsch ‘hat matrix’ test). 22 When we omit those industries, in the second column, the standard errors go up, but
so do the coefficients. We run the regression separately for manufacturing and non-manufacturing, and the
qualitative conclusions remain. In manufacturing, the current growth rate is particularly negative; in non-
21 A better way to do so would be a panel regression, since the model is inherently driven by time-series
considerations. The panel setup would impose, however, that the dynamics were constant over time, which might not be the case. In any case, we have so far done only preliminary explorations in the panel dimension.
22 One standard statistical test is to look at the diagonal of the ‘hat’ matrix, X’(X’X)-1X’.For a regression with k coefficients and n observations, Belsley, Kuh, and Welsch (1980) identify influential observations as those where the diagonal element of the hat matrix exceeds 2k/n.

17
manufacturing, the lagged growth rate is a bit more positive. When we look only at “well-measured” industries
(basically, manufacturing plus a subset of non-manufacturing, as discussed in the appendix), the magnitude and
significance of the coefficients remains substantial.
These regression results are certainly preliminary and tentative. But they suggest that we can relate
productivity growth to relatively current as well as lagged ICT investment in the cross section. Given that we are
running an OLS regression, we cannot, of course, necessarily infer causation from the results. But the results are
broadly consistent with the notion that ICT investments affect measured productivity growth with a long (and
possibly variable) lag. Contemporaneously, they are correlated with a lot of diverted resources towards
unmeasured complementary investment, and hence—once one controls for lagged growth rates—they are
negatively correlated with output.
5. Conclusions
Even though ICT seems to be the major locus of innovation in the past decade, the TFP acceleration in the
United States since the mid-1990s has been broadbased. We reconcile these observations by emphasizing the role
of the complementary investments/innovations that ICT induces in firms that use it. We thus link the literature on
ICT as a general purpose technology with the literature on intangible capital. To the extent that there is
unmeasured intangible output and unmeasured intangible capital, conventional TFP growth is a biased measure of
true technical change. This GPT view suggests that productivity slowdowns and speedups might reflect the
dynamics associated with complementary investment.
A fundamental difficulty, of course, is that complementary investment and capital are unmeasured. We
presented a simple theoretical framework that observed ICT capital intensity and growth should serve as
reasonable proxies. In line with this GPT view, the U.S. industry data suggest that ICT capital growth is
associated with industry TFP accelerations with long lags of 5 to 15 years. Indeed, controlling for past growth in
ICT capital, contemporaneous growth in ICT capital is negatively associated with the recent TFP acceleration
across industries. More work remains to be done to explore the robustness of the theoretical framework—for
example, allowing for different production functions for intangible investment and for final output—and for
extending the empirical work. For example, we have not exploited the panel nature of the theory, nor have we
explored the importance of the relative price of intangible capital. But we encouraged by the preliminary results
that link aggregate and industry-level U.S. TFP performance in the 2000s to both the persuasive macro models of
GPTs and to the stimulating micro empirical work that supports the GPT hypothesis.

18
Bibliography
Bakhshi, H., Oulton, N. and J. Thompson. (2003). Modelling investment when relative prices are trending: theory
and evidence for the United Kingdom. Bank of England Working Paper 189. Basu, S. and J. G. Fernald. (2001). Why is productivity procyclical? Why do we care?” In New Developments in
Productivity Analysis, edited by C. Hulten, E. Dean, and M. Harper,. Cambridge, MA: National Bureau of Economic Research.
Basu, S., J.G. Fernald, and Miles Kimball (2006). Are technology improvements contractionary? American
Economic Review, Dec. Basu, S., J.G. Fernald, N. Oulton, and S. Srinivasan (2003). “The case of the missing productivity growth.”
NBER Macroeconomics Annual 2003, M. Gertler and K. Rogoff, eds. Cambridge, MA: MIT Press. Basu, S., J. G. Fernald, and Matthew D. Shapiro. (2001). Productivity growth in the 1990s: Technology,
utilization, or adjustment? Carnegie-Rochester Conference Series on Public Policy 55:117-165. Basu, S. and M. Kimball. (1997). Cyclical Productivity with unobserved input variation. Cambridge, MA:
National Bureau of Economic Research. NBER Working Paper 5915 (December). Belsley, D., E. Kuh, and R. Welsch. (1980). Regression Diagnostics: Identifying Influential Data and Sources of
Collinearity. New York: John Wiley and Sons. Bloom, N., R. Sadun and J. van Reenen (2005). It ain't what you do it's the way that you do I.T. - Testing
explanations of productivity growth using U.S. transplants. Unpublished, London School of Economics. Bosworth, B. P. and J. E. Triplett. (2006). Is the 21st Century Productivity Expansion Still in Services? And What
Should Be Done about It? Manuscript (July). Bresnahan, T. F. (undated). The mechanisms of information technology’s contribution to economic growth.
Prepared for presentation at the Saint-Gobain Centre for Economic Research. Bresnahan, T. F. and M. Trajtenberg. (1995). General purpose technologies: ‘Engines of growth?’ Journal of
Econometrics 65(Special Issue, January):83-108. Bresnahan, Timothy, E. Brynjolfsson and L. M. Hitt (2002). "Information Technology, Workplace Organization
and the Demand for Skilled Labor: Firm-level Evidence," Quarterly Journal of Economics, 117(1): 339-376.
Brynjolfsson, E. and L. M. Hitt. (2000). Beyond computation: Information technology, organizational
transformation and business performance. Journal of Economic Perspectives 14(4):23-48. Brynjolfsson, E. and L. M. Hitt. (2003). Computing productivity: Firm-level evidence, MIT Working Paper 4210-
01. Brynjolfsson, E. and S. Yang. (2001). Intangible assets and growth accounting: Evidence from computer
investments. Manuscript. Caselli, F. (1999). Technological revolutions. American Economic Review 89(March).

19
Chandler, A. D. Jr. (1977). The Visible Hand. Cambridge: Harvard University Press. Corrado, Carol, Paul Lengermann, Eric J. Bartelsman, and J. Joseph Beaulieu (2006). Modeling aggregate
productivity at a disaggregate level: New results for U.S. sectors and industries. Manuscript. Corrado, Carol, Charles Hulten, and Dan Sichel (2006). Intangible capital and economic growth. NBER working
paper 11948 (January). David, P. A. and G. Wright. (1999). General purpose technologies and surges in productivity: Historical
reflections on the future of the ICT revolution. Manuscript. Greenwood, J. and M. Yorokoglu. (1997). 1974. Carnegie-Rochester Conference Series on Public Policy 46:49-
95. Griliches, Z. (1994). Productivity, R&D, and the data constraint. American Economic Review 84(1):1-23. Hall, R. E. (2001). The stock market and capital accumulation. American Economic Review 91(December):1185-
1202. Helpman, E. (ed). (1998). General Purpose Technologies and Economic Growth. Cambridge: MIT Press, 1998. Helpman, E. and M. Trajtenberg. (1998). Diffusion of general purpose technologies. In General Purpose
Technologies and Economic Growth, edited by E. Helpman. Cambridge: MIT Press. Hobijn, B. and B. Jovanovic. (2001). The information-technology revolution and the stock market: evidence.
American Economic Review 91(December):1203-1220. Hornstein, A. and P. Krusell. (1996). Can technology improvements cause productivity slowdowns? In NBER
Macroeconomics Annual edited by Bernanke and Rotemberg. Cambridge, MA: National Bureau of Economic Research.
Howitt, P. (1998). Measurement, obsolescence, and general purpose technologies. In General purpose
technologies and economic growth, edited by E. Helpman. Cambridge and London: MIT Press. Hulten, Charles (1978). Growth accounting with intermediate inputs. Review of Economic Studies 45 (October):
511-518. Inklaar, Robert and Marcel P. Timmer (2006). Of yeast and mushrooms: Patterns of industry-level productivity
growth. University of Groningen, Mimeo, August. Inklaar, Robert, Marcel P. Timmer and Bart van Ark (2006). Mind the gap! International comparisons of
productivity in services and goods production. University of Groningen, Mimeo, August. Jorgenson, D. W. (2001). Information technology and the U.S. economy. American Economic Review 91(March):
1-32. Jorgenson, D.W., Mun Ho, and Kevin Stiroh (2006). The Sources of the Second Surge of U.S. Productivity and
Implications for the Future. Manuscript. Jovanovic, B. and P. L. Rousseau. (2003). Mergers as Reallocation. Unpublished, NYU, February. Krueger, D. and K. Kumar. (2003). US-Europe differences in technology adoption and growth: The role of
education and other policies. Manuscript prepared for the Carnegie-Rochester Conference, April 2003.

20
Laitner, J. and D. Stolyarov. (2001). Technological change and the stock market. Manuscript, University of
Michigan. Lynch, L. and S. Nickell. (2001). Rising productivity and falling unemployment: can the US experience be
sustained and replicated?” In The Roaring Nineties, edited by A. Krueger and R. Solow. New York: Russell Sage Foundation.
Nordhaus, W.D. (2002). Productivity Growth and the New Economy. Brookings Papers on Economic Activity 2. Oliner, S.D. and D E. Sichel. (2000). The resurgence of growth in the late 1990s: Is information technology the
story? Journal of Economic Perspectives 14(Fall):3-22. Oliner, S.D. and D E. Sichel. (2006). Unpublished update to Oliner and Sichel (2000). September. Oulton, N. (1995). Supply side reform and UK economic growth: what happened to the miracle? National
Institute Economic Review 154(November):53-70. Oulton, N. (2001a). Must the growth rate decline? Baumol’s unbalanced growth revisited. Oxford Economic
Papers 53:605-627. Oulton, N. and S. Srinivasan (2005). Productivity Growth and the Role of ICT in the United Kingdom: An
Industry View, 1970-2000, Centre for Economic Performance discussion paper 0681, LSE. Shapiro, M. (1986). The dynamic demand for capital and labor. Quarterly Journal of Economics Stiroh, K. J. (2002a). Information technology and the U.S. productivity revival: what do the industry data say?
American Economic Review 92(5):1559-1576. Stiroh, K.J. (2002b) Are ICT Spillovers Driving the New Economy? Review of Income and Wealth, Series 48,
No. 1, March 2002 Stiroh, K. J. (2006). The Industry Origins of the Second Surge of U.S. Productivity Growth, Federal Reserve
Bank of New York, Mimeo, July 2006. Stiroh, K. J. and Matthew Botsch (2006). Information Technology and Productivity Growth in the 2000s. Federal
Reserve Bank of New York, Mimeo, August 2006. Tevlin, S. and Whelan, K. (2000). Explaining the Investment Boom of the 1990s. Journal of Money, Credit and
Banking (forthcoming). Triplett, J.E. and B.P. Bosworth (2006). ‘Baumol’s Disease’ has been cured: IT and multifactor productivity in
U.S. services industries. In Dennis W. Jansen, ed., The new economy. How new? How resilient? Wang, J. C., S. Basu and J. G. Fernald (2004). A General-Equilibrium Asset-Pricing Approach to the
Measurement of Nominal and Real Bank Output. FRB Boston Series, paper no. 04-7. .

21
Table 1
U.S.: Total Factor Productivity by Industry in Private Non-Farm Business, 1987-2004 (percent change, annual rate)
Intermediate InputShare of Gross Output (%) Nom. VA (%)
1987-1995 1995-2000 2000-2004 1995-2000 2000-2004 1987-2004 1987-2004Private Non-Farm Economy(NOT adjusted for labor quality) 0.96 1.43 2.21 0.47 0.79 49.5 100.0
Mining 3.45 -0.37 -3.13 -3.82 -2.76 49.1 1.5Manufacturing 2.07 3.81 4.09 1.74 0.28 66.4 19.1 Nondurables 0.70 -0.16 2.17 -0.86 2.33 69.8 8.0 Durables 3.06 6.51 5.50 3.45 -1.01 63.5 11.1Construction 0.00 -2.89 -1.00 -2.90 1.89 49.3 5.4Transportation 2.31 1.43 2.82 -0.88 1.39 51.5 3.5Communication2 2.92 -0.47 5.75 -3.39 6.23 46.4 3.3Utilities 2.04 1.04 1.15 -1.01 0.11 41.9 2.9Information 1.95 0.60 6.33 -1.35 5.74 48.7 5.3Wholesale Trade 1.87 4.28 4.25 2.41 -0.03 36.8 7.7Retail Trade 2.48 4.52 4.48 2.03 -0.03 37.3 8.7Finance & Insurance 0.50 2.30 2.21 1.81 -0.09 43.6 8.6 Finance 0.27 2.84 3.88 2.57 1.04 39.5 5.8 Insurance 0.88 0.11 -1.63 -0.78 -1.74 50.4 2.8Business Services & Real Estate 0.42 -1.10 2.17 -1.52 3.27 40.4 12.8 Business Services 0.19 -1.28 3.64 -1.47 4.93 34.9 5.1 Real Estate 0.98 -0.41 1.05 -1.39 1.46 44.5 7.7Other Services3 -0.70 -0.03 0.16 0.67 0.20 40.1 26.3
ICT producing4 6.84 14.85 9.39 8.00 -5.45 61.0 4.3Non-ICT producing 0.68 0.81 1.98 0.13 1.17 48.8 95.7Well-Measured Ind.5 2.18 3.51 3.58 1.33 0.07 56.7 43.7Well-Measured (excluding ICT producing) 1.66 2.21 3.08 0.55 0.87 56.1 39.4Poorly-Measured Ind.6 -0.07 -0.17 1.31 -0.10 1.48 42.2 56.3
Value-Added TFP Growth1 Acceleration
1. Value-added TFP growth is defined as (gross output TFP growth)/(1-share of intermediate inputs). Implicitly, this uses the Tornquist index of value added for a sector. 2. Communication includes “broadcasting and telecommunications” (NAICS code 513) from the information industry aggregate. 3. Other services includes NAICS codes 61-62, 71-72, and 81, as well as the non-communications elements of “information “(NAICS code 51, excluding 513). 4. ICT-producing industries includes machinery, computer and electronic products, and electrical equipment, appliances, and components. 5. Well measured industries include mining, manufacturing, transportation, utilities, and wholesale and retail trade. 6. Poorly-measured industries include construction, information, finance and insurance, real estate and rental and leasing, professional and business services, etc

22
Table 2 U.S.: Computer, Software, and Communication Shares of Value-Added Revenue
(percent)
Computer Software Communication Total ICT Computer Software Communication Total ICTPrivate Non-Farm Economy 1.22 1.00 1.29 4.91 1.00 2.18 1.34 5.55
Mining 0.25 0.22 0.29 1.62 0.23 1.15 0.13 2.58Manufacturing 1.08 0.93 0.44 3.60 0.62 2.73 0.29 4.83 Nondurables 0.88 0.75 0.33 3.70 0.71 2.67 0.32 5.54 Durables 1.23 1.07 0.52 3.52 0.56 2.78 0.27 4.32Construction 0.06 0.05 0.02 0.20 0.27 1.22 0.55 2.38Transportation 0.11 0.10 1.13 1.44 0.56 1.39 2.58 4.73Communication1 1.27 1.12 24.03 26.89 2.56 4.56 20.60 28.05Utilities 1.30 1.13 1.87 6.91 0.77 3.54 0.73 6.61Information 2.33 2.19 15.62 21.16 1.95 5.24 13.05 20.62Wholesale Trade 1.47 0.44 0.63 4.21 1.39 1.06 1.15 4.20Retail Trade 0.94 0.34 0.36 2.10 0.60 0.56 0.52 1.94Finance & Insurance 3.14 3.14 0.73 8.71 1.89 2.29 0.35 5.07 Finance 4.56 3.74 0.97 11.63 2.31 2.08 0.40 5.44 Insurance 0.51 2.02 0.31 3.35 0.88 2.81 0.24 4.19Business Services & Real Estate 2.03 1.02 0.68 4.28 1.75 2.06 1.07 5.21 Business Services 1.24 2.33 0.85 5.36 1.51 4.25 1.66 7.94 Real Estate 2.51 0.20 0.57 3.62 1.92 0.49 0.65 3.25Other Services2 1.02 1.32 3.44 5.17 0.94 3.17 3.01 5.93
ICT producing3 1.41 1.29 0.91 4.52 0.61 3.30 0.26 4.87Non-ICT producing 1.21 0.99 1.31 4.93 1.01 2.14 1.38 5.57Well-Measured Ind.4 1.02 0.65 0.60 3.38 0.75 1.79 0.72 4.07Well-Measured (excluding ICT producing) 0.98 0.58 0.56 3.25 0.76 1.67 0.75 4.00Poorly-Measured Ind.5 1.39 1.30 1.88 6.20 1.16 2.42 1.74 6.49
1990 2004
1. Communication includes “broadcasting and telecommunications” (NAICS code 513) from the information industry aggregate. 2. Other services includes NAICS codes 61-62, 71-72, and 81, as well as the non-communications elements of “information “(NAICS code 51, excluding 513). 3. ICT-producing industries includes machinery, computer and electronic products, and electrical equipment, appliances, and components. 4. Well measured industries include mining, manufacturing, transportation, utilities, and wholesale and retail trade. 5. Poorly-measured industries include construction, information, finance and insurance, real estate and rental and leasing, professional and business services, etc Source: Authors’ calculations using payments to ICT capital from BLS and nominal value added from BEA.
23
Table 3 ICT Regressions with Current and Lagged ICT Capital Growth
Regressions of 00 04 90 00 87 00 00 04i i i i ip p c ak bk ε− − − −Δ − Δ = + + + , where ipΔ is average industry TFP growth over the period specified, and
where we ,K ICT ICTk s dk= uses computers, software, and communications equipment as the measure of ICT capital. ,K ICTs is the share in gross output.
All Industries Excluding Outliers Manufacturing Non-Manufacturing Well-Measured C -0.58 -0.60 0.47 -1.53 -0.83
(0.35) (0.41) (0.32) (0.63) (0.47)7.15 8.87 7.42 7.75 9.51
(2.27) (2.96) (4.77) (2.66) (2.36)-5.12 -7.72 -13.10 -3.62 -7.83(3.03) (3.43) (6.52) (3.04) (2.90)0.22 0.20 0.34 0.35 0.27
Observations 37 34 15 22 29
~
1987 2000k −
~
2000 2004k −
2R
Robust standard errors in parentheses. We omit ICT-producing industries.
24
Appendix: Further description of industries23
The BEA publishes GDP-by-industry data for 61 private industries shown in the first column of the appendix table. To focus on private non-farm industries, we first remove Farms (NAICS 111-112) and Forestry, Fishing and Related Activities (NAICS 113-115).
Next, we sum up the BEA data for Motor Vehicles, Bodies and Trailers, and Parts (NAICS 3361- 3363) and Other Transportation Equipment (NAICS 3364-3366, 3369) because the BLS capital data that we use has data only on their aggregate.
When we calculated TFP by disaggregated industry, we discovered that many sub-categories of larger service industries had quite large fluctuations from year-to-year—with offsetting fluctuations in other, closely related sub-categories. This could reflect differences in NAICS industry classifications across our data sources. We chain-aggregated these industries into broader aggregates, as indicated in the table. This 40-industry data set comprises three ICT-producing industries and 37 non-ICT-producing industries.
The table also shows other classifications used in the paper.
23 David Thipphavong contributed to the writing of this appendix.

25
Industry Lists Used in Regressions
Industry Name NAICS 1997 CodeICT
Prod.Non-ICT
Prod.Well-
MeasuredPoorly
Measured Manu. Non-Manu.
Farms 111-112Forestry, Fishing, and Related Activities 113-115Oil and Gas Extraction 211 X X XMining, except Oil and Gas 212 X X XSupport Activities for Mining 213 X X XUtilities 22 X X XConstruction 23 X X XWood Products 321 X X XNonmetallic Mineral Products 327 X X XPrimary Metal Products 331 X X XFabricated Metal Products 332 X X XMachinery 333 XComputer and Electronic Products 334 XElectrical Equipment, Appliances, and Components 335 XTransportation Equipment 336 X X X Motor Vehicles, Bodies and Trailers, and Parts 3361-3363 Other Transportation Equipment 3364-3366, 3369Furniture and Related Products 337 X X XMiscellaneous Manufacturing 339 X X XFood, Beverage, and Tobacco Products 311-312 X X XTextile Mills and Textile Product Mills 313-314 X X XApparel and Leather and Allied Products 315-316 X X XPaper Products 322 X X XPrinting and Related Support Activities 323 X X XPetroleum and Coal Products 324 X X XChemical Products 325 X X XPlastic and Rubber Products 326 X X XWholesale Trade 42 X X XRetail trade 44, 45 X X XAir Transportation 481 X X XRail Transportation 482 X X XWater Transportation 483 X X XTruck Transportation 484 X X XTransit and Ground Passenger Transportation 485 X X XPipeline Transportation 486 X X XOther Transportation and Support Activities 487, 488, 492 X X XWarehousing and Storage 493 X X XInformation 51 X X X Publishing Industries 511 Motion Picture and Sound Recording Industries 512 Broadcasting and Telecommunications 513 Information and Data Processing Services 514Finance and Insurance 52 X X X Fed. Res. Banks, Credit Intermed., and Rel. Activities 521-522 Securities, Commodity Contracts, and Investments 523 Insurance Carriers and Related Activities 524 Funds, Trusts, and Other Financial Vehicles 525Real Estate and Rental and Leasing 53 X X X Real Estate 531 Rental and Leasing Srvces and Lessors of Intang. Assets 532-533Professional and Business Services 54-56 X X X Legal Services 5411 Computer Systems Design and Related Services 5415 Misc. Professional, Scientific, and Technical Services 5412-5414, 5416-5419 Management of Companies and Enterprises 55 Administrative and Support Services 561 Waste Management and Remediation Services 562Educational Services, Health Care, and Social Assistance 61-62 X X X Educational Services 61 Ambulatory Health Care Services 621 Hospitals and Nursing and Residential Care Facilities 622-623 Social Assistance 624Arts, Entertainment, Recreation, Accommodation, and Food Services 71-72 X X X Perf. Arts, Spectator Sports, Museums, and Rel. Activities 711-712 Amusements, Gambling, and Recreation Industries 713 Accommodation 721 Food Services and Drinking Places 722Other Services, except Government 81 X X X